Article Text

Abstract
Background The repetitive antigen stimulation during chronic infection often leads to the accumulation of CD8+CD57+ T cells. These cells express high levels of interferon-γ, granzyme B and perforin with elevated cytolytic effect, and are considered as the most potent cells for combating chronical viral infection. The status of CD8+CD57+ T cells in non-small cell lung cancer (NSCLC) has not been well defined.
Methods We used flow cytometry and undertook a systemic approach to examine the frequency, immunophenotyping and functional properties of CD8+CD57+ T cells in the peripheral blood, tumor tissue and the corresponding normal tissue, as well as lung draining lymph nodes, of patients with NSCLC.
Results CD57+ T cells expressed high levels of programmed cell death-1 (PD-1) in all tested compartments and were predominantly CD8+ T cells. These cells in the peripheral blood displayed a terminally differentiated phenotype as defined by loss of CD27 and CD28 while expressing KLRG1. CD8+CD57+ T cells exhibited enhanced cytotoxic potencies and impaired proliferative capability. Unlike CD57+ T cells in the peripheral blood, a significant proportion of CD57+ T cells in the primary tumors expressed CD27 and CD28. CD8+CD57+ T cells in tumors lacked cytotoxic activity. The proliferative activity of these cells was also impaired. CD8+CD57+ T cells in the corresponding normal lung tissues shared similarities with their counterparts in peripheral blood rather than their counterparts in tumors. The vast majority of CD8+CD57+ T cells in lung draining lymph nodes were positive for CD27 and CD28. These cells were unable to produce perforin and granzyme B, but their proliferative activity was preserved. CD8+CD57+ T cells in tumors displayed an inferior response to PD-1 blockade compared with their CD8+CD57- counterparts. Interleukin (IL)-15 preferentially restored the effector function of these cells. Additionally, IL-15 was able to restore the impaired proliferative activity of CD8+CD57+ T cells in tumors and peripheral blood.
Conclusions Our data indicate that the failure of the immune system to fight cancer progression could be a result of impaired CD8+ T-cell functional maturation into fully differentiated effector T cells within the tumor microenvironment. Boosting IL-15 activity might promote tumor-reactive CD8+ T-cell functional maturation while preserving their proliferative activity.
- tumor microenvironment
- CD8-positive T-lymphocytes
- cytokines
- lung neoplasms
- immune evation
This is an open access article distributed in accordance with the Creative Commons Attribution Non Commercial (CC BY-NC 4.0) license, which permits others to distribute, remix, adapt, build upon this work non-commercially, and license their derivative works on different terms, provided the original work is properly cited, appropriate credit is given, any changes made indicated, and the use is non-commercial. See http://creativecommons.org/licenses/by-nc/4.0/.
Statistics from Altmetric.com
Introduction
The presence of CD8+ tumor-infiltrating lymphocytes (TIL) usually confers an improved prognosis in non-small cell lung cancer (NSCLC),1 but more often these CD8+ TIL become dysfunctional, express high levels of programmed cell death-1 (PD-1), and ultimately fail to mount responses to eradicate tumors. Several studies have shown that blocking the PD-1 pathway reinvigorates the cytotoxic immune function of exhausted CD8+ TILs.2 However, substantial tumor-reactive PD-1-expressing CD8+ T cells do not enter a state of exhaustion and remain unresponsive to PD-1 blockade.3–5
The repetitive antigen stimulation during chronic infection with several pathologies such as HIV and cytomegalovirus (CMV) could lead to the accumulation of CD8+CD57+ T cells.6 These cells are considered to be the most potent ones for combating chronical viral infection because they highly express interferon (IFN)-γ, granzyme B and perforin with elevated cytolytic effect.7–9 The CD57 antigen along with decreased CD27 and CD28, and increased KLGR1, is referred as terminally differentiated T cells. These cells display high cytotoxic activity, but limited proliferation capacities in response to T-cell receptor (TCR) stimulation.10 11
The role of CD8+CD57+ T cells in retraining tumor growth has not been fully defined. Several studies have reported that an elevated percentage of CD8+CD57+ T cells in blood from patients with gastric carcinoma, melanoma and renal cell carcinoma is associated with inferior overall survival.12–14 However, CD8+CD57+ T cells in oral squamous cell carcinoma display potent antitumor effector function and are associated with improved clinical outcomes.15 A subset of incompletely differentiated CD8+ T cells co-expressing CD27, CD28 and CD57 has been identified in metastatic melanoma. These cells are able to proliferate and to produce IFN-γ and other Th2 cytokines in response to TCR and CD28 stimulation in vitro.16
CD57+ T cells have been reported to be presented in NSCLC.17 18 However, up to now, little is known about the immune function and phenotypic properties of CD8+CD57+ T cells in NSCLC. In this study, we undertook a systemic approach to examine the frequency, immunophenotyping and effector function of CD8+CD57+ T cells isolated from peripheral blood, primary tumors, corresponding normal lung tissues and lung regional lymph nodes. In addition, we examined the responsiveness of tumor-infiltrating CD8+CD57+ T cells to PD-1 blockade. We also tested the ability of IL-15 to promote the effector function of tumor-infiltrating CD8+CD57+ T cells.
Materials and methods
Study participants and sample collection
Peripheral blood samples and tumor specimens were collected from 73 patients, who were diagnosed with NSCLC and underwent pulmonary resection between November 2015 and July 2019, in the Department of Thoracic Surgery at Tongji Hospital. Peripheral blood samples were obtained before the primary tumor resection. Primary tumor, peritumoral normal lung tissues and lymph nodes were obtained during the surgery. Interlobar lymph nodes were obtained from patients with NSCLC and were confirmed to be tumor-free by the pathologists. The tumor, node and metastasis staging was determined according to the 2010 American Joint Committee on Cancer staging guidelines. Patients who had been previously treated with radiation, chemotherapy or immunotherapy before operation, or had autoimmune disease, infectious diseases were excluded. For age-matched healthy donors, peripheral blood samples were obtained when they underwent the standardized physical examination.
Isolation of lymphocytes
Peripheral blood mononuclear cells (PBMC) were isolated from EDTA-K2 anticoagulated blood by Ficoll-Paque Medium (GE Healthcare, Uppsala, Sweden) using density gradient-centrifugation. The fresh tumor samples or normal lung tissues were manually cut into 3–5 mm2 fragments, ground and filtered through a 70 µm strainer, followed by centrifugation over a two-step gradient of 40% and 70% Percoll (GE Healthcare, Uppsala, Sweden). Lymphocytes were collected between the two layers. Lymph nodes were gently minced through 70 µm strainer and collected in sterile tube containing culture medium.
Cell culture and T-cell stimulation in vitro
P815 cells were cultured in RPMI 1640 medium (GE Healthcare) supplemented with 10% fetal calf serum (Gibco) and 1% penicillin/streptomycin (Hyclone). For assessment of IFN-γ production by CD8+ T cells, lymphocytes (5×10⁵ cells/well, 96-well plate) were cultured alone or with 50 ng/mL phorbol-12-myristate-13-acetate (PMA) (Sigma-Aldrich, St Louis, MO) plus 250 ng/mL ionomycin (IM, EMD Millipore, Billerica, Massachusetts, USA) for 4 hours. Alternatively, lymphocytes (5×10⁵ cells/well, 96-well plate) were cultured alone or treated with 1 µg/mL CD3 mAb (BD Bioscience, HIT-3a, San Diego, California, USA) plus 0.5 µg/mL CD28 mAb (R&D, clone 37407, Bergisch Gladbach, Germany) for 24 hours. Monensin (BD Bioscience) was added 4 hours prior to collecting cells for intracellular IFN-γ staining. For IFN-γ production with PD-1 blockade assay, lymphocytes were pretreated with 10 µg/mL PD-1 neutralization antibody (eBioscience, clone eBioJ105, San Diego, California, USA) at 37°C for 30 min. Subsequently, additional anti-CD3 and anti-CD28 monoclonal antibodies (mAbs) were added to the cell cultures. Lymphocytes were cultured with IL-15 (Novus, NBP2-35020, Centennial, Colorado, USA) alone at the final concentration of 0.1–10 ng/mL.
Flow cytometry
For cell surface staining, PBMC or TIL (0.5×10⁶ cells/sample) were stained with the indicated mAbs at 4°C. Subsequently, cells were fixed with eBioscience IC Fixation Buffer. For intracellular staining, PBMC or TIL (1×10⁶ cells/sample) were surface stained with the indicated antibodies and subsequently fixed and permeabilized using FoxP3/Transcription Factor Staining Buffer Kit (eBioscience). The information on antibodies for surface and intracellular staining is provided in online supplementary table 1. Flow cytometric analysis was performed on FACS LSR II (BD Biosciences) or Attune NxT (ThermoFisher Scientific, Wyman Street, Waltham, Massachusetts, USA). Dead cells were excluded by using Fixable Viability Dye eFluo 780 (eBioscience). Clumps and doublets were removed by gating dot plots of pulse area versus pulse height. Data were analyzed using FlowJo software V10 (TreeStar, Ashland, Oregon, USA). The experimental design and staining panels are shown in online supplementary figure S1A.
Supplemental material
Supplemental material
Purification of CD8+ T-cell subsets
CD8+CD57+ and CD8+ CD57- T cells were separated in a two-step positive selection procedure using CD8+CD57+ T Cell Isolation Kit according to the manufacturer’s instructions (Miltenyi Biotec). Briefly, CD8+ cells were first magnetically labeled with CD8 MultiSort Microbeads and isolated by positive selection. After releasing the magnetic particle, the CD8+CD57+ T-cell population was magnetically labeled with CD57 MicroBeads to be positively selected and the CD8+CD57- T-cell population was collected by negative selection. Both the CD8+CD57+ cells and CD8+CD57- T-cell populations were CD3+CD8+ T cells (>97%). The purified CD8+CD57- T-cell population was almost all negative for CD57 (>97%). CD57+ cells were enriched in the CD8+CD57+ T-cell population (>50%).
Cytotoxic T-cell assay
Magnetic sorted cells were assayed for cytotoxic ability by using a flow cytometry-based method in a redirected assay. Fc receptor-positive P815 mastocytoma cells (Cobioer Biosciences, Nanjing, China) were labeled with 1 µM carboxyfluorescein diacetate succinimidyl ester (CFSE) (BD Bioscience) for 15 min at 37°C, then the cells were coated with 2 µg/mL CD3 mAb for 30 min at 37°C. The sorted cells were incubated with P815 target cells at 5:1 ratio for 4 hours, and subsequently, the cells were collected and intracellularly stained for cleaved caspase-3 (Cell Signaling Technology). The extent of the caspase-3 cleavage in the target P815 cells was analyzed by flow cytometry.
CFSE-based cell proliferation assay
Lymphocytes (1×10⁶ cells/mL) were incubated with 4 µM CFSE at 37°C or 10 min. Cells were washed and subsequently, stimulated with 0.5 µg/mL CD3 mAb and 0.25 µg/mL CD28 mAb for 72 hours. Unstimulated PBMC were included as control. Cells were collected and CFSE signal was measured by flow cytometry.
Assay for T lymphocytes apoptosis
Assay for reactivity to annexin V in apoptotic cells was performed using commercial reagents (BD Bioscience) according to the manufacturer’s instructions. After staining the cells with PE-annexin V and 7-amino-actinomycin, the cells were analyzed on a flow cytometer immediately.
Statistical analysis
GraphPad Prism V.8.0 (GraphPad Software) was used for graphing and statistical analysis. Data in bar graphs are presented as means±SD. A two-tailed paired or unpaired Student’s t-test and one way or two-way analysis of variance was performed where appropriate to determine the significance of differences between groups. The statistical significance threshold was set at p<0.05.
Results
The frequency of PD-1-expressing CD57+ T cells is elevated in the peripheral blood of patients with NSCLC compared with age-matched healthy donors
High expression of PD-1 on T cells is considered as a biomarker to identify tumor-reactive T cells in TIL and PBMC.19 20 A substantially increased percentage of PD-1-expressing CD3+ T cells was observed in PBMC of patients with NSCLC relative to healthy donors (17.99%±8.36% vs 10.76%±4.13%, p<0.05; online supplementary figure S1B,C). CD57 is expressed by heterogeneous populations of memory and differentiated effector T cells.21 22 We found that among total CD3+ T cells in PBMC the frequency of CD57+ T cells was slightly but significantly increased in patients with NSCLC compared with age-matched healthy donors (19.04%±10.53% vs 13.8%±8.85%, p<0.05; figure 1A). Moreover, PD-1-expressing cells were more frequent in CD57+ T cells than in their CD57- counterparts (31.17%±18.30% vs 17.89%±9.26%, p<0.001; figure 1B). Of note, in healthy donors the proportion of PD-1+ cells in CD57+ T cells was not different from that in CD57- T cells (15.27%±12.33% vs 12.00%±5.71%; online supplementary figure S1D), suggesting that an increased proportion of PD-1+ cells within the CD3+CD57+ T-cell population is NSCLC-related. Indeed, the percentage of CD57+PD-1+ T cells in PBMC was significantly elevated in patients with NSCLC compared with that in age-matched healthy donors (figure 1C).

The frequency of programmed cell death-1 (PD-1)-expressing CD57+ T cells is elevated in the peripheral blood of patients with non-small cell lung cancer (NSCLC) compared with age-matched healthy donors. Peripheral blood mononuclear cells (PBMC) isolated from healthy donors (HD) and patients with NSCLC were analyzed for their expression of CD3, CD57 and PD-1. (A) The percentage of CD57+ cells among CD3+ T cells from PBMC of patients with NSCLC (n=73) and age-matched HD (n=17). (B) PD-1 expression on CD57- and CD57+ T-cell subsets from PBMC of patients with NSCLC (n=22). (C) The percentage of PD-1-expressing CD57+ T cells in the peripheral blood of HD (n=10) and patients with NSCLC (n=22). (D) The percentage of CD57+ T cells in the peripheral blood and paired matched tumor specimens (n=73). (E) PD-1 expression on CD57- and their CD57+ T-cell counterparts from tumor specimens (n=22). (F) Expression of CD4 and CD8 on CD57+ T cells from the peripheral blood and tumor specimens. Data are shown as mean±SD. Statistical significance was determined by using Student’s t-test for A and C, paired Student’s t-test for B, D and E. *p<0.05, **p<0.01, ***p<0.001.
The percentage of CD57+ T cells in CD3+ TIL was lower than that observed in PBMC (15.10%±7.74% vs 19.04%±10.53%, p<0.01; online supplementary figure S1E and figure 1D). The majority of CD3+ TIL expressed PD-1. Detailed analysis showed that PD-1+ cells were more frequent in the CD57+ T-cell subset than those in pair-matched CD57- counterparts (75.69%±12.21% vs 59.75%±19.64%, p=0.0001; figure 1E). The vast majority of CD3+CD57+ T cells from both PBMC and TIL were CD8+ T cells (figure 1F).
We investigated whether the frequency of CD57+ T cells is associated with the clinical characteristics of patients with NSCLC. We collected blood samples and tumor specimens from a total of 73 patients with NSCLC. We found that the frequency of CD57+ cells among CD3+ T cells neither in PBMC nor in TIL correlated with the histological subtypes of NSCLC (online supplementary figure S1F,G). The frequency of CD57+ cells was not associated with the staging of NSCLC and other clinical features (online supplementary tables 2,3).
Supplemental material
Supplemental material
CD57+ T cells from primary tumors are phenotypically distinct from their counterparts in peripheral blood
We aimed to further define the phenotypic profile of CD57+ T cells in NSCLC. First, we tested whether CD57+ T cells co-express well-documented biomarkers, namely 2B4, CD160, LAG-3 and Tim-3, which are associated with the T-cell exhaustion (Tex) state.23 A substantial proportion of CD57+ T cells from PBMC and TIL expressed 2B4 but not CD160 (online supplementary figure S2A,B). The frequency of LAG-3-expressing T cells in PBMC was very low. An increased frequency of LAG-3-expressing cells within CD57- T-cell subset was observed in TIL with an average of 5%. LAG-3-expresing cells were more frequent in CD57+ T cells than in their CD57- counterparts but did not reach statistical significance (online supplementary figure S2C). Intracellular staining with anti-LAG-3 antibody was also performed, and similar results were obtained (online supplementary figure S2D). A positive control for LAG-3 was also included to exclude any technical issues affecting the detection of LAG-3. T cells isolated from PBMC stimulated with anti-CD3 and anti-CD28 mAbs for 3 days, and subsequently, LAG-3 expression was measured by surface staining using the exact anti-LAG3 antibody. As expected, a significant proportion of LAG-3+ T cells were detected (online supplementary figure S2E). Tim-3 was not expressed by CD57- nor CD57+ T cells from both PBMC and TIL (online supplementary figure S2F). Collectively, the data show that CD57+ T cells are phenotypically distinct from the traditionally defined Tex cells.
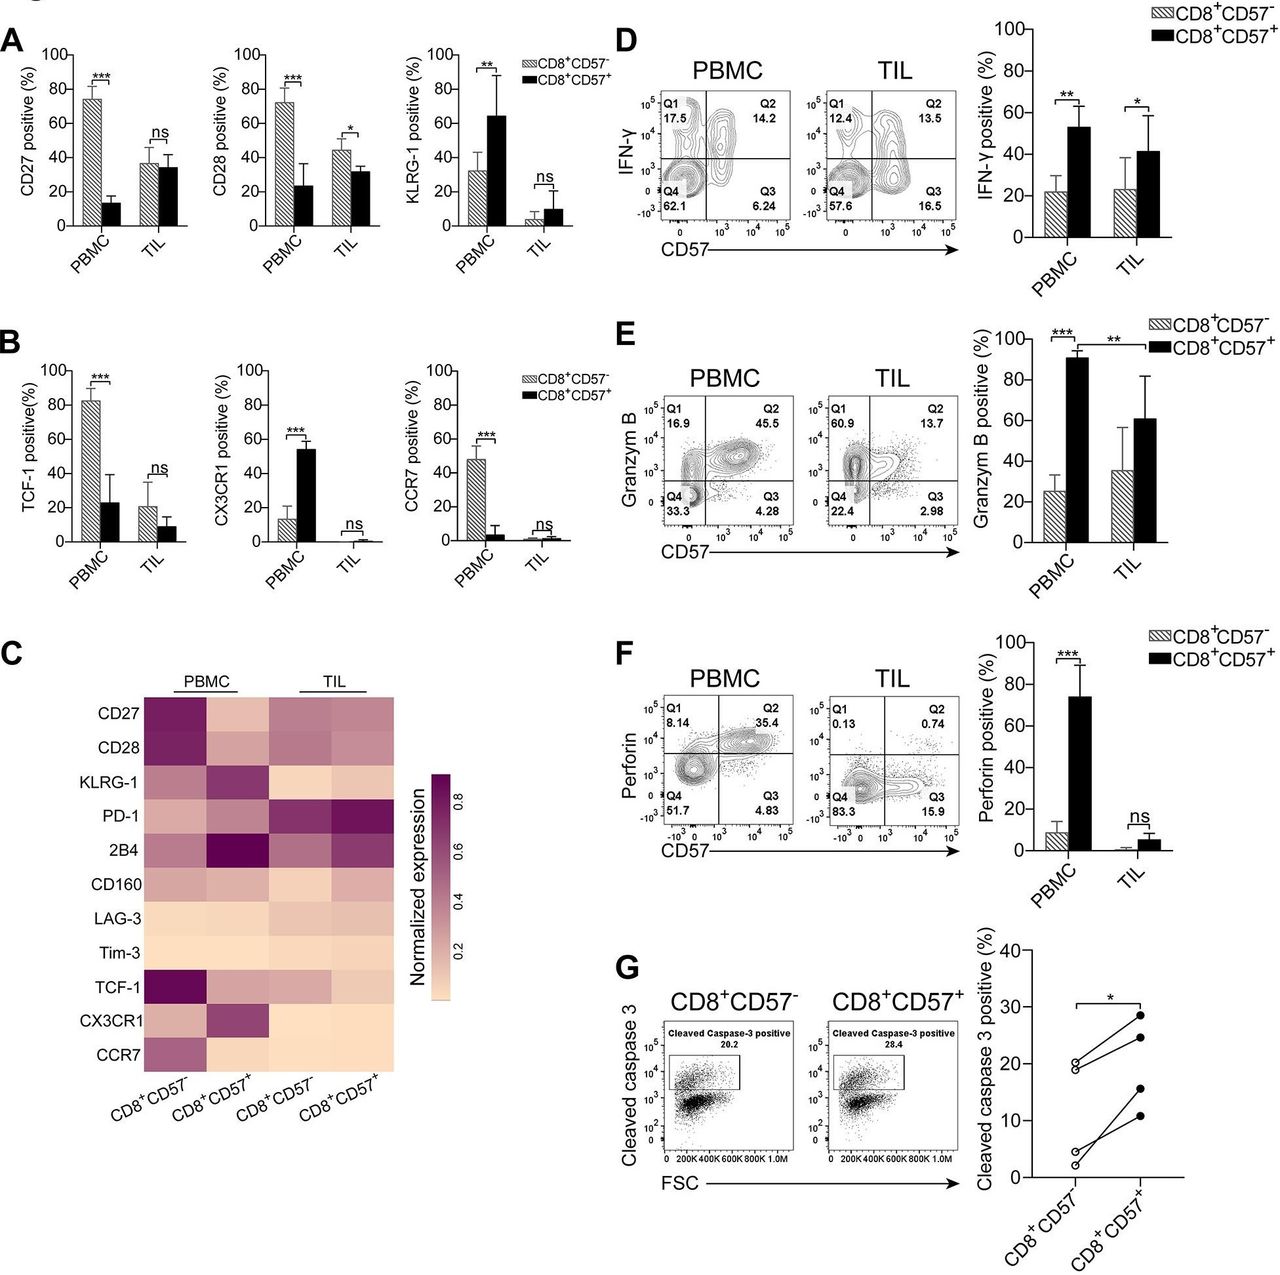
The CD57 antigen, along with CD27, CD28 and KLGR1 is used to distinguish T cells of distinct differentiation stages.10 A vast majority of CD57+ T cells from PBMC were negative for CD27 and CD28 (figure 2A,B). The majority of CD57+ T cells expressed KLRG1 (figure 2C). Moreover, most of CD57+ T cells from PBMC lacked T-cell factor 1 (TCF-1) expression (figure 2D). The results strongly suggest that the majority of CD57+ T cells from PBMC are terminally differentiated T cells. The expression patterns of CD27, CD28 and KLRG1 on CD57+ T cells from TIL were different from those cells in PBMC. A significantly increased proportion of CD27+ and CD28+ cells within CD57+ TIL was observed compared with those cells from PBMC (figure 2A,B). There were few KLGR1-expressing cells in TIL regardless of the CD57 expression status (figure 2C). Interestingly, the CD57+ T cells from the corresponding normal lung tissues were negative for CD27 and CD28 expression (online supplementary figure S2G). Similar to their counterparts in PBMC, the majority of CD57+ T cells expressed KLRG1 (online supplementary figure S2H). Most of CD57+ T cells in the peripheral blood expressed the tissue-homing marker CX3CR1 (67.42%±11.56%) (figure 2E) but not lymphoid-homing marker CCR7 (5.45%±4.45%) (figure 2F), suggesting that CD57+ T cells are poised to migrate toward non-lymphoid tissues.

Phenotypic features of CD57+ T cells in peripheral blood and primary tumors. Freshly isolated peripheral blood mononuclear cells (PBMC) and tumor-infiltrating lymphocytes (TIL) were stained with the indicated fluorescent-conjugated antibodies to assess the phenotypical properties of CD57+ T cells. The CD3+ cells were gated for further analysis (A–C). The representative flow cytometry contour plots and statistic diagram show the expression of T-cell differentiation-associated markers CD27 (A) (n=9), CD28 (B) (n=9) and KLRG-1 (C) (n=4) on CD57+ T cells vs CD57- T cells. (D) T-cell factor 1 (TCF-1) expression was determined by intracellularly stained with anti-TCF-1 antibody (n=6). The representative contour plots and the statistic diagram show the expression of CX3CR1 (E) and CCR7 (F) on CD57+ and CD57- T cells (n=3). The data are shown as the mean±SD. Statistical significance was determined by using two-way analysis of variance (ANOVA) for A–C. Paired Student’s t-test was used for D–F. ns, no statistic difference. *p<0.05, **p<0.01, ***p<0.001.
CD8+CD57+ T cells from peripheral blood but not primary tumors display enhanced cytotoxic potencies
Given that the vast majority of CD57+ T cells from both PBMCs and TIL express CD8 (figure 1F), and CD8+ T cells play a central role in antitumor immune responses and in immunotherapies, the focus of this study was to assess the immune and functional properties of CD8+CD57+ T cells in NSCLC. The immune phenotype of CD8+CD57+ T cells was analyzed. As shown in figure 3A,B and online supplementary figure S3A, the phenotypic profiles of CD8+CD57+ T cells from PBMC and TIL were consistent with those observed in CD3+CD57+ T cells (Figure 2 and online supplementary figure S2). The molecular signatures related to the state of cell differentiation, exhaustion and migration in CD8+CD57+ T cells versus CD8+CD57- T cells were visualized in a heat-map (figure 3C). CD8+CD57+ T cells in PBMC displayed a significantly different immune profile from that in CD8+CD57- T cells. The majority of CD8+CD57+ T cells in PBMCs were terminally differentiated as demonstrated by the loss of CD27 and CD28 while obtaining KLRG1 expression. However, the immune profile of CD8+CD57+ T cells from TIL was not dramatically different from that of CD8+CD57- T cells. Next, we investigated the immune function of CD8+CD57+ T cells. As IFN-γ is the key cytokine produced by antigen-experienced CD8+ T cells, we assessed its IFN-γ production by stimulating the cells with a combination of PMA and IM. Freshly isolated CD8+ T cells from both PBMC and TIL did not express IFN-γ as determined by directly intracellular staining with anti-IFN-γ antibody (online supplementary figure S3B). A significant fraction of cells from PBMC and TIL produced IFN-γ on stimulation with PMA/IM (figure 3D). IFN-γ-positive cells were more frequent in the CD8+CD57+ T-cell subset than in CD57- counterparts from PBMC as well as TIL (48.19%±0.22% vs 22.19±9.24% in PBMC, 41.14%±20.77% vs 25.17%±17.85% in TIL).

CD8+CD57+ T cells from the peripheral blood but not primary tumors display enhanced cytotoxic potencies. Lymphocytes isolated from the peripheral blood and tumor specimens were stained with fluorescent-conjugated antibodies against the indicated molecules. The CD8+ T cells were gated for subsequent analysis. (A, B) Differentiation-associated and migration-associated phenotypic profiles of CD8+CD57- T cells vs CD8+CD57+ T cells from peripheral blood mononuclear cells (PBMC) and tumor-infiltrating lymphocytes (TIL). (C) A heatmap showing normalized expression of indicated markers from CD8+CD57+ T and CD8+CD57- T cells in PBMC and TIL. (D) The representative flow cytometry contour plots and the statistic diagram show interferon (IFN)-γ expression by CD8+CD57+ and CD8+CD57- T cells on stimulation with phorbol-12-myristate-13-acetate (PMA)/ionomycin (IM) (n=3). (E, F) The representative flow cytometry contour plots and the statistic diagram show the expression of granzyme B (E) (n=6), perforin (F) (n=4) in CD57+ T cells and their CD57- counterparts from PBMC and TIL. (G) The cytolytic activity of CD8+CD57+ T cells was determined by a redirected cytotoxicity assay. The representative flow cytometry dot plots and the statistic diagram show cleaved caspase-3 expression in P815 target cells after cocultured with either CD8+CD57- or CD8+CD57+ T cells enriched from the peripheral blood (n=4). The data are shown as the mean±SD. Statistical significance was determined by using two-way analysis of variance (ANOVA) for A, B and D–F and paired Student’s t-test was used for G. ns, no statistical difference. *-p<0.05, **p<0.01, ***p<0.001.
We then investigated whether CD8+CD57+ T cells were also equipped with the cytotoxic molecules granzyme B and perforin. As shown in figure 3E, more than 80% of CD8+CD57+ T cells in PBMC expressed granzyme B, whereas only around 20% of CD8+CD57- T cells were stained positive for Granzyme B. The frequency of granzyme B-expressing cells in CD8+CD57+ T cells from TIL was significantly reduced compared with that in CD8+CD57+ T cells from PBMC. Similarly, the majority of CD8+CD57+ T cells from PBMC expressed perforin but only around 10% of CD8+CD57- T cells were perforin-positive cells (74.07%±15.04% vs 8.91%±5.18%). In TIL, only traces of perforin were expressed by CD8+CD57+ T cells (figure 3F). Interestingly, CD8+CD57+ T cells from the tumor-corresponding normal lung tissues expressed both perforin and granzyme B, similar to their counterparts in the peripheral blood (online supplementary figure S3C,D).
As the cytotoxic activity of CD8+ T cells is essential for an antitumor immune response, we evaluated the cytolytic capacity of CD8+CD57+ T cells in NSCLC. Cytolytic T lymphocytes (CTL) activity is determined by the detection of cleaved caspase-3 in target cells using a flow cytometry analyzer. CD8+CD57- and CD8+CD57+ T-cell subsets from PBMC or TIL were first sorted using immune-magnetic microbeads. Subsequently, enriched CD8+CD57- and CD8+CD57+ T cells were cocultured with anti-CD3 mAb-coated and CSFE-labeled P815 target cells. The number of cleaved caspase-3-positive P815 cells were higher in the target cells cocultured with CD8+CD57+ T cells compared with those cocultured with CD8+CD57- T cells from PBMC (online supplementary figure S3E and figure 3G). CD8+ T cells from TIL had very low abilities of induction of cell apoptosis even for CD8+CD57+ T cells (online supplementary figure S3F). Taken together, CD8+CD57+ T cells in PBMC but not TIL display enhanced cytotoxic potencies.
CD8+CD57+ T cells from lung regional lymph nodes exhibit phenotypic and functional similarity with their counterparts in tumors
The tumor-draining lymph node is the site in which tumor-specific CD8+ T cells are typically activated by antigen-presenting cells, and antitumor immune responses are initiated.24 We examined the status of CD8+CD57+ T cells in tumor cell-free lung draining lymph nodes. CD57-expressing cells comprised 9.3%, on average, of CD8+ T cells in the lymph nodes (range: 2.0%–25.7%; online supplementary figure S4A). Approximately 67% of CD8+CD57+ T cells expressed PD-1 (online supplementary figure S4B and figure 4A). Most of CD8+CD57+ T cells in the lymph nodes expressed CD27 and CD28 (online supplementary figure S4C, figure 4B,C). As shown in figure 4D, about 50% of CD8+CD57+ T cells from PBMC were CD45RA+ terminally differentiated effector memory cells, whereas the vast majority of CD8+CD57+ T cells from lymph nodes and TIL were effector memory cells as determined by the negative expression of CCR7 and CD45RA.
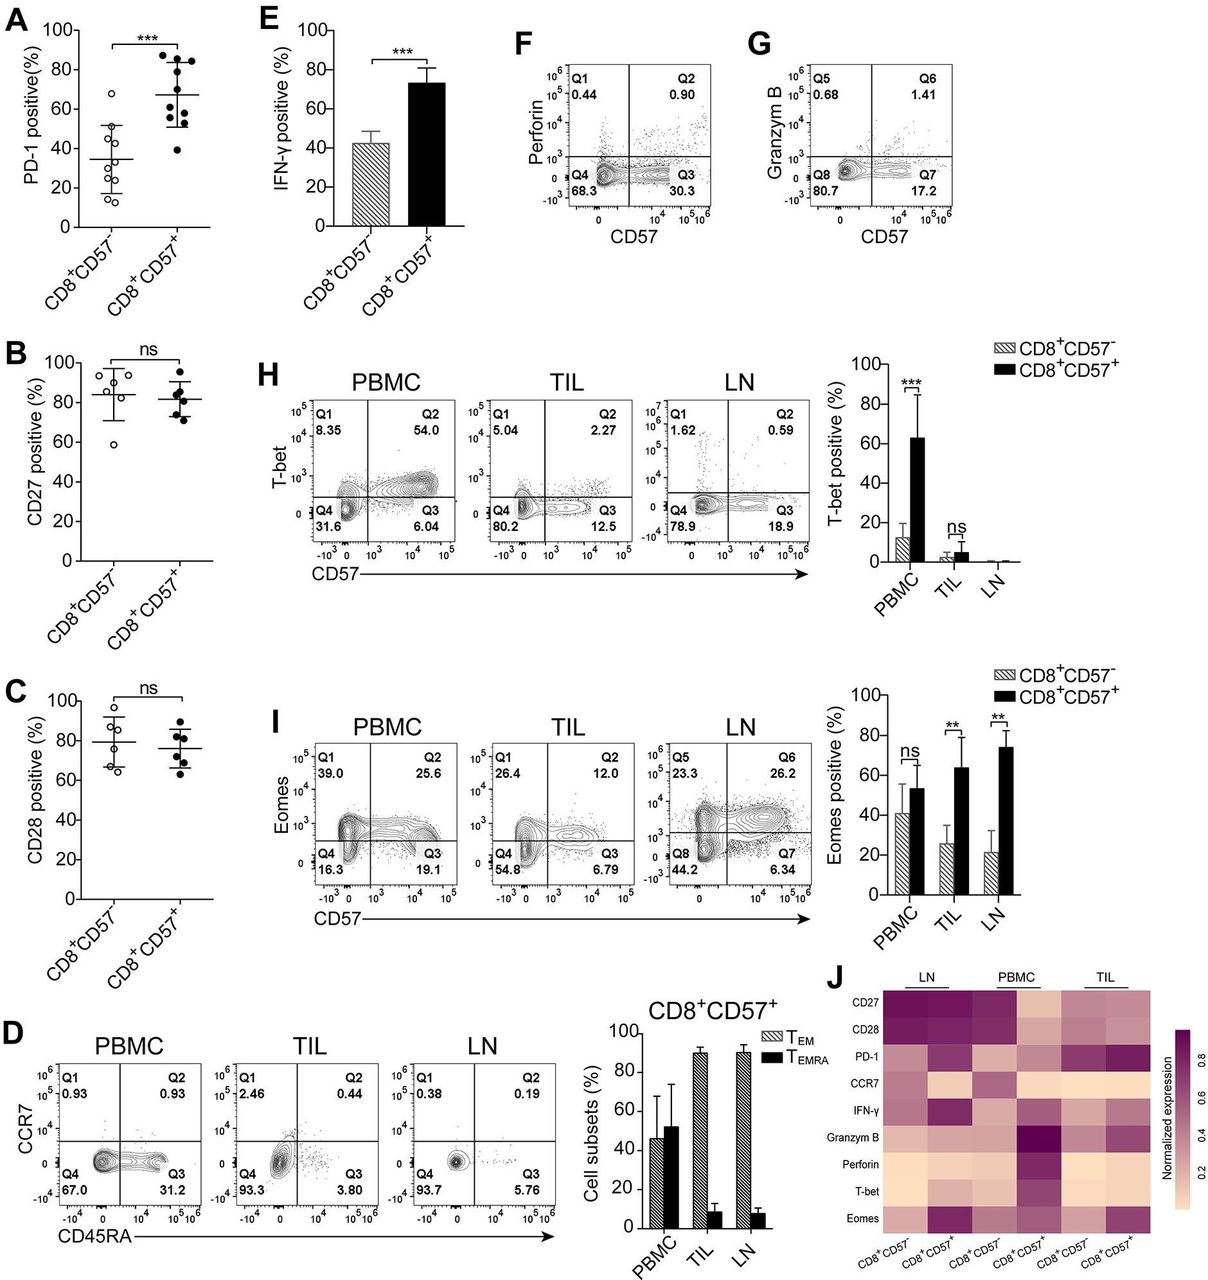
CD8+CD57+ T cells from lung regional lymph nodes exhibit phenotypic and functional similarity with their counterparts in tumors. Phenotypic and functional analysis of CD8+CD57+ T cells isolated from lung regional tumor-free lymph nodes using multicolor flow cytometry. The CD8+ cells were gated for subsequent analysis. (A) The programmed cell death-1 (PD-1) expression on CD8+CD57- and CD8+CD57+ T cells (n=10). (A, B) The statistic diagrams show the expression of CD27 (B) and CD28 (C) on CD8+CD57+ and CD57- counterparts (n=6). (D) The representative plots and the statistic diagram show the expression of CD45RA and CCR7 on CD8+CD57+ T cells obtained from three compartments, including peripheral blood, primary tumors and lymph nodes (n=3). (E) The statistic diagram show interferon (IFN)-γ production by CD8+ T cells on stimulation with phorbol-12-myristate-13-acetate (PMA) and ionomycin (IM) (n=4). (F, G) The representative contour plots of four patients show the expression of granzyme B and perforin ex vivo by CD8+CD57+ T cells. (H, I) The representative plots and the statistic diagram show the expression T-bet and Eomes in CD8+CD57+ T cells (n=5). (J) Heatmap showing normalized expression of indicated markers in CD8+CD57- and CD8+CD57+ T from lymph node, peripheral blood mononuclear cells (PBMC) and tumor-infiltrating lymphocytes (TIL). The data are shown as the mean±SD. Statistical significance was determined by using paired Student’s t-test for A–C and E, two-way analysis of variance (ANOVA) was used for D, H and I. ns, no statistical difference. **-p<0.01, ***p<0.001.
We next assessed the functionality of CD8+CD57+ T cells from lymph nodes. A substantial proportion of CD8+CD57+ T cells was able to produce IFN-γ on stimulation with a combination of PMA and IM (figure 4E), but these cells were unable to express granzyme B and perforin (figure 4F,G). The T-box transcription factors Eomes and T-bet have important and well-described roles in CD8+ T-cell activation, differentiation and memory formation.25 26 We examined the expression of T-bet and Eomes by CD8+CD57+ T cells from three compartments. More than 60% of CD8+CD57+ T cells in PBMC expressed T-bet whereas <15% of CD8+CD57- T cells were positive for T-bet. There were few T-bet-expressing CD8+ T cells from TIL and lymph nodes regardless of CD57 expression status (figure 4H). Eomes, however, was expressed by the majority of CD8+CD57+ T cells from all three tested compartments (figure 4I). Taken together, the molecular signatures related to cell differentiation, effector function and its master regulators in CD8+CD57+ T cells versus CD8+CD57- T cells from three compartments were visualized in a heatmap (figure 4J). CD8+CD57+ T cells from lymph nodes are early intermediately differentiated effector memory cells and are defective in expression of granzyme B, perforin and T-bet.
CD8+CD57+ T cells from PBMC show severely impaired proliferative capability in response to TCR stimulation
The proliferative potential of lymphocytes isolated from lymph nodes, primary tumors and peripheral blood was assessed by Ki-67 positivity. Ki-67 is a molecule associated with cellular proliferation. The expression of Ki-67 in CD8+ T cells from lymph nodes ex vivo was almost undetectable (figure 5A). Exposure of T cells to TCR/CD28 stimulation resulted in a dramatically increased proportion of Ki-67+ cells in both CD8+CD57- and CD8+CD57+ T-cell subsets. The frequency of Ki-67+ cells between these two subsets was comparable (figure 5B). Interestingly, Ki-67+CD8+ TIL was observed ex vivo, and a significantly increased percentage of Ki-67+ cells in CD8+CD57- than in CD8+CD57+ subset (figure 5C). The number of Ki-67-expressing cells in CD8+CD57+ T cells was increased following TCR stimulation compared with unstimulated cells, but to a lesser degree relative to CD8+CD57- T cells (figure 5D). Few Ki-67+ cells were observed in CD8+ T cells from PBMC ex vivo (figure 5E), while on TCR stimulation, Ki-67+ cells were dramatically increased in CD8+CD57- T cells but not in their CD57+ counterparts (66.57%±26.54% vs 22.59%±17.09%, p<0.01; figure 5F). We wondered whether CD8+CD57+ T cells are more susceptible to TCR/CD28 stimulation-induced apoptosis. Under the same cell culture condition, no obvious cell death was observed in both CD57+ and CD57- CD8+ T-cell subsets (online supplementary figure S5A,B).
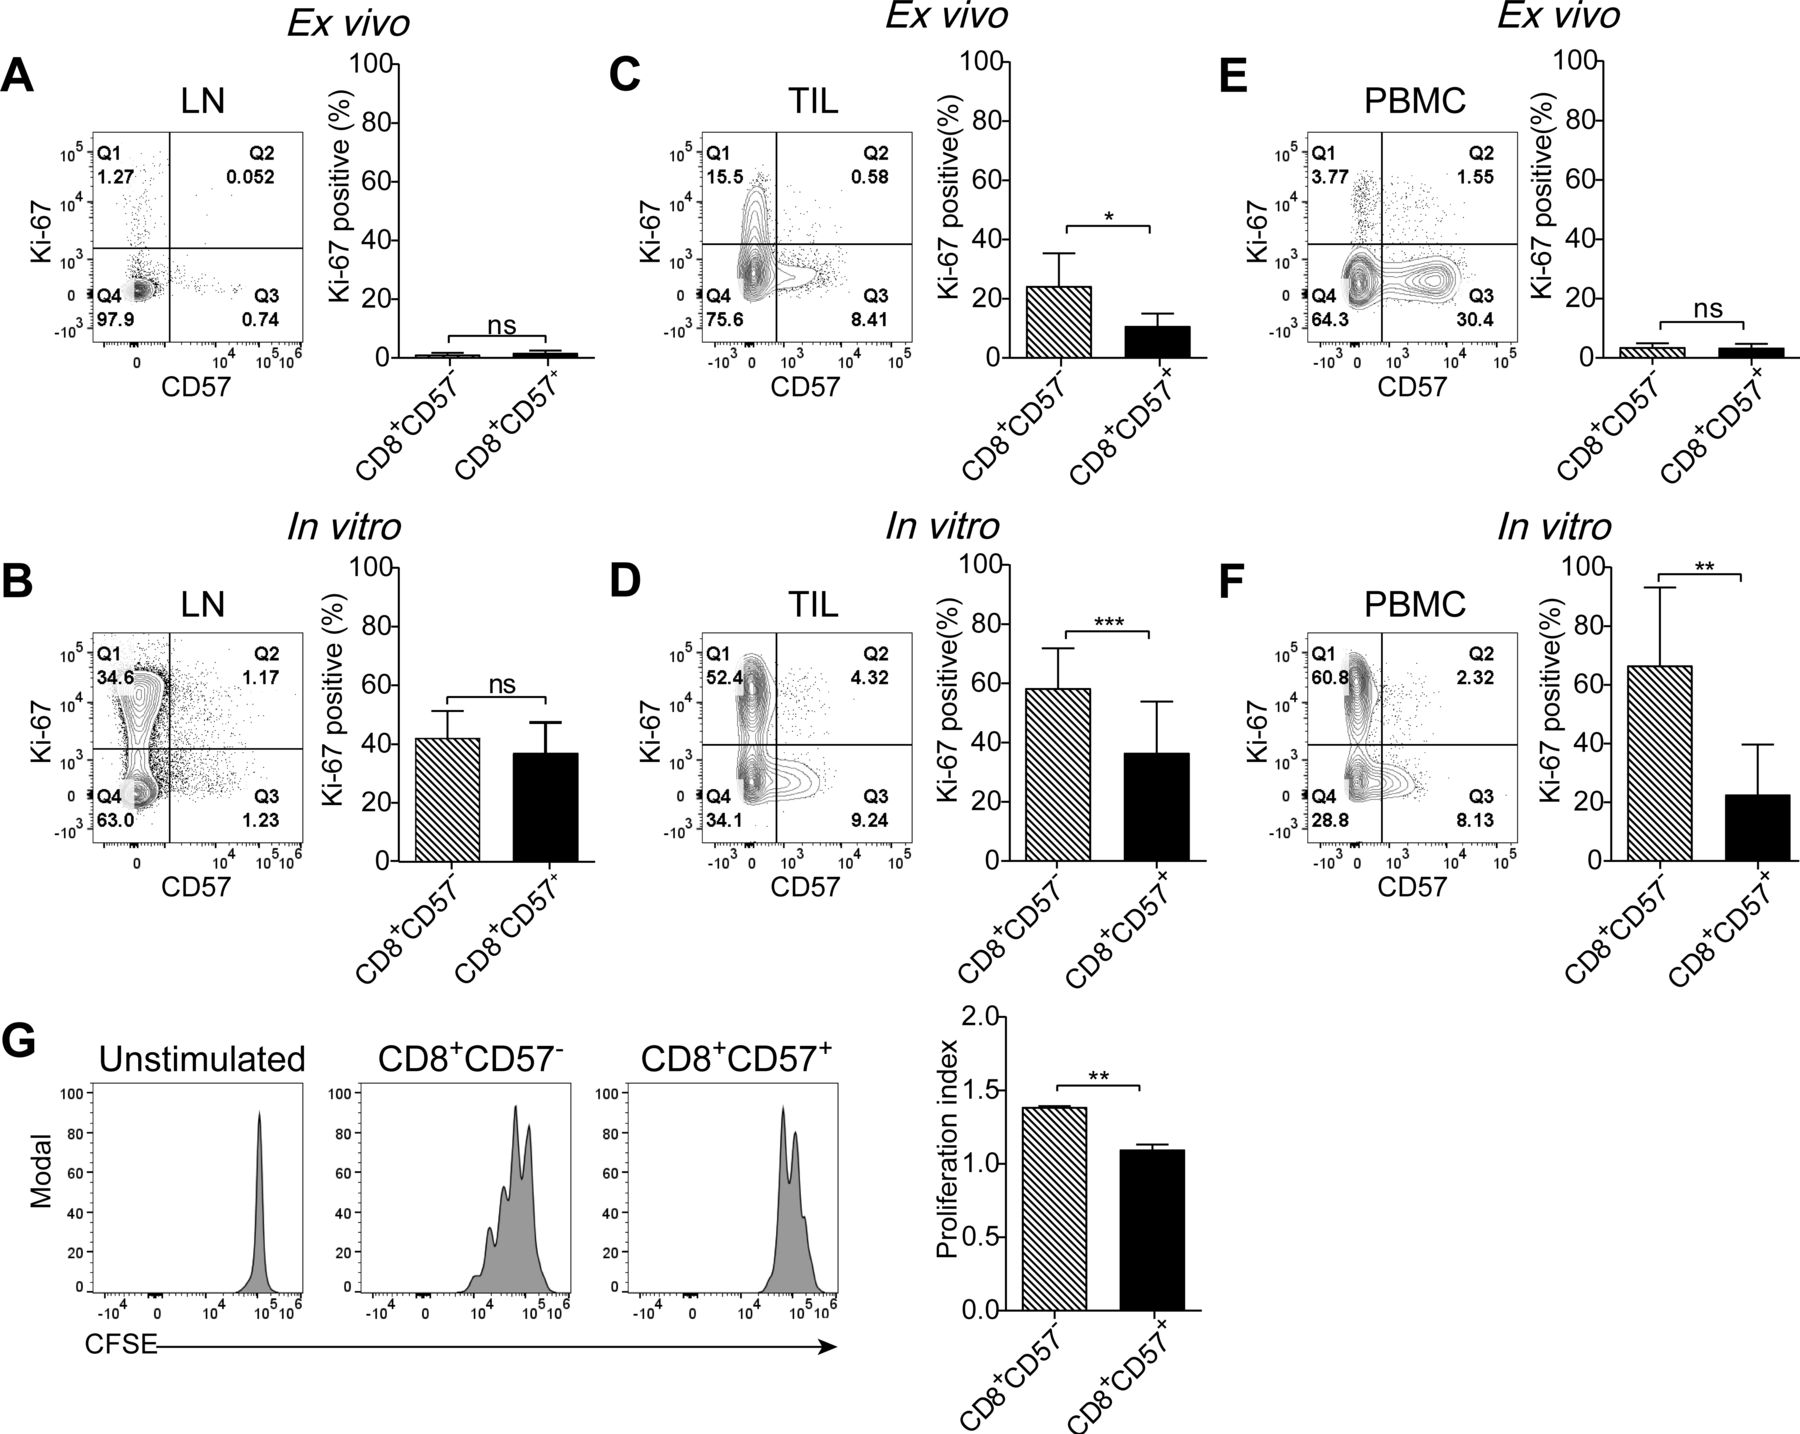
CD8+CD57+ T cells from peripheral blood mononuclear cells (PBMC) show severely impaired proliferative capability in response to T-cell receptor (TCR) stimulation. Lymphocytes isolated from the peripheral blood, tumors and lymph nodes were stained with Ki-67 ex vivo or in vitro after stimulation with aCD3 plus aCD28 monoclonal antibodies (mAbs) for 3 days. (A, B) The representative of Ki-67 expression in CD8+CD57- and CD8+CD57+ T cells from lymph nodes ex vivo (A) (n=5) and after in vitro stimulation with aCD3 and aCD28 mAbs (B) (n=3). (C, D) The representative contour plots and the statistic diagram of Ki-67 expression in CD8+CD57- and CD8+CD57+ T cells from tumor specimens ex vivo (C) (n=6) and after stimulation with aCD3 plus aCD28 mAbs for 3 days (D) (n=5). (E, F) The representative contour plots and the statistic diagram of Ki-67 expression in CD8+CD57- and CD8+CD57+ T cells from the peripheral blood ex vivo (E) (n=6) and after stimulation with aCD3 plus aCD28 mAbs for 3 days (F) (n=5). (G) The representative histogram of carboxyfluorescein diacetate succinimidyl ester (CFSE) staining. The proliferation of CD8+CD57- and CD8+CD57+ T cells on TCR stimulation was determined by the proliferation index. The data are shown as the mean±SD. Statistical significance was determined by using paired Student’s t-test for A–G. ns, no statistical difference. *-p<0.05, **p<0.01, ***p<0.001.
The Ki-67 staining might not always reflect cell proliferation. Ki-67 expression can be uncoupled from cell proliferation.27 To clarify whether the proliferative capability of CD8+CD57+ T cells is impaired on TCR stimulation, we used CFSE dilution assay to evaluate the cell cycle progression of CD8+CD57- and CD8+CD57+ T cells from PBMC. As shown in figure 5G, the average number of divisions that all responding cells have undergone since the initiation of the cell culture was significantly lower in CD8+CD57+ T cells compared with CD8+CD57- T cells. In this case, Ki-67 expression level represents the cell proliferative capability as measured by CFSE assay. Together, our results indicate that the proliferative capability of CD8+CD57+ in response to TCR stimulation is associated with the differentiation stages of CD8+ T cells. Unlike terminally differentiated CD8+CD57+ T cells from PBMC, early intermediately differentiated CD8+CD27+CD28+ T cells from pulmonary lymph nodes, despite expression of CD57, are capable of proliferation on TCR stimulation.
CD8+CD57+ T cells are deficient in IFN-γ production when engaged with TCR stimulation
Contrary to stimulation through PMA and IM (figure 3D), the ability of CD8+CD57+ T cells from TIL to produce IFN-γ was significantly compromised in response to TCR stimulation (figure 6A). This phenome was even more prominent in CD8+CD57+ T cells from PBMC (online supplementary figure S6). Several studies have shown that blocking the PD-1 pathway reinvigorates the effector function of exhausted CD8+ TIL.2 28 Although CD8+CD57+ T cells were not phenotypically associated with Tex, these cells expressed high levels of PD-1. We attempted to determine whether blocking PD-1 signaling could reinvigorate the immune function of these cells. PD-1 blockade followed by stimulation with anti-CD3 and anti-CD28 mAbs significantly facilitated IFN-γ production in CD8+CD57- T cells but not in the CD8+CD57+ T-cell subset (figure 6B). Our data imply that immune function of CD8+CD57+ TIL might not respond to PD-1 blockade effectively.

Interferon (IFN)-γ production by tumor infiltrating CD8+CD57+ T cells is impaired on T-cell receptor (TCR) stimulation. Intracellular IFN-γ was analyzed in tumor-infiltrating lymphocytes (TIL) stimulated with aCD3 and aCD28 monoclonal antibodies (mAbs) for 1 day. (A) Representative contour plots of IFN-γ expression by CD8+ TIL on TCR stimulation from three patients with non-small cell lung cancer (NSCLC). The statistic diagram of the frequency of IFN-γ-positive cells as well as IFN-γ expressing intensity in CD8+CD57- vs CD8+CD57+ T cells (n=15). (B) Representative contour plots of IFN-γ expression in three patients TIL cultured with aCD3 plus aCD28 mAbs in the presence or the absence of programmed cell death-1 (PD-1) neutralization antibody for 1 day. The statistic diagram of IFN-γ production in CD8+CD57- and CD8+CD57+ T cells are shown (n=5). Statistical significance was determined by using paired Student’s t-test for A and B. ns, no statistical difference. *p<0.05, **p<0.01.
IL-15 preferentially enhanced the effector function of tumor-derived CD8+CD57+ T cells
IL-15 is involved in promoting antitumor response among the inflammatory milieu in the tumor microenvironment.29 30 We analyzed the link between IL-15 and effector function-associated molecules using RNA-seq data from The Cancer Genome Atlas (TCGA) database, which includes 571 cases adenocarcinoma, 444 cases squamous carcinoma and 109 cases normal lung tissues. We found that the expression level of IL-15 in tumors was significantly lower than that of normal lung tissues (p<0.0001; online supplementary figure S7A), which was consistent with a previous report by Adhami et al.31 Moreover, the expression levels of IL-15 in tumor specimens were strongly correlated with T-cell effector function-associated molecules such as IFNG, GZMB and PRF1 (online supplementary figure S7B–D).
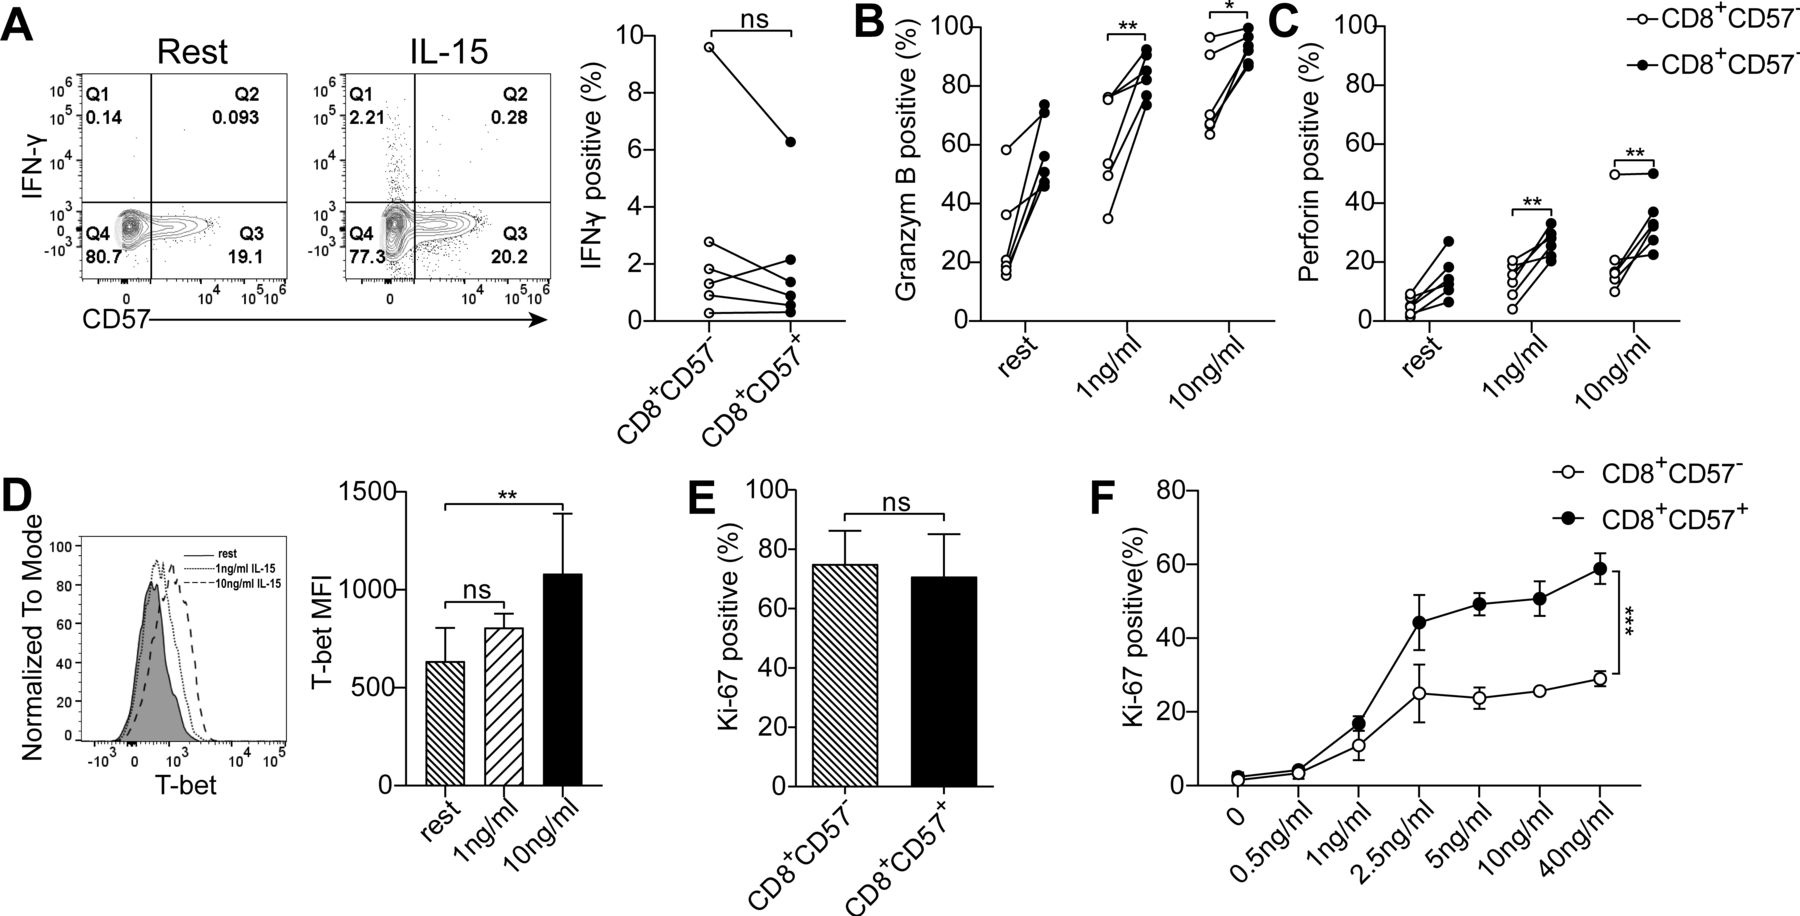
Next, we examined whether IL-15 is able to enhance effector function of CD8+CD57+ TIL. IFN-γ expression was slightly increased but not reach statistical significance on IL-15 stimulation at the concentration of 10 ng/mL (figure 7A). Administration of IL-15 was able to enhance the expression of perforin and granzyme B by CD8+ T cells in a dose-dependent manner (figure 7B,C). T-bet expression in CD8+ TIL was also significantly induced by IL-15 (figure 7D). Detailed analysis revealed that CD8+CD57+ T cells were more sensitive to IL-15-induced restoration of effector function compared with CD8+CD57- T cells. Moreover, impaired proliferation capability of CD8+CD57+ T cells from tumors and PBMC was restored by IL-15 (figure 7E). Of note, IL-15-induced Ki-67 expression in CD8+ T cells from PBMC was in a dose-dependent manner, and CD8+CD57+ T cells were preferentially responded to IL-15 compared with CD8+CD57- T cells (figure 7F).
Interleukin (IL)-15 preferentially enhances the immune function of CD8+CD57+ T cells. Isolated tumor-infiltrating lymphocytes (TIL) were treated with or without IL-15 for 1 or 3 days. (A) The representative contour plots and the statistic diagram of interferon (IFN)-γ production by CD8+CD57- and CD8+CD57+ T cells (n=6). (B, C) The statistic diagram of granzyme B and perforin expression in CD8+CD57- and CD8+CD57+ T cells in response to IL-15 stimulation at concentration of 1 and 10 ng/mL (n=6). (D) Histogram of T-bet expression in CD8+ T cells on stimulation with or without IL-15 for 3 days. The histogram represents four individual patients with non-small cell lung cancer (NSCLC). (E) Expression of Ki-67 in CD8+CD57- and CD8+CD57+ T cells from tumor specimens in response to IL-15 stimulation at 10 ng/mL (n=4). (F) Expression of Ki-67 in CD8+CD57- and CD8+CD57+ T cells from the peripheral blood stimulated with the concentration gradients of IL-15 for 3 days (n=3). The data are shown as the mean±SD. Statistical significance was determined by using paired Student’s t-test for A–C and E, one-way analysis of variance (ANOVA) was used for D and two-way ANOVA was used for F. ns, no statistical difference. *p<0.05, **p<0.01, ***p<0.001.
Discussion
In this study, we found a significantly increased frequency of PD-1-expressing CD57+ cells among total CD3+ T cells from the peripheral blood of patients with NSCLC compared with age-matched healthy donors. These cells did not co-express Tex-associated molecules such as CD160, LAG-3 and Tim-3; instead, the majority of them lost CD27 and CD28 expression, and were phenotypically considered as terminally differentiated cells. These cells expressed IFN-γ, granzyme B and perforin. CD8+CD57+ T cells from PBMC displayed enhanced effector function compared with CD8+CD57- counterparts. Kratchmarov et al have reported that TCF-1-expression cells are most enriched in CD57- effector memory cells.32 In fact, in our study, the majority of CD8+CD57+ T cells in PBMC lacked TCF-1 expression. Silencing the expression of the TCF-1 marks loss of self-renewal by determined effector cells.33 Very recent studies have shown that TCF-1 represses the development of terminal KLRG1Hi effectors while fostering KLRG1Lo Tex precursor cells.34 Taken together, the vast majority of CD8+CD57+ T cells from the peripheral blood of patients with NSCLC exhibit phenotypic and functional features of terminally differentiated effector cells and are distinct from Tex.
CD8+CD57+ T cells in lung regional lymph nodes expressed CD27 and CD28, and were negative for CCR7 and CD45RA. These cells were able to express IFN-γ but not granzyme B, and perforin, and appeared to be early-to-intermediately differentiated effector memory cells. Several studies have reported that tumor-draining lymph nodes are able to prime cells with tumor antigens but these cells have functional defects.35 36 After the priming of cancer-specific T cells in lymph nodes, these antigen-primed T cells traffic via the circulatory system. Some of these cells continuously encounter immunogenic antigens, such as those released by dying cancer cells, and that leads to the generation of terminally differentiated CD8+CD57+ T cells with potent cytotoxic activity. Interestingly, cancer-antigen primed CD8+ T cells infiltrated into the tumor microenvironment become desensitized to the antigen and are in part maintained by homeostatic cytokines.37 In addition to the lack of TCR signaling, several studies have reported that transforming growth factor-β, IL-10 and programmed death-ligand 1/PD-1 could inhibit the differentiation of CD8+ T cells toward cytotoxic terminal CTLs in patients with cancer.16 38 Therefore, the relative absence of TCR signaling and the suppressive immune factors within the tumor microenvironment may render tumor-specific T cells incapable of further differentiating into terminal effector cells. These cells are functionally incompetent and, as a consequence, fail to destroy cancer cells. Indeed, the accumulation of incompletely differentiated CD8+ T cells in metastasis melanoma leads to the uncontrolled progression of malignant cells.16
Previously, we have demonstrated that PD-1-expressing CD8+CD103+ T cells retrieved from NSCLC tumors are primed to respond to PD-1 inhibition.39 Although PD-1 was highly expressed in CD8+CD57+ T cells from TIL, the responsiveness of these cells to a PD-1 inhibitor was not superior to their CD57- counterparts. Although the T-cell intrinsic signaling pathways engaged in checkpoint blockade treatment are not well defined, it has been reported that effective immune checkpoint blockade relies on T-bet but not Eomes to induce effector function in tumor-infiltrating CD8+ T cells.40 Indeed, T-bet expression is increased in CD8+CD103+ T cells compared with CD103- counterparts.39 However, Eomes but not T-bet was expressed by a substantial proportion of CD8+CD57+ T cells in tumors. T-box transcription factors T-bet and Eomes redundantly regulate differentiation of CD8+ effector cells but they also appear to have non-redundant functions in specifying the fate of CD8+ T cells.41 42 T-bet and Eomes present a strong degree of identity of their T-box DNA-binding domains, suggesting that they bind to the same DNA motif, but the sequence identity of other portions are diverse, indicating that their interacting partners are distinct.43 T-bet is critical for CTL differentiation. Indeed, our studies showed that predominant CD8+CD57+ T cells in peripheral blood expressed T-bet. Recent studies have shown that T-bet operates in a graded manner in the formation of terminal effector cells. At high concentrations of lymphocytic choriomeningitis virus (LCMV) infection, T-bet induced expression of another transcription factor, ZEB2 expression, which then triggered CTL to adopt terminally differentiated states.44 In our study, we showed that IL-15 increased T-bet expression in tumor-infiltrating CD8+CD57+ T cells. Our results postulate that administration of IL-15 might improve the responsiveness of tumor-reactive CD8+ T cells to PD-1 inhibition.
IL-15 has been reported to preferentially enhance the immune function of effector memory CD8+ T cells in both healthy and HIV-infected individuals.45 IL-15 can also boost the proliferation of terminally differentiated T cells.46 Patients with deleted IL-15 have significantly lower density proliferating T (CD3+Ki-67+) cells and other immune subsets in colorectal cancer, and experience higher risk of tumor recurrence and reduced patient survival compared with those without IL-15 deletion.47 Tumor-infiltrating CD8+ T cells are desensitized to antigen progressively, but these cells still maintain some levels of activation and proliferating capability without TCR/ZAP70 signaling. This antigen-independent activities of TIL partly rely on IL-15.37 IL-15 could even mimic the immune response that is mediated by TCR stimulation in memory CD8+ T cells.48 In our studies, CD8+CD57+ TIL were more sensitive to IL-15-induced granzyme B and perforin expression than their CD57- counterparts. IL-15 also restored the proliferative activity of CD8+CD57+ T cells from PBMC and TIL in the absence of TCR signaling. Agonists targeting IL-15/IL15Rα have been designed to treat some cancers, and the combined therapy using IL-15 superagonist with nivolumab has also shown to re-induce responses in patients with PD-1 resistance.49 Thus, our studies provide a rationale and evidence for the possibility of targeting IL-15 to improve antitumor immunity in addition to PD-1 inhibitors to treat patients with NSCLC.
References
Footnotes
Contributors LL and WS contributed to the conception and design of the study. BH performed the majority of the experiments and supervised the experiments. RL, PW, ZY, JY and HX contributed to the experiments. NZ, QH, XF and WS contributed to the collection of tumor specimens and clinical information. BH and LL contributed to the data analysis/interpretation. BH and LL drafted the manuscript. All authors provided critical input in revising the manuscript. All authors read and approved of the manuscript.
Funding This work was supported by the National Natural Science Foundation of China (grant numbers 81672808, 81472652 and 81874168 for LL).
Competing interests None declared.
Patient consent for publication Not required.
Ethics approval and consent to participate This study was approved by the Huazhong University of Science and Technology Ethics Committee.
Provenance and peer review Not commissioned; externally peer reviewed.
Data availability statement Data are available on reasonable request. All data relevant to the study are included in the article or uploaded as supplementary information. All the data are included in this article.