Article Text

Abstract
Objectives Strategies to improve the responsiveness of programmed death-1 (PD-1)/programmed death ligand-1 (PD-L1) checkpoint blockade therapy remain an essential topic in cancer immunotherapy. In this study, we developed a new radiolabeled nanobody-based imaging probe 99mTc-MY1523 targeting PD-L1 for the enhanced therapeutic efficacy of PD-L1 blockade immunotherapy by the guidance of 99mTc-MY1523 SPECT/CT imaging.
Methods The binding affinity and specificity of nanobody MY1523 were measured in vitro. MY1523 was radiolabeled with 99mTc by a site-specific transpeptidation of Sortase-A, and the biodistribution and single photon emission CT (SPECT)/CT were performed in mice bearing different tumors. We used interferon-γ (IFN-γ) as an intervention means to establish animal models with different levels of PD-L1 expression, then investigated the ability of 99mTc-MY1523 SPECT/CT for the in vivo non-invasive measurement of PD-L1 expression in tumors. Finally, the PD-L1 blockade immunotherapies guided by 99mTc-MY1523 SPECT/CT were carried out in MC-38, A20, and 4T1 tumor-bearing mouse models, followed by the testing of tumor infiltration T cells.
Results MY1523 exhibited a high binding affinity and specificity to PD-L1 and had no competitive binding with the therapeutic antibody. 99mTc-MY1523 was prepared with high specific activity and radiochemical purity. It was found that tumor PD-L1 expression was dynamically upregulated by IFN-γ intervention in MC-38, A20, and 4T1 tumor-bearing mouse models, as indicated by 99mTc-MY1523 SPECT/CT. The PD-L1 blockade therapy initiated during the therapeutic time window determined by 99mTc-MY1523 SPECT/CT imaging significantly enhanced the therapeutic efficacy in all animal models, while the tumor growth was effectively suppressed, and the survival time of mice was evidently prolonged. A correlation between dynamically upregulated PD-L1 expression and improved PD-L1 blockade therapy effectiveness was revealed, and the markedly increased infiltration of effector T cells into tumors was verified after the imaging-guided therapy.
Conclusion Our results demonstrated that 99mTc-MY1523 SPECT/CT allowed a real-time, quantitative and dynamic mapping of PD-L1 expression in vivo, and the imaging-guided PD-L1 blockade immunotherapy significantly enhanced the therapeutic efficacy. This strategy merits translation into clinical practice for the better management of combination therapies with radiotherapy or chemotherapy.
- immunotherapy
- programmed cell death 1 receptor
- immune evation
- CD8-positive T-lymphocytes
- immunomodulation
This is an open access article distributed in accordance with the Creative Commons Attribution Non Commercial (CC BY-NC 4.0) license, which permits others to distribute, remix, adapt, build upon this work non-commercially, and license their derivative works on different terms, provided the original work is properly cited, appropriate credit is given, any changes made indicated, and the use is non-commercial. See http://creativecommons.org/licenses/by-nc/4.0/.
Statistics from Altmetric.com
- immunotherapy
- programmed cell death 1 receptor
- immune evation
- CD8-positive T-lymphocytes
- immunomodulation
Introduction
Although programmed death-1 (PD-1) or programmed death ligand-1 (PD-L1) checkpoint blockade has been a breakthrough in cancer therapy,1 2 the objective response rate in solid tumors is only 20% to 30%.3 4 Therefore, strategies to improve the responsiveness of PD-1/PD-L1 blockade therapy remain an essential topic in cancer immunotherapy.5 The interaction between PD-1 and PD-L1 inhibits the function of effector T cells and the priming of naïve T cells, leading to impaired antitumor immunity.6 7 It has been reported that PD-L1 expression is an important biomarker for guiding effector T-cell-based cancer immunotherapy.8 9
Immunohistochemistry (IHC) of tumor tissues obtained from invasive procedures such as biopsy and surgery are currently the most commonly used method to determine the PD-L1 expression levels.10 11 However, the PD-L1 expression in tumors is a dynamic process and it can be regulated by several cytokines such as interferon-γ (IFN-γ) and also by treatment strategies such as radiotherapy.12 13 Therefore, IHC cannot be used to dynamically detect changes of PD-L1 expression in clinical practice.14 15 In addition, there are no strict criteria to define the positivity or negativity of PD-L1 expression by IHC, and the PD-L1 levels determined by IHC might not represent the actual status due to the tumor heterogeneity.16 It has been reported that the predictive accuracy of IHC is generally <30%.17 18 In contrast to IHC, non-invasive imaging of PD-L1 expression in tumors can determine the PD-L1 levels in a real time, dynamic and quantitative manner, which would be beneficial to guide cancer immunotherapy.19
Recently, molecular imaging of PD-L1 expression with single photon emission CT (SPECT) and positron emission tomography (PET) based on the traditional radiolabeled antibodies, such as 111In-10B5, 89Zr-pembrolizumab, 89Zr-nivolumab, 68Ga/64Cu-DOTA-HACA-PD1 and 64Cu-PD-L1 mAb, have been investigated for preclinical and clinical applications.20–24 However, challenges remain for antibody-based imaging probes in the dynamic imaging due to slow clearance of antibodies from the blood stream and normal tissues. It usually takes 1 to 3 days for antibody-based probes to reach a favorable contrast, which hindered their wide clinical application. In contrast to intact antibody, single-domain nanobodies have much better tissue permeability and faster metabolism, resulting in high tumor contrast at much earlier time point of 1 to 2 hours post injection (p.i.).25–27 Moreover, the site-specific radiolabeling of nanobodies by a transpeptidase of Sortase-A would lead to easy quality control of reproducibility.28
In this study, we hypothesized that SPECT imaging-guided PD-L1 blockade therapy would increase the therapeutic effectiveness and tried to find an optimal time point or time interval by SPECT/CT imaging to perform the PD-L1 blockade therapy. Therefore, we developed a new radiolabeled nanobody 99mTc-MY1523 targeting PD-L1. SPECT/CT was performed in mice bearing different tumors to monitor dynamically upregulated PD-L1 expression after IFN-γ intervention. Furthermore, we also carried out therapy studies guided by 99mTc-MY1523 SPECT/CT and established a direct correlation between dynamically upregulated PD-L1 expression and improved PD-L1 blockade therapy effectiveness.
Materials and methods
Cells and animal models
MC-38 and A20 tumor cells were kindly provided by Yangxin Fu at Institute of Biophysics, Chinese Academy of Sciences (Beijing, China). The 4T1 tumor cells were purchased from the American Type Culture Collection (Manassas, Virginia, USA). Cells were cultured in Roswell Park Memorial Institute-1640 (RPMI-1640) or Dulbecco's Modified Eagle Medium (DMEM) medium with 10% fetal bovine serum in a humidified atmosphere with 5% CO2 at 37℃. Female C57/BL6 and BALB/c mice of 5 to 6 weeks age were purchased from Vital River Laboratory Animal Technology Co, Ltd (Beijing, China). To prepare syngenetic tumor models, A20 or 4T1 tumor cells (1×10⁶ cells) were inoculated subcutaneously into the right flank of BALB/c mice, and MC-38 tumor cells (1×10⁶ cells) were inoculated subcutaneously into the right flank of C57/BL6 mice.
Preparation of 99mTc-MY1523
The murine PD-L1-targeted nanobody MY1523, which has a LPETG-His6 tag on the C-terminus for both Ni-sepharose purification and site-specific transpeptidation reaction of Sortase-A, was provided by Novamab Biopharmaceuticals Co, Ltd (Shanghai, China). The two-step labeling approach was adopted for the preparation of 99mTc-MY1523. First, we prepared 99mTc-HYNIC-G4K (HYNIC=6-hydrazinonicotinyl, G4K=Gly-Gly-Gly-Gly-Lys). The mixture of 3 μg G4K(HYNIC)-OH (GL Biochem Ltd, Shanghai, China), 5 mg TPPTS (trisodium triphenylphosphine-3,3′,3″-trisulfonate, J&K Chemical Ltd, Beijing, China), 6.5 mg tricine (J&K Chemical Ltd, Beijing, China) and 74 to 96 MBq Na99mTcO4 (HTA Co, Ltd, Beijing, China) were reacted in 200 μL succinate buffer (250 mM, pH=4.8) at 99℃ for 15 min. Then, the pH of the solution was adjusted to 7 to 8 by 2M NaOH. Second, we prepared 99mTc-MY1523 by labeling MY1523 with 99mTc-HYNIC-G4K. The mixture of 74 MBq 99mTc-HYNIC-G4K, 100 μg MY1523, 50 μg Sortase-A (Detai Biologics Co, Ltd, Nanjing, China) and 10 μL CaCl2 (1M) were reacted at room temperature (RT) for 20 min. The product was purified by high-performance size exclusion chromatography (HPSEC) (Superose 12, 10×300 mm, GE Healthcare Life Science) or Superdex-75 (Increase 10/300 GL, GE Healthcare Life Science) using phosphate-buffered saline (PBS) containing 0.1% Tween-20 (pH=7.4) as the eluent, and the flow rate was 0.8 mL/min. The radiochemical purity of 99mTc-MY1523 was determined using instant thin layer chromatography-silica gel (ITLC-SG, Agilent, USA) developed in saline, then detected via a radio-TLC imaging scanner (Bioscan, AR-2000, USA). Rf values were 0.7 to 1 for Na99mTcO4 and 99mTc-HYNIC-G4K, and 0 to 0.3 for 99mTc-MY1523. The cold MY1523 was added into injection doses to obtain a specific activity of 2.7 MBq/nmol for both SPECT/CT imaging and biodistribution. The more detailed radiochemistry properties of 99mTc-HYNIC-G4K and 99mTc-MY1523 are provided in the supporting information.
PD-L1 receptor binding assays
The binding affinity and specificity of MY1523 was determined by receptor binding assay using 125I-MY1523 as the radiotracer. To prepare 125I-labeled MY1523, the mixture of MY1523 and Na125I (Perkin Elmer Inc, USA) and PBS (0.1M, pH=7.4) was reacted in a glass vial coated with 30 μg 1,3,4,6-Tetrachloro-3α,6α-diphenylglycouril (Iodo-Gen, Sigma, USA) at RT for 2 min, resulting in a product with high specific activity (~10.3 MBq/nmol) and radiolabeling yield (>95%) tested by ITLC-SG (Agilent, USA).
The PD-L1 binding assays were performed on 96-well ELISA plates coated with 0.2 μg/well recombinant murine PD-L1 (Sino Biological, Cat: 50010-M08H, China). For the saturation binding assay, a gradient of 125I-MY1523 (1 to 200 nM) were added to the plates and incubated at RT for 2 hours. For receptor competitive binding assay, a gradient of cold MY1523 or anti-PD-L1 (αPD-L1) antibody (clone: 10F.9G2, BioXcell) (0.1 to 3000 nM) was incubated with 125I-MY1523 (1 nM) at RT for 2 hours. After several washes with PBS, the plates were counted for radioactivity in each cell via an automatic γ-counter (PerkinElmer Inc, USA). The equilibrium dissociation constant (KD) and the best-fit 50% inhibitory concentration (IC50) values were analyzed using Prism V.7.0 (GraphPad Software Inc, San Diego, Canada). Experiments were performed twice with four duplicates. The binding of 99mTc-MY1523 to A20 cells were also determined, and the result is shown in the supporting information.
IFN-γ intervention
For in vitro treatment, MC-38, A20 and 4T1 tumor cells were incubated with 200 IU/mL recombinant murine IFN-γ (Peprotech, Rocky Hill, USA) in the complete medium at 37℃ for 24 hours, and then the cells were harvested, stained with PD-L1 (1 μg/mL, Cat. 12-5982-82, eBioscience) at 4℃ for 30 min and analyzed by a flow cytometer (Calibur, BD Biosciences, USA) to determine the changes of PD-L1 expression on tumor cells. For in vivo treatment, the tumor-bearing mice were injected intratumorally (i.t.) with 1000 IU IFN-γ daily for 5 days. The dynamically changed PD-L1 expression in tumors was determined by SPECT/CT imaging and verified by the flow cytometry, while the PD-L1 expression was reported as median fluorescence intensity (MFI).
Biodistribution
Biodistribution studies were performed in MC-38 tumor-bearing mice, which were injected intravenously with 190 kBq 99mTc-MY1523 and sacrificed at 1, 2 and 4 hours p.i., respectively (n=4). To verify the in vivo specificity of 99mTc-MY1523, mice in the blocking group were co-injected with 200 µg cold MY1523 and sacrificed at 2 hours p.i. Samples of blood, tumor, normal tissues and organs were harvested, weighted and counted via a γ-counter. The uptake was expressed as percentage of injected dose per gram (%ID/g).
SPECT/CT
SPECT/CT was performed in mice bearing MC-38, A20 or 4T1 tumors. The mice were injected intraveneously with 18 MBq 99mTc-MY1523, anesthetized by inhaling 1.5% isoflurane, and imaged at 2 hours p.i. (n=4) using the NanoScan SPECT/CT system (Mediso Ltd, Hungary): pinhole SPECT (peak: 140 keV, 20% width; frame time: 25 s), helical CT (50 kVp, 0.67 mA, rotation 210°, exposure time: 300 ms). SPECT and CT images were merged using the Nucline software V.2.0 (Mediso Ltd.). The regions of interest were drawn for the determination of tumor sizes (mm3) and radioactivity (Bq), then the tumor uptake was calculated as percentage injected dose per volume (%ID/cc). Immediately after SPECT scanning, the mice treated with and without IFN-γ were sacrificed to testify the tumor PD-L1 expression by flow cytometry. The linear coefficient between the tumor uptake of 99mTc-MY1523 and the PD-L1 expression (MFI) either on tumor cells or dendritic cells (DCs) was determined (n=4 for PBS group and IFN-γ group each).
Imaging-guided PD-L1 blockade therapy
Imaging-guided PD-L1 blockade therapies were performed in MC-38, A20 and 4T1 tumor models. The mice were injected i.t. with PBS or IFN-γ from day 4 after tumor cell inoculation for 5 days, and then were subjected to SPECT/CT imaging to determine the dynamic PD-L1 expression in tumors on day 8 and 12 after tumor cell inoculation. When the tumor uptake of 99mTc-MY1523 was observed to be apparently increased by SPECT/CT, the mice were injected intraperitoneally with 200 µg αPD-L1 antibody (clone: 10F.9G2, BioXcell) twice with 4 days interval, while using PBS, IFN-γ and αPD-L1 antibody 10F.9G2 without IFN-γ intervention as controls (n=5 for therapy studies, and n=8 for flow cytometry). Tumor sizes were measured twice a week and calculated as volumes (mm3)=length×width×height/2. Mice were sacrificed when tumor size was greater than 1200 mm3.
To analyze tumor infiltration of T cells, the mice were sacrificed and tumors were excised for flow cytometry, while the mice in PBS group and IFN-γ group were sacrificed on day 8 and 16 after tumor cell inoculation, as well as the mice in αPD-L1 antibody groups with and without IFN-γ intervention were sacrificed on day 16 and 35 after tumor cell inoculation (n=4 at each time point), respectively. The results were shown as the percentage of CD8+ or CD4+ T cells in digested tumor cells. We also determined the Treg cells in tumors as well as the activated effector T cells in tumor draining lymph nodes, and the information is provided in the supporting information.
Flow cytometry
The tumor tissues were diced and digested in PBS containing 1 mg/mL collagenase-IV (Worthington Bio, Lakewood, USA), 0.1 mg/mL DNase-I (Roche, Mannheim, Germany) and 2% fetal bovine serum at 37℃ for 1 to 2 hours. Single cell suspension was obtained through 80 mesh-sized cell sieve. To block Fc receptor on immune cells, the cells were incubated with CD16/32 (10 μg/mL, clone 2.4G2, BioXcell) at 4℃ for 10 min before staining. To analyze PD-L1 expression on tumor cells (CD45− for MC-38 and 4T1 tumor cells, and CD19+ for A20 tumor cells) and DCs (CD45+CD11c+MHCII+), the cells were incubated with CD45 (1 µg/mL, Cat. 56-0451-82, eBioscience), CD19 (1 µg/mL, Cat. 115512, Biolegend), CD11c (1 µg/mL, Cat. 15-0114-82), MHC-II (1 µg/mL, Cat. 25-5321-82, eBioscience) and PD-L1 (1 µg/mL, Cat. 12-5982-82, eBioscience) antibodies at 4℃ for 30 min. To analyze tumor infiltration numbers of CD8+ T cells (CD45+CD3e+CD8+) and CD4+T cells (CD45+CD3e+CD4+), the cells were incubated with CD45 (1 µg/mL), CD3e (1 µg/mL, Cat. 25-0031-82, eBioscience), CD4 (1 µg/mL, Cat. 45-0042-82, eBioscience) and CD8a (2.5 µg/mL, Cat. 11-0081-82, eBioscience) antibodies at 4℃ for 30 min. Samples were analyzed via a FACS Calibur (BD Biosciences, USA) or Gallios (Beckman Coulter, USA) flow cytometer.
Immunofluorescence staining
Frozen sections of MC-38 tumor (10 µm) were fixed by 4% paraformaldehyde and blocked with 5% bovine serum albumin in PBS. MY1523 (10 µg/mL) and rabbit anti-murine PD-L1 antibody (1:100, Abcam, Cat. ab80276) were first incubated with the tumor sections at 4°C overnight. Then, Dylight 650 conjugated mouse anti-His6-tag IgG (1:500, Abcam, Cat. ab117504) and Dylight-488 conjugated goat-anti-rabbit IgG (1:500, Abbkine, Cat. A23220) were incubated at RT for 2 hours. For nucleus staining, DAPI (20 ug/mL) was stained for 5 min. The immunofluorescence images were captured via a TCS SP8 confocal microscope (Leica, Wetzlar, Germany).
Statistical analysis
Data were analyzed using Prism V.7.0 (GraphPad Software Inc, San Diego, Canada) and represented as the mean±SD. Statistics were performed using Student t-test assuming unequal variances. A p value of <0.05 was considered statistically significant.
Results
PD-L1-targeting specificity of MY1523
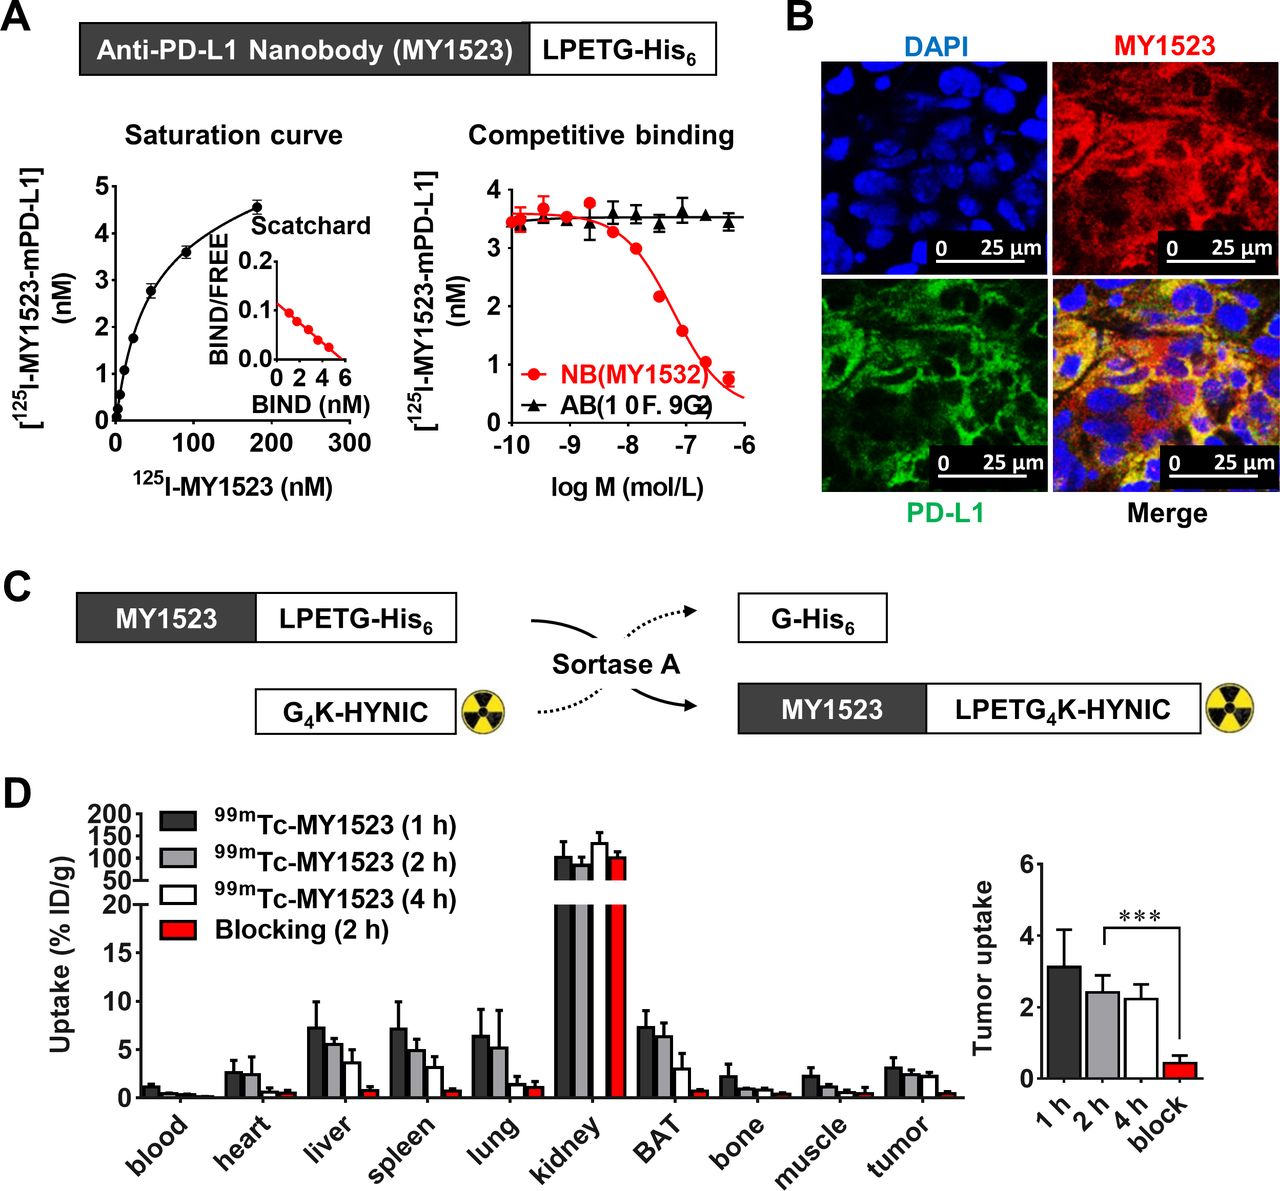
The PD-L1-targeting specificity of MY1523 was determined by the protein binding assay and immunofluorescence staining. As shown in figure 1A, MY1523 exhibited a high binding affinity (KD=49.70±7.90 nM) and specificity (IC50=59.23±0.04 nM) to PD-L1 and had no competitive binding with the antibody 10F.9G2 (IC50>10 µM). The immunofluorescence staining showed co-localization of MY1523 on PD-L1 expressed in MC-38 tumor tissues (figure 1B). The isotype control staining is provided in supporting information (online supplemental figure S1). These results revealed that MY1523 specifically targeted PD-L1.
Supplemental material

Murine PD-L1-specific targeting of nanobody MY1523 and biodistribution of 99mTc-MY1523. MY1523 was expressed with a nanobody sequence targeting to murine PD-L1 and a LPETG-His6 tag on the C-terminus. (A) The saturation binding curve of 125I-MY1523 and the competitive binding curves of nanobody MY1523 and antibody 10F.9G2 against 125I-MY1523 (n=4, mean±SD). (B) Immunofluorescence staining of PD-L1 on MC-38 tumor sections. (C) The radiochemical strategy to prepare 99mTc-MY1523 by site-specific Sortase-A transpeptidation from 99mTc-HYNIC-G4K to LPETG-His6 tagged MY1523. (D) Biodistribution of 99mTc-MY1523 in MC-38 tumor-bearing mice with or without blocking (n=4, mean±SD, ***p<0.001). BAT, brown adipose tissue; PD-L1, programmed death ligand-1.
Preparation and in vivo evaluation of 99mTc-MY1523
99mTc-MY1523 was prepared by a site-specific transpeptidation of Sortase-A (figure 1C). The labeling yield of 99mTc-HYNIC-G4K was >95%, and the total labeling yield for 99mTc-MY1523 was ~50% (online supplemental figure S2A,B). The radiochemical purity of the final product was >99% after purification (online supplemental figure S2C). The HPSEC and sodium dodecyl sulfate polyacrylamide gel electrophoresis results of 99mTc-MY1523 were consistent to that of ITLC (online supplemental figure S3A,B). In the resulting solution, 99mTc-MY1523 was proved to be stable for 6 hours at RT (online supplemental figure S2D). The binding affinity of 99mTc-MY1523 was determined on A20 cells, and the IC50 was determined to be 5.95±0.71 nM (online supplemental figure S3C).
The biodistribution of 99mTc-MY1523 was determined in mice bearing MC-38 tumors. The results showed fast blood clearance, renal-route excretion and satisfactory tumor uptake of 99mTc-MY1523 (figure 1D). The blood radioactivity was 1.15±0.25, 0.45±0.05, and 0.31%±0.08%ID/g at 1, 2 and 4 hours p.i., respectively. The kidney uptake was 102.00±35.49, 84.05±18.44 and 133.49%±24.84%ID/g at 1, 2 and 4 hours p.i., respectively. The brown adipose tissue uptake was 7.29±1.74, 6.32±1.44 and 2.98%±1.61%ID/g at 1, 2 and 4 hours p.i., respectively. The tumor uptake was 3.12±1.04, 2.42±0.47 and 2.23%±0.41%ID/g at 1, 2 and 4 hours p.i., respectively. The tumor uptake in the blocking group was significantly lower compared with the group without blocking (0.44±0.21 vs 2.42%±0.47%ID/g, at 2 hours p.i., p<0.001), suggesting a high in vivo specificity.
Monitoring PD-L1 expression changes after IFN-γ intervention
Interferon receptor signaling pathways upregulate PD-L1 expression.29 In this study, we used IFN-γ as an intervention means to regulate the tumor PD-L1 expression. The results from in vitro studies showed significantly upregulated PD-L1 expression by IFN-γ intervention compared with the PBS group on MC-38 (58.98±0.44 vs 24.77±1.58 MFI, p<0.0001), A20 (206.31±3.84 vs 62.53±0.16 MFI, p<0.0001) and 4T1 (48.23±4.49 vs 8.40±0.72 MFI, p<0.001) tumor cells (figure 2A). Using an IFN-γ intervention strategy (figure 2B), the in vivo imaging studies showed apparently increased tumor uptake of 99mTc-MY1523 compared with the corresponding PBS group in mice bearing MC-38 (3.17±0.37 vs 2.03%±0.12%ID/g, at 2 hours p.i., p<0.01), A20 (3.54±0.44 vs 2.68%±0.34%ID/g, at 2 hours p.i., p<0.001) and 4T1 (3.39±0.29 vs 1.63%±0.19%ID/g, at 2 hours p.i., p<0.0001) tumors (figure 2C). Subsequently, the tumors were resected to verify the imaging results. A good correlation between the tumor uptake of 99mTc-MY1523 and the PD-L1 expression either on tumor cells or DCs was found in these three mouse models (figure 2D). These results demonstrated that 99mTc-MY1523 could be used for the in vivo non-invasive detection of PD-L1 expression in tumors.

In vitro and in vivo PD-L1 expression changes after IFN-γ intervention. (A) The upregulated PD-L1 expression on MC-38, A20 and 4T1 tumor cells by IFN-γ intervention in vitro. (B) IFN-γ intervention strategy to regulate tumor PD-L1 expression in vivo. (C) SPECT/CT imaging and quantified tumor uptake of 99mTc-MY1523 in mice bearing MC-38, A20 and 4T1 tumors at 2 hours p.i. (n=4, mean±SD; **p<0.01, ***p<0.001, ****p<0.0001). Yellow arrows indicate tumor locations. (D) Correlation between tumor uptake of 99mTc-MY1523 and the PD-L1 expression on tumor cells and dendritic cells in MC-38, A20 and 4T1 tumors (n=4 for PBS group and IFN-γ group each). FCM, flow cytometry; IFN-γ, interferon-γ; i.t., intratumorally; MFI, median fluorescence intensity; PBS, phosphate-buffered saline; p.i., post injection; SPECT, single photon emission CT.
Imaging-guided PD-L1 blockade therapy
The imaging-guided strategy was first evaluated in mice bearing MC-38 tumors as scheduled in figure 3A. When imaging results showed the upregulated PD-L1 expression in tumors after IFN-γ intervention on day 8 and 12 after tumor cell inoculation (figure 3B), the mice were subjected to PD-L1 blockade therapy. As shown in figure 3C, although IFN-γ intervention expedited the tumor growth, the imaging-guided therapy dramatically improved the therapeutic efficacy. The tumor growth was significantly suppressed, and three of five tumors completely disappeared. Compared with control groups, the survival time of mice in the treated group was also remarkably prolonged (figure 3D). All five animals in the experimental group were alive at the end of experiments (day 50 after the tumor cell inoculation), while the animals in other groups were all dead at this time point, and even at earlier time points.

99mTc-MY1523 SPECT/CT imaging-guided PD-L1 blockade therapy in MC-38 tumor-bearing mice. (A) Scheme of 99mTc-MY1523 SPECT imaging-guided PD-L1 blockade therapy. The tumor-bearing mice were administered first with IFN-γ (1000 IU, five times from day 4 to day 8, i.t.), then SPECT/CT imaging of 99mTc-MY1523 at 2 hours p.i. was performed (on day 8 and 12, intraveneously). When the PD-L1 expression was increased, the mice were treated with αPD-L1 mAb (200 µg, on day 8 and 12, i.p.), followed by the analyzes of tumor infiltration of T cells on day 8, 16 and 35. (B) SPECT/CT imaging of mice with and without IFN-γ intervention on day 8 and 12 (n=4, mean±SD; *p<0.05, **p<0.01). Yellow arrows indicate tumor locations. (C and D) Tumor growth curves (n=5, mean±SD, *p<0.05,**p<0.01, ****p<0.0001) and the Kaplan-Meier survival curves (n=5). αPD-L1, anti-programmed death ligand-1; d, days; IFN-γ, interferon-γ; i.p., intraperitoneally; i.t., intratumorally; PBS, phosphate-buffered saline; SPECT, single photon emission CT; SV, survival; TIL, tumor-infiltrating lymphocytes.
To further confirm the results observed in the MC-38 tumor model, we repeated the therapy studies in A20 and 4T1 tumor models, and found that the outcome was very similar (figure 4A–D). The IFN-γ intervention also upregulated the PD-L1 expression in tumors, and the PD-L1 blockade therapy guided by 99mTc-MY1523 SPECT, which indicated the high PD-L1 expression, also remarkably improved the therapeutic efficacy. In the A20 animal model, on day 40 after the tumor cell inoculation, all five mice in the experimental group were alive, while only one mouse in the αPD-L1 antibody without IFN-γ intervention group was alive, and other mice in PBS and IFN-γ groups were all dead. Although the 4T1 tumors are not sensitive to PD-L1 blockade therapy,30 31 this strategy, upregulating the PD-L1 expression and imaging-guided PD-L1 blockade therapy, also worked well, while the tumor growth was effectively suppressed and the survival time of mice was evidently prolonged.

Imaging-guided PD-L1 blockade therapies in the mice bearing A20 and 4T1 tumors. (A and C) Tumor growth curves (n=5, mean±SD, *p<0.05, **p<0.01). (B and D) The Kaplan-Meier survival curves of mice (n=5). αPD-L1, anti-programmed death ligand-1; d, days; IFN-γ, interferon-γ; PBS, phosphate-buffered saline; SV, survival.
Tumor infiltration of T cells after treatment
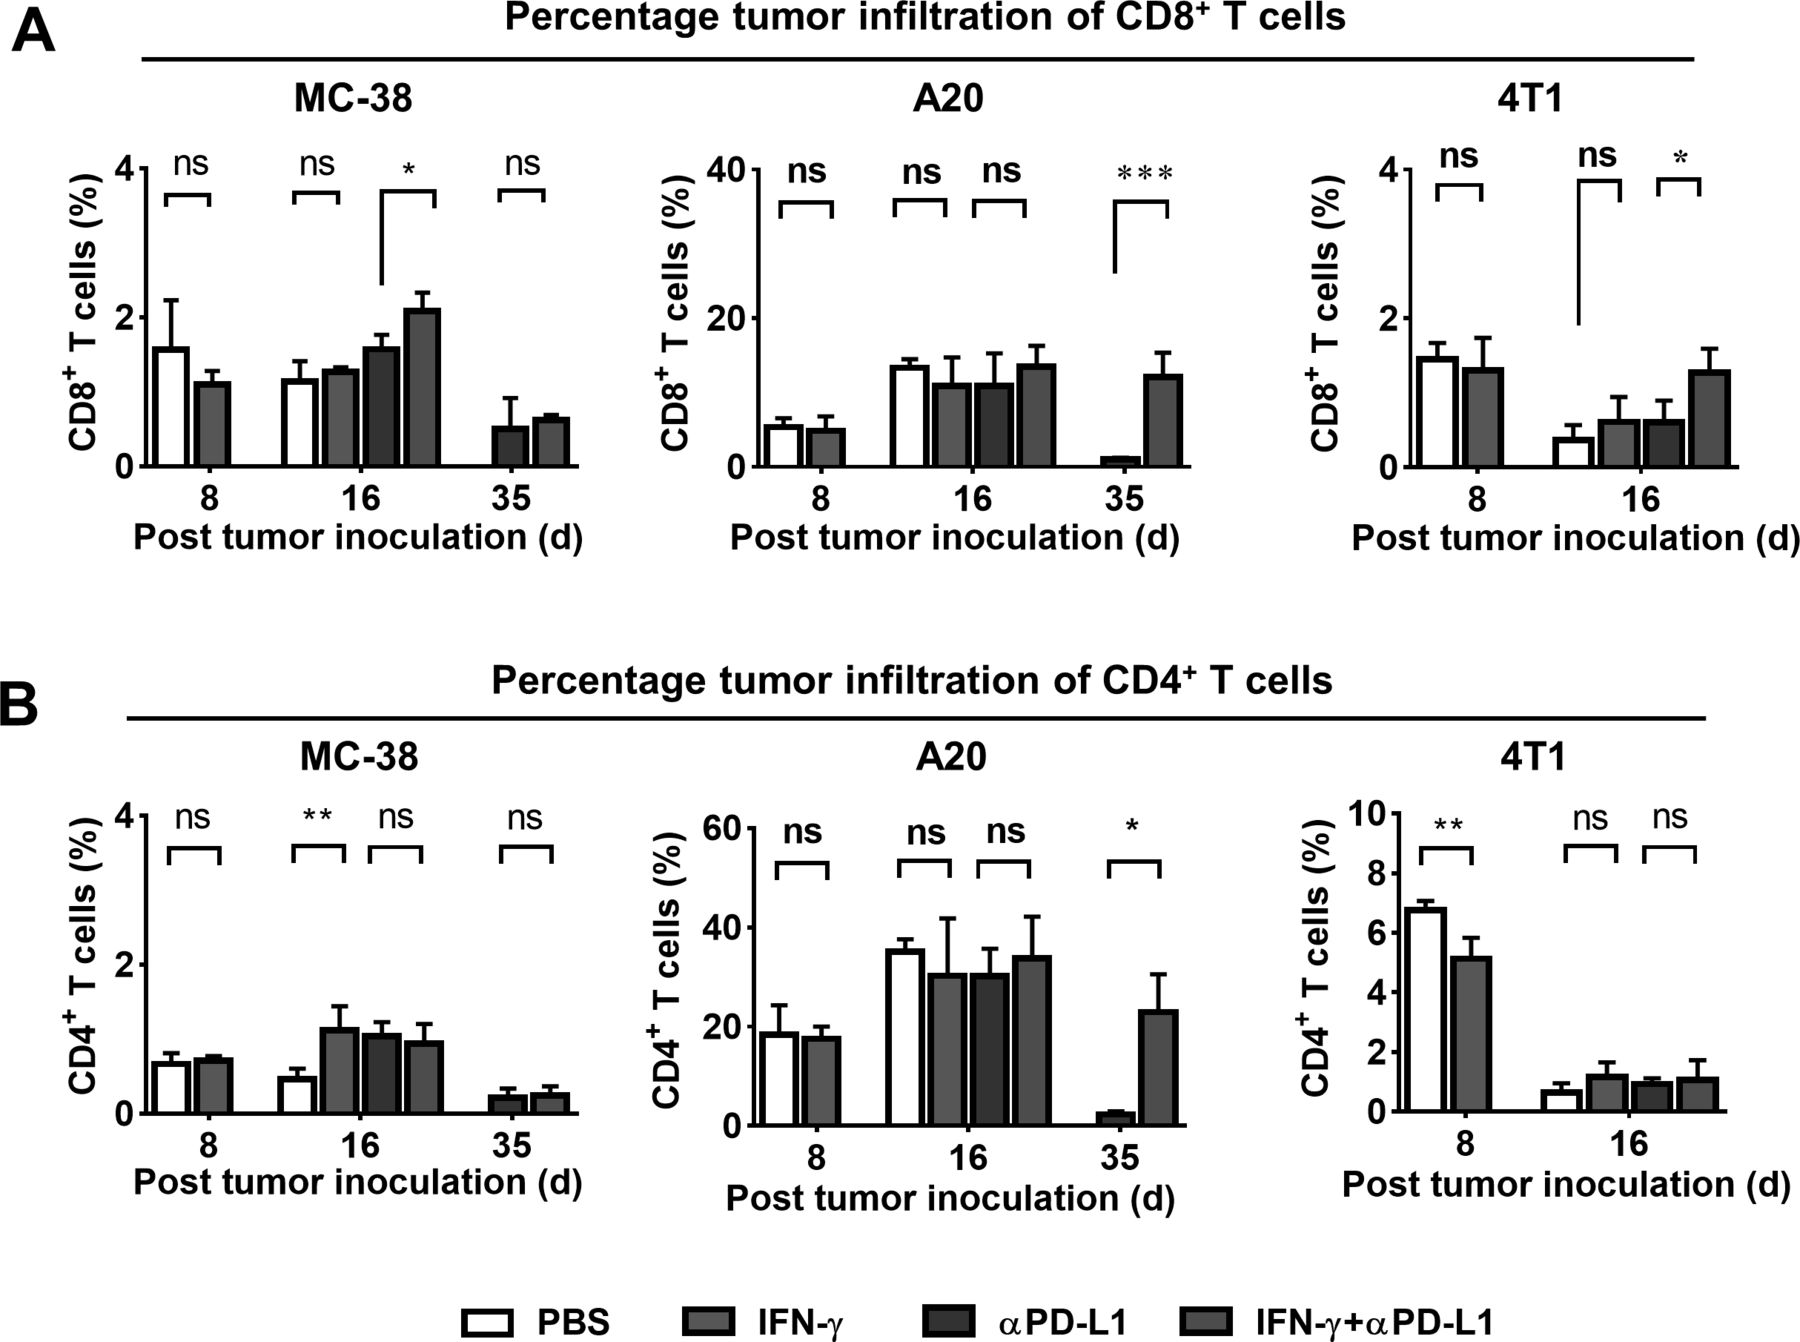
In order to corroborate the results above, the percentage CD8+ or CD4+ T-cell infiltration in tumors was determined by flow cytometry (figure 5 and online supplemental figures S4 and S6). IFN-γ expedited MC-38 tumor growth (figure 3C), had no effect on A20 tumor growth (figure 4A) and suppressed 4T1 tumor growth (figure 4C). However, IFN-γ intervention resulted in little changes of CD8+ T cells in the three kinds of tumors compared with their controls (figure 5A). A reversed correlation between CD8+ T-cell infiltration and tumor growth was observed in the αPD-L1 group and the IFN-γ plus αPD-L1 group (figure 5A). The changes of CD4+ T cells are shown in figure 5B, and show little correlation with the tumor growth. The CD8+ /Treg ratios were found increased in IFN-γ+αPD-L1 group compared with that of αPD-L1 group (online supplemental figure S4A).

Analyzes of tumor infiltrating T cells. Percentage of (A) CD8+ T cells and (B) CD4+ T cells in the digested MC-38, A20 and 4T1 tumor cells after anti-PD-L1 therapy (n=4 to 6, mean±SD, *p<0.05, **p<0.01, ***p<0.001). αPD-L1, anti-programmed death ligand-1; d, days; IFN-γ, interferon-γ; PBS, phosphate-buffered saline.
Discussion
Although PD-1/PD-L1 checkpoint blockade therapies have been clinically used to treat advanced solid tumors, the objective response rate is still unsatisfactory.32 To improve the low responsiveness of PD-1/PD-L1 inhibitors, more than 1700 clinical trials have been performed for combination therapies.33 However, how to non-invasively guide the combination therapy remains a significant obstacle.34
Tumor PD-L1 overexpression has been recognized as one of the predictors for clinical effectiveness and better survival in patients treated with PD-1/PD-L1 inhibitors.35 However, the PD-L1 expression during cancer progression and treatment is a dynamic process, thus it is impossible to monitor PD-L1 expression by traditional IHC. Moreover, PD-L1 levels determined by IHC might not represent the actual status due to the tumor heterogeneity.16 In contrast, the non-invasive nuclear imaging of PD-L1 expression can determine the tumor PD-L1 levels in a real-time, dynamic and quantitative manner, which would be beneficial to guide the personalized combination therapies.19 Until now, some efforts have been made for non-invasive imaging of tumor PD-L1 expression by PET or SPECT. Some radionuclide-labeled nanobodies have been applied for preclinical and early phase clinical research.36–38 However, little attention has been paid to how to determine the therapeutic time window of PD-1/PD-L1 immunotherapy by non-invasive PD-L1-targeted imaging. We proposed that the period when the PD-L1 expression in tumors was high or upregulated as determined by SPECT could be a favorable time window for initiation of immunotherapies. In this study, we developed a new radiolabeled PD-L1 targeted nanobody 99mTc-MY1523 to identify the crucial time window for PD-L1 blockade therapy.
Both in vitro and in vivo studies demonstrated a high specificity of 99mTc-MY1523 to PD-L1. The competitive binding assay revealed the different binding epitopes between MY1523 and the αPD-L1 antibody (figure 1A). Therefore, 99mTc-MY1523 could detect the tumor PD-L1 expression during immunotherapy with the αPD-L1 antibody and could provide guidance for multidose regimens. The results from SPECT/CT and biodistribution studies showed high tumor uptake of 99mTc-MY1523 in the mice bearing MC-38, A20 and 4T1 tumors at 2 hours p.i. The in vivo specificity of 99mTc-MY1523 was very similar to those radiolabel therapeutic antibodies,23 39 and the PD-L1 overexpression in normal brown adipose tissue40 also led to apparently high uptake of 99mTc-MY1523. Moreover, SPECT/CT showed a favorable contrast of 99mTc-MY1523 as early as 1 to 2 hours p.i. between the tumor and normal tissue, whereas it typically took 1 to 3 days for antibody-based imaging probes.41 Thus, nanobody-based radiotracers are more convenient for clinical use. We also demonstrated a good correlation between the tumor uptake of 99mTc-MY1523 and the PD-L1 expression either on DCs or tumor cells. 99mTc-MY1523 is feasible for determination of PD-L1 expression by SPECT/CT in a real time, dynamic and quantitative manner. Since we completed the immunotherapy experiments in mice, we used a nanobody MY1523 that recognized mouse PD-L1.
In addition, we also prepared a nanobody probe 99mTc-NB17 that recognized human PD-L1 and performed imaging studies in nude mouse tumor models bearing human tumor xenografts (online supplemental figure S7). The results showed that the NCI-H226 (PD-L1-positive) tumors could be clearly visualized, while the HT-29 (PD-L1-negative) tumors could not be visualized. We believe that 99mTc-NB17 would be a promising radiotracer for clinical translation, and we are preparing ethical applications for clinical imaging of PD-L1 and guiding clinical αPD-L1 immunotherapy. Although we compared the tracers with or without Ni-Nitrilotriacetic acid (NTA) column purification for the in vivo behavior in mice model, and did not find a significant difference, the Ni-NTA column purification process is required for the clinical translation studies of the human PD-L1 reactive nanobody. We are also developing new labeling methods for the nanobodies, including the use of the Sortase-A system to prepare radiolabeled precursors. For example, the ‘click chemistry’ group N3 is introduced into the nanobody via GGGG-N3, then the purified nanobody-N3 is obtained through Ni-NTA column purification. The Dibenzocyclooctyne (DBCO)-coupled bifunctional chelating agent is used for the radiolabeling, and the radiolabeled nanobody is prepared by a click chemistry method with relatively high coupling efficiency. This method can also reduce the presence of various radioactive and non-radioactive impurities.
IFN-γ plays an important role in biological functions of nearly all immune cells, as well as innate and adaptive immune responses.42 IFN-γ is a critical cytokine to change tumor PD-L1 expression,43 and can upregulate the tumor PD-L1 expression through JAK-STAT pathway.44 We thus used IFN-γ as an intervention means to establish tumor models with different PD-L1 levels and investigated the role of 99mTc-MY1523 SPECT/CT in detecting dynamic changes of PD-L1 expression. The results clearly showed that the PD-L1 expression in MC-38, A20 and 4T1 tumors after IFN-γ intervention was upregulated (figures 2C and 3B). Importantly, although IFN-γ intervention alone expedited the MC-38 tumor growth, the imaging-guided PD-L1 blockade therapy after IFN-γ intervention, which initiated during the time window, remarkably improved the therapeutic efficacy. The IFN-γ intervention had different impact on A20 and 4T1 tumor growth compared with the MC-38 tumor growth (figures 3C and 4A,C), but imaging-guided therapies after IFN-γ intervention also remarkably improved the therapeutic efficacy. Especially, the 4T1 tumors are not sensitive to PD-L1 blockade therapy;30 31 however, this strategy of upregulating PD-L1 expression followed by imaging-guided PD-L1 blockade therapy could still result in a favorable antitumor efficacy and prolonged mice survivals, which has significant clinical values for the patients who have no or less response to the PD-L1 blockade therapy.
Recent reports showed that the PD-L1 expression on DCs was more important than on tumor cells in the response to PD-L1 blockade therapy.45 46 Our study showed that the increased PD-L1 expression was from both DCs and tumor cells, while most of them came from DCs (figure 2D). Since the PD-L1 expression on 4T1 tumor cells is low,47 IFN-γ intervention did not induce significant upregulation of PD-L1 expression on 4T1 tumor cells. Thus, the upregulated PD-L1 expression on DCs lead the main response to the PD-L1 blockade therapy in mice bearing 4T1 tumors.
One of the pivotal factors for immunotherapy effect are the infiltration of CD8+ T cells into tumor tissues, and the ratio of CD8+/Treg also reflects the effectiveness of treatment. Our results showed that infiltration of CD8+ T cells (figure 5 and online supplemental figure S6) as well as CD8+/Treg ratios (online supplemental figure S4) increased to varying degrees after treatment, which was consistent with the therapeutic outcome. Also, the higher degree of CD8+ T-cell infiltration was associated with a longer median survival time (online supplemental figure S8).
The traditional cancer therapies, such as radiotherapy and chemotherapy, can remodel a ‘hot’ tumor microenvironment by favoring maturation of antigen-presenting cells, augmenting MHC-I dependent tumor antigen presentation and increasing tumor infiltration of CD8+ T cells,48 and can also increase tumor PD-L1 expression.49 50 In fact, the combination of PD-L1 blockade therapy with radiotherapy or chemotherapy has been already applied in clinical practice. The strategy reported in this study would be rather essential for the better management of combination therapies.
Conclusion
The timing for PD-L1 blockade therapy is crucial due to dynamic expression of PD-L1 in tumors. This is a proof-of-concept study that proposed the time window determined by SPECT/CT imaging for the enhanced PD-L1 blockade immunotherapy of cancer, and the experimental results testified the hypothesis. We believe that the imaging-guided PD-L1 blockade therapy combined with radiotherapy or chemotherapy would possess significant clinical values, not only for the patients with response to further enhance the efficacy, but also for the patients with no or less response to obtain therapeutic effectiveness. We have already prepared the probe targeting human PD-L1, and the translational clinical study will be carried out in the near future.
References
Supplementary materials
Supplementary Data
This web only file has been produced by the BMJ Publishing Group from an electronic file supplied by the author(s) and has not been edited for content.
Footnotes
HG, YW and JS contributed equally.
Funding This work was supported in part by the National Natural Science Foundation of China (81630045, 81427802, 81927802, 81971676, 81671747, 81873907 and 81920108020), the National Key R&D Program of China (2018YFC1313300, 2017YFA0205600, and 2018YFE0205300), the Strategic Priority Research Program of the Chinese Academy of Sciences (XDA12020110) and the Beijing Natural Science Foundation (JQ19026 and L172007).
Competing interests None declared.
Patient consent for publication Not required.
Ethics approval All animal experiments were performed in accordance with the Institutional Animal Care and Use Committee (IACUC) at Peking University.
Provenance and peer review Not commissioned; externally peer-reviewed.
Data availability statement All data relevant to the study are included in the article or uploaded as supplementary information. All data relevant to the study are included in the article or uploaded as supporting information.
Supplemental material This content has been supplied by the author(s). It has not been vetted by BMJ Publishing Group Limited (BMJ) and may not have been peer-reviewed. Any opinions or recommendations discussed are solely those of the author(s) and are not endorsed by BMJ. BMJ disclaims all liability and responsibility arising from any reliance placed on the content. Where the content includes any translated material, BMJ does not warrant the accuracy and reliability of the translations (including but not limited to local regulations, clinical guidelines, terminology, drug names and drug dosages), and is not responsible for any error and/or omissions arising from translation and adaptation or otherwise.