Article Text

Abstract
Background Stimulating antitumor immunity by blocking programmed death-1 (PD-1) or its ligand (programmed death-ligand 1 (PD-L1) is a promising antitumor therapy. However, numerous patients respond poorly to PD-1/PD-L1 blockade. Unresponsiveness to immune-checkpoint blockade (ICB) can cast significant challenges to the therapeutic options for patients with hard-to-treat tumors. There is an unmet clinical need to establish new therapeutic approaches for mitigating ICB unresponsiveness in patients. In this study, we investigated the efficacy and role of low-dose antineoplastic agent SN-38 or metformin in sensitizing unresponsive tumors to respond to ICB therapy.
Methods We assessed the significant pathological relationships between PD-L1 and FOXO3 expression and between PD-L1 and c-Myc or STAT3 expression in patients with various tumors. We determined the efficacy of low-dose SN-38 or metformin in sensitizing unresponsive tumors to respond to anti-PD-1 therapy in a syngeneic tumor system. We deciphered novel therapeutic mechanisms underlying the SN-38 and anti-PD-1 therapy-mediated engagement of natural killer (NK) or CD8+ T cells to infiltrate tumors and boost antitumor immunity.
Results We showed that PD-L1 protein level was inversely associated with FOXO3 protein level in patients with ovarian, breast, and hepatocellular tumors. Low-dose SN-38 or metformin abrogated PD-L1 protein expression, promoted FOXO3 protein level, and significantly increased the animal survival rate in syngeneic mouse tumor models. SN-38 or metformin sensitized unresponsive tumors responding to anti-PD-1 therapy by engaging NK or CD8+ T cells to infiltrate the tumor microenvironment (TME) and secret interferon-γ and granzyme B to kill tumors. SN-38 suppressed the levels of c-Myc and STAT3 proteins, which controlled PD-L1 expression. FOXO3 was essential for SN38-mediated PD-L1 suppression. The expression of PD-L1 was compellingly linked to that of c-Myc or STAT3 in patients with the indicated tumors.
Conclusion We show that SN-38 or metformin can boost antitumor immunity in the TME by inhibiting c-Myc and STAT3 through FOXO3 activation. These results may provide novel insight into ameliorating patient response to overarching immunotherapy for tumors.
- natural killer T-cells
- CD8-positive T-lymphocytes
- immunotherapy
- immunomodulation
- combined modality therapy
Data availability statement
All data relevant to the study are included in the article or uploaded as supplementary information. All data relevant to the study are included in the article or uploaded as supplementary information. Upon formal publication, Data are available online on the website of the Journal for ImmunoTherapy of Cancer.
This is an open access article distributed in accordance with the Creative Commons Attribution Non Commercial (CC BY-NC 4.0) license, which permits others to distribute, remix, adapt, build upon this work non-commercially, and license their derivative works on different terms, provided the original work is properly cited, appropriate credit is given, any changes made indicated, and the use is non-commercial. See http://creativecommons.org/licenses/by-nc/4.0/.
Statistics from Altmetric.com
- natural killer T-cells
- CD8-positive T-lymphocytes
- immunotherapy
- immunomodulation
- combined modality therapy
Introduction
Targeting immune checkpoints such as programmed death-1 (PD-1) and its counter ligand programmed death-ligand 1 (PD-L1) with monoclonal antibody (mAb) therapies has exhibited marked clinical efficacy in various cancers.1 2 This revolutionary therapeutic strategy can effectively revive patients’ cytotoxic T cells, one of the immune system’s most potent immunological arsenals against cancer, to trigger a powerful attack against cancer and promote the anticancer immune response. However, these mAb blockade alone may be effective in only a subgroup of patients with cancer. Many patients may not respond to these immune-checkpoint blockade (ICB) drugs or may develop drug resistance after initially responding. Despite the success of ICBs in some cancer types, the clinical applications of these ICBs in certain deadly cancers, such as ovarian cancer (OvCa),3 pancreatic cancer,4 and glioblastoma5 in their current states, indicate limited efficacy in these cancers and have failed to improve the survival of these cancer patients. For instance, in recent clinical trials of single-agent ICB in the treatment of OvCa, the objective response rates are relatively low (approximately 6%–15%) in general.3 The US food and drug administration (FDA) has yet to approve any ICB drug for OvCa therapy.
Unresponsiveness or resistance to available ICBs can cast significant challenges to the therapeutic options for patients with hard-to-treat cancers such as OvCa. It has been shown that the expression of PD-L1 is upregulated in tumor cells by activated oncogenic pathways, such as the c-Myc, STAT3, PI3K/Akt, NF-κB and HIF-1α pathways,6 to mediate a key immune evasion mechanism (a hallmark of cancer)7 that may result in unresponsiveness or resistance to anti-PD-1 checkpoint blockade. Among these oncogenic proteins, c-Myc plays a crucial role in regulating tumor growth, coordinating cellular adaptations in the tumor microenvironment (TME), and preventing host antitumor immunity.8 Several publications have shown that c-Myc suppression is associated with tumor immunity.9–13 Previously, we have identified antitumor pharmacological agents, including SN-38 (the active metabolite of irinotecan) and other drugs, that markedly suppress c-Myc protein levels in OvCa and breast cancer (BCa) cells in a FOXO3-dependent manner.14 15 FOXO3 (forkhead-box O3) is a central transcription factor that regulates many genes important for modulating cell-cycle control, DNA damage responses, oxidative and nutritional stresses, longevity, apoptosis, and tumor suppression in mammalian cells.16 17 Gene knockout findings support FOXOs’ essential functions in tumor suppression17 18 and maintenance of the hematopoietic stem cell pool.17
Natural killer (NK) cells are major players of innate immune cells that play a pivotal role in mediating the antitumor immune response and regulating cancer immunotherapy.19 20 For instance, NK cells are significant early producers of cytokines, such as interferon-γ (IFN-γ) that can influence T cell responses,21 and they can directly terminate tumor cells or other target cells through granzymes and perforin.22 Functionally, NK cells are not antigen specific, missing self-recognition, and can be active without immune priming.23 Thus, activation of NK cell killing may notably enhance the therapeutic efficacy of ICB in cancer immunotherapy. A lot of information about stimulatory and inhibitory receptors of NK cells has been obtained in recent years.24 However, it is still unclear how NK cells are explicitly regulated to target and kill tumor cells in the TME. Thus, the mechanisms governing the control of NK cells in cancer immunotherapy remain largely unknown.
During our interrogation of other mechanisms underlying the low-dose SN38-mediated tumor suppression in vivo, we serendipitously found that injection of a low dose (eg, 5 µg/kg body weight) of SN-38 still showed a significant effect on suppressing tumor growth in our tumor xenograft models in nude mice (unpublished findings). The cytotoxicity of such a low dose of SN-38 appeared limited in ovarian tumors in mice. Thus, we hypothesized that the observed suppression of tumor growth by low-dose SN-38 was caused by a different mechanism, such as an antitumor immune response, rather than the traditional cytotoxicity of chemotherapy. Although nude mice lack functional T cells, they have effective NK cells to compensate for their lack of T cells.25 Based on this premise, we investigated the effect of SN-38 (or other pharmacological drugs) on regulating NK cell-mediated antitumor immune responses and anti-PD-1 immunotherapy efficacy in the syngeneic mouse tumor models.
Here we show that PD-L1 expression is inversely associated with FOXO3 tumor suppressor expression in patients with ovarian, breast, and hepatocellular tumors. In contrast, PD-L1 expression is strongly linked to c-Myc or STAT3 expression in patients with these tumors. Low-dose SN-38 markedly suppresses the PD-L1 protein level in tumor cells in a FOXO3-dependent manner. In a syngeneic tumor system, low-dose SN-38 triggers NK cells and/or CD8+ T cells infiltrating the TME to kill tumors; it significantly increases the animal survival rate and sensitizes unresponsive tumors to respond to anti-PD-1 therapy. Our findings suggest a therapeutic mechanism underlying FOXO3-mediated engagement of NK or CD8-positive T cells infiltrating tumors and enhancing antitumor immunity by suppressing dual c-Myc-PDL1 and STAT3-PDL1 pathways in tumor cells. The potential clinical significance and therapeutic implication of this novel FOXO3 mechanism in boosting antitumor immune responses are discussed.
Materials and methods
Antibodies and reagents
For immunofluorescence (IF) analysis, the following primary antibodies (Abs) were purchased and used (1:1000 dilution): Abs against FOXO3a (Cell Signaling Technology (CST), 2497), FOXO3a (Abcam, ab53287, clone EP1949Y), FOXO3 (FKHRL1) (Santa Cruz Biotechnology (SCBT), sc-9813, N-16), PD-L1 (CST, 13684), PD-L1 (R&D Systems, MAB1561), PD-L1 (Thermo Fisher Scientific (TFS), 14-5983-82), PD-L1 (TFS, PA5-20343), PD-L1 (TFS, eBioscience, clone MIH1), c-Myc (MilliporeSigma, 06–340), STAT3-pY705 (SCBT, sc-8059), interleukin (IL)-6 (Abcam, ab6672), FITC-conjugated CD49b (BioLegend, 108906), FITC-conjugated NK1.1 (BioLegend, 108706), Alexa-594-conjugated CD3 (BioLegend, 100240), Alexa-594-conjugated CD8 (BioLegend, 100758), IFN-γ (BioLegend, 505802), NKG2D (Bioss Antibodies, bs-0938R), and Granzyme B (SCBT, sc-8022). The following secondary Abs were purchased and used (1:200 dilution): Alexa Fluor 488 Chicken anti-Rat (TFS, A-21470), Alexa Fluor 647 Chicken antimouse (TFS, A-21463), Alexa Fluor 594 Chicken antigoat (TFS, A-21468), Alexa Fluor 594 Donkey antirabbit (TFS, A-21207), Alexa Fluor 488 goat antimouse (TFS, A-11001) and Alexa Fluor 594 Donkey antirabbit (TFS, A-21207). For immunoblotting (IB) analysis, the following primary Abs were purchased and used: FOXO3 (Abcam, ab53287), PD-L1 (CST, 13684) p27Kip1 (BD Pharmingen, 554069), GAPDH (TFS, MA5-15738), STAT3-pY705 (SCBT, sc-8059), c-Myc (SCBT, sc-764) NKG2D (Bioss Antibodies, bs-0938R), NKp44 (Biorbyt LLC (St Louis, MO), orb315559), and NKp46 (M-100) (SCBT, sc-292796). The following secondary Abs were purchased and used (1:3000 dilution): horseradish peroxidase-conjugated donkey antimouse IgG (H+L) (715-035-150) and donkey antirabbit IgG (H+L) (711-035-152) Abs (Jackson ImmunoResearch (West Grove, Pennsylvania, USA)). For animal studies, InVivoMAb antimouse PD-1 mAb (Bio X Cell, BE0146) was purchased from Bio X Cell. Pharmacological agents or solvents: SN-38 (7-ethyl-10-hydroxycamptothecin) was purchased from Fisher Scientific (Pittsburgh, Pennsylvania, USA) or MedKoo Biosciences, Inc (Morrisville, North Carolina, USA). Metformin was purchased from Fisher Scientific or Cayman Chemical (Ann Arbor, Michigan, USA). Olaparib was obtained from LC Laboratories (Woburn, Massachusetts, USA). Dimethylsulfoxide (DMSO) and methanol were purchased from Sigma (St. Louis, Missouri, USA). SN-38 was dissolved in DMSO, and metformin was dissolved in sterile H2O or DMSO.
Cell culture and cell lines
All cell lines were grown at 37°C and 5% CO2 in Dulbecco's modified Eagle's medium (DMEM)/F12 supplemented with L-glutamine, penicilline/streptomycin and 10% fetal bovine serum (FBS). Mouse ID8 and ID8-Luc OvCa cell lines were kindly provided by Oliver Dorigo, Division of Gynecologic Oncology, Stanford University School of Medicine. Mouse metastatic 4T1 and 4T1-Luc BCa cell lines were kindly provided by Xiaoyuan (Shawn) Chen, Laboratory of Molecular Imaging and Nanomedicine, National Institutes of Health (NIH). OVCA429, an established cell line derived from a patient with late-stage serous OvCa, was kindly provided by Robert C Bast, Jr, Division of Cancer Medicine, University of Texas MD Anderson Cancer Center. NK-92 cell line was obtained from the American Type Culture Collection. Four HuSH 29mer shRNA constructs against human FOXO3 (NM_001455) and control HuSH shRNA cloning vector (pRS) using U6 promoter were purchased from Origene (Rockville, Maryland, USA). OVCA429 cells were transfected with a combination of four HuSH 29mer shRNA constructs concurrently or control pRS vector by liposome using GenJet In Vitro DNA Transfection Reagent (SignaGen Laboratories, Gaithersburg, Maryland, USA). After puromycin selection (1 µg/mL), the OVCA429 FOXO3-knockdown pooled stable clones (designated OVCA429-FOXO3-shRNA), and the vector control stable clones (designated OVCA429-Control-shRNA) were selected.
IB analysis
Cells were washed twice with phosphate-buffered saline (PBS) and lysed with lysis buffer containing protease inhibitors at 4°C for 20 min. The lysates were centrifuged at 16,000 g for 10 min to remove cell debris, and total protein concentration was determined. The protein samples were subjected to SDS–PAGE and transferred onto nitrocellulose membranes (Bio-Rad). Membranes were blocked for 1 hour in 3% bovine serum albumin (BSA) in Tris-buffered saline containing 0.1% Tween-20 (TBST) and incubated for 1 hour with primary antibody diluted in TBST containing 1% BSA. After three washes with TBST, membranes were incubated for 1 hour with horseradish peroxidase-conjugated secondary antibodies (1:3000 or 1:5000 dilution) in TBST containing 3% BSA. The immunoblots (or western blots) were visualized by an enhanced chemiluminescence kit obtained from Thermo Fisher Scientific or West-Q ECL Platinum Solution obtained from GenDEPOT (Barker, Texas, USA).
Flow cytometry analysis
Cells were isolated using Accutase (BioLegend), aliquoted (3×10⁵ cells per condition) and fixed for 15 min in 4% (v/v, in PBS) paraformaldehyde (Electron Microscopy Sciences) at room temperature. For intracellular staining, cells were permeabilized by adding ice-cold 100% methanol slowly to prechilled cells while gently vortexing (to a final concentration of 90% methanol) and incubated at 4°C for 30 min. Then, cells were washed in PBS, centrifuged at 1200 g, and resuspended in PBS with 3% BSA (staining buffer). For immunostaining, cells were incubated in staining buffer containing a primary Ab specific to PD-L1 (CST, 13684) or FOXO3 (Abcam, ab53287) (1:200 dilution) or control rabbit IgG for 1 hour at room temperature. After washing three times with PBS, cells were incubated in staining buffer containing a FITC-conjugated antirabbit (1:200 dilution) secondary Ab (Jackson ImmunoResearch) for 30 min at room temperature in the dark. Subsequently, cells were characterized using a FACScan flow cytometer (BD Biosciences) at the Institutional shared flow cytometry facility. Ten thousand events were collected in each run. The data were analyzed by FlowJo software.
IF analysis
For cancer cell staining, cells were cultured on glass coverslips for 24 hours. After treatments with SN-38 (10 nM) or other pharmacological drugs (metformin (10 or 100 µM) or olaparib (1 or 10 µM)) and vehicle (H2O or DMSO) for 24 hours, cells were fixed with 4% paraformaldehyde for 10 min and permeabilized with 0.1% Triton X-100 solution in PBS. Cells on glass coverslips were washed with PBS and blocked with PBS containing 0.1% Triton X-100 and 10% normal horse serum, incubated with a primary Ab specific to FOXO3 or PD-L1 or the indicated proteins (1:50 to 1:100 dilution) for 2 hours at room temperature, followed by Alexa 594 (red) conjugated antirabbit (1:50 dilution or 1:100 dilution) and Alexa 488 (green) conjugated antimouse (1:100 dilution) secondary Abs (Thermo Fisher Scientific). Cells were counterstained with DAPI solution (Sigma) to show the nuclei. For tumor tissue staining, tissues were rapidly frozen in the Tissue-Plus O.C.T. Compound Embedding medium (Scigen, 4583) at −80°C. Tissue sections of tumor were cut at 5 µm thickness using a Thermo Scientific Shandon Cryotome E. The tissue slides were permeabilized with 0.1% Triton X-100 solution and blocked with the blocking solution, 10% normal horse serum and 5% BSA, for 1 hour at room temperature. Then, the slides were incubated with primary Abs against FOXO3 or PD-L1 or NK1.1 or CD3 or CD49b or CD8a or IFN-γ or IL-6 or the indicated proteins for 2 hours at room temperature. After washing three times with PBS containing 0.1% Tween-20, secondary Abs (as described previously) were added onto the slides for 20 min at room temperature. After staining with DAPI solution, the slides were washed three times with PBS containing 0.1% Tween-20 and mounted onto microscope slides with DABCO-glycerol antifade solution. Specific staining was visualized, and fluorescence images were captured with a Zeiss LSM 880 Laser Scanning Confocal Microscope. To perform quantitative analyses of the relative expression of individual proteins, we measured fluorescence intensities of individual fluorescence images using ImageJ (V.1.53c). Based on three independent individual intensities, from which we constructed a histogram and determined the mean values of relative intensities as the integrated densities of individual proteins. Each error bar presented is the mean of SD.
Tumor tissue microarray (TMA) and staining
IF staining for PD-L1, FOXO3, or c-Myc was performed on the tumor TMA slides (US Biomax, Inc or Novus Biologicals or ISU ABXIS Co). Tissue sections were deparaffinized and rehydrated according to the manufacturer’s introduction. The paraffin-embedded sections were deparaffinized in xylene, hydrated with gradient alcohol and PBS solution and incubated in 10 mmol/L citrate buffer (pH 6.0). The sections were incubated with specific antibodies (Abs) in a CO2 incubator for 30 min. The sections were incubated with matched secondary fluorescence Abs and with DAPI solution for nuclear staining. The sections were covered with DABCO solution and mounted. IF analysis was performed as described previously. GraphPad Prism V.9.0 software was used for the statistical analysis. The correlations between the groups were evaluated by Pearson’s correlation (R) and Student’S t-test. N means the number of analyzed samples.
TUNEL assay
TUNEL assay was performed to identify apoptotic cells (TUNEL-positive cells) in the ID-8 tumor tissue sections with the DeadEnd colorimetric TUNEL system (Promega) according to the manufacturer’s protocol. Tumor tissues were fixed (as described previously), incubated with proteinase solution at 37°C for 20 min, and permeabilized with 0.2% Triton X-100 for 10 min. Each sample was incubated with biotinylated nucleotides and the terminal deoxynucleotidyl-transferase at 37°C for 1 hour. After blocking endogenous peroxidases by 0.3% H2O2 for 5 min, each sample was incubated with horseradish peroxidase-labeled streptavidin solution (1:250) for 30 min, followed by incubation with the diaminobenzidine solution and counterstaining with hematoxylin. The TUNEL-positive cells (dark brown color) were counted after captured images in five fields randomly for each sample under a light microscope.
NK cell cytotoxicity assay
NK cell cytotoxicity against tumor cells (4T1-Luc cells or other cells) in vitro was analyzed using a cell coculture system with cell counting assays. To determine the survival rate of tumor cells, cells were plated (40,000 or 20,000 cells/well) in 12-well plates and cultured for 24 hours. Then, NK-92 cells (20,000 or 10,000 cells/well) were added into tumor cell plates in the presence of low doses of SN-38 (0.1 or 10 nM) or the indicated doses of other pharmacological drugs, including olaparib (1 or 10 µM) or metformin (10 or 100 µM), or equal amount of negative control (DMSO). After 36 hours of incubation with NK cells and drugs, coculture plates were washed twice with PBS to remove NK cells. Then, the numbers of survived tumor cells were measured by cell counting in a hemocytometer using 0.4% Trypan Blue (Thermo Fisher Scientific).
Animal studies
14 15For syngeneic mouse tumor models, female C57BL6 mice were purchased from Charles River Laboratories. Mouse ID8-Luc cells (2×10⁵/mouse) were prepared in 0.1 mL PBS with 30% ECM gel (as described previously) and injected into the peritoneal cavity of each mouse (n=9/group). Twenty days after inoculation of ID8-Luc cells, mice were given an intraperitoneal (i.p.) injection (0.1 mL) of SN-38 (20 µg/kg body weight (BW)/mouse) or metformin (20 mg/kg BW/mouse) or equal amount of control (10% DMSO) three times per week at even intervals for up to 18 weeks. Animal survival analysis was performed by the Kaplan-Meier method using GraphPad PRISM (V8), and survival rates of the different groups were shown as Kaplan-Meier survival curves. For combination treatment with antimouse PD-1 blockade and SN-38 in a syngeneic mouse tumor model, mouse ID8 cells (3×10⁶/mouse) in 0.1 mL PBS with 30% ECM gel were injected into female C57BL6 mice subcutaneously (n=4/group). When detectable solid ID8 tumors were recognized (approx. 100 mm3), mice were subjected to an i.p. injection (0.1 mL) of an anti-PD-1 Ab (8 mg/kg BW/mouse) or SN-38 (100 µg/kg BW/mouse) or a combination of both drugs (PD-1 Ab +SN38) or equal amounts of controls, mouse isotype-matched IgG or 10% DMSO, once per week for 5 weeks. The tumor sizes were measured once per week with a Vernier caliper. Data are presented as means and SD of four mice in each group. All mice were weighed twice per week as a measure of overall systemic toxicity. After euthanasia, the tumor tissues were resected from the treated mice, and tissue slides were prepared for IF or IB analysis. All procedures were performed in compliance with the guidelines and regulations of the Institutional Animal Care and Use Committee.
In vivo imaging system (IVIS) imaging
ID8-luc2 cells were harvested, and 5×10⁶ cells were injected into the peritoneal area in female mice. After 2 weeks of the tumor growth period, the bioluminescence images were captured with IVIS Lumina LT (Caliper Life Science) using D-luciferin (PerkinElmer) weakly after treatment with DMSO, metformin (200 mg/kg),26 or SN-38 (20 mg/kg) twice a week. Mice had received an intraperitoneal (i.p.) injection of D-luciferin (150 mg/kg in 150 mL of PBS) after injection of ketamine for 10 min. All captured images were obtained with a 30 s exposure. The luminescent intensity (photons per second/cm2/steradian) was calculated for each mouse abdomen. The bioluminescent signals were analyzed using Living Image (V.4.3) software.
Flow cytometry (using mouse tumor cells)
Murine ovarian tumor (ID8-luc2) tissues were sliced and digested using collagenase IV (Gibco), Accutase (BioLegend) at 37°C for 1 hour. The tumor tissues were dissociated by gentle vortexing and washing with RPMI 1640 media, and single-cell suspension was filtered through a 70 mm filter (BD Biosciences). After washing with PBS with 2% of BSA two times, the live cells were counted using a hemocytometer, trypan blue staining. Cells were fixed in PBS containing 1.0% BSA and 2% paraformaldehyde for 30 min on ice and washed with PBS. Cells were incubated with blocking buffer (0.2% of BSA, 1% of FBS, 1% of horse serum) on a rotator in a refrigerator for 30 min, washed with PBS, and stored in a refrigerator until starting the analysis. For measuring intracellular FOXO3 protein, cells were fixed and permeabilized using 0.05% Triton X-100 in PBS for 10 min. After gating GFP expressing ID8-luc2 cells, the expression of FOXO3 was measured by FACS (easyCyte 8HT, guava).
RNA sequencing (RNA-seq) data analysis
RNA was isolated from mice tissues using RNeasy Plus Micro Kit (Qiagen). RNA integrities were checked with Agilent Technologies 2100 Bioanalyzer, and mRNAs were purified using oligo-(dT) magnetic beads. The isolated RNA was subjected to library preparation using the TruSeq RNA Library Prep Kit with poly-A selection (Illumina). Paired-ended sequencing was performed by Illumina’s NovaSeq 6000 sequencing system. Pair end reads were trimmed and aligned to the mouse reference genome in CLC Genomics Workbench21 (QIAGEN, USA). The count numbers of transcripts from tumor tissues were calculated as the score of transcripts per million (TPM) mapped reads by CLC Genomics Workbench 21. The differential gene expression from the data sets was performed with 2.0-fold change and <0.05 p value cut-off data sets analyzed in iDEP93 (integrated Differential Expression and Pathway analysis, V.0.93, http://ge-lab.org/idep) or CLC Genomics Workbench 21. For the generating heat maps, the Z-scores were calculated from the normalized counts’ values via iDEP93. Generating heatmap, pathway enrichment analysis, hierarchical clustering, κ-means clustering analysis, and Gene Ontology (GO) analysis was performed using iDEP 0.93. We performed another GO analysis using the Database for Annotation, Visualization, and Integrated Discovery (DAVID) tool. The panels of color heat maps were generated via Morpheus (heat map visualization and analysis tool created at the Broad Institute, https://software.broadinstitute.org/morpheus/). We used Estimating the Proportions of Immune and Cancer cells (EPIC, http://epic.gfellerlab.org)27 to evaluate the immune cell fractions from bulk RNA expression data.
Statistical analysis
All data are presented as means and SD from at least three independent experiments. The statistical significance of differences in expression of proteins examined in cells and the percentage of tumor growth or cell survival or animal survival between two groups were analyzed with two-sided unpaired Student’s t-tests with GraphPad PRISM (V.8 or V.9) statistical software (San Diego, California, USA) or Excel (Microsoft Office). Animal survival analysis was performed by the Kaplan-Meier method using GraphPad PRISM (V.8 or V.9). All statistical tests were two sided, and p values less than 0.05 were considered statistically significant.
Results
PD-L1 expression is inversely associated with FOXO3 expression in patients with various tumors, and SN-38 regulates PD-L1 and FOXO3 expression in mouse tumor cells
Our prior human OvCa tumor results suggest that low-dose SN-38 downregulates PD-L1 and upregulates FOXO3 expression in tumor cells, enables mouse NK1.1-positive NK cells to enter the TME and markedly suppresses tumor growth in a tumor xenograft mouse model (unpublished findings). Thus, we set out to assess whether there was a correlation between PD-L1 and FOXO3 expression in patients with various tumors and if the correlation was pathologically significant. Using dual IF analysis, we examined the protein expression of both PD-L1 and FOXO3 in various human primary tumor specimens, which included tissue microarrays of ovarian carcinoma, invasive breast carcinoma, and hepatocellular carcinoma (HCC) as described in Materials and methods, with anti-PD-L1 and anti-FOXO3 specific Abs, and the stained cells were analyzed and quantified with a confocal microscope. Significantly, our results showed that levels of PD-L1 protein were inversely associated with those of FOXO3 protein in ovarian carcinoma specimens (figure 1A; n=69, R=−0.296, p=0.0136), invasive breast carcinoma specimens (figure 1B; n=159, R=−0.229, p=0.0038), and HCC specimens (figure 1C; n=51, R=−0.35, p=0.0113). Collectively, results in figure 1D–F indicate, for the first time, that PD-L1 expression is inversely linked with FOXO3 expression in patients with OvCa, BCa, and HCC.
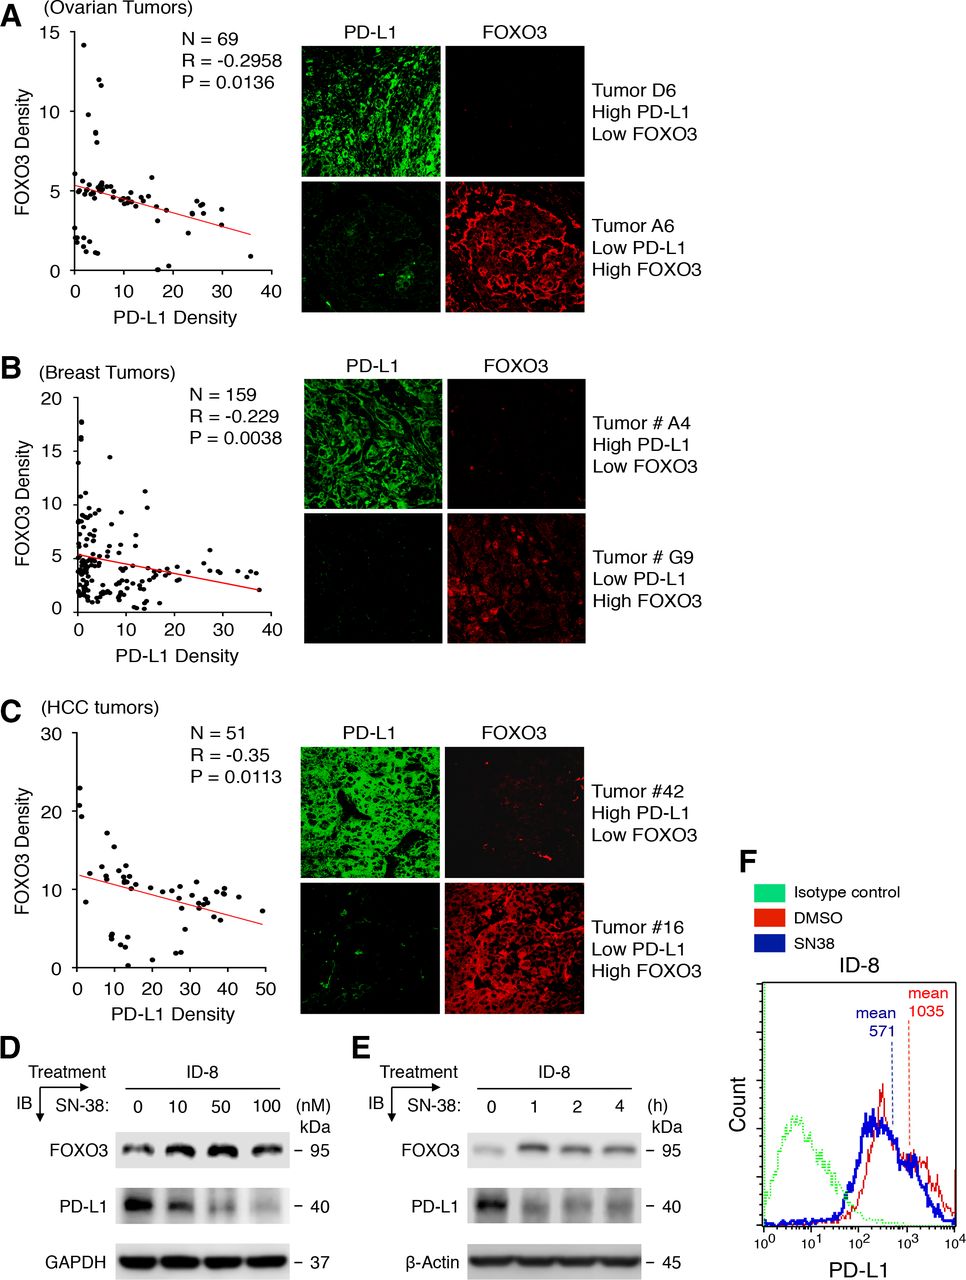
A significant inverse relationship between PD-L1 and FOXO3 protein expression is discovered in patients with various tumors, and PD-L1 and FOXO3 protein expression in mouse tumor cells are regulated by low-dose SN-38. (A–C) Using immunofluorescence (IF) analysis, we determined the protein expression of PD-L1 and FOXO3 in three different human primary tumor tissues that were tumor tissue microarrays (TMAs) of OvCa, invasive BCa, and HCC specimens. Each tumor TMA slide was incubated with an anti-FOXO3 or ant-PD-L1 antibody (Ab) and followed by an Alexa Fluor 594-conjugated or 488-conjugated secondary Ab and IF analysis was performed using fluorescence confocal microscopy. (D and E) Mouse ID-8 OvCa cells were treated with a dose–response (D) or a time course (E) of SN-38 or DMSO control (0 nM) as indicated. Protein expression in total lysates of treated cells were analyzed by immunoblotting (IB) with anti-PD-L1 and anti-FOXO3 Abs as indicated. GAPDH and β-Actin represent loading controls. (F) ID-8 cells were treated with low-dose SN-38 (10 nM) or DMSO control and analyzed by flow cytometry with indicated Abs or isotype control IgG. BCa, breast cancer; DMSO, dimethylsulfoxide; HCC, hepatocellular carcinoma; OvCa, ovarian cancer; PD-L1, programmed death-ligand 1.
Next, we determined whether low-dose SN-38 regulates PD-L1 and FOXO3 expression to suppress tumor progression in a syngeneic mouse tumor model, and if so, how the FOXO3-mediated antitumor immunity is regulated. To this end, we first determined whether low-dose SN-38 regulated PD-L1 and FOXO3 expression in mouse tumor cell lines. Using two different protein expression analyses, we showed that low doses of SN-38 suppressed PD-L1 and promoted FOXO3 expression significantly in mouse OvCa ID-8 cell line compared with control in a dose-dependent and time-dependent manner using IB and flow cytometry analyses with specific Abs (figure 1D–F). We found similar data in mouse BCa cell lines (not shown).
Low-dose SN-38 significantly increases the animal survival rate and engages mouse NK cells infiltrating the TME in a syngeneic tumor mouse model
Using a syngeneic orthotopic tumor mouse model, we demonstrated that mouse OvCa ID-8 peritoneal tumors appeared at approximately 20 days. We investigated the effect of SN-38 or metformin on improving the survival rate of tumor-bearing mice. Our data showed that i.p. administration of SN-38 or metformin significantly increased the animal survival rate compared with control (figure 2A,B). In particular, low-dose SN-38 markedly improved the overall survival rate of these mice in this tumor model. Next, we evaluated whether low-dose SN-38 regulated the expression of PD-L1 and FOXO3 in ID8 tumors in these mice. We examined the protein expression of PD-L1 and FOXO3 in primary tumor tissues, which were excised from the treated mice as described in figure 2A,B, by using IF analysis with specific Abs. Our data indicated that PD-L1 expression was reduced markedly, and the nuclear FOXO3 expression was increased in tumor treated with SN-38 compared with control tumors (figure 2C–E; online supplemental figure S1A). These results suggest that low-dose SN-38 can significantly suppress PD-L1 expression in tumor cells to block the PD-L1/PD-1 checkpoint, resulting in enhancing the overall survival rate of these mice in the syngeneic tumor mouse model.
Supplemental material

Low-dose SN-38 significantly increases the animal survival rate, regulates PD-L1 and FOXO3 expression in mouse ID-8 tumor tissues, and engages mouse CD49b/NK1.1/NKp46-positive NK cells infiltrating the ID-8 TME in a syngeneic mouse ID8 tumor model. Mouse ID-8 cells (2×10⁵ cells/injection) were injected into the peritoneal cavity of female C57BL6 mice (n=9/group). (A) The scheme of the therapeutic model is shown. Twenty days after the inoculation of ID-8 cells, the mice were given an intraperitoneal (i.p.) injection (0.1 mL) of SN-38 (20 µg/kg body weight (BW)/mouse) or metformin (20 mg/kg BW/mouse) or an equal amount of DMSO (control) three times per week at even intervals for several weeks (up to 18 weeks). (B) Animal survival rates of the different groups were shown as Kaplan-Meier survival curves, which were calculated by the Kaplan-Meier method. The median survival days were shown. The significance was compared using the log-rank test. P values between the SN-38 group versus the DMSO group and between the metformin group versus the DMSO group were 0.0093 and 0.0328, respectively. (C) Three slides of tumor samples from mice treated with DMSO or SN-38 were incubated with anti-PD-L1 or anti-FOXO3 Abs and followed by Alexa Fluor 488-conjugated or 594-conjugated secondary Abs and IF analysis as described previously. Four archetypal IF images were displayed; all IF images and DAPI (the nuclear staining) images were shown in online supplemental figure S1). (D and E) The relative expression of PD-L1 and FOXO3 between tumors treated with DMSO and SN-38 in vivo are shown in the histograms as indicated, respectively. Scale bar: 20 µm. (F and G) Three slides of samples from ID8 tumors treated with DMSO or SN-38 were incubated with antimouse CD49b Ab (F) or NK1.1 Ab (G) and followed by fluorescent secondary Abs and IF analysis. The IF images and DAPI images were shown in online supplemental figure S2. (H and I) Total lysates of tumor samples were analyzed by immunoblotting with the indicated anti-NKp46 and anti-NKp44 Abs. (J) Similarly, tumor samples were incubated with antimouse IFN-γ Ab and secondary Ab. GAPDH represents loading controls. Abs, antibodies; DMSO, dimethylsulfoxide; IF, immunofluorescence; IFN-γ, interferon-γ; NK, natural killer; PD-L1, programmed death-ligand 1; TME, tumor microenvironment.
Next, we assessed whether NK or T cells were recruited into the ID-8 TME to contribute to the SN38-mediated tumor suppression and improving the survival rate of the mice bearing ID-8 tumors. We examined the protein expression of mouse NK cell markers, including CD49b,28 NK1.1,24 NKp46,24 or NKp44,29 in the primary tumor tissues or their lysates using IF analysis with antimouse CD49b or NK1.1 Abs and IB analysis with antimouse NKp46 or NKp44 Abs on ID-8 tumor specimens, respectively. Indeed, our data showed that the majority of tumor-infiltrating immune cells were CD49b+, NK1.1+, NKp46+, or NKp44 + in tumor specimens treated with low-dose SN-38 compared with DMSO-treated tumor specimens (figure 2F–I; online supplemental figure S2), and the detected intratumor immune cells were mainly CD3-low or negative (not shown). Low-dose SN-38 notably increases IFN-γ protein level in the TME of ID-8 tumor specimens (figure 2J; online supplemental figure S2A). These results suggest that these tumor-infiltrating immune cells may be primarily NK cells.
SN-38 or metformin promotes tumor suppression and engages mouse NK and CD8+ T cells infiltrating the TME in a syngeneic mouse model monitored by bioluminescent imaging
We sought to enhance our findings of the survival rate of mice treated with metformin or low-dose SN-38 (figure 2). We assessed ID8-luc2 tumor growth with bioluminescent images from the luciferase tracking. Using the same syngeneic orthotopic tumor mouse model, we confirmed that SN-38 or metformin potently suppressed tumor growth and promoted mouse NKp46+ NK and a lower level of CD3+/CD8+ T cells infiltrating the TME (figure 3). The bioluminescence intensity increased notably at weeks 4 and 5. While metformin or low-dose SN-38 potently upregulated FOXO3 expression, both drugs downregulated PD-L1 expression significantly (figure 3C,D).

SN-38 or metformin significantly suppresses tumor growth in vivo monitored by bioluminescent imaging. (A) Timeline (weekly) of bioluminescent signals in a representative showed growing mouse tumor injected with 5.0×10⁶ ID8-luc2 cells. (B) In the DMSO control group, he bioluminescence level increased significantly at weeks 4 and 5 (*p<0.05, **p<0.005). All scales in photons/second/cm2/steradian. (C) This figure shows flow cytometry analysis of tumor cells treated with controls or two different drugs (DMSO, metformin, or SN-38). Gray color: isotype control; blue color: DMSO-treated tumor cells; green color: metformin-treated tumor cells; and orange color: SN-38-treated tumor cells. The right panel shows elevated FOXO3 expression on each drug-treated tumor cells (n=3, *p<0.05, **p<0.005). (D) Gray color: isotype control; blue color: DMSO-treated tumor cells; green color: metformin-treated tumor cells; and orange color: SN-38-treated tumor cells. The right panel shows decreased PD-L1 expression on each drug-treated tumor cells (n=3, *p<0.05, **p<0.005). (E) This figure shows flow cytometry analysis of CD3 or NKp46 expressing immune cells isolated from mouse tumors. CD3 (T cell marker) or NKp46 (NK cell marker) shows each changed population in the drug-treated tumor. Metformin or SN-38 treated tumor tissues show increased CD3 positive cells or NKp46 positive cells. The right panel shows a significantly increased CD3 or NKp46 positive population in tumor tissues (n=3, *p<0.05, **p<0.005). (F) This figure shows flow cytometry analysis of CD8 or NKp46 expressing immune cells isolated from mouse tumors. CD8 (cytotoxic T cell marker) or NKp46 (NK cell marker) shows each changed population in the drug-treated tumor. Metformin or SN-38 treated tumor tissues show increased CD8 positive cells or NKp46 positive cells. The right panel shows a significantly increased CD8 (cytotoxic T cells) positive population in tumor tissues (n=3, *p<0.05). DMSO, dimethylsulfoxide; NK, natural killer; PD-L1, programmed death-ligand 1.
SN-38 significantly sensitizes unresponsive tumors to respond to anti-PD-1 Ab therapy in a syngeneic mouse tumor model and regulates PD-L1 and FOXO3 expression in tumor cells in vivo
In a syngeneic tumor model, mouse xenograft tumors were established using the mouse ID-8 tumor cells as previously described.14 We determined whether these ID-8 tumors responded to the antimouse PD-1 Ab treatment alone. We found that the treatment with an anti-PD-1 Ab alone showed insignificant or minimal effects on tumor suppression in this syngeneic tumor model compared with negative controls (figure 4A), suggesting that mouse ID-8 tumors were non-responders or poor responders to anti-PD-1 Ab therapy. We further investigated the effects of SN-38 alone or the combination of SN-38 and anti-PD-1 Ab on suppressing tumor growth and progression in the same ID-8 tumor model. Using a combination regimen, we showed that the administration of SN-38 significantly enhanced the response of ID-8 tumors to anti-PD-1 Ab therapy in the suppression of ID-8 tumor growth and progression in vivo (figure 4A).

SN-38 sensitizes unresponsive tumors to respond to anti-PD-1 mAb therapy, regulates PD-L1 and FOXO3 expression in tumors, and engages mouse NK1.1/CD49b-positive NK cells and/or some CD3/CD8-positive T cells to infiltrate the TME in a syngeneic mouse tumor model. (A) Mouse ID8 cells were injected into female C57BL6 mice subcutaneously (n=4/group). When palpable solid ID8 tumors were detected, mice were given an intraperitoneal injection (0.1 mL) of an anti-PD-1 Ab (8 mg/kg BW/mouse) or SN-38 (100 µg/kg BW/mouse) or a combination of both drugs (PD-1 Ab + SN38) or equal amounts of controls, mouse isotype IgG or DMSO, once per week at even intervals for 5 weeks. (B) The ID8 tumor tissues were excised from the treated mice for IF analysis. Three slides of samples from ID8 tumors treated with the indicated regimens or controls were incubated with antimouse PD-L1 or antimouse FOXO3 Abs and followed by Alexa Fluor 488-conjugated or 594-conjugated secondary Abs and IF analysis as described previously. Archetypal IF images were illustrated; all IF and DAPI images were shown in online supplemental figure S3. Scale bar: 50 µm. (c) The relative expression of PD-L1 and FOXO3 between tumors treated with the indicated regimens or controls in vivo are shown in the histograms, respectively. (D) Three slides of samples from ID8 tumors treated with the indicated regimens or controls were incubated with antimouse NK1.1 or antimouse CD3 Abs and followed by secondary Abs and IF analysis. Paradigmatic IF images were shown; all IF and DAPI images were displayed in online supplemental figure S4. Scale bar: 20 µm. (E) The relative expression of mouse NK1.1 and CD3 among tumors treated with the indicated regimens or controls in vivo are shown in the histograms as indicated, respectively. (F–I) Similarly, three slides of samples from these tumors were incubated with antimouse Abs against CD49b or CD3 or CD8, and IF analysis was performed as described previously. Scale bar: 20 µm. The relative expression of mouse CD49b and CD3 (G) or CD8 (I) among tumors treated with the indicated regimens in vivo are shown in the histograms as indicated, respectively. Paradigmatic IF images were shown; all IF and DAPI images were displayed in online supplemental figure S5 and S6. Scale bar: 20 µm. Abs, antibodies; BW, body weight; DMSO, dimethylsulfoxide; IF, immunofluorescence; mAb, monoclonal antibody; PD-L1, programmed death-ligand 1; TME, tumor microenvironment.
Next, we confirmed whether the combination of SN-38 and anti-PD-1 Ab regulated the expression of PD-L1 and FOXO3 in ID8 tumors in these mice. We examined the protein expression of PD-L1 and FOXO3 in the primary tumor tissues, which were excised from the treated mice as described previously, by using IF analysis with specific Abs. Our results indicated that PD-L1 protein level was significantly decreased, and nuclear FOXO3 protein level was markedly increased in tumors treated with SN-38 alone or combined regimens (PD1 Ab + SN38) compared with controls (figure 4B,C). Similarly, to a lesser degree, the PD-L1 protein level was decreased, and the nuclear FOXO3 protein level was enhanced in tumors treated with SN-38 or anti-PD-1 Ab as a single agent compared with control tumors (online supplemental figure S3). These results suggest that SN-38 significantly enhances the anti-PD1 Ab antitumor immune response, probably by increasing suppression of the PD-L1/PD-1 immune checkpoint in a syngeneic tumor mouse model.
SN-38 alone and combined anti-PD-1 Ab and SN-38 significantly engage mouse NK1.1/CD49b-positive NK cells and/or CD3/CD8-positive T cells to infiltrate the ID-8 TME in a syngeneic tumor model
To assess whether SN-38 enhanced the anti-PD-1 Ab-mediated recruitment of NK cells or CD8-positive T cells into the TME in the syngeneic mouse ID8 tumor model, we determined the protein levels of mouse NK1.1 and CD3 markers in primary tumor tissues by using IF analysis. Our results exhibited that SN-38 significantly increased the anti-PD-1 Ab-mediated engagement of NK1.1-positive NK cells and, to a lesser extent, CD3-positive T cells infiltrating into the TME compared with control-treated tumor specimens (figure 4D,E; online supplemental figure S4). In addition to mouse NK1.1, we examined whether the NK cells in the TME also expressed CD49b (a specific mouse NK cell marker).26 Correspondingly, our results indicated that the tumor-infiltrating NK cells were mostly CD49b-positive and, to a lesser extent, CD3-positive T cells were found in the TME compared with control tumors (figure 4F,G; online supplemental figure S5). In addition to mouse CD3, our data showed that the tumor-infiltrating T cells were mainly CD8 positive (figure 4H,I; online supplemental figure S6). Taken together, these results suggest that the tumor-infiltrating NK cells were predominantly NK1.1/CD49b-positive and T cells were primarily CD3/CD8-positive in ID8 tumor specimens treated with SN-38 alone or combination regimens (PD1 Ab + SN38).

Differentially expressed gene sets (GO category) and selected genes analyzed by RNA SEQ related to the immune response in agents (DMSO + IgG or SN-38 + PD-1 Ab) treated tumor tissues. (A) Top 10 biological functional annotated increased or decreased gene expression were performed in DAVID (web-based tool). Each bar presents the number of genes in signature categories. (B) The composition of immune cell types was predicted by the EPIC web-based tool. The SN-38 + PD-1 Ab treated tumor samples predicted more T cells and NK cells in the tumor tissues. (C) This panel shows T cell or NK cell markers’ differential expression, transcripts per million (TPM). The tumor samples treated with SN-38 plus PD-1 Ab showed increased T cell and NK cell markers expression. (D) The representative color heat maps based on Z-score significantly increased genes related to T cell or NK cell activation (D: DMSO + IgG treatment, S: SN-38 + PD-1 Ab treatment). Ab, antibody; DAVID, Database for Annotation, Visualization, and Integrated Discovery; DMSO, dimethylsulfoxide; EPIC, Estimating the Proportions of Immune and Cancer; GO, Gene Ontology; IFN-γ, interferon-γ; NK, natural killer; PD-1, programmed death-1.
Combination regimens significantly upregulate the expression of many genes involved in regulating the immune system process and innate immune response in vivo
Using RNA-Seq technology, we performed comprehensive mRNA analysis of tumor specimens isolated from the mouse model of combination drug treatments in syngeneic mice (figure 4). We analyzed differentially expressed RNA sequences using the GO analysis via iDEP and the EPIC tools27 as described in Materials and methods. Our data revealed that the tumor specimens treated with SN-38 plus PD-1 Ab significantly upregulated many gene expressions categorized in the immune responses and regulations compared with those treated with controls (DMSO plus IgG) (figure 5; online supplemental figure S13). We analyzed the screened genes with significant p values and fold changes to examine more detailed gene expression changes related to T cell or NK cell activation. Indeed, our data suggested the predicted immune cell population, especially expressed significant NK-cell markers, in tumor samples treated with SN-38 and PD-1 Ab. For instance, an important NK-cell secreted enzyme, granzyme B, was significantly elevated in the drug-treated tumor tissues (figure 5C).
NK cells mediate the killing of tumor cells in vivo by inducing IFN-γ and granzyme B secretion in the ID8 TME and in vitro cell-based systems in a pharmacological drug-dependent manner.
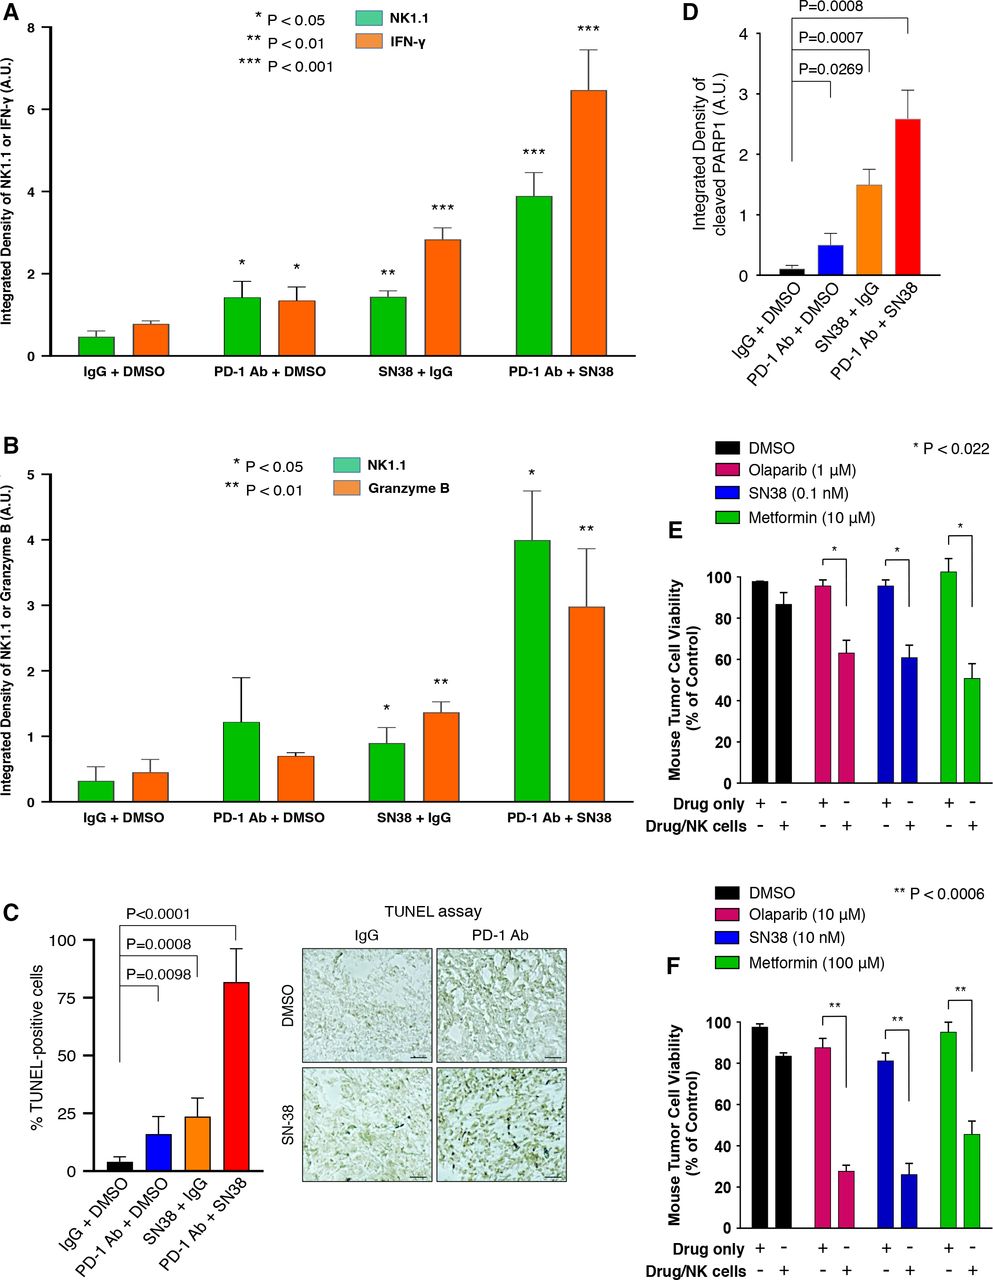
We examined whether IFN-γ and granzyme B, which is a cytotoxic serum protease that participates in the NK and CD8+ T cell-mediated killing of tumor cells, were regulated in the TME of ID8 tumors in mice treated with SN-38 and/or anti-PD-1 Ab (as described in figure 4) by performing IF analysis with an Ab against mouse IFN-γ or granzyme B on ID8 tumor samples. Our results showed that SN-38 alone and the combination of anti-PD-1 Ab and SN-38 markedly increased IFN-γ and granzyme B protein levels in the TME of ID8 tumor specimens (figure 6A,B; online supplemental figures S7 and S8). Using terminal deoxynucleotidyl-transferase dUTP nick end labeling (TUNEL) apoptosis assays, our data revealed that low-dose SN-38 or combined regimens (PD1 Ab + SN38) treatments induced significant TUNEL-positive apoptotic tumor cells in the TME (figure 6C; online supplemental figure S9). Moreover, using IF analysis with an Ab specific to mouse cleaved-PARP1 peptide (a biomarker of apoptosis), we showed that low-dose SN-38 or combined regimens (PD1 Ab + SN38) treatments significantly promoted cleaved PARP1-positive apoptotic tumor cells in the TME (figure 6D; online supplemental figure S10).

NK cells mediate the killing of tumor cells in vivo by inducing IFN-γ and granzyme B secretion in the ID8 TME and in vitro cell-based systems in an indicated regimen-dependent manner. (A and B) Three slides of samples from ID8 tumors treated with the indicated regimens or controls were incubated with antimouse NK1.1 or antimouse IFN-γ (A) or antimouse granzyme B (B) and followed by secondary Abs and IF analysis as described previously. The relative expression of mouse NK1.1 and IFN-γ (A) or granzyme B (B) among these tumors with treatment regimens are shown in the histograms as indicated, respectively. All IF and DAPI images were displayed in online supplemental figures S7 and S8. Scale bar: 20 µm. (C) Three slides of samples from these ID8 tumors were subjected to TUNEL assays (Promega) for determining cellular apoptosis. Archetypal TUNEL images were shown; all TUNEL images were displayed in online supplemental figure S9. Scale bar: 20 µm. (D) Three slides of samples from these ID8 tumors were subjected to cleaved-PARP1 IF analysis for determining cellular apoptosis. All cleaved-PARP1 IF images were displayed in online supplemental figure S10. Scale bar: 20 µm. (E) Mouse metastatic tumor 4T1-Luc cells (40,000 cells/well) were treated with NK-92 (10,000 cells/well) in the presence of low-dose SN-38 or other pharmacological drugs as indicated or DMSO (control) for 36 hours. After removing NK cells, the survival rates of tumor cells were measured by cell counting. *P<0.022. (F) Similarly, 4T1-Luc tumor cells (20,000 cells/well) were treated with NK-92 (10,000 cells/well) in the presence of higher doses of pharmacological drugs than those used in figure part E. **P<0.0006. Abs, antibodies; DMSO, dimethylsulfoxide; IF, immunofluorescence; IFN-γ, interferon-γ; NK, natural killer; TME, tumor microenvironment.
Next, we determined the role of SN-38 in promoting NK cell-mediated suppression of tumor cell survival in vitro. Using a cell coculture system, we cocultured mouse metastatic 4T1-Luc tumor cells treated with SN-38 at low doses or other pharmacological drugs in the absence or presence of NK-92 cells. Our results showed that low doses of SN-38 or higher doses of other pharmacological drugs (metformin or olaparib) significantly triggered NK cell-mediated 4T1-Luc tumor cell killing effect in our coculture system in vitro (figure 6E,F). Olaparib can upregulate FOXO3 (unpublished data). Similarly, SN-38 and these pharmacological drugs could promote NK cell-mediated killing of human OVCA429 tumor cells in the same coculture assays (data not shown). These results suggest that the observed tumor-infiltrating NK cells can suppress tumor cell survival in the TME in the presence of SN-38 or metformin or specific pharmacological drugs.
FOXO3 is necessary and sufficient for SN38-mediated suppression of PD-L1 protein levels in tumor cells
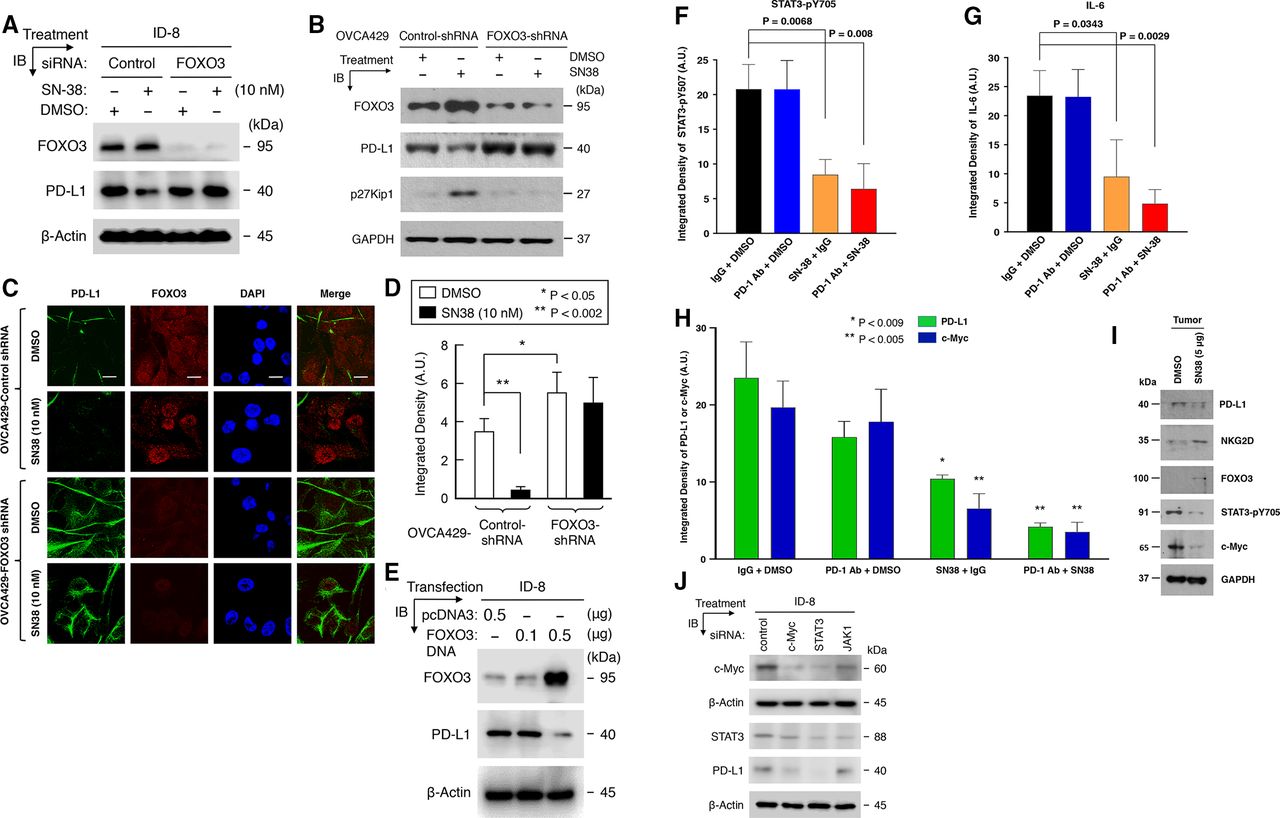
To evaluate whether FOXO3 is necessary for regulating the SN38-mediated suppression of the expression of PD-L1 in mouse and human tumor cells, we transfected ID-8 cells with specific siRNA targeting mouse FOXO3 or control siRNA. We performed IB analysis after cells were treated with low-dose SN-38 or control. Our results showed that silencing of FOXO3 expression in ID-8 tumor cells overrode the suppression of PD-L1 protein level after SN-38 treatment (figure 7A). In addition, we transfected human OVCA429 cells with FOXO3-shRNA (FOXO3-knockdown) or control-shRNA (negative control) to generate stable cell lines. We performed IF and IB analyses after these cells were treated with low-dose SN-38 or DMSO control. Our data indicated that knockdown of FOXO3 expression in OVCA429 tumor cells recalled downregulation of PD-L1 protein level after SN-38 treatment in IB and IF analysis (figure 7B–D). As a control, p27Kip1 (a transcriptional target of FOXO3) was silenced in the FOXO3-shRNA cell line (figure 7B). Furthermore, we transfected ID-8 cells with FOXO3 cDNA expression vector or control vector (pcDNA3) and performed IB analysis. We demonstrated that overexpression of FOXO3 protein alone potently suppressed PD-L1 protein level in ID-8 cells in the absence of drug treatment (figure 7E). Collectively, these results suggest that FOXO3 is essential and sufficient for SN38-mediated downregulation of the expression of PD-L1 in mouse and human tumor cells.

FOXO3 is essential and sufficient for SN38-mediated suppression of PD-L1 expression, and SN-38 or combined regimens significantly suppress STAT3-pY705, IL-6, and c-Myc expression in syngeneic ID8 tumors. (A) Mouse ID-8 cells were transfected with specific siRNA targeting mouse FOXO3 or control siRNA and treated with low-dose SN-38 or DMSO (control). Protein expression in total lysates of these cells were detected by immunoblotting (IB) with the indicated Abs, and GAPDH represents loading controls. (B) The OVCA429-Control-shRNA and -FOXO3-shRNA stable cell lines (as described in Materials and methods) were treated with low-dose SN-38 (10 nM) or DMSO control. Using IB analysis, protein expression in total lysates of these cells were detected with the indicated Abs. GAPDH represents loading controls. (C) OVCA429-Control-shRNA and -FOXO3-shRNA cell lines were treated with low-dose SN-38 (10 nM) or DMSO control. Three slides of samples from these cells treated with SN-38 were incubated with an anti-PD-L1 (MAB1561) and anti-FOXO3 (FKHRL1, sc-9813) and followed by fluorescent secondary Abs and IF analysis as described previously. (D) The histogram shows the integrated density of PD-L1 protein-expressing cells (n=100). (E) Mouse ID-8 cells were transfected with FOXO3 cDNA expression vector or control vector (pcDNA3). Using IB analysis, protein expression in total lysates of these cells were determined with the indicated Abs. β-Actin represents loading controls. (F and G) Three slides of samples from ID8 tumors treated with the indicated regimens or controls were incubated with antimouse STAT3-pY705 (F) or antimouse IL-6 (g) and followed by secondary Abs and IF analysis as described previously. The relative protein levels of STAT3-pY705 (F) and IL-6 (G) in the TME treated with different regimens in vivo are shown in the histograms as indicated. All IF and DAPI images were displayed in online supplemental figure S11. (H) Three slides of samples from ID8 tumors treated with the indicated regimens were incubated with an antimouse c-Myc or anti-mouse PD-L1 Ab and followed by secondary Abs and IF analysis. The relative expression of c-Myc and PD-L1 in the TME are shown in the histograms. All IF and DAPI images were displayed in online supplemental figure S12. (I) Using IB analysis, protein expression in total lysates of samples from OVCA429 tumors treated with DMSO or low-dose SN-38 (5 µg/kg BW/mouse) in vivo were assessed with the indicated Abs. GAPDH represents loading controls. (J) ID-8 cells were transfected with specific siRNA targeting mouse c-Myc or STAT3, or JAK1 or control siRNA for 48 hours. Using IB analysis, protein expression in total lysates of these cells were detected with the indicated Abs. β-Actin represents loading controls. Abs, antibodies; DMSO, dimethylsulfoxide; IB, immunoblotting; IF, immunofluorescence; PD-L1, PD-L1; TME, tumor microenvironment.
SN-38 and combined regimens significantly suppress STAT3-pY705, c-Myc, and IL-6 protein levels in syngeneic ID8 tumors in vivo
To decipher the signaling mechanism underlying the SN38-mediated or combined regimens-mediated suppression of tumor progression and improving the survival rate of tumor-bearing mice, we investigated whether SN-38 or combined regimens regulated the expression of phosphor-STAT3 (STAT3-pY705) and IL-6, both of which have been shown to regulate the expression of PD-L1.30 31 Using IF analysis on primary tumor tissues as described previously, we showed that the treatments with SN-38 single-agent or combined regimens (PD1 Ab +SN38) potently reduced STAT3-pY705, IL-6, and c-Myc expression in syngeneic ID8 tumors (figure 7F–H; online supplemental figure S11 and S12). Similarly, using IB analysis, we confirmed that low-dose SN-38 markedly reduced STAT3-pY705, c-Myc, and PD-L1 protein levels, while SN-38 enhanced NKG2D and FOXO3 levels in human OVCA429 tumor tissues in vivo (figure 7I). In addition, to evaluate whether c-Myc and STAT3 are necessary for regulating PD-L1 protein levels in mouse tumor cells, we transfected ID-8 cells with specific siRNA targeting mouse c-Myc or STAT3 or JAK1 or control siRNA and performed IB analysis. Our data validated that silencing of c-Myc or STAT3 expression in ID-8 cells abrogated PD-L1 protein level in mouse ID-8 cells (figure 7J). These results suggest that c-Myc or STAT3 expression may be essential for promoting PD-L1 protein expression in tumor cells.
The positive association between PD-L1 protein level and c-Myc or STAT3 protein level in various primary human tumors is pathologically significant
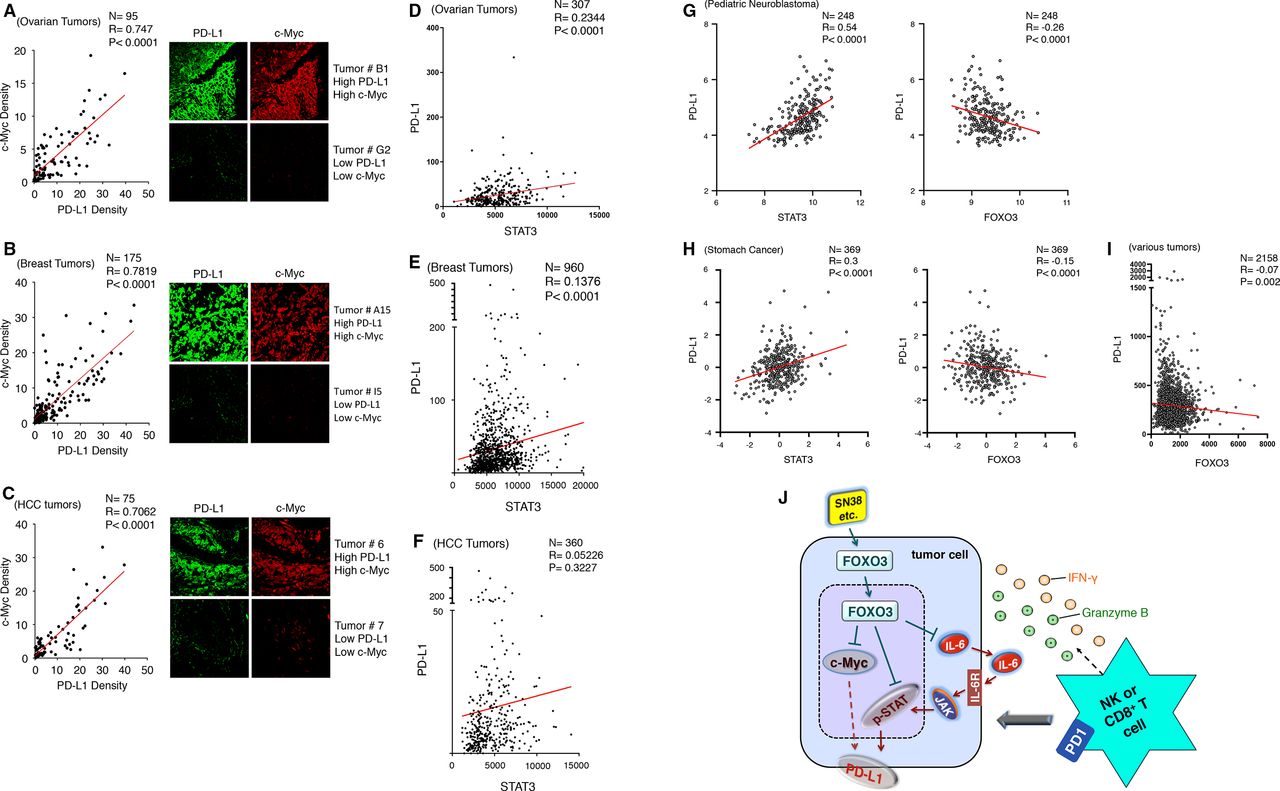
Since the SN-38 treatments reduced PD-L1 and c-Myc protein levels in tumors concurrently in our animal model (figure 7H), we assessed a correlation between PD-L1 and c-Myc expression in primary human tumors and whether the correlation was pathologically significant. Using dual IF analysis, we examined the protein expression of both PD-L1 and c-Myc in various primary human tumor tissues, which were TMAs of ovarian carcinoma, invasive breast carcinoma, and HCC, with a specific Ab against human PD-L1 or c-Myc and the stained cells were analyzed and quantified as described previously. Notably, our results showed that levels of PD-L1 protein were strongly associated with those of c-Myc protein in ovarian carcinoma (figure 8A; n=95, R=0.747, p<0.0001), invasive breast carcinoma (figure 8B; n=175, R=0.7819, p<0.0001), and HCC (figure 8C; n=75, R=0.7062, p<0.0001) specimens. Collectively, our results in figure 8A–C reveal, for the first time, that PD-L1 protein level strongly links to c-Myc protein level in patients with these indicated tumors. We also analyzed PD-L1 and STAT3 mRNA expression data in primary human ovarian, breast, HCC, and other tumor tissues available from The Cancer Genome Atlas datasets using cBioPortal.32 As shown in figure 8D–H, PD-L1 expression was positively associated with STAT3 expression in primary human ovarian, breast, HCC, and other tumor tissues. In addition, PD-L1 expression was inversely associated with FOXO3 expression in various primary human tumor specimens (figure 8G–I).
PD-L1 expression is very positively associated with c-Myc or STAT3 expression in patients with various tumors, and a model for the mechanism is proposed. (A–C) Using IF analysis, we determined the protein expression of PD-L1 and c-Myc in TMAs of OvCa (A), invasive BCa (B), and HCC (C) specimens. Each tumor TMA slide was incubated with anti-PD-L1 or anti-c-Myc Abs and followed by specific fluorescent secondary Abs and IF analysis, as described previously. (D–F) We analyzed both PD-L1 versus STAT3 mRNA expression data in human primary ovarian tumor (D), breast tumor (E), and HCC tumor (F) tissues from the Cancer Genome Atlas (TCGA) datasets using cBioPortal.32 PD-L1 expression was positively associated with STAT3 expression in ovarian ad breast tumors. P values between the PD-L1 group versus the STAT3 group were shown. (G and H) We analyzed PD-L1 versus STAT3 and PD-L1 versus FOXO3 mRNA expression data in human primary pediatric neuroblastoma and stomach cancer tissues from TCGA datasets. P values between the tested groups were shown. (I) We analyzed PD-L1 versus FOXO3 mRNA expression data in various human primary tumor tissues (n=2158) from TCGA datasets. P values between the tested groups were shown. (J) A schema depicts a proposed model for the FOXO3-mediated blocking dual c-Myc-PDL1 and STAT3-PD-L1 pathways by SN-38 to promote NK or CD8+ T cell antitumor immunity. Abs, antibodies; BCa, breast cancer; HCC, hepatocellular carcinoma; IF, immunofluorescence; NK, natural killer; OvCa, PD-L1, programmed death-ligand 1; TMA, tissue microarray.
Discussion
The present study shows that low-dose SN-38 or metformin significantly sensitizes unresponsive tumors to respond to anti-PD-1 therapy and increases the survival rate in the syngeneic mouse tumor models. A novel strategy for this therapeutic approach is based on the fact that SN-38 or metformin single-agent markedly engages NK or CD8+ T cells infiltrating the TME to trigger potent antitumor immune responses. The rationale for a combination regimen containing SN-38 and anti-PD-1 blockade is based on the notion that SN-38 significantly enhances PD-1 blockade-mediated recruitment of NK cells or CD8+ T cells into the TME and boosts this antitumor immunotherapy response. Therefore, activation of NK cells or CD8+ T cells by SN-38 restores the response of tumor cells to anti-PD-1 Ab treatment, which as single agent shows an insignificant or minimal effect on antitumor immunity in our syngeneic mouse model (figure 4A).
Because small-molecule (SM) drugs can modulate oncogenic signaling pathways to inhibit immune evasion mechanisms towards effective antitumor responses, it is suggested that the use of SM inhibitors to target oncogenic pathways is a crucial approach to enhancing the therapeutic effect of checkpoint blockade on cancer immunotherapy.33 Indeed, our results show that low-dose SN-38 compellingly reduces PD-L1 protein levels and increases FOXO3 tumor suppressor protein levels in tumor cells, resulting in enhancing anti-PD-1 antitumor efficacy. Silencing FOXO3 expression in tumor cells revokes the SN38-mediated suppression of PD-L1 protein expression (figure 7). In addition to PD-L1, our findings suggest that SN-38 potently reduces protein levels of c-Myc, phosphorylated STAT3-pY705 (pSTAT3), and IL-6 in mouse and human tumor cells. In contrast, low-dose SN-38 robustly promotes IFN-γ and granzyme B protein levels in the TME in vivo. Collectively, we have presented a schematic representation of a proposed working model where low-dose SN-38 (or metformin) suppresses the oncogenic c-Myc, pSTAT3, IL6, and PD-L1 signaling pathways in tumor cells through FOXO3 activation (figure 8J). Meanwhile, SN-38 alone or its combination with anti-PD1 Ab increased IFN-γ and granzyme B, possibly from activated NK or CD8+ T cells in the TME, to trigger NK or CD8+ T cell killing of tumors in the syngeneic mouse models (figure 6A,B).
IFN-γ is known as a major inducer of PD-L1 expression in various cancer cells.34–36 IFN-γ is primarily secreted by activated T cells and NK cells or other immune cells.36 IFN-γ plays a critical role in inducing T cell and NK cell trafficking into the TME and boosting tumor cell killing.36 Indeed, our data suggest that low-dose SN-38 engages activated mouse NK cells infiltrating into the mouse TME and inducing the secretion of mouse IFN-γ, which is detected in the adjacent areas of CD49b-positive NK cells (figure 2F,J; online supplemental figure S2A,B) and NK1.1-positive NK cells (figure 6A; online supplemental figure S7). Our data suggest that these tumor-infiltrated mouse NK cells may promote the secretion of mouse granzyme B, which is detected in the adjacent areas of NK1.1-positive NK cells (figure 6B; online supplemental figure S8). Our results also suggest that low-dose SN-38 promotes NKp46-positive NK cells invading the ID8 TME in our syngeneic mouse tumor model (figure 2H,I). Interestingly, NKp46 is a central NK cell-activating receptor, pivotal for target cell recognition and killing,37 and an essential receptor for activating NK cells to trigger tumor cell elimination.38 These reports further support our model of SN-38-mediated antitumor response by activated NK cells. Notably, patients with cancer not responding to anti-CTLA-4 blockade have been shown to carry deficiencies of certain genes in the IFN-γ pathway.39 This finding suggests that the IFN-γ signaling pathway may play a crucial role in modulating clinical response to particular cancer immunotherapies. Analyzing genetic defects in the IFN-γ signaling pathway may help predict acquired resistance to some immune-checkpoint therapies.
Interestingly, we have previously shown that FOXO3 activation by SN-38 or other pharmacological drugs markedly abrogates c-Myc protein,14 15 whose expression is strongly associated with PD-L1 expression in primary tumors from patients with OvCa, BCa, and HCC (figure 8A–C). In addition, c-Myc overexpression markedly correlated with PD-L1 expression in primary tumors and poor survival in patients with lung cancer.40 Because low-dose SN-38 notably reduces c-Myc protein level in tumor cells in a FOXO3-dependent manner,14 our findings imply that the SN-38-mediated suppression of c-Myc protein level may play a crucial role in PD-L1 downregulation in tumor cells in a FOXO3-dependent fashion. This notion is supported by a report showing that FOXO3 activation increases c-Myc phosphorylation and reduces c-Myc protein stability by FBW7-mediated ubiquitination and proteasomal degradation.41 In addition to c-Myc, our results suggest that the SN-38-mediated decrease of pSTAT3 and IL6 protein levels may be crucial for mitigating PD-L1 expression in tumor cells. This implication is supported by several reports indicating that the IL-6/JAK/STAT3 signaling pathway has a vital role in the upregulation of PD-L1 expression,30 31 and targeting the IL-6/JAK/STAT3 pathway by their inhibitors can stimulate antitumor immunity.42 Furthermore, it has been shown that upregulated HIF-1α expression correlated with enhanced PD-L1 expression in tumor cells and caused suppression of T-cell function in the TME.43 44 This report suggests that increased HIF-1α expression under hypoxic conditions may lead to immunosuppression in the TME. Interestingly, SN-38 or irinotecan has been found to suppress HIF-1α in tumor cells.45 46 These findings support our proposed model of using low-dose SN-38 to boost antitumor immune responses by inhibiting oncogenic signaling pathways in tumor cells.
Most cytotoxic T cells that mediate MHC-restricted cytotoxic responses are CD8+ T cells, which require antigen presentation associated with MHC class I antigens through antigen-presenting cells.47 48 However, NK cells are vital cytotoxic lymphocytes crucial for the innate immune system, which is independent of antigen presentation. Notably, it has also been suggested that NK cells play an important role in regulating cancer immunotherapy.19 20 However, the mechanism governing the control of NK cells in cancer immunotherapy remains largely unknown. Thus, this study is crucial for understanding NK cell-mediated killing of tumors by providing a novel mechanism underlying the synchronous mitigation of dual c-Myc-PDL1 and STAT3-PDL1 pathways by low-dose SN-38 in a FOXO3-dependent manner. Like CD8-positive T cells, NK cells also express immune checkpoint PD-1, and anti-PD-1 Ab can activate mouse NK cells to kill tumors in vivo.49 50 Notably, PD-1 expression is more abundant on NK cells with an activated and more responsive phenotype than NK cells with an exhausted phenotype. These findings suggest the importance of the PD-1/PD-L1 checkpoint axis in inhibiting NK cell-mediated antitumor immune responses in vivo. Thus, NK cell therapy has been evaluated in multiple clinical trials to treat patients with cancer.51 52
From the standpoint of cancer therapy, our findings of low-dose SN38-activated NK or CD8+ T cells are expected to have overarching implications for designing optimal combination cancer immunotherapies in the future. For instance, NK cells can also exert adaptive immune cell properties,53 and NK cell-mediated killing of target cells can activate robust antigen-specific CD8+ T cell mediated adaptive immunity.54 These findings suggest that our SN-38-promoted NK cell antitumor immunotherapy may activate NK cell killing in synergy with CD8+ T cell mediated adaptive immunity. SN-38 has been demonstrated to inhibit acute inflammatory response by blocking LPS-driven toll-like receptor 4 signaling in macrophages.55 It has also been shown that topoisomerase-1 inhibitors can inhibit the inflammatory genes and protect animals from LPS-induced death by regulating RNA polymerase II activity.56 Hence, it is plausible that low-dose SN-38 may play a dual role in immunomodulation by robustly activating the antitumor immune response and curbing acute inflammatory response, which may cause unwanted side effects. Thus, future interrogation of the role of low-dose SN-38 or metformin in acute inflammatory responses may help SN-38-enhanced anti-PD-1 or other ICBs cancer immunotherapy minimize adverse side effects. For human dosing, metformin is between 850 and 2550 mg/day (oral) and irinotecan is approximately 4.2 mg/kg (intravenous). However, it remains possible that low-dose SN-38 may regulate the levels of additional proteins aside from PD-L1, FOXO3, and other proteins as described previously (figure 8J) in tumor cells and perhaps other types of cells in the TME. Modulation of the levels of different proteins may also contribute to the observed antitumor immune response in vivo. Therefore, further investigations of this new approach to tackling ICB-resistant tumors with low-dose SN-38 (or other pharmacological drugs) to boost ICB efficacy in patients are necessary to provide significant insight into the signaling mechanisms underlying novel modulation of the tumor cells and immune cells to improve cancer immunotherapy. This new approach may optimize the therapeutic applications of overarching combination immunotherapies for healing many different types of intractable tumors.
Data availability statement
All data relevant to the study are included in the article or uploaded as supplementary information. All data relevant to the study are included in the article or uploaded as supplementary information. Upon formal publication, Data are available online on the website of the Journal for ImmunoTherapy of Cancer.
Ethics statements
Patient consent for publication
References
Supplementary materials
Supplementary Data
This web only file has been produced by the BMJ Publishing Group from an electronic file supplied by the author(s) and has not been edited for content.
Supplementary Data
This web only file has been produced by the BMJ Publishing Group from an electronic file supplied by the author(s) and has not been edited for content.
Footnotes
Contributors MC-TH and YMC conceived the conceptual ideas, planned and designed the studies. YMC, PPK, HW, W-BT, YQ, and MC-TH performed all the experiments. YMC, PPK, and YQ conducted animal studies under the supervision of MC-TH; HW conducted animal works under the supervision of BY and JWL. YMC, PPK, HW, W-BT, YQ, and MC-TH collected and analyzed data. JWL and BY provided essential resources and reagents and served as scientific advisors. MC-TH and YMC wrote the manuscript, and MC-TH edited the manuscript. MC-TH serves as the guarantor.
Funding This study was funded in part by grants 1R21CA201940-01A1 and 1R41CA183335-01 from the National Cancer Institute, National Institutes of Health (to MC-TH), grants W81XWH2010398, W81XWH2010260, and W81XWH-20-1-0883 from the Department of Defense, Congressionally Directed Medical Research Programs (to MC-TH), and grants 02-2014-046, 02-2016-033, and 02-2017-067 from the Avon Breast Cancer Crusade Program, the Avon Foundation for Women (to MC-TH). We would like to thank Jonathan S Berek for his generous research support, Jessica Ma and Yi Chen for their excellent technical support, and Thaïs Baert, Oliver Dorigo, Robert C Bast, Jr, and Xiaoyuan (Shawn) Chen for generously providing reagents.
Disclaimer The sponsors had no role in the design, conduct, or reporting of the study.
Competing interests None declared.
Provenance and peer review Not commissioned; externally peer reviewed.
Supplemental material This content has been supplied by the author(s). It has not been vetted by BMJ Publishing Group Limited (BMJ) and may not have been peer-reviewed. Any opinions or recommendations discussed are solely those of the author(s) and are not endorsed by BMJ. BMJ disclaims all liability and responsibility arising from any reliance placed on the content. Where the content includes any translated material, BMJ does not warrant the accuracy and reliability of the translations (including but not limited to local regulations, clinical guidelines, terminology, drug names and drug dosages), and is not responsible for any error and/or omissions arising from translation and adaptation or otherwise.