Article Text

Abstract
Background Prostate cancer is the second leading cause of cancer-related death in men in the USA; death occurs when patients progress to metastatic castration-resistant prostate cancer (CRPC). Although immunotherapy with the Food and Drug Administration‐approved vaccine sipuleucel‐T, which targets prostatic acid phosphatase (PAP), extends survival for 2–4 months, the identification of new immunogenic tumor-associated antigens (TAAs) continues to be an unmet need.
Methods We evaluated the differential expression profile of castration-resistant prostate epithelial cells that give rise to CRPC from mice following an androgen deprivation/repletion cycle. The expression levels of a set of androgen-responsive genes were further evaluated in prostate, brain, colon, liver, lung, skin, kidney, and salivary gland from murine and human databases. The expression of a novel prostate-restricted TAA was then validated by immunostaining of mouse tissues and analyzed in primary tumors across all human cancer types in The Cancer Genome Atlas. Finally, the immunogenicity of this TAA was evaluated in vitro and in vivo using autologous coculture assays with cells from healthy donors as well as by measuring antigen-specific antibodies in sera from patients with prostate cancer (PCa) from a neoadjuvant clinical trial.
Results We identified a set of androgen-responsive genes that could serve as potential TAAs for PCa. In particular, we found transglutaminase 4 (Tgm4) to be highly expressed in prostate tumors that originate from luminal epithelial cells and only expressed at low levels in most extraprostatic tissues evaluated. Furthermore, elevated levels of TGM4 expression in primary PCa tumors correlated with unfavorable prognosis in patients. In vitro and in vivo assays confirmed the immunogenicity of TGM4. We found that activated proinflammatory effector memory CD8 and CD4 T cells were expanded by monocyte-derived dendritic cell (moDCs) pulsed with TGM4 to a greater extent than moDCs pulsed with either PAP or prostate-specific antigen (PSA), and T cells primed with TGM4-pulsed moDCs produce functional cytokines following a prime/boost regiment or in vitro stimulation. An IgG antibody response to TGM4 was detected in 30% of vaccinated patients, while fewer than 8% of vaccinated patients developed antibody responses to PSA or prostate-specific membrane antigen (PSMA).
Conclusions These results suggest that TGM4 is an immunogenic, prostate-restricted antigen with the potential for further development as an immunotherapy target.
- antigens
- prostatic neoplasms
- immunogenicity
- vaccine
Data availability statement
Data are available in a public, open access repository. The datasets analyzed during the current study are available in the NCBI Gene Expression Omnibus repository, the Genotype-Tissue Expression Portal V7 data repository, the Functional Annotation of the Mammalian Genome data repository, the Human Protein Atlas repository, and the cBioPortal for cancer genomics.
This is an open access article distributed in accordance with the Creative Commons Attribution Non Commercial (CC BY-NC 4.0) license, which permits others to distribute, remix, adapt, build upon this work non-commercially, and license their derivative works on different terms, provided the original work is properly cited, appropriate credit is given, any changes made indicated, and the use is non-commercial. See http://creativecommons.org/licenses/by-nc/4.0/.
Statistics from Altmetric.com
Introduction
Prostate cancer (PCa) remains a major public health concern among men worldwide. Although the majority of patients present with indolent, localized disease and are thus suitable candidates for active surveillance, a significant fraction of men present with higher-grade disease that warrants primary treatment with surgery or radiation.1 Approximately 40% of patients with PCa recur after primary therapy and require further treatment with androgen-deprivation therapy (ADT), and the majority of recurrent patients eventually develop metastatic castration-resistant prostate cancer (mCRPC) for which treatment options are less effective.2 Multiple immunological approaches have been studied as therapeutic options for castration-resistant prostate cancer (CRPC),3 with limited success. In contrast to other tumor types, immunotherapy using immune checkpoint inhibitors (eg, anti-PD-1/PD-L1, and anti-CTLA-4) has shown limited responses in mCRPC to date.4 Conversely, the ability of the only therapeutic Food and Drug Administration-approved PCa vaccine, sipuleucel-T, to extend survival5–7 suggests that immunotherapy has potential in mCRPC. Due to the non-vital nature of the prostate gland, effective adaptive responses against prostate-restricted tumor-associated antigens (TAAs) such as prostatic acid phosphatase (PAP), prostate-specific antigen (PSA), prostate stem cell antigen (PSCA), transmembrane AMPA receptor regulatory protein (TARP), six transmembrane epithelial antigen of the prostate 1 (STEAP1), and prostate-specific membrane antigen (PSMA) are feasible therapeutic targets for PCa,3 4 8–10 although their clinical relevance remains unknown. The identification of novel prostate-restricted TAAs that induce de novo antitumor immune responses could guide the development of future immunotherapies. Here, we used a number of orthogonal approaches to identify transglutaminase 4 (TGM4) as a prostate-restricted TAA that is regulated in an androgen-dependent manner. The potential immunogenicity of this protein was verified using in vitro studies, as well as samples from a neoadjuvant clinical trial.11
Materials and methods
Patient samples
Serum samples from human patients with PCa were obtained with consent from patients treated with ADT alone (degarelix, 240 mg subcutaneous) or cyclophosphamide (200 mg/m2 intravenous) followed by granulocyte-macrophage colony-stimulating factor [GM-CSF] gene transduced irradiated prostate cancer vaccine cells (GVAX) and ADT in a neoadjuvant trial (NCT01696877) at the Johns Hopkins Sidney Kimmel Comprehensive Cancer Center (Baltimore, Maryland, USA).11 12 Men with high-risk localized PRAD, defined as clinical stage T1c-T3b, N0, M0 and a Gleason sum of ≥4+3 (grade group ≥3) in at least two cores were considered eligible if they were planning to undergo prostatectomy. All patients were required to have an Eastern Cooperative Oncology Group performance status of 0 or 1 and normal kidney, liver, and marrow function. Patients with nodal (N1) or distant (M1) metastases were excluded. Additional key exclusion criteria included prior immunotherapy or vaccine therapy for PCa, prior radiation, hormonal, or chemotherapy, autoimmune disease requiring corticosteroids, and known allergy to cyclophosphamide, GM-CSF, or granulocyte colony stimulating factor (G-CSF). All patients provided written, informed consent authorizing the collection of clinical data, serum and other biospecimens. Primary human peripheral blood mononuclear cells (PBMCs) from anonymous 35-year-old or older healthy male donors were acquired from the New York Blood Center.
Tissue acquisition and processing
All experiments using animals were performed according to protocols approved by the Institutional Animal Care and Use Committee at Columbia University Irving Medical Center. Wild-type mice of a hybrid 129/SvImJ and C57Bl/6J strain background at 12 months of age were used for immunofluorescence (IF) analyses. Briefly, lateral and dorsal prostate lobes, heart, bladder, kidney, liver, lung and spleen tissue were washed in ice-cold 1× phosphate-buffered saline (PBS) to remove excess blood, fixed in 10% formalin, and embedded in paraffin. Paraffin sections of 3–5 µm were cut using a microtome.
Protein expression
Protein expression for TGM413 and FOLH1/PSMA14 in human tissues was queried using the Human Protein Atlas repository available online (http://www.proteinatlas.org).15 16
Antibody profiling
Phage-ImmunoPrecipitation Sequencing (PhIP-Seq) antibody profiling was performed on 32 patients with PCa serum samples using a 90-aa peptide human proteome T7 phage display library as described previously.17 18 Briefly, 2 µg of IgG, based on ELISA measurement of total IgG, was mixed with 2.5×10¹⁰ particle forming units of the 90-aa human peptidome library and incubated at 4°C overnight. IgG-bound phages were then immunoprecipitated using 20 µL of protein A magnetic Dynal beads and 20 µL of protein G coated Dynal beads (Invitrogen). After three bead washes, the library DNA inserts were amplified for 20 cycles of PCR using Herculase II Polymerase (Agilent). A second 20-cycle PCR reaction was performed in order to add sample-specific DNA bar codes and P5/P7 Illumina sequencing adapters. Sequencing was performed on an Illumina HiSeq 2500 in rapid mode (50 cycles, single-end reads).
Transcription profile of prostate luminal epithelial cells following androgen-induced regression/regeneration of the prostate
The transcription profile of Castration-Resistant Luminal Epithelial Cells (CRLECs) was evaluated as previously described.19 Briefly, 12-week-old male Hoxb13-GFP mice carrying the Hoxb13-rtTA transgene and a tetracycline operator–histone 2B-green fluorescent protein, which results in GFP expression restricted to luminal epithelial Hoxb13+ cells,20 were castrated via bilateral orchiectomy. A cycle of prostate regression/regeneration was induced by allowing murine prostates to regress for 6 weeks to reach the fully involuted state. Mice were randomized to untreated, ADT or ADT-treated followed by testosterone repletion (ADT+TR) treatment groups. Testosterone was administered for 4 weeks for prostate regeneration by subcutaneous silastic implants yielding physiological levels of serum testosterone. All mice received 2 mg/mL of doxycycline (DOX; Sigma) in the drinking water to induce GFP expression20 under the control of the luminal epithelial promoter, Hoxb13, 1 week prior to euthanization. CRLE cells were isolated based on their GFP+ expression and CD45−CD11b−F4/80−CD24+CD49fint status by flow sorting on a DakoCytomation MoFlo (online supplemental figure 1A, GSE171490). Differential gene expression was computed using the R limma package.21 Transcriptional distribution of Log2-fold change (FC) for each gene in ADT versus untreated samples were normalized to z-scores. z-score values were obtained by scaling the data for each gene in each sample to (expression−mean expression across all genes)/(standard deviation of expression across all genes). The expression of androgen-responsive genes between ADT +TR/ADT samples was further evaluated by Log2 FC. Androgen-responsive gene signature was defined by the differential analysis of murine CRLECs from GFP+ luminal prostate epithelial cells comparing ADT versus untreated and ADT versus ADT +TR groups and included all differentially expressed genes with an ADT Log2 FC below the 0.005 percentile and a Bonferroni-corrected p<0.01 (online supplemental table 1), as well as a set of known androgen-responsive genes (Klk1b8, Fkbp5, Nkx3.1, and Tmprss2). Statistical analysis was performed in R,22 and plotting was done using the ggplot2 R package V.3.1.0.23
Supplemental material
IF staining
Antigen retrieval was performed on paraffin sections by boiling the slides in citrate-based antigen unmasking buffer for 45 min (Vector Labs H3300), then letting them gradually cool for 30 min. The slides were washed in 1× PBS twice to remove the buffer, then blocked in 5% animal serum for 1 hour. Primary antibody coating was performed by incubating the sections with Tgm4 (1:100; Invitrogen), Msmb (1:100; Abclonal), CK5 (1:500; Biolegend), and/or CK8/18 (1:250; developmental studies hybridoma bank: DSHB) primary antibodies overnight at 4°C. Then, the slides were washed twice with 1× PBS and incubated with Alexa Fluor secondary antibodies (Life Technologies) for 1 hour. Finally, the sections were washed twice in 1× PBS, stained with 4’,6-diamidino-2-phenylindole (DAPI), and mounted (Vector Labs H-1200). Fluorescent images were acquired using a Leica TCS SP5 confocal microscope and analyzed using ImageJ, as described previously.24
Quantification of serum testosterone
Whole blood was collected from the tail vein and allowed to clot for 1 hour at 4°C. Serum was obtained by centrifuging (1000×g for 30 min) and collecting the supernatant. Sera were stored at −80°C prior to analysis. Testosterone concentration was determined by ELISA according to the manufacturer’s instructions (Enzo, Farmingdale, New York, USA).
Transcriptional analysis across normal and cancer tissues
The expression profile of a subset of androgen-responsive genes was evaluated in publicly available dataset from mice (RIKEN FANTOM5)25 and human (Genotype-Tissue Expression: GTEx)26 normal tissues (prostate, brain, colon, liver, lung, skin, kidney, and salivary gland), as well as in lineage-marked benign or tumor prostate epithelial cells from transgenic mice (GSE39509).27 For the later, we used RNA-seq data from luminal origin tumors of Nkx3.1CreERT2/+, Ptenflox/flox, R26RYFP/+ mice that were uninduced (benign), or at 3 months after induction. For tamoxifen induction, mice were administered 9 mg/40 g tamoxifen (Sigma) suspended in corn oil, or vehicle alone for negative controls, by oral gavage once daily for four consecutive days. In all presented boxplots, the medians for relative gene expression are shown. The ‘hinges’ represent the first and third quartiles. The whiskers are the smallest and largest values after exclusion of outliers (greater than the 75th percentile plus 1.5 times the interquartile [IQR], or less than 25th percentile minus 1.5 times the IQR). The expression levels of the complete signature of androgen-responsive genes, including KLK3/PSA, FKBP5, NKX3.1, and TMPRSS2, as well as the prostate-restricted TAAs: STEAP1 and TARP, were also evaluated. The statistical analysis was performed in R22 and plotting was done using the ggplot2 R package V.3.1.0.23
In addition, TGM4 expression was plotted across human cancer types in The Cancer Genome Atlas (TCGA) database (n=11 284 samples), including 558 primary prostate adenocarcinomas (PRADs), and across an independent dataset that includes primary PRADs with clinical information on time to biochemical recurrence (n=218, GSE21032).28 Biochemical recurrence was defined as a PSA of ≥0.2 ng/mL. Following radical prostatectomy, patients were followed up with history, physical exam, and serum PSA testing every 3 months for the first year, 6 months for the second year, and annually thereafter. The subset of primary PCa samples from this dataset was tested for association of TGM4 expression with survival by Cox regression. Optimal cutpoint for TGM4 selection was determined by maximizing the log-rank statistic using the R survminer package.29
Relative expression was quantified accordingly to the normalization methods used in the different publicly available databases analyzed here. RNASeq data from RIKEN FANTOM5 and GTEx were normalized to Log10 (transcripts per million: TPM), while RNASeq data from the GSE39509 dataset was normalized to fragments per kilobase million (FPKM) rather than TPM. Raw, un-normalized RNASeq data from TCGA were normalized to Log10 (TPM+1). Microarray data from GSE21032 was normalized with circular binary segmentation and analyzed with the statistical method RAE as previously described.28
Monocyte isolation and DC maturation
PBMCs from 10 anonymous healthy male donors ≥35 years of age obtained from the New York Blood Center were isolated using Lymphoprep and SepMate PBMC isolation tubes (STEMCELL Technologies). Untouched classical monocytes (CD14+CD16−) were then isolated from the PBMC fraction using magnetic beads following the manufacturer’s instructions (Pan Monocyte Isolation Kit; Miltenyi Biotec). Following density gradient isolation, monocytes were resuspended in media containing IL-4 (1000 IU/mL) and GM-CSF (1000 IU/mL) at a concentration of 2×10⁶ cells /mL and cultured for 3 days. Cells were maturated for 2 days by adding lipopolysaccharides to a final concentration of 500 IU/mL (Sigma). moDCs were stimulated with 1 µg/mL of whole protein (TGM4, PAP, or PSA; Fisher Scientific and BioLegend) or viral peptide-libraries (CEFT or pp65; JPT Peptide Technologies) overnight before coculturing with autologous T cells.
Antigen-driven T-cell purification and expansion
Functional assays of protein-stimulated T-cell expansion were performed for 10 healthy male donors. On day 0, naïve T cells (CCR7+CD45RA+) were isolated from PBMCs by negative selection following the manufacturer’s instructions (Naïve Pan T-Cell Isolation Kit; Miltenyi Biotec). Naïve T cells were cocultured with antigen-pulsed moDCs at a 1:10 ratio in cultured media (1:1 mix of AIM-V media and RPMI1640 (Thermo Fisher) with 10% human serum (Gemini Bio), 1% penicillin streptomycin (Life Technologies) and 1% GlutaMAX (Life Technologies)) supplemented with IL-7 (25 ng/mL, Peprotech). IL-2 (25 ng/mL, Peprotech) was added to the cultures 72 hours following priming of naïve T cells. Media were supplemented every 1–3 days with fresh culture media containing the same concentrations of IL-2 and IL-7. Every 10 days, cells were coincubated with a fresh set of antigen-pulsed moDCs. Cells were harvested and washed twice with PBS on day 30. As positive controls, cells were stimulated with a mixture of pathogen-associated peptides, CEFT pool and pp65 (JPT Peptide Technologies). Cells were stained for fluorescence-activated cell sorting (FACS) analysis 10 days after the last stimulation, and also stimulated with antigen-pulsed moDCs for 12 hours to evaluate the effect of activation markers on expanded T cells following stimulation.
Flow cytometry
Prior staining, cells were Fc-blocked with purified rat anti-mouse CD16/CD32 (Clone: 2.4 G2, Becton Dickinson BD) for 15 min at room temperature (RT). Dead cells were discriminated using the LIVE/DEAD (L/D) fixable viability dye eFluor 506 dead cell stain kit (Thermo Fisher) and samples were stained for extracellular and intracellular markers. The following antibodies were used: CD3 (UCHT1), CD4 (A161A1), CD8 (SK1), CCR7 (3D12), CD45RA (MEM-56), CD69 (FN50), CD28 (CD28.2), CD27 (M-T271), CD161 (DX12), PD-1 (EH12.1), TIM3 (F38-2E2), CTLA-4 (L3D10), TBET (eBio4B10), GATA3 (TWAJ), RORg(t) (REA278), FOXP3 (PCH101), TCF1 (C63D9), EOMES (WD1928), IL-2 (MQ1-17H12), TNF-α (MAb11), IFN-γ (4S.B3), IL-4 (MP4-25D2), and Grz-B (N4TL33). Extracellular staining was performed at room temperature for 30 min. For intracellular staining, cells were fixed and permeabilized using BD Perm/Wash (BD Biosciences) at RT for 45 min. Cells were boosted for the final time with protein-pulsed moDCs for 12 hours to evaluate their activation status. For intracellular cytokine staining, cells were stimulated with PMA (50 ng/mL) and ionomycin (500 ng/mL) for 4 hours in the presence of protein transport inhibitor cocktail (eBiosciences). Gates for transcription factors were determined by fluorescence minus one (FMO) controls. Staining was visualized by fluorescence-activated cell sorting (FACS) analysis using a Cytek Aurora (Cytek Biosciences) and analyzed using FlowJo (Flowjo LLC) in combination with R packages uniform manifold approximation and projection (UMAP) V.0.2.0.030 and FlowSOM V.1.14.1.31
Multiparametric flow cytometry analysis
Following compensation, flow cytometry standard (FCS) files underwent standard preprocessing to remove debris, doublets and to enrich for live cells. Live, single cells were analyzed by manual gating and unsupervised computational methods in parallel.
For manual gating, T cells were identified based on CD3 expression followed by CD4 and CD8 extracellular markers using FlowJo V.10.6. Naïve, effector, CM, and EM subpopulations within CD4 and CD8 T cells were identified based on CD45RA and CCR7 expression. Antigen-driven T cells were quantified following three rounds of prime/boost autologous stimulation based on CD69, TBET, CD27, CD28, PD1 and TIM3, expression by manual gating.
Unsupervised computational analysis was performed separately for unstimulated and stimulated samples. In each case, 10,000 cells of postgated live, single CD4+ or CD8+ T cells from each of the 10 healthy donors were randomly selected using the DownSampleV3 plugin in FlowJo. Subsequently, unsupervised clustering was performed on the expression values of the activation and functional markers separately using the FlowSOM algorithm,31 which uses a self-organizing map followed by hierarchical consensus metaclustering to detect cell populations. Default parameters and a predetermined number of 10 clusters were used. The median levels of the activation and functional markers across all cells per cluster were visualized in separate heatmaps. The subpopulations between clusters were based on the expression levels of activation and functional markers after applying the non-linear dimensionality reduction technique UMAP of the randomly selected cells using the R package UMAP for visualization of the multiparametric data.30 The cells were colored according to their FlowSOM cluster membership.
ELISpot assays
TGM4-specific IFN-γ production by primed T cells was determined using following the manufactures recommendations (Mabtech). Briefly, T cells (1×10⁴ cells/well) were stimulated at 37°C in 5% CO2 for 48 hours with either TGM4-pulsed moDCs or unpulsed moDCs. Medium alone or anti-CD3 (100 ng/mL)+anti-CD28 mAb (5 ug/mL) were used as negative and positive controls, respectively. After revelation using BCIP/NBT solution, spots were counted using the Autoimmun Diagnostika GmbH iSpot reader (ELR08IFL). Results are presented as the mean of triplicate wells; numbers of spot-forming units are expressed for 104 cells.
Antibody analysis
PhIP-Seq data analysis was performed as described in the phip-stat package (https://github.com/lasersonlab/phip-stat). Reads were aligned to the phage library insert sequences using bowtie232 to generate a matrix of reads per million (RPM) values for each peptide in each sample (paired pre-treatment and post-treatment sera). Using the phip-stat call-hits command with the ‘--fdr 0.05’ option, we defined a set of statistically significant ‘hits’ where the RPM value was significantly higher than a set of control wells loaded with beads only. We also calculated the Log2 FC in post-treatment reactivity compared with pretreatment repertoire, with Laplace smoothing applied to avoid NA FC values from zero-inflated matrix (online supplemental figure 4A). We further analyzed only peptides with a post-treatment ‘hit’, such that RPM value is higher than the statistical baseline (online supplemental figure 4B). For PhIP-Seq Log2 FC analysis, RPM values were aggregated across peptides corresponding to each gene before computing FC for this analysis.
Supplemental material
We generated a heatmap of sample-by-sample on-treatment versus pretreatment Log2 FC for the set of genes defined as androgen-responsive within patients with PRADs treated with ADT only or with GVAX followed by ADT treatment. This heatmap includes all androgen-responsive proteins profiled with at least one hit by PhIP-Seq. Relationship between immune response to androgen-responsive TAAs and biochemical recurrence-free survival among patients with PRAD in either treatment group was assessed by Kaplan-Meier curve with Cox regression p value as well as by Fisher exact test comparing frequency of immune response to any androgen-response gene in patients with recurrence versus patients without recurrence. All comparisons were performed in the R statistical computation environment.22 Patients with positive Log2 FC for any androgen-responsive TAAs were considered to mount an immune response to any androgen-responsive TAAs. Androgen-responsive genes were defined in the differential analysis of murine CRLECs from GFP+ luminal prostate epithelial cells, combined with a set of known androgen-responsive genes (Klk1b8, Fkbp5, Nkx3.1, and Tmprss2).
Immunoprecipitation of recombinant protein with patient sera
Using previously determined IgG concentrations (see Antibody profiling), ~2 μg of IgG was added with 1 μg of either recombinant human TGM4 (R&D Systems) or 1 μg of recombinant human ACPP/PAP (NovisBio), respectively, and brought to a total reaction volume of 100 μL with 1× PBS. Samples were incubated overnight at 4°C while rocking to facilitate specific antigen–antibody binding. Protein A and protein G conjugated metal beads (Invitrogen) were then added and allowed to incubate overnight at 4°C while rocking to facilitate protein A/G binding to the IgG-Fc region. Samples were washed 3× with 200 μL 1× PBS, placing the samples on a magnet for 5 min between each wash. Samples were then resuspended in 20 μL of H2O and 20 μL of 2× Laemmli buffer+beta-mercaptoethanol (BME), for a total volume of 40 μL of 1× Laemmli buffer+BME. Samples were then boiled at 95°C for 10 min, then placed on a magnet, and the supernatant was then loaded on to a 4%–15% Mini-PROTEAN TGX Precast Protein gels (Bio-Rad) and run at 250 V for 25 min in 1× Tris/glycine/sodium dodecyl sulphate buffer. Protein was then transferred to a 0.2 m nitrocellulose membrane (Bio-Rad) using the Bio-Rad Trans-blot turbo transfer system. Membranes were then blocked in 5% BSA in 1×0.1% tween 20-tris-buffered saline (TBST) for 30 min at room temperature. Membranes were then exposed to either sheep–anti-human TGM4 primary (1:500; R&D Systems) or mouse anti-human PAP Primary (2 μg/mL; R&D Systems) overnight at 4°C while rocking. Membranes were washed 3× with 1×0.1% TBST for 5 min per wash. Membranes were then exposed to either horseradish peroxidase-conjugated anti-sheep IgG (1:10,000; for TGM4 membranes, Invitrogen) or Starbright 520-conjugated anti-mouse IgG (1:5000; for PAP membranes, Bio-Rad) for 1 hour at room temperature while rocking. Membranes were washed 3× with 1×0.1% TBST for 5 min per wash. TGM4 membranes were then exposed to 10 mL of substrate for 5 min before imaging using the ChemiDoc MP, set to auto-optimization. PAP membranes were imaged immediately following the wash step using the ChemiDoc MP, set to auto-optimization.
Band adjusted volume intensity was determined using Image Lab software (Bio-Rad, V.6.0.1 build 34, Standard Edition). Briefly, lanes were identified on each membrane using the autodetect feature and manually reviewed and modified to ensure accuracy. After lane identification, individual bands were identified using the autodetect feature, and similarly manually reviewed to ensure accuracy. After confirming the correct bands via molecular weight, adjusted volume intensity data were collected from the software and used for analysis. The adjusted volume intensity unit subtracts background signal from the final intensity unit.
Statistical analysis
Statistical analysis was performed using R V.3.6.122 or Prism V.7 (GraphPad). All statistical tests performed were two-sided with Bonferroni multiple-testing correction where applicable. Tests were considered statistically significant at p values of ≤0.05 (*), 0.01 (**), 0.001 (***) and 0.0001 (****).
Results
Castration-resistant luminal epithelial cells (CRLECs) upregulate putative prostate antigens
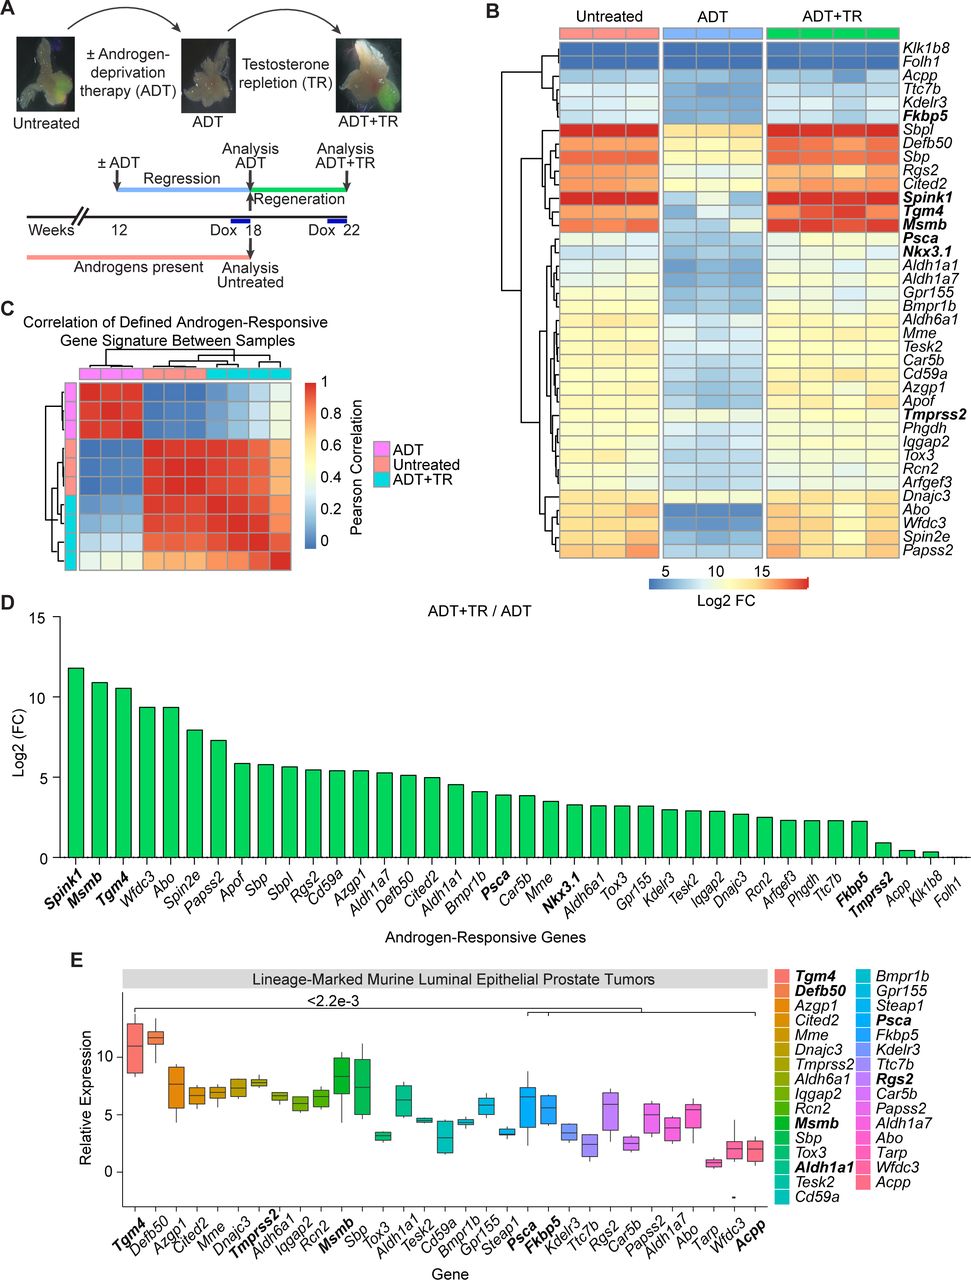
Prior work showed that the murine prostate gland contains a population of CRLECs that is sufficient to regenerate prostatic architecture following consecutive rounds of androgen deprivation/repletion and which is the likely population of origin for PCa.33 This population shares many features with castration-resistant prostate tumor cells.34–36 To screen for potential prostate-restricted TAAs expressed by CRLECs, we quantified gene expression using a transgenic mouse model in which green fluorescent protein (GFP) expression is driven by the luminal-restricted Hoxb13 promoter upon doxycycline (DOX) administration. Using cells sorted from these animals, we quantified the transcriptional profile of CRLECs following an androgen deprivation/repletion cycle (figure 1A and online supplemental figure 1A,B, GSE171490).19 We next defined a signature for androgen-responsive genes in our dataset as the intersection of genes differentially expressed when comparing untreated versus ADT-treated samples and ADT-treated versus ADT-treated followed by testosterone repletion (ADT+TR) samples. To derive this gene signature, we used an ADT Log2-fold change (FC) below the 0.005 percentile and a p value below 0.01 (figure 1B, online supplemental table 1). We then correlated each sample pair in terms of their expression of this gene signature, to quantify the degree of similarity between untreated and androgen-repleted samples (figure 1). Samples exposed to androgens showed a pairwise Pearson correlation of the androgen-responsive gene signature greater than 0.8 between samples from untreated animals and ADT-treated animals followed by TR, confirming the genetic program re-established by testosterone treatment (figure 1C). Conversely, the androgen-responsive gene signature in either untreated or testosterone-repleted animals correlated poorly with the signature in androgen-deprived animals, further confirming the relative specificity of this signature (figure 1C). Consistent with prior data,37–42 we found that ADT downregulated the expression of several androgen-responsive genes including Psca, Nkx3.1, Fkbp5, and Tmprss2 (figure 1B and online supplemental figure 1C,D). The relative androgen dependence of these transcripts is shown in figure 1D, with Spink1, Msmb, and Tgm4 upregulated 3500-fold, 1900-fold, and 1500-fold, respectively, by androgen repletion, while androgen repletion upregulated the expression of Psca by 15-fold, Nkx3.1 by 10-fold, Fkbp5 by 5-fold, and Tmprss2 by 2-fold. These results support a role for androgens in the regulation of Spink1, Msmb, and Tgm4 genes as part of an androgen-responsive gene signature in CRLECs.
Supplemental material

Putative prostate antigens are expressed by murine CRLECs in an androgen-dependent manner. (A) Schematic representation of androgen-induced prostate regression/regeneration in Hoxb13-rtTA|TetO-H2BGFP transgenic mice to model the cells of origin of prostate cancer (CRLECs). Top: representative fluorescent images of GFP+ murine luminal epithelial cells to ADT and TR in murine prostates. Bottom: mice were treated with ADT (androgen depletion), testosterone pellets (androgen repletion), and DOX as indicated in the diagram and described in the Materials and methods section. (B) Differential expression profile of GFP+ CRLECs isolated from the prostates of mice left untreated, treated with ADT, or treated with ADT plus androgen/TR (n≥3 per group). Heatmap showing androgen-responsive genes downregulated by ADT compared with both untreated and ADT+TR samples (n≥3 per group, GSE171490). (C) Heatmap showing pairwise Pearson correlation of androgen-responsive gene expression between CRLECs isolated from each mouse as described previously. Androgen-responsive gene signature (shown in B) with pairwise correlation between mice shown computed across all genes and annotated by treatment group. (D) Log2 FC in expression of androgen-responsive genes in GFP+ CRLECs isolated from the prostates of mice treated with ADT in combination with androgen/TR compared with ADT alone. (E) Relative expression of androgen-responsive genes, as well as Tarp and Steap1, in prostate tumors originated from luminal epithelial cells isolated from lineage-marked Nkx3.1CreERT2/+, Ptenflox/flox, R26R-YFP/+ transgenic mice (n≥5, GSE39509).27 Boxplots of Log10 (FPKM) normalized gene expression are shown (n=6). (B,D) Selected genes for each comparison are defined as genes with ADT Log2 FC below the 0.005 percentile and p<0.01, in addition to a set of known androgen-responsive genes from the literature (Acpp, Klk1b8, Fkbp5, Nkx3.1, Tmprss2, and Folh1). Wilcoxon test was used for statistical analysis between Tgm4 and each indicated gene; p values are displayed. ADT, androgen-deprivation therapy; CRLEC, castration-resistant luminal epithelial cell; DOX, doxycycline; FC, fold change; TetO-H2BGFP, tetracycline operator–histone 2B-green fluorescent protein; Tgm4, transglutaminase 4; TR, testosterone repletion.
We next applied this signature to an independent dataset that we previously generated in which epithelial lineage-marked YFP+ tumor cells from the prostates of transgenic mice expressing yellow fluorescent protein (YFP) under the luminal-restricted Nkx3.1 promoter were profiled (GSE39509).27 These data also showed Tgm4 to be among the most highly overexpressed genes in prostate tumors with a luminal origin (figure 1E). Together, these finding support the notion that TGM4 is an androgen-responsive transcript expressed by prostate luminal epithelial cells, including CRLECs, in multiple datasets.
TGM4 shows prostate-restricted expression in human and murine datasets
To avoid inducing immunologically off-target effects, TAAs should have high expression in tumor tissue and minimal or undetectable expression in normal tissues. To evaluate which of the androgen-responsive genes are prostate tissue restricted, we interrogated two databases of gene expression from murine (RIKEN FANTOM5)25 and human (GTEx)26 normal tissues. We found low expression levels of Defb50, Msmb, Sbp, Fkbp5, Spink1 and Tgm4 in all murine extraprostatic tissues evaluated (figure 2A). Further immunostaining for Tgm4 and Msmb in benign prostate, heart, bladder, kidney, liver, lung and spleens tissues corroborated that Tgm4 expression is minimal in non-prostatic tissues. Msmb protein, however, is expressed in the spleen, heart, kidney, and lung, with the greatest expression observed in the bladder (figure 2B). Human data showed significant FKBP5 and SPINK1 expression in lung, liver, skin, colon, kidney, and salivary gland samples; these were greater than those for TGM4 (figure 2C). Of note, DEFB50, MSMB, and SBP were not included in the human database. The expression levels of the established prostate-restricted targets FOLH1/PSMA, KLK3/PSA, and PSCA were high in human prostate; however, medium to low levels of expression were also observed in extraprostatic tissues. Specifically, brain, lung, liver, and kidney showed intermediate levels of FOLH1/PSMA expression at the RNA level (figure 2C) and high expression in kidney at the protein level (online supplemental figure 2), whereas TGM4 showed high specificity for prostate tissue. Detectable expression levels of PSCA and ACPP/PAP were found in human skin, lung and kidney tissues, and both PSCA and ACPP/PAP expression were significantly higher than that of TGM4 in these extraprostatic tissues (figure 2C). Expression of additional prostate-restricted TAAs, including TARP and STEAP1, was also observed in both murine and human prostates, although at lower levels than TGM4 (figure 2). While STEAP1 expression was present in almost all the human tissues analyzed (lung, liver, skin, colon, kidney, and salivary gland), extraprostatic TARP expression was only observed in the lung, kidney, and salivary gland (figure 2C). In summary, these data indicate that TGM4 is generally not expressed at the message or protein level in non-prostate tissues, further supporting its investigation as a potential prostate-restricted TAA.
Supplemental material

Expression of putative prostate antigens is restricted to the prostate in both mouse and humans. (A) Relative expression of androgen-responsive genes, as well as Tarp and Steap1, across normal murine tissues. Boxplots of Log10 (TPM) normalized gene expression in prostate (n=1), brain (n=9), colon (n=1), liver (n=10), lung (n=9), skin (n=2), kidney (n=7), and salivary gland (n=1) from RIKEN FANTOM5 are shown, and genes are ordered by decreasing expression in murine prostate. (B) IF images of selected markers in adjacent sections from indicated mouse tissues—the prostate lobes shown are dorsal prostate lobes for Tgm4 and lateral prostate lobes for Msmb. Scale bars indicate 50 µm. (C) Relative expression of androgen-responsive genes, as well as TARP and STEAP1, across normal human tissues. Boxplots of Log10 (TPM) normalized gene expression in prostate (n=152), brain (n=1671), colon (n=507), liver (n=175), lung (n=427), skin (n=1203), kidney (n=45), and salivary gland (n=97) from GTEx are shown. Wilcoxon test was used for statistical analysis between TGM4 and each indicated gene; p values are displayed. GTEx, Genotype-Tissue Expression; IF, Immunofluorescence; TGM4, Transglutaminase 4.
TGM4 expression correlates with PCa recurrence
We next studied the levels of TGM4 expression in primary PCa and other human cancer types included in The Cancer Genome Atlas (TCGA). Consistent with data from lineage-marked murine luminal epithelial prostate tumors (figure 1E), the highest levels of TGM4 expression were found in prostate adenocarcinomas (PRADs, figure 3A). We next tested whether TGM4 expression in primary tumors is associated with disease progression in an independent dataset of PRADs (GSE21032). This analysis of differential TGM4 expression revealed that patients whose primary tumors had higher expression of TGM4 showed a significant decrease in time-to-PSA recurrence when compared with patients with low TGM4 expression in their primary tumors using an optimal cutpoint determined by maximizing the long-rank statistic (figure 3B,C). These data support the notion that TGM4 expression may correlate with poor prognosis in PCa.43

TGM4 expression is maintained by prostate tumor cells. (A) Relative expression of TGM4 across human cancer types in TCGA database, including 558 primary PRADs.73 Boxplots of Log10 (TPM) normalized gene expression are shown, with cancer types ordered by decreasing TGM4 expression. (B) Optimal cutpoint for TGM4 expression. Top: distribution of TGM4 expression across primary PRADs (n=218, GSE21032).28 Bottom: the overall log-rank p value for TGM4 expression is plotted. A vertical line is drawn at the optimal cutpoint of 843.21. (C) Kaplan-Meier curves comparing biochemical recurrence-free survival of patients with PRADs, with log-rank p value reported from multiple Cox regression of biochemical recurrence-free against TGM4 expression levels (high TGM4, n=24; low TGM4, n=107). Biochemical recurrence was determined as an increase in PSA serum levels of ≥0.2 ng/mL on two occasions as described in the Materials and methods section. PRAD, prostate adenocarcinoma; TCGA, The Cancer Genome Atlas; TGM4, Transglutaminase 4.
Prostate-restricted TAA TGM4 induces an in vitro CD8+ T-cell response when presented by autologous monocyte-derived DCs
To further determine whether TGM4 could serve as a potentially targetable TAA, we tested whether T-cell responses to TGM4 could be induced in vitro. For these experiments, naïve T cells purified from the peripheral blood mononuclear cells (PBMCs) of healthy male donors (n=10) were individually cocultured with autologous monocyte-derived dendritic cells (moDCs) pulsed with either full-length protein TAAs (PAP, PSA, and TGM4) or a positive control comprised of a viral peptide-library (pp65 and CEFT - Cytomegalovirus, Epstein-Barr virus, Influenza virus and Clostridium tetani) in a 30-day culture system (figure 4A,B). To analyze responses, we used multiparametric flow cytometry to quantify antigen-driven expansion of CD8 T cells and identified eight distinct populations using self-organizing maps for clustering analysis (FlowSOM; figure 4C,D). Of these, Pop6 appeared to represent central memory (CM) CD8 T cells and Pop4 naïve CD8 T cells (figure 4D). Antigen-driven expansion of effector memory (EM) CD8 T cells was reflected by Pop5, which upregulated the self-renewing transcription factor TCF1 and the interleukin (IL)-7 receptor (CD127) (figure 4D). The expansion of both activated CM and EM CD8 T cells was confirmed poststimulation (figure 4E,F). Importantly, activated (CD69+) CD27+CD28+ memory CD8 T cells expanded to a significantly greater degree in cocultures with TAA-pulsed moDCs than with the positive control viral antigens (figure 4E,F). Accordingly, higher percentages of CM and EM expressed PD-1 and TIM3 when stimulated by TAA-loaded moDCs; in this setting, these molecules likely represent early activation markers rather than markers of exhaustion (figure 4G). Additional manual gating for the EM CD8 T-cell population expressing the proinflammatory transcription factor TBET (Pop 1, figure 4D) was performed (figure 4H). Here, we found that TGM4-pulsed moDCs drove the expansion of TBET+-activated EM CD8 T cells to a significantly greater extent than PAP-pulsed and PSA-pulsed moDCs, but to a degree similar to the viral control antigens, CEFT and pp65 (figure 4I). Furthermore, TBET+ activated EM CD8 T cells primed with TGM4-pulsed moDCs produced canonical effector cytokines (IL-2, tumor necrosis factor alpha (TNF-α), interferon gamma (IFN-γ), and granzyme-B) following stimulation (figure 4J,L). ELISpot assays confirmed activation, with significant IFN-γ production noted after an in vitro prime/boost regimen with TGM4-pulsed moDCs (online supplemental figure 3). Taken together, these findings show that donor-derived naïve CD8 T cells expand and differentiate following TGM4 recognition and suggest that this prostate-restricted TAA could potentially be more immunogenic than either PAP or PSA.
Supplemental material

TGM4 induces CD8 T-cell activation and expansion in vitro. (A) Schematic representation of the 30-day prime/boost coculture of autologous moDCs and naïve T cells. (B) Representative images of differentiated moDCs. 4X (left) and 40X (right) magnification. (C) Differential expression of functional markers on expanded populations of CD8 T cells following coculture with autologous protein-pulsed moDCs. Heatmap showing unsupervised clusters determined with the FlowSOM algorithm as described in the Materials and methods section. (D) Expanded CD8 T-cell populations defined by FlowSOM (in C) were projected onto UMAP space as described in the Materials and methods section. Colors correspond to FlowSOM populations. (E) Fold change on activated CD69+CD27+CD28+ EM CD8 T cells (left) and CM T cells (right) following the last 12-hour stimulation in expanded T cells. (F) Activated CD69+CD27+CD28+ cells as a percentage of EM CD8 T cells (left) and CM CD8 T cells (right) following in vitro expansion (as in E). (G) PD1+TIM3+ CD69+CD27+CD28+ cells as a percentage of EM CD8 T cells (left) and CD8 T cells (right) following in vitro expansion (as in E). (H) Gating strategy used to manually analyze TBET+ in activated CD69+CD28+ EM CD8 T cells defined as CCR7−CD45RA− following coculture with autologous protein-pulsed moDCs. (I) TBET+ cells as a percentage of activated CD69+CD28+ EM CD8 T cells in expanded T cells (gated as in C). (J) Schematic representation of priming of naïve T cell with autologous TGM4-pulsed moDCs stimulated with PMA/ionomycin 4 hours prior analysis by flow cytometry. (K) Gating strategy used to manually analyze cytokine production on activated TBET+CD69+CD28+ EM CD8 T cells defined as CCR7−CD45RA− following coculture with autologous TGM4-pulsed moDCs stimulated with PMA/ionomycin. (I) Cytokine production as a percentage of activated TBET+CD69+CD28+ EM CD8 T cells in expanded T cells (gated as in K). Unpaired t-tests performed; *p≤0.05, **p≤0.01, ***p≤0.001. CM, central memory; EM, effector memory; IFN-γ, interferon gamma; IL, interleukin; moDC, monocyte-derived dendritic cell; ns, not statistically significant; PAP, prostatic acid phosphatase; PSA, prostate-specific antigen; CEFT, Cytomegalovirus, Epstein-Barr virus, Influenza virus and Clostridium tetani; TAA, tumor-associated antigen; TGM4, transglutaminase 4.
Prostate-restricted TAA TGM4 induces an in vitro CD4+ T-cell response when presented by autologous monocyte-derived DCs
We next performed analyses similar to those mentioned previously for CD4 T cells. As shown in figure 5A,B, FlowSOM clustering showed ten distinct populations of antigen-driven expanded CD4 T cells. Most of these clusters were observed in all antigen-driven expanded CD4 T cells (with the exception of Pop 5; figure 5A). Of these, Pop9 appears to represent CM CD4 T cells and Pop6 naïve CD4 T cells (figure 5B). In terms of CM and EM CD4 T cells, we found that stimulation by TAA-pulsed moDCs increased the proportion and percentages of activated (CD69+) CD27+CD28+ CM CD4 T cells to a significantly greater extent than did coculture with the positive control viral antigens (figure 5D). Accordingly, higher percentages of CM and EM expressed the activation markers PD-1 and TIM3 when stimulated with TAAs (figure 5E). Additional manual gating for the EM CD4 T-cell population expressing the proinflammatory transcription factor TBET (Pop 0, figure 5B) was performed (figure 5F,G). Here, we observed TGM4-pulsed moDCs increased expansion of TBET+-activated EM CD4 T cells to a greater degree than PAP-pulsed or PSA-pulsed moDCs, with levels similar to those from positive control viral antigens, CEFT and pp65 (figure 5H). Furthermore, TBET+-activated EM CD4 T cells primed with TGM4-pulsed moDCs produce canonical proinflammatory cytokines (IL-2, TNF-α, and IFN-γ, but not IL-4) following stimulation (figure 5I,K). These data support the notion that TGM4 can potentially drive proimmunogenic CD4 T-cell responses in addition to the CD8 responses shown previously.
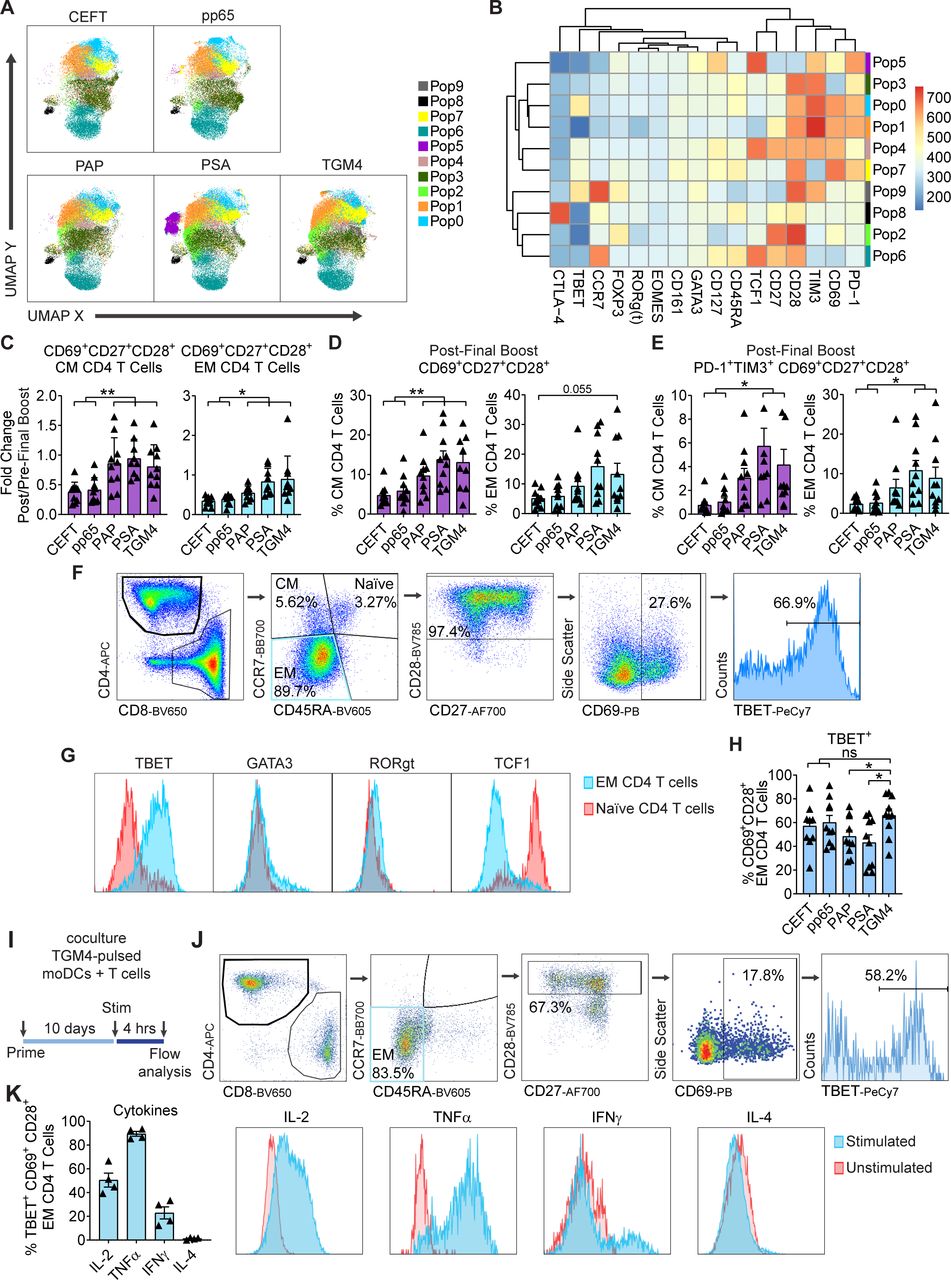
TGM4 induces CD4 T-cell activation and expansion in vitro. (A) Differential expression of functional markers on expanded populations of CD4 T cells following coculture with autologous protein-pulsed moDCs. Heatmap showing unsupervised clusters determined with the FlowSOM algorithm as described in the Materials and methods section. (B) Expanded CD4 T-cell populations defined by FlowSOM (in A) were projected onto UMAP space as described in the Materials and methods section. Colors correspond to FlowSOM populations. (C) Fold change on activated CD69+CD27+CD28+ EM CD4 T cells (left) and CM CD4 T cells (right) following the last 12 hours of stimulation in expanded T cells. (D) Activated CD69+CD27+CD28+ cells as a percentage of EM CD4 T cells (left) and CM CD4 T cells (right) following in vitro expansion (as in C). (E) PD1+TIM3+ CD69+CD27+CD28+ cells as a percentage of EM CD4 T cells (left) and CM CD4 T cells (right) following in vitro expansion (as in C). (F) Gating strategy used to manually analyze TBET+ in activated CD69+CD28+ EM CD4 T cells defined as CCR7−CD45RA− following coculture with autologous protein-pulsed moDCs. (G) Representative histograms of expression levels of functional transcription factors determined by flow cytometry in expanded EM and naïve CD4 T cells. (H) TBET+ cells as a percentage of activated CD69+CD28+ EM CD4 T cell in expanded T cells (gated as in F). (I) Schematic representation of priming of naïve T cell with autologous TGM4-pulsed moDCs stimulated with PMA/ionomycin 4 hours prior analysis by flow cytometry. (J) Gating strategy used to manually analyze cytokine responses on activated TBET+CD69+CD28+ EM CD4 T cells defined as CCR7−CD45RA− following coculture with autologous TGM4-pulsed moDCs stimulated with PMA/ionomycin. (K) Cytokine production as a percentage of activated TBET+CD69+CD28+ EM CD4 T cells in expanded T cells (gated as in I). Unpaired t-tests performed; *p≤0.05, **p≤0.01. CEFT, cytomegalovirus, Epstein-Barr virus, influenza virus and clostridium tetani; CM, central memory; EM, effector memory; IFN-γ, interferon gamma; IL, interleukin; moDC, monocyte-derived dendritic cell; ns, not statistically significant; PAP, prostatic acid phosphatase; PSA, prostate-specific antigen; TGM4, transglutaminase 4.
Patients with PCa develop a humoral response to TGM4 after treatment with granulocyte-macrophage colony-stimulating factor [GM-CSF] gene transduced irradiated prostate cancer vaccine cells (GVAX)
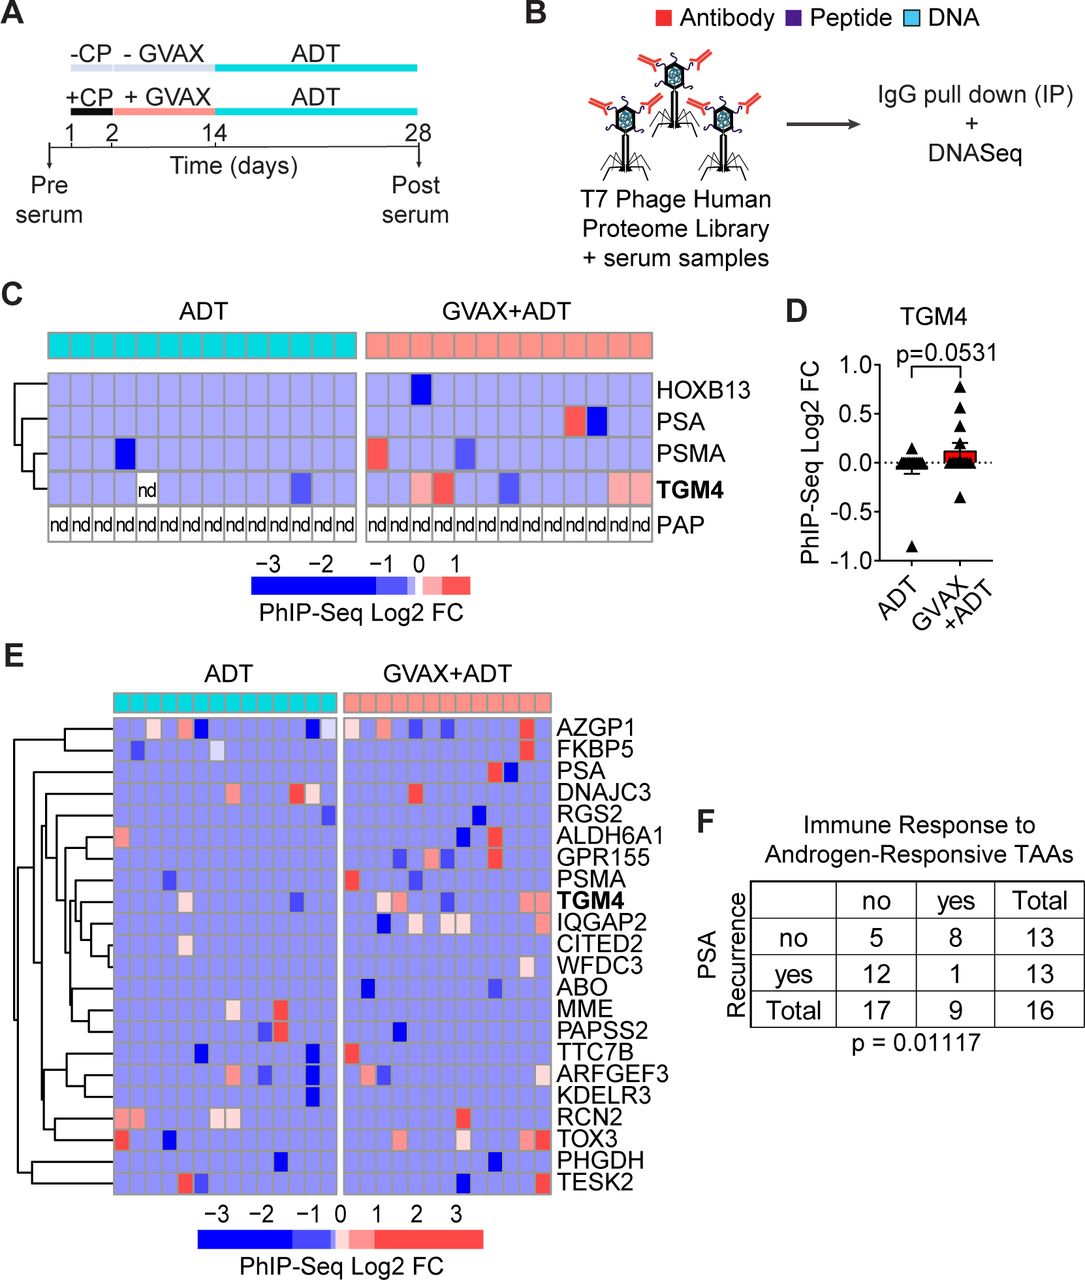
Given the induced CD4 T-cell responses to TGM4 observed in vitro (figure 5), we hypothesized that patients with PCa might leverage CD4 T-cell help to mount an IgG antibody response against this prostate-restricted TAA. To address this question, we analyzed pre-treatment and post-treatment sera from patients with localized prostate tumors treated with either ADT (n=14) or ADT plus a cell-based PCa vaccine (GVAX+ADT, n=13) in the neoadjuvant setting11 (figure 6A). To profile antibody responses, we used Phage-ImmunoPrecipitation Sequencing (PhIP-Seq),44 focusing on IgG antibody responses. For these assays, serum samples pre-treatment and post-treatment were used to immunoprecipitate a T7 phage-displayed library expressing overlapping 90-aa peptides covering 29 371 human open reading frames (figure 6B).44 45 Fewer than 8% of vaccinated patients developed antibody responses to PSA or PSMA and antibodies against PAP were not detected in any patient studied (figure 6C,D). By contrast, approximately 30% of vaccinated patients developed an antibody response to TGM4. To validate the presence of antibodies against TGM4 post-vaccination and address the absence of antibodies against PAP, we performed immunoprecipitation experiments using either TGM4 or PAP recombinant protein and patient sera pre-vaccination and post-vaccination—followed by western blotting. Indeed, we were able to detect antibodies against both TGM4 and PAP in both pre-vaccination and post-vaccination samples. Interestingly, using this strategy that preserves protein structure, we observed a numerical increase in post-vaccination antibody responses to TGM4 but not PAP (online supplemental figure 4C,D). Further, antibody responses to TGM4 and other androgen-responsive TAAs correlated with PSA recurrence in this dataset (figure 6E,F). These results suggest that vaccine-induced responses to androgen-responsive TAAs may have clinical relevance in patients with PCa.

GVAX vaccination induces antibody responses against TGM4 in patients with prostate cancer. (A) Schematic representation of the treatment paradigm of patients with PRAD treated with ADT alone or CP followed by GVAX and ADT in a neoadjuvant trial (NCT01696877). (B) Schematic diagram of the PhIP-Seq assay. (C) Heatmap of antibody binding to selected prostate-restricted TAAs determined as described in the Materials and methods section. (D) Antibody response to TGM4 across patients with PRAD (treated as in A). (E) Heatmap of antibody binding to androgen-responsive antigens determined as described in figure 2. (F) Table summarizing responses for ADT only and GVAX followed by ADT treatment groups. Fisher’s exact test shows significant over-representation of immune response to androgen-responsive TAAs in the set of patients without biochemical recurrence. ADT, androgen-deprivation therapy; CP, cyclophosphamide; FC, fold change; GVAX, granulocyte-macrophage colony-stimulating factor [GM-CSF] gene transduced irradiated prostate cancer vaccine cells; nd, not detected; PhIP-Seq, Phage-ImmunoPrecipitation sequencing; PRAD, prostate adenocarcinoma; TAA, tumor-associated antigen; TGM4, transglutaminase 4.
Discussion
The clinical activity of a PCa vaccine based on PAP-loaded autologous moDCs (sipuleucel-T) highlights the potential of immunotherapy to enhance de novo antitumor immune responses to prostate-restricted TAAs. Despite the clinical utility of PAP as an immunological target, responses to this prostate-restricted TAA are heterogeneous.46–50 Other prostate-restricted TAAs such as PSA, PSCA, and PSMA have also shown intriguing results in preclinical studies and are currently under investigation in clinical trials (NCT03089203, NCT04053062, NCT03873805, and NCT02744287).51–54 However, the identification of novel prostate-restricted immunological targets remains an unmet need. Here we show that the putative cell-of-origin for PCa,55 a subpopulation of epithelial cells surrounding the ductal lumen that survive after androgen deprivation—known as CRLECs, express high levels of prostate specific Tgm4 in an androgen dependent manner. Our findings are in agreement with our recent study that histologically located Tgm4 at the protein level to luminal cells in the anterior and dorsal lobes of mouse prostates,24 as well as with previous in vitro studies suggesting TGM4 may be responsive to androgens in a human PCa cell line.37 56 Although Tgm4 is expressed in benign prostate tissue, the non-vital nature of the prostate gland makes it a feasible target for immunotherapy in patients with recurrent disease after primary therapy with radiation or surgery. In addition, we found that Tgm4 expression is increased in prostate tumors originating from luminal epithelial cells. Furthermore, the relatively low levels of TGM4 expression observed in brain, colon, liver, lung, skin, kidney, and salivary gland suggest that targeting TGM4 might be associated with fewer off-target immune-related adverse events than other potential TAAs.
Of note, there has been some controversy regarding TGM4 expression in prostate tumor lesions as compared with benign prostate tissue, with some studies reporting TGM4 expression in tumor lesions to be lower57–59 or higher43 than that in benign prostate tissue. At the message level, TGM4 expression has been reported to be reduced in PRAD and metastatic PCa tissue compared with the benign tissue by qPCR57 and northern hybridization58; however, further studies demonstrated that only one of four TGM4 splice variants (4 L) is lost in PCa samples.60 At the protein level, two independent immunohistochemistry analyses of prostate tissue microarray slides revealed that TGM4 expression was higher in benign prostatic tissue when a polyclonal antibody was used,59 but higher in PRADs when evaluated with a monoclonal antibody.43 Thus, potential discrepancies could possibly be explained by the reagents used in each study. In line with a potential role for TGM4 in disease progression,61 62 our results suggest that TGM4 expression is associated with decreased time to recurrence.
To understand whether TGM4 expression was able to induce an antigen-driven immune response, we evaluated the immunogenicity of TGM4 and several additional prostate-restricted TAAs in functional assays with pulsed moDCs presenting one of the three human proteins (TGM4, PAP, or PSA) to autologous naïve T cells from healthy male donors. Using these tools, we found that proinflammatory activated TBET+ EM CD8 and CD4 T cells were expanded by TGM4-pulsed moDCs to a greater extent than PAP-pulsed and PSA-pulsed moDCs in healthy male donors. These studies were notable in that they support the notion that a TGM4 targeted vaccine could potentially induce T-cell immunity.
We also found that an IgG antibody response to TGM4 was detected in a fraction of patients with PCa treated with GVAX in a neoadjuvant trial. Those data further support the potential for antigen-driven CD4 T-cell responses to TGM4, since CD4 T help is required for antibody class switching to IgG. This finding is in line with the modest improvement in time-to-PSA progression observed in this trial,11 an improvement which was not associated with an increase in tumor-infiltrating CD8 T cells. Further supporting the immunogenicity of TGM4, work from others showed that autoantibodies were found in 100% of Aire-deficient and in 22% of non-obese diabetic male mice that spontaneously developed prostatitis, but not in female mice.63 Interestingly, several other members of the transglutaminase family have also been identified as immune targets in inflammatory and autoimmune disorders.64–66 Aire-deficient mice with antibodies targeting Tgm4 lack production of Tgm4, suggesting that Tgm4-expressing cells may be destroyed by an autoimmune reaction.63 Further, the development of antibodies targeting Tgm4 was only observed postpuberty,63 which parallels the androgen-responsive regulation we observed and implies peripheral antigen recognition in the absence of central tolerance.
In summary, these studies support further evaluation of TGM4 as a prostate-restricted TAA. Given the immunosuppressive nature of the tumor microenvironment in PCa,3 67–72 it is likely that vaccine-induced responses against TGM4 may not be sufficient alone for an effective antitumor response. Instead, targeted vaccines may need to be administrated in combination with other therapies targeting the recruitment and accumulation of regulatory T cells and/or myeloid-derived suppressive cells. Future studies evaluating TGM4 as a putative target antigen in mCPRC are required to explore these issues.
Data availability statement
Data are available in a public, open access repository. The datasets analyzed during the current study are available in the NCBI Gene Expression Omnibus repository, the Genotype-Tissue Expression Portal V7 data repository, the Functional Annotation of the Mammalian Genome data repository, the Human Protein Atlas repository, and the cBioPortal for cancer genomics.
Ethics statements
Ethics approval
The Institutional Review Board of the Johns Hopkins Sidney Kimmel Comprehensive Cancer Center (Baltimore, Maryland) provided ethical approval for the use of patient materials in this study (IRB # NA_00073453).
Acknowledgments
We thank C Abate-Shen for her assistance in facilitating this collaboration, N Chowdhury, C R Ager, C S Spina, and S L Reiner for discussion and insightful comments, M G Chaimowitz for administrative assistance, and Z J Kerner for his help revising the manuscript. The Genotype-Tissue Expression (GTEx) Project was supported by the Common Fund of the Office of the Director of the National Institutes of Health, and by National Cancer Institute (NCI), National Human Genome Research Institute (NHGRI), National Heart, Lung, and Blood Institute (NHLBI), National Institute on Drug Abuse (NIDA), National Institute of Mental Health (NIMH), and National Institute of Neurological Disorders and Stroke (NINDS). The data used for the analyses described in this manuscript were in part obtained from the GTEx Portal V7 data repository. The results shown here are in part based on data generated by The Cancer Genome Atlas Research Network (https://www.cancer.gov/tcga) accessed via the R 'recount' package on Bioconductor. Protein expression in human tissues was queried using the Human Protein Atlas repository available online (http://www.proteinatlas.org). The content is solely the responsibility of the authors and does not necessarily represent the official views of the National Institutes of Health.
References
Supplementary materials
Supplementary Data
This web only file has been produced by the BMJ Publishing Group from an electronic file supplied by the author(s) and has not been edited for content.
Footnotes
Twitter @ZoilaBujanda, @Alexandros_P
Contributors Conception and design: ZAL-B and CGD. Design of methodology: ZAL-B. Acquisition of data (provided animals, acquired and managed patients and provided facilities): ZAL-B, AO, TRN, LC, RM, HBL, ESA, and MCH. Analysis and interpretation of data (eg, statistical analysis, biostatistics and computational analysis): ZAL-B, AO, LC, TOD, UL, MMS, and MCH. Writing and/or revision of the manuscript: ZAL-B and CGD. Administrative, technical, or material support (ie, reporting or organizing data, constructing databases): AP, TRN, RM, JCZ, RR, MKS, PM, MMS, and MCH. Study supervision: CGD. All authors reviewed and approved the manuscript.
Funding This study was supported by the US National Institutes of Health National Cancer Institute (CA127153 to CD, CA238005 to MMS, and CA237623 to JCZ); the US Department of Defense (W81XWH-13-1-0369); the Patrick C. Walsh Fund; the OneInSix Foundation; the Swiss National Science Foundation (Early Postdoc Mobility Fellowship to AP: P2ZHP3 181557); the National Science Foundation (fellowship to LC: DGE 16-44869); the Prostate Cancer Foundation (PCF Challenge Awards to CGD and MMS, and Young Investigator Awards to HBL and JCZ) and the National Institute of Health Cancer Center Support Grants P30 CA013696 and P30 CA006973).
Competing interests CD has served as a consultant for Agenus, BMS, Dendreon, Janssen Oncology, Eli Lilly, F-Star, Merck, AstraZeneca, MedImmune, Pierre Fabre, Genentech, and Genocea Biosciences, and has stock or ownership interests in Compugen, Harpoon, Kleo, and Tizona Therapeutics. PM has served as a consultant for AstraZeneca, Medimmune and ATARA Biotherapeutics Inc. EA has served as a paid consultant/advisor to Janssen, Pfizer, Sanofi, Dendreon, Bayer, Bristol Myers Squibb, Amgen, Merck, AstraZeneca, and Clovis; has received research grants to his institution from Janssen, Johnson &Johnson, Sanofi, Bristol Myers Squibb, Pfizer, AstraZeneca, Celgene, Merck, Bayer, Clovis; and is an inventor of a biomarker technology that has been licensed to Qiagen. RR has served as a consultant to Gilead, Atara, Novartis, Celgene, Monsanto and Magenta. UL has served as a founder to and owns stock in Alchemab Therapeutics and Patch Biosciences.
Provenance and peer review Not commissioned; externally peer reviewed.
Supplemental material This content has been supplied by the author(s). It has not been vetted by BMJ Publishing Group Limited (BMJ) and may not have been peer-reviewed. Any opinions or recommendations discussed are solely those of the author(s) and are not endorsed by BMJ. BMJ disclaims all liability and responsibility arising from any reliance placed on the content. Where the content includes any translated material, BMJ does not warrant the accuracy and reliability of the translations (including but not limited to local regulations, clinical guidelines, terminology, drug names and drug dosages), and is not responsible for any error and/or omissions arising from translation and adaptation or otherwise.