Article Text

Abstract
Background The efficacy of docetaxel-based chemotherapy is limited by the development of drug resistance. Recent studies demonstrated the efficacy of anti-programmed death-1 (PD-1)/programmed cell death ligand-1 (PD-L1) immunotherapies in metastatic prostate cancer. The ataxia telangiectasia mutation (ATM) protein plays a crucial role in maintaining genome stability and function of mitosis. Here, we aimed to determine whether PD-1/PD-L1 signaling contributes to the resistance to DTX and to elucidate the mechanism underlying DTX-induced PD-L1 expression.
Methods In this retrospective study, PD-L1 expression was analyzed in 33 tumor tissue samples from prostate cancer patients. Prostate cell lines were used to perform functional assays and examine underlying mechanisms in vitro. A fully mouse prostate cancer model and a humanized chimeric mouse bearing human prostate tumors and peripheral blood mononuclear cells were used for in vivo assays.
Results We have shown that DTX, a chemotherapeutic drug which causing microtubule interference, could significantly induce the expression of PD-L1 in prostate cancer cells. This effect is blocked by the inhibition of ATM, suggesting that it plays an essential role in PD-L1 expression upregulated by DTX. Mechanistic studies have shown that ATM activity in cancer cells enhances the stability of the NF-κB essential modulator (NEMO), which leading to an increase in the NF-κB activity and PD-L1 expression. Using the mouse model, it was further demonstrated that a combination of ATM and NEMO inhibitors along with DTX augmented the antitumor efficacy of chemotherapy, which are comparable to that of PD-L1 antibody.
Conclusions Our findings have revealed that a previously unrecognized ATM-NEMO signaling which induced by DTX is capable of suppressing tumor immunity by activating the expression of PD-L1, suggesting that the ATM-NEMO-NF-κB axis can be exploited to restore the immune balance and overcome cancer resistance triggered by DTX.
Graphic Abstract: supplementary file 1
- immunotherapy
- programmed cell death 1 receptor
- drug therapy
- combination
- immune evation
Data availability statement
Data are available on reasonable request. The datasets used and/or analyzed during the current study are available from the corresponding author on reasonable request.
This is an open access article distributed in accordance with the Creative Commons Attribution Non Commercial (CC BY-NC 4.0) license, which permits others to distribute, remix, adapt, build upon this work non-commercially, and license their derivative works on different terms, provided the original work is properly cited, appropriate credit is given, any changes made indicated, and the use is non-commercial. See http://creativecommons.org/licenses/by-nc/4.0/.
Statistics from Altmetric.com
Introduction
Programmed death-1 (PD-1) is an important immune checkpoint molecule that mediates immunosuppression by binding to the programmed cell death ligand-1 (PD-L1). High levels of PD-L1 in tumor cells are important for the induction of immunosuppression, immune tolerance, and immune evasion in the tumor microenvironment.1–3 Among men, the most common type of invasive cancer is that of the prostate cancer, and it is the second leading cause of death. Recent studies have reported that PD-1 is expressed on the tumor-infiltrating T cells in patients with prostate cancer and responsible for rapid tumor progression.4–7 However, reports on the expression of PD-L1 in prostate cancer cells are conflicting. Although several studies support the involvement of PD-L1 expression and the PD-L1/PD-1 pathway in the progression of prostate tumors,5 8 9 some reports suggested that PD-L1 is downregulated in prostate cancer.10 Therefore, a comprehensive analysis of PD-L1 expression under different medical and therapeutic conditions is necessary for the development of checkpoint inhibitors in prostate cancer.
Docetaxel (DTX)-based chemotherapy is the first-line treatment of metastatic castrate-resistant prostate cancer and recent reports also suggest the improving outcomes of DTX in metastatic hormone sensitive prostate cancer.11–13 DTX inhibits microtubule depolymerization, thereby activating the M-phase cycle checkpoint.14–17 An important issue limiting DTX chemotherapy is the development of drug resistance, which is the primary cause of disease aggravation.18 Several studies have reported that anti-PD-1/PD-L1 immunotherapies are effective for the treatment of metastatic prostate cancer (mPCa),15 19 suggesting that the PD-1/PD-L1 signaling may contribute to the chemoresistance to DTX.
In this study, we showed that DTX chemotherapeutic treatment upregulated the PD-L1 expression in prostate cancer cells, and identified that ATM-NEMO as the major pathway activating PD-L1 expression. Our research provides a new understanding of the mechanism underlying PD-L1 expression in cancer cells, would open a new strategy to overcoming DTX resistance and demonstrates a new way to improve the efficacy of DTX chemotherapy by therapeutically blocking NEMO or ATM signaling.
Ataxia telangiectasia mutation (ATM) is the main kinase that regulates the G2/M cell cycle checkpoint and activated instinctively in mitosis.20 21 Recent studies have revealed that DNA damage response (DDR) associated closely with the PD-L1 expression.22–25 Nuclear factor kappa-light-chain-enhancer of activated B cells (NF-κB) is a strong inducer of the PD-L1 gene expression in multiple types of cancers.26 The activation of NF-κB in response to multiply cell stresses via an ATM-dependent mechanism. Activated ATM phosphorylates NF-κB essential modulator (NEMO), which results in its modification by SUMOylation and monoubiquitination. Ubiquitinated NEMO is then exported to the cytoplasm, where it phosphorylates IκB kinase-β (IKK β) in association with ATM and ELKS (glutamate-rich, leucine-rich, lysine-rich, and serine-rich) proteins, leading to degradation of IκBα. Thus, p65/RelA is liberated and translocated from the cytoplasm to the cell nucleus.27–29 However, whether DTX affects PD-L1 expression and the role of ATM and NF-κB signaling in this process remain to be elucidated.
Methods
Study design
This study determined whether PD-1/PD-L1 signaling contributes to the resistance to DTX, and elucidated the mechanism underlying DTX-induced PD-L1 expression. PD-L1 expression was analyzed in 33 tumor tissue samples from prostate cancer patients. Prostate cell lines were used to perform functional assays in vitro. Two mouse models with RM-1 and PC-3 bearing prostate tumors were used for in vivo assays. All the surgically resected prostate cancer tissues and peripheral blood mononuclear cells (PBMCs) were obtained from 55 patients at the Department of Urology, the First Affiliated Hospital, Sun Yat-sen University (Guangzhou, China). Table 1 presents the demographic characteristics of 55 patients. The clinical tumor node metastasis (TNM) stage of cancer was assessed by the eighth edition of the American Joint Committee on Cancer (AJCC). The cancer stage was defined according to AJCC prognostic staging system of prostate cancer.
Baseline demographics and clinical characteristics
Cell culture and transfection
PC-3, DU-145 and RM-1 prostate cancer cells were obtained from the American Type Culture Collection. The cancer cells were cultured in RPMI 1640 supplemented with 10% FBS. DTX (MedChemExpress, Monmouth Junction, New Jersey, USA), which promotes microtubule stabilization and inhibits the mitosis of cancer cells; cisplatin (MedChemExpress), a replicative polymerase inhibitor, were used at concentrations of 0, 25, 50, 100 nM and 0, 10, 20, 30 µM, respectively. Paclitaxel (PTX, MedChemExpress), was used at concentration of 200 nM. Additionally, indicated concentrations of the ATM inhibitor KU55933 (Sigma-Aldrich, St. Louis, Missouri, USA) or the NEMO binding peptide (NBD) (Enzo Biochem, New York, USA) were added at 60 min before the induction of PD-L1. For inhibitor screening, S3I-201(100 µM), Fludarabine (10 µM), UO126-EtOH (10 µM), Bay11-7082 (10 µM), JSH-23 (5 µM), SD-208 (2 µM) which obtained from Sigma-Aldrich were added and the cells were collected after 6 hours.
Flow cytometry
For extracellular staining, cells were surface stained with FITC-PDL1, PE-PDL1, PE-PDL2, PE-CD8 antibodies (Biolegend, San Diego, California, USA). For intracellular staining, cells were first surface stained with FITC-PDL1, PE-CD8, APC-CD4, PE-CD25, APC-EGFR (Biolegend). In addition, the intracellular staining was performed with a BD permeabilization/Fixation kit. 107 cells/mL were stained with PE-phospho-ATM, FITC-FOXP3, phospho-p65, and KI67 antibodies (Cell signaling Technology, Danvers, Massachusetts, USA), followed by an Alexa Fluro 488-conjugated Donkey anti-mouse IgG (Jackson ImmunoResearch, West Grove, Pennsylvania, USA), and then detected by LSRII flow cytometer. Data were analyzed by FlowJo software.
For prepared single-cell suspensions from the tumor tissue, The Tumor Dissociation Kit (Mitenyi Biotec, Teterow, Germany) was used.
RNA isolation and quantitative PCR
Total RNA was extracted from 1.0×10⁵ cells, and cDNA was synthesized with AMV-reverse transcriptase and random hexamer primers (Roche Diagnostic, Indianapolis, Indiana, USA). Quantitative PCR (qPCR) was performed using StepOneplus (Applied Biosystems, Carlsbad, California, USA), the gene expression was normalized to GAPDH and the relative amount of mRNA were calculated using the 2−ΔΔCt method. The primer sequences used for PD-L1: 5′-GGAGATTAGATCCTGAGGAAAACCA-3′ and 5′-AACGGAAGATGAATGTCAGTGCTA-3′; GAPDH: 5′-CTCCTCTGACTTCAACAGCGA-3′ and 5′-CCAAATTCGTTGTCATACCAGGA-3′.
Immunoprecipitation and western blotting
Cancer cells were lysed in 1.5 mL of cold lysis buffer. The supernatants of the cell lysates were precleared by protein A/G PLUS-Agarose, and then incubated with anti-ATM or anti-NEMO with 20 µL of protein A/G PLUS-Agarose at 4°C for 12 hours. Immune complexes were collected after each immunoprecipitation by centrifugation at 13 000 g for 10 min. The immune complexes were subjected to sodium dodecyl sulfate-polyacrylamide gel electrophoresis (SDS-PAGE), followed by immunoblotting with ATM and NEMO specific antibodies.
Previously reported methods were applied for western blotting.30 In brief, whole-cell lysates were prepared in radioimmunoprecipitation buffer. Equal amounts of total protein from each sample were loaded into an SDS-PAGE gel and transferred to a polyvinylidene difluoride membrane. Antibodies specific for PD-L1 (Abcam, Cambridge, Massachusetts, USA), ATM, phospho-ATM, MRE11, p65, phospho-p65 and GAPDH (Santa Cruz Biotechnology, Santa Cruz, California, USA) were added 12 hours at 4°C. The membranes were subsequently incubated with secondary antibodies and detected with a chemiluminescent detection system (Beyotime Biotechnology, Shanghai, China).
Chromatin immunoprecipitation assay
Chromatin immunoprecipitation (chIP) assay was preformed to identify the binding site of NF-κB p65 in PD-L1 promoter region. PC-3 cells were crosslinked with 1% formaldehyde at 37°C for 10 min, and neutralized with 0.2 M glycine. Then the chromatin was obtained and fractured according to the instructions of chIP assay kit (Beyotime Biotechnology), followed by precipitating with p65 antibody or IgG isotype 12 hours at 4°C. After purification, the precipitated DNA and input were de-crosslinked at 68°C. The purified DNA was amplified by PCR and analyzed by 2% agarose gel, and the capacity of p65 binding to PD-L1 promoter was quantified by qPCR. Primer sequences used in chIP-qPCR were as follows: sense 5’-CTTCCGCAGCCTTAATCCTTA-3’ and antisense 5’-ATCGTGGATTCTGTGACTTCCTC-3’.
ATM shRNA-mediated knockdown and overexpression
To knockdown ATM expression, shRNA ATM and control vector were obtained from addgene, 6 µg shRNA were transfected into cells by Oligofectamine (Life Technologies, Invitrogen), following protocols provided by the manufacturer. At 24 hours post transfection, cells were treated with 50 nM DTX for 6 hours, and then collected for analysis.
To overexpress ATM plasmids, 2.5 µg pcDNA3.1-His and pcDNA3.1-Flag-His-ATM (Addgene) were transfected into tumor cells by Lipofectamine 2000. At 24 hours post transfection, cells were collected for analysis.
Immunofluorescence and immunohistochemistry
PC-3 cells were cultured in the cell culture chamber. The cells were fixed in 4% paraformaldehyde for 15 min, permeabilized using 0.2% triton X-100 for 10 min, followed by staining with rabbit anti-human γH2AX, rabbit anti-human 53BP1, mouse anti-human phospho-histone H3, rabbit anti-human phospho-p65 (Cell signal technology) and mouse anti-human PD-L1 antibody (Abcam) or normal control IgG 6–8 hours at 4°C. Then, Alexa Flour 488-conjugated goat anti-rabbit IgG and Alexa Flour 594-conjugated goat anti-mouse IgG were added and incubated for 1 hour at 37°C. The nucleus was stained with 4'6-diamidino-2-phenylindole and mounted with ProLong Gold Antifade Reagent (Life Technologies). The images were analyzed using a Zeiss LSM 880 Confocal Imaging System (Zeiss, Jena, Germany).31
Paraffin-embedded tissues were sectioned and subjected to immunostaining using primary antibodies such as anti-PD-L1, anti-CD45, anti-phospho-ATM, anti-phospho-p65, anti-CD3 and anti-interferon-γ (IFNγ) (Abcam). The isotype-matched primary antibodies served as the controls. Antibody binding was visualized using fluorescence-labeled secondary antibodies under a Zeiss LSM 880 Confocal Imaging System.
Mice and treatments
The RM-1 cancer models were established by subcutaneously injecting 1 × 10⁵ of RM-1 cells into the right flank of male C57BL/6 mice (6–8 weeks, GemPharmatech, China). The treatment was initiated once the tumors had reached a size of approximately 90 mm3. For the PC-3 PBMCs engraft mice model, male NOD.CB17-PrkdcscidIL2rgtm1/Bcgen (B-NDG) mice (5–6 weeks) (Biocytogen Jiangsu, China) were used. PC-3 cells (5×10⁶) were injected subcutaneously into the right flank of the mice. The treatment was initiated once the tumors had reached approximately 90 mm3. The mice were treated by an intravenous injection of 10 million PBMCs or CD3-depleted PBMCs separated from patients with prostate cancer.
Mice from the same litter were randomly assigned to seven groups as follows: either treated with the vehicle or DTX (5 mg/kg); DTX (5 mg/kg)+KU55933 (500 µg/kg); DTX (5 mg/kg)+KU55933 (500 µg/kg)+anti-CD3 (1 mg/kg); DTX (5 mg/kg)+NBD (100 µg/kg); DTX (5 mg/kg)+NBD (100 µg/kg)+anti-CD3 (1 mg/kg) and DTX (5 mg/kg)+anti-PD-L1 (1 mg/kg) (clone MIH1; eBioscience, California, USA). The vehicle and KU55933 were delivered every day. Anti-PD-L1, anti-CD3, NBD and DTX were delivered every 3, 3, 3 and 4 days, respectively. And an intraperitoneal injection was administered over a period of 14 days. The tumors were measured every 3 days and their volumes were calculated as follows: volume = (length × width2)/2. Mean tumor growth inhibition rate was calculated as reported previously.32
Statistical analysis
Data were analyzed using SPSS V.13.0 software, Groups were compared using analysis of variance and unpaired Student’s t-test as appropriate. The results were expressed as the mean±SE of the mean. P values of less than 0.05 were considered significant.
Results
Phosphorylated ATM is correlated with the upregulation of PD-L1 induced by DTX
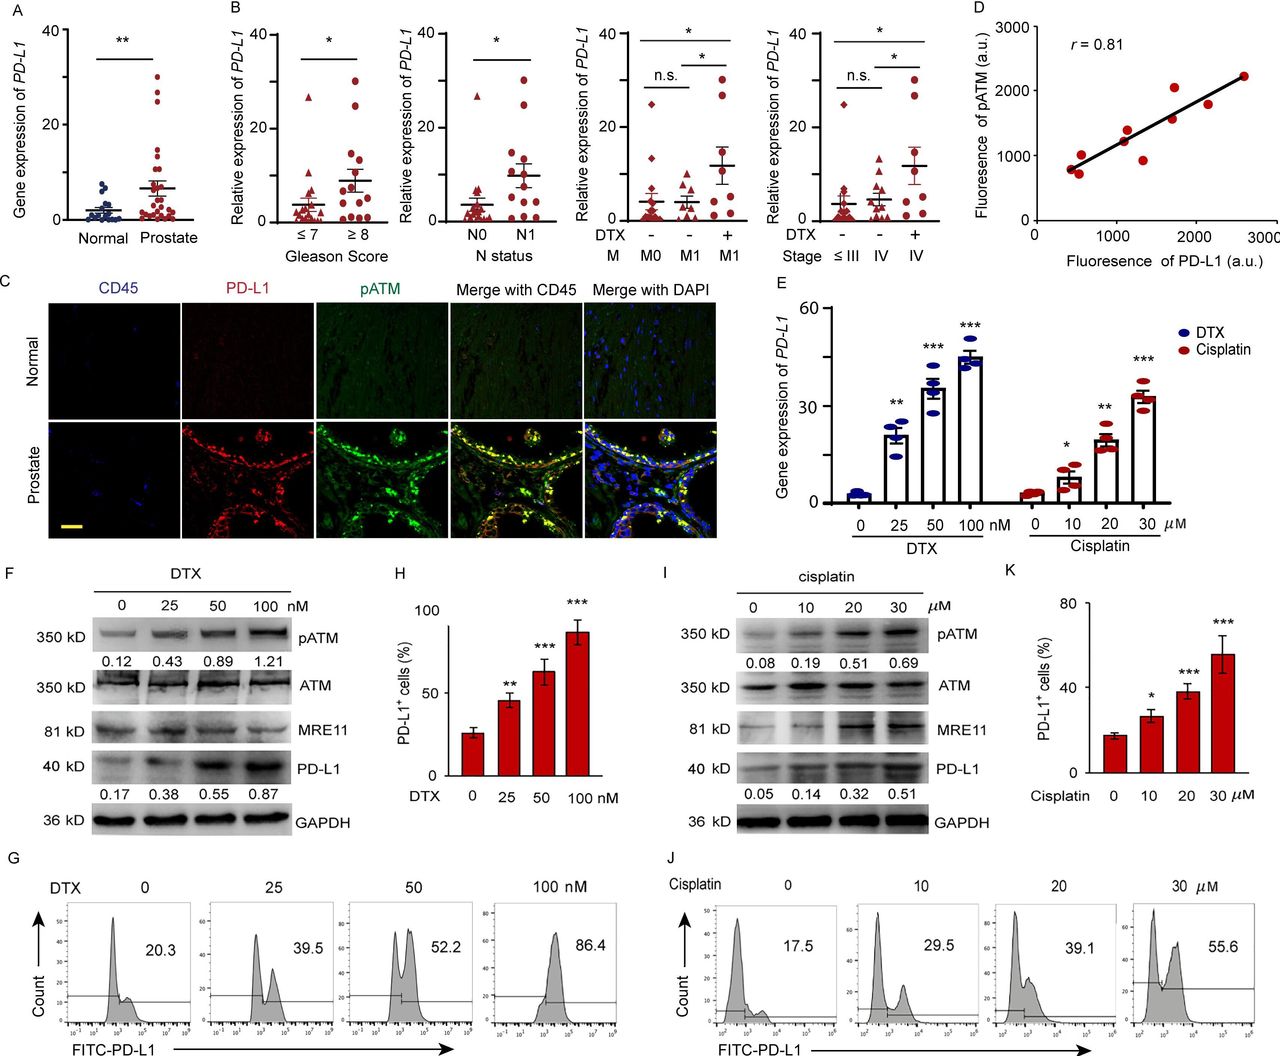
PD-L1 expressions in 18 normal and 33 prostate tumor tissues were detected by qPCR (online supplemental table 1). As shown in figure 1A, higher expression of PD-L1 was observed in the prostate tumor tissues compared with that in normal tissues. There is a positive correlation between PD-L1 expression and Gleason score (score ≤ 7 vs. score ≥ 8, p<0.05), lymph node metastasis (n=0 vs. n=1, p<0.05) and DTX treatment. DTX is the first-line treatment of mPCa. To clarify whether PD-L1 upregulation is due to DTX therapy or metastatic status, we recruited metastatic patients undergoing DTX therapy or not with matched cancer stages and TNM (online supplemental table 2). We found that the PD-L1 expression was significantly higher in patients with metastases who received DTX treatment than in those who did not (M=1, Non vs. DTX, p<0.05). Furthermore, the PD-L1 expression levels were indistinguishable between patients at M0 or M1 not undergoing DTX treatment (M=0 vs. M=1, no DTX, p=n.s.). Similar results were observed in patients at different cancer stages (stage IV, Non vs. DTX, p<0.05; stage ≤ III vs. stage IV, no DTX, p=n.s), excluding both M1 and cancer stage as the sole causative factors upregulating PD-L1 expression (figure 1B). Next, we investigated the correlation between PD-L1 expression and ATM kinase activity. The phosphorylated ATM (pATM) and PD-L1 expression was visualized by a dual-color immunostaining in the normal and tumor sections. Elevated levels of pATM with significantly higher PD-L1 expression were only found in the tumor cells, except for CD45 marked tumor-infiltration leukocytes in the tumor sections (figure 1C,D).
Supplemental material

DTX induces PD-L1 expression in patients with prostate cancer. (A–D) Expression of PD-L1 in prostate cancer tissue from prostate cancer patients. (A) PD-L1 gene expression was quantified by qPCR in normal and prostate cancer tissues. The results from 33 patients are represented as scatter plots and bar graphs displaying the mean±SEM of the normal and prostate cancer tissues. (B) Relative PD-L1 expression in 33 prostate patients was assessed for correlation with Gleason sum score, TNM status, cancer stage, and docetaxel (DTX) treatment. symbols represent individual subjects; bars show the mean±SEM. (C, D) Immunofluorescence staining of PD-L1 (green), pATM (red) and CD45 (blue) in the sections of normal and prostate tumor tissues from 10 patients with prostate cancer. (C) A representation image was shown. (D) Correlation of PD-L1 fluorescence intensity with pATM. (E–K) Cell stresses upregulate PD-L1 expression due to DTX and cisplatin in a dose dependent manner. PC-3 cells were examined at 6 hours after treating with DTX at concentrations of 0, 25, 50, 100 nM; at 24 hours after treating with cisplatin at concentrations of 0, 10, 20, and 30 µM. (E) PD-L1 gene expression after DTX and cisplatin treatment was quantified by qPCR. Results from four experiments. (F–H) DTX treatment. (F) Representative blotting for ATM activation, MRE11 and PD-L1 expression after DTX treatment. results from four experiments. (G, H) PD-L1 expression was detected by surface staining with FITC-PD-L1 antibody with isotype IgG as a control. Representative FACS results from four experiments are shown in (G) and with quantifications in (H). (I–K) Cisplatin treatment. (I) Representative blotting for ATM activation and PD-L1 expression after cisplatin treatment. Results from three experiments. (J, K) PD-L1 expression was detected by FITC-PD-L1 antibody with isotype IgG as a control. Representative FACS results from three experiments are shown in (J) and with quantifications in (K). All data are shown as mean±SEM. *P<0.05; **p<0.01; ***p<0.001. ATM, ataxia telangiectasia mutation; FACS, fluorescent-activated cell sorting; n.s, not significant; PD-L1, programmed cell death ligand-1; pATM, phosphorylated ATM; qPCR, quantitative PCR; SEM, SE of the mean.
To explore the association between PD-L1 upregulation and DTX chemotherapy, we examined the expression of PD-L1 at both gene and protein levels after treatment with DTX. The results showed that DTX upregulated PD-L1 expression in PC-3 (figure 1E) and DU-145 (online supplemental figure 1) prostate cancer cells. Treatment with 100 nM DTX for 6 hours can induced 2.02-fold higher level of PD-L1 than cells which treated with 30 µM cisplatin for 24 hours. whereas, the expression of PD-L2 is not upregulated by both treatments (online supplemental figure 2). We further observed that DTX could enhance the ATM enzyme activity in a dose-dependent manner, which was indicated by an increase in the ATM phosphorylation with concomitant increase of total and extracellular PD-L1 expression in prostate cancer cells, as detected by immunoblotting (figure 1F) and fluorescent-activated cell sorting (FACS) staining. A dose of 50 nM DTX can induce an 52.2% and 100 nM DTX can induce an 86.4% cells express PD-L1 (figure 1G,H) compared by 55.6% PD-L1 positive cells from 30 µM cisplatin treatment (figure 1I–K). Furthermore, DTX and cisplatin primarily induced PD-L1 accumulation in the cell membrane (online supplemental figure 3).33 These data suggested that DTX-induced activation of ATM is associated with the expression of PD-L1 in cancer cells.
ATM kinase activity regulates PD-L1 expression
We conducted knockdown experiments to provide further evidences that the expression of PD-L1 was ATM dependent. Transfection of PC-3 cells with ATM-specific silencing RNA significantly reduced the transcription and protein expression of ATM (figure 2A,B). Concomitantly, ATM knockdown markedly reduced the protein concentration of PD-L1 (figure 2B). To link increased PD-L1 expression with the activation of ATM kinase activity, extracellular PD-L1 and intracellular pATM expression levels were compared by FACS in individual cells (figure 2C). We subsequently found that the higher the mean fluorescence intensity (MFI) of pATM, the more intense the expression of PD-L1 in the cell membrane.

ATM regulates PD-L1 expression induced by DTX. (A–C) PC-3 cells were exposed to ATM shRNA. Forty-eight hours later, the cells were treated with 50 nM DTX for 6 hours and then collected. (A) Knockdown efficiency was detected by qPCR. (B) ATM and PD-L1 expression was determined by Western blotting. (C) The effect of ATM knockdown on the PD-L1 expression was detected by FACS. (D–F) PC-3 cells were transfected with the control and ATM plasmid without DTX treatment. Forty-eight hours later, the cells were collected. (D) Transfection efficiency was detected by qPCR. (E) PD-L1 expression was detected by Western blotting. (F) The effect of ATM transfection on PD-L1 expression was detected by FACS. (G–J) ATM inhibitor (KU55933) can block the PD-L1 expression induced by DTX. PC-3 cells were treated with 50 nM DTX following treatment with the KU55933. (G) PD-L1 gene expression was quantified by qPCR. (H) ATM, pATM, MRE11 and PD-L1 expression was determined by Western blotting. (I, J) PD-L1 expression was detected by FACS. (K–N) ATM inhibitor blocks the PD-L1 expression induced by cisplatin. PC-3 cells were treated with 20 µM cisplatin following treatment with the KU55933. (K) PD-L1 gene expression was quantified by qPCR. (L) ATM, pATM and PD-L1 expression was determined by Western blotting. (M, N) PD-L1 expression was detected by FACS. (O, P) DTX induces PD-L1 expression is DDR independent. PC-3 cells were examined after treating with DTX and cisplatin. (O) Co-immunostaining of γH2AX (green) and phospho-histone H3 (red) in the PC-3 cells. Scale bar, 20 µm. (P) Co-immunostaining of 53BP1 (green) and phospho-histone H3 (red). Scale bar, 20 µm. All data are shown as mean±SEM. ###P<0.001, compared with non-treated group; *p<0.05, **p<0.01, ***p<0.001, compared with chemotherapy treated group. ATM, ataxia telangiectasia mutation; DTX, docetaxel; FACS, fluorescent-activated cell sorting; PD-L1, programmed cell death ligand-1; pATM, phosphorylated ATM; qPCR, quantitative PCR; SEM, SE of the mean.
To test the hypothesis that ectopic activation of ATM could upregulate PD-L1 expression, His-Flag-ATM or control constructs were transfected into PC-3 cells. It was observed that the PD-L1 protein levels had substantially increased in the cells transfected with ATM plasmid (figure 2D–F), indicating that ATM kinase activation is required for DTX-induced PD-L1 expression.
To further investigate whether the PD-L1 expression is associated with ATM activation under DTX chemotherapy, cancer cells were treated with DTX in combination with different doses of the ATM inhibitor. Cisplatin, which activates ATM through DDR signaling, was used as a positive control (figure 2G–N). Inhibition of the enzymatic activity of ATM attenuated the DTX-induced upregulation of PD-L1 expression (figure 2G–J), as well as cisplatin-induced PD-L1 expression (figure 2K–N). Treatment with 20 µM of KU55933 was sufficient to suppress PD-L1 expression to the level observed in the untreated cells. Taken together, these results suggested that the activation of ATM kinase was directly responsible for the enhanced expression of PD-L1 in cancer cells after treatment with DTX.
DTX-induced PD-L1 expression is not dependent on DDR activated G2/M checkpoint
Several proteins involved in DNA damage signaling such as γH2AX and 53BP1 produce discrete DNA damage foci.34 To further compare the mechanisms of DTX and cisplatin-induced PD-L1 expression, the expressions of γH2AX and 53BP1 after DTX and cisplatin treatment were checked. Accumulation of DNA breaks was confirmed by immunostaining for γH2AX and 53BP1 in the nuclei of cisplatin treated cells. However, γH2AX and 53BP1 foci in the nuclei of DTX treated cells were not significantly higher (figure 2O,P). Moreover, ATM undergoes dimer dissociation in response to DSBs.35 No significant dimer/monomer transmission was observed after DTX treatment (online supplemental figure 4), suggesting that DTX-induced ATM activation might not show DDR response. DTX-induced cell accumulation in G2/M phase was indicated by phospho-histone H3 staining (figure 2O,P) and cell cycle analysis via propidium iodide (online supplemental figure 5). However, there were no distinct γH2AX and 53BP1 signals in both phospho-H3 positive and negative cells after DTX treatment (figure 2O,P). Generally, ATM functions upstream of ATR in DDR-induced G2/M checkpoint arrest.36 To further confirm DTX-induced ATM activation being DDR-induced G2/M checkpoint independent, PC-3 cells were treated with ATR inhibitor following DTX or cisplatin. ATR inhibitor effectively suppressed cisplatin but not DTX-induced PD-L1 expression, suggesting DTX-induced ATM and PD-L1 activation is not trigged by DDR-induced G2/M checkpoint (online supplemental figure 6). To further verify the association of observed responses with the interruption in microtubule, PTX, a microtubule inhibitor, was added to PC-3 cells with the reported treatment which did not induce DNA damage.37 PTX activated ATM signal and PD-L1 expression was similar to DTX, which confirmed that disruption of microtubule-induced ATM-dependent PD-L1 expression (online supplemental figure 7).
PD-L1 upregulation is mediated via the NF-κB pathway
To elucidate the mechanism underlying PD-L1 activation by DTX, a panel of signal pathway inhibitors (STAT3i: S3I-201; STAT1i: Fludarabine; MEK1/2i: UO126-EtOH; Bay11-7082: TNFα-induced NF-κBi; JSH-23: NF-κBi for p65 nuclear translocation; TGF-βRIi: SD-208; ATMi: KU55933) were screened to identify the exact pathways regulating the transcription of PD-L1. DTX-induced PD-L1 upregulation in cancer cells was substantially suppressed by JSH-23, which normalized the PD-L1 expression as effectively as ATM inhibitor (figure 3A,B), indicating that p65-dependent NF-κB activation was involved in the modulation of PD-L1 expression.
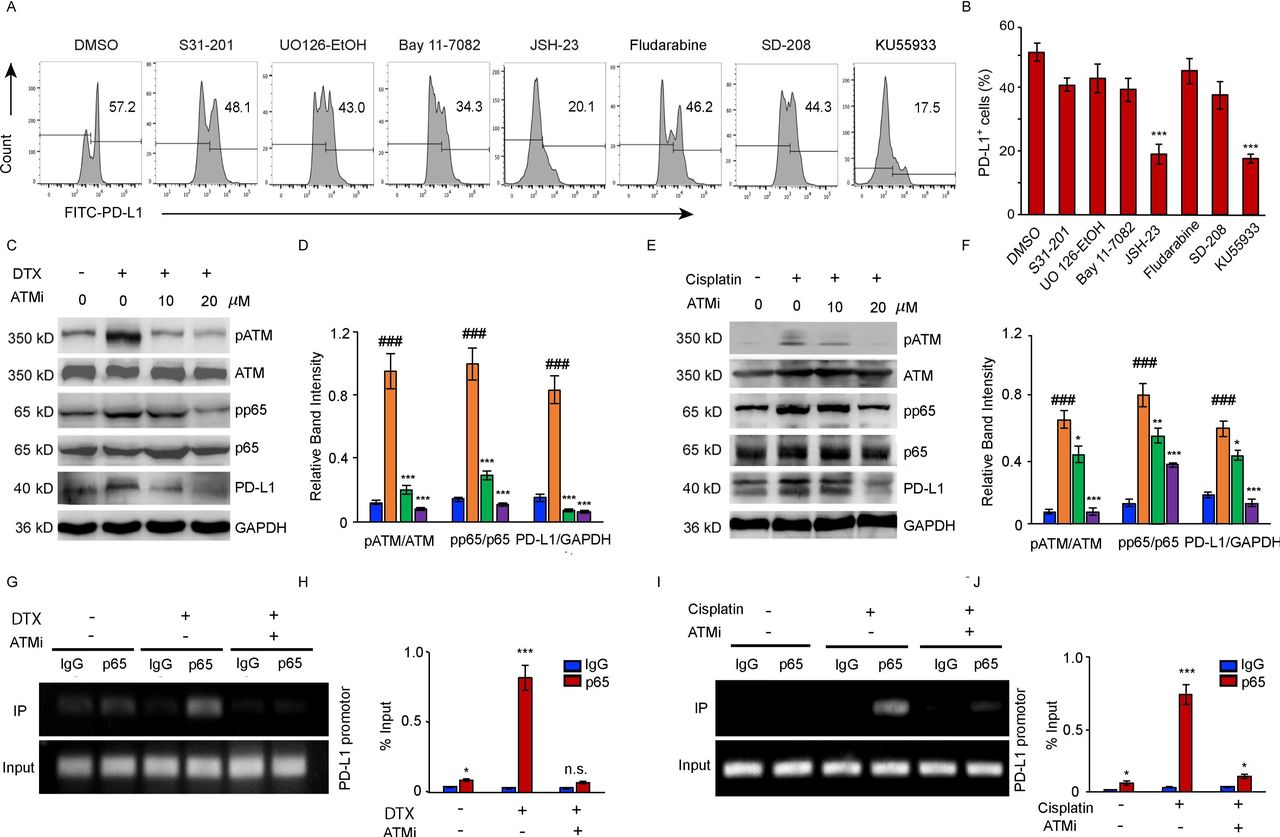
NF-κB activity is required for the upregulation of PD-L1 in PC-3 cells after DTX treatment. (A, B) PC-3 cells were treated with 50 nM DTX following treatment with different pathway inhibitors S31-201, U0126-EtOH, Bay11-7082, JSH-23, SD-208, fludarabine, KU55933 or a vehicle. (A) PD-L1 expression was detected by surface staining with FITC-PD-L1 antibody, followed by FACS with isotype IgG as the control. representative results of FACS from three experiments are shown in (A) and with quantifications in (B), data are shown as mean±SEM. *P<0.05; ***p<0.001; n.s., non-significance; compared with DMSO group. (C, D) PC-3 cells were treated with 50 nM DTX following treatment with ATM inhibitor for indicated concentrations. (C) Representative blotting for pATM, ATM, pp65, p65, and PD-L1 expression. The results from four experiments were quantified in (D). (E, F) PC-3 cells were treated with 20 µM cisplatin following treatment with ATM inhibitor for indicated concentrations. (E) Representative blotting was determined by Western blotting. The results from three experiments were quantified in (F). Data are shown as mean±SEM. ###P<0.001, compared with non-treated group. *P<0.05, **p<0.01, ***p<0.001; compared with chemotherapy treated group. (G–J) CHIP assay. (G, H) CHIP assays with p65 antibody were performed in the PC-3 cells which treated with 50 nM DTX following treatment with 20 µM ATM inhibitor with an IgG isotype as a control. Bindings of p65 to PD-L1 gene promoters were quantified with the ratio of IP/input in (H). The results from three experiments. (I–J) CHIP assays with p65 antibody were performed in the PC-3 cells which treated with 20 µM cisplatin following treatment with 20 µM ATM inhibitor. bindings of p65 to PD-L1 gene promoters were quantified in (J) from three experiments. data are shown as mean±SEM. *P<0.05, ***p<0.001, compared with IgG groups. ATM, ataxia telangiectasia mutation; chIP, chromatin immunoprecipitation; DTX, docetaxel; PD-L1, programmed cell death ligand-1; SEM, SE of the mean.
Further, we confirmed the link between the induction of the ATM activity, PD-L1 expression and increased activation of NF-κB signaling in the cancer cells after DTX or cisplatin treatment (figure 3C–J). The activity of ATM kinase induced by both treatments was inhibited by KU55933 in tumor cells. Moreover, we observed increased phosphorylation of the NF-κB subunit p65 in the cancer cells treated with either DTX (figure 3C,D)or cisplatin (figure 3E,F). The results of a dose dependent experiment indicated that the inhibition of ATM activity was accompanied by a marked loss of the NF-κB activity and followed by a reduction in the PD-L1 expression . In addition, we further performed chIP assays in DTX treated PC-3 cells with and without ATM inhibitor. Increased p65 bindings to the PD-L1 promotor were observed in response to DTX or cisplatin, and the ATM inhibitor effectively blocked the binding of p65 to the PD-L1 promoter (figure 3G–J), suggesting that NF-κB p65 acts downstream of the ATM to block PD-L1 expression on both DTX and cisplatin chemotherapy.
NEMO is required for PD-L1 upregulation induced by DTX
Multiple cell stress can activate ATM, which phosphorylates NEMO and enhances its SUMOylation. This step is necessary for the p65 nuclear translocation and NF-κB activation.38–40 NBD is a cell-permeable synthetic peptide capable of selectively inhibiting the activation of NF-κB by disrupting the formation of NEMO and the IKKβ complex, thus, decreasing the NF-κB p65 dependent gene expression by inhibiting its nuclear translocation.
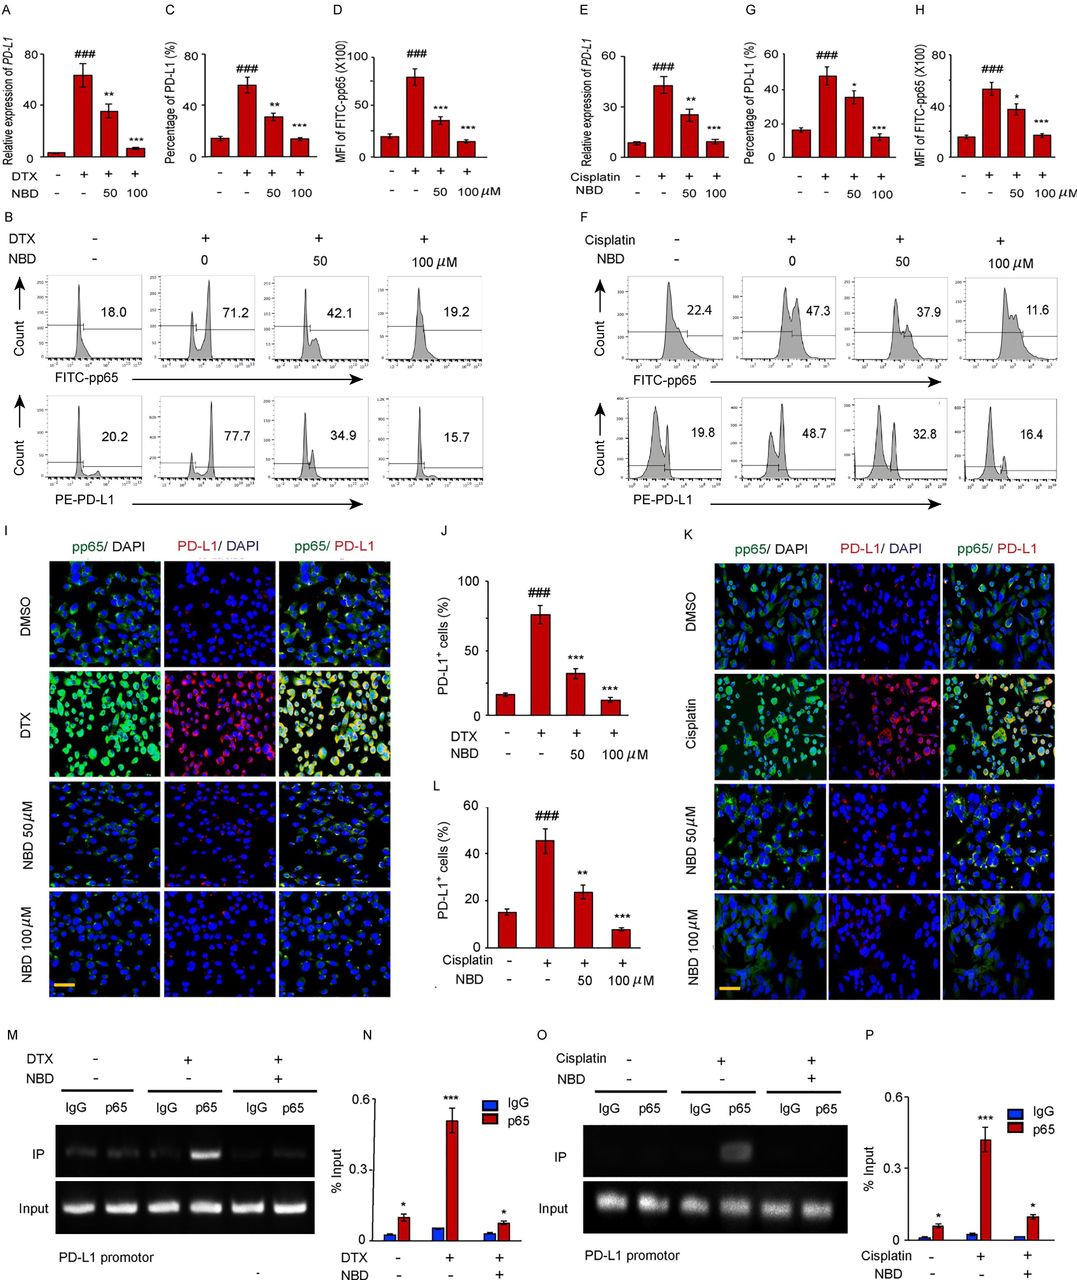
To determine whether ATM activated NF-κB and upregulated PD-L1 expression through NEMO, PC-3 cells were treated with the NBD followed by a treatment with either DTX or cisplatin. Then, the PD-L1 expressions were quantified by FACS. It was demonstrated that both 50 µM and 100 µM of NBD effectively block PD-L1 expression mediated by DTX (figure 4A–D) and cisplatin (figure 4E–H). The association of PD-L1 expression with NEMO mediated NF-κB activation was also confirmed by subjecting PD-L1 and pp65 to dual-color immunofluorescence after combined with NBD. We observed that DTX significantly induced pp65 positive staining in the nuclei of PC-3 cells. The intensity of pp65 in the cell nuclei was found to increase with the enhancement of the PD-L1 signal which is 1.6-fold higher for DTX than cisplatin treatment, and the NBD had attenuated the accumulation of pp65 in the nuclei concomitant with the downregulation of PD-L1 (figure 4I–L). The results of chIP assay showed that a markedly higher amount of chromosomal DNA containing the PD-L1 promoter was immunoprecipitated with the anti-p65 antibody compared with the control IgG after the DTX or cisplatin treatment. NBD strongly attenuated the binding of p65 to the PD-L1 promoter region which induced by both DTX or cisplatin (figure 4M–P). This finding supported the existence of a direct association between the PD-L1 expression and NEMO mediated p65 nuclear translocation.

The small NEMO blocking peptide (NBD) blocks PD-L1 expression induced by DTX. (A–D) PC-3 cells were exposed to 50 nM DTX following treatment with indicated doses of NBD. (A) PD-L1 gene expression after DTX treatment was quantified by qPCR. (B) PD-L1 and pp65 expressions were detected by FACS. (C) Percentage of PD-L1 positive cells were quantified from three experiments. (D) MFI of FITC-pp65 was quantified from three experiments. (E–H) PC-3 cells were exposed to 20 µM cisplatin with indicated doses of NBD. (E) PD-L1 gene expression was quantified by qPCR. (F) PD-L1 and pp65 expressions were detected by FACS. (G) Percentage of PD-L1 positive cells were quantified from three experiments. (H) MFI of FITC-pp65 was quantified from three experiments. (I, J) Co-immunostaining of pp65 (green) and PD-L1 (red) in the PC-3 cells after DTX and NBD treatment. (I) Representative images are from one of three sections from indicate treated groups. Scale bar, 20 µm. (J) Quantification of PD-L1 positive cells from three experiments. (K, L) Co-immunostaining of pp65 (green) and PD-L1 (red) in the PC-3 cells after cisplatin and NBD treatment. (K) Representative images are from one of three sections from indicate treated groups. Scale bar, 20 µm. (L) Quantification of PD-L1 positive cells from three experiments. ###P<0.001, compared with those of the non-treated group; *p<0.05, **p<0.01, ***p<0.001 compared with the chemotherapy only group. (M–P) CHIP assay. (M, N) CHIP assays with p65 antibody were performed in the PC-3 cells which treated with 50 nM DTX following treatment with 100 µM NBD. Bindings of p65 to PD-L1 gene promoters were quantified in (N). (O, P) CHIP assays with p65 antibody were performed in the PC-3 cells which treated with 20 µM cisplatin and 100 µM NBD. The results from three experiments were quantified in (P). All data are shown as the mean±SEM. *P<0.05, ***p<001 compared with the IgG groups. CHIP, chromatin immunoprecipitation; DTX, docetaxel; FACS, fluorescent-activated cell sorting; NEMO, NF-κB essential modulator; PD-L1, programmed cell death ligand-1; qPCR, quantitative PCR; SEM, SE of the mean.
ATM regulated PD-L1 expression through association with NEMO
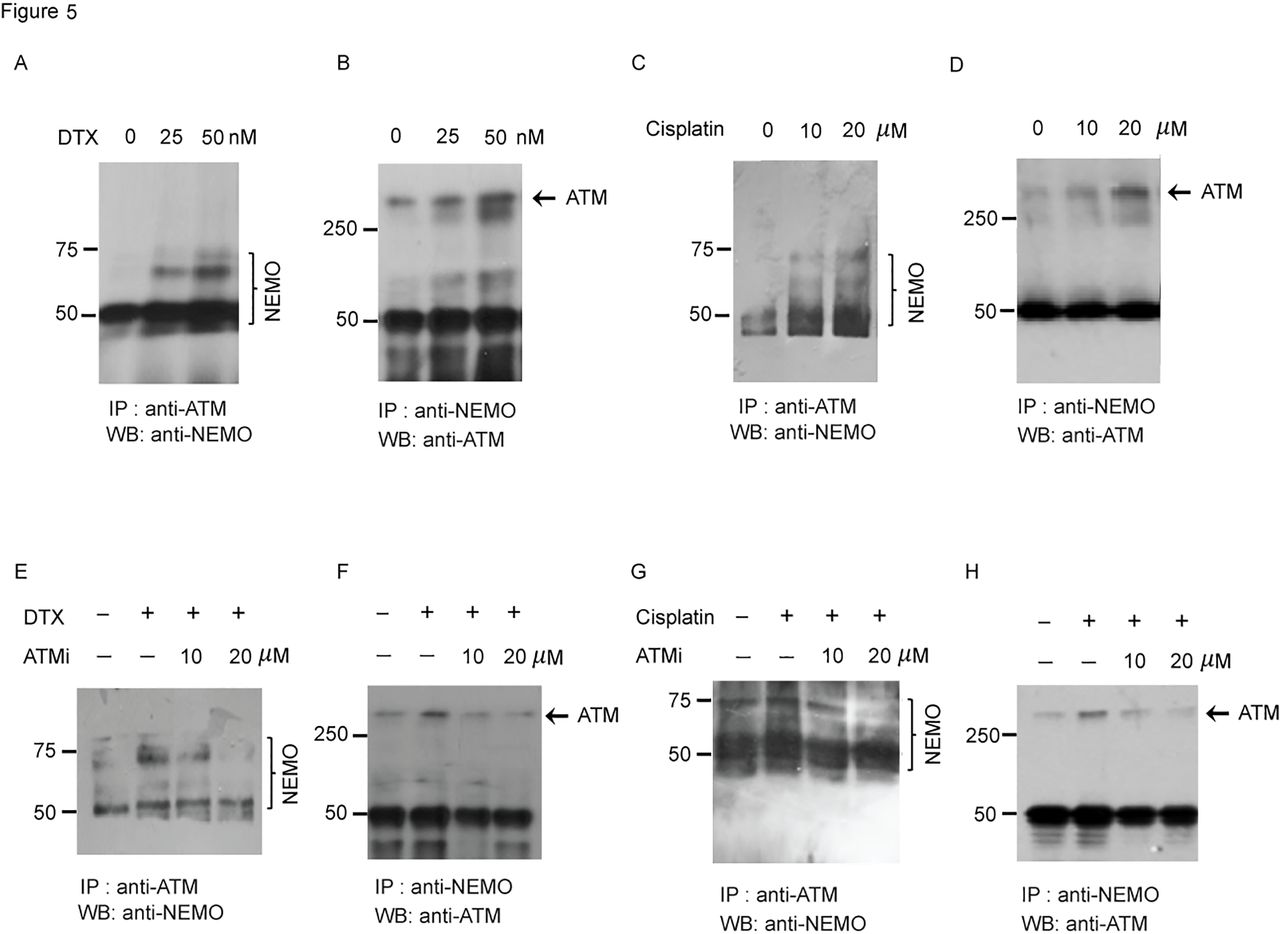
It has been reported that DNA damage inducing stress responses increased the ATM activation and binding to NEMO in the nuclei and a further study indicated that this mechanism also works with other cell toxic stress even without DNA damage.40 To further confirm that the interaction between ATM and NEMO is a critical event involved in the activation of PD-L1 in response to DTX, we performed co-immunoprecipitation (co-IP) experiment. Reciprocal co-IP, with anti-ATM, followed by immunoblotting with anti-NEMO or co-IP with anti-NEMO and immunoblotting with anti-ATM, showed enhanced stress-induced ATM-NEMO colocalization in the tumor cells after DTX (figure 5A,B) or cisplatin treatment (figure 5C,D). To confirm that NEMO and ATM interaction is dependent on the phosphorylation of ATM, PC-3 cells were treated with DTX plus KU55933 (figure 5E,F)or cisplatin plus KU55933 (figure 5G,H). The results of reciprocal co-IP showed that the binding of ATM to NEMO had decreased substantially in response to increase concentration of the ATM inhibitor, suggesting that the interaction between NEMO and ATM depends on ATM kinase activity.

ATM regulates PD-L1 expression by interacting with NEMO. (A, B) PC-3 cells were treated with DTX (0 nM, 25 nM, 50 nM) for 6 hours. (A) Association between DTX-induced ATM and NEMO was determined by the coimmunoprecipitation assay with anti-ATM (a mouse monoclonal IgG) followed by immunoblotting with anti-NEMO (a goat polyclonal antibody), and (B) anti-NEMO (a goat polyclonal IgG) followed by immunoblotting with anti-ATM (a mouse monoclonal antibody). Representative blots from three experiments are shown. (C, D) PC-3 cells were treated with cisplatin (0 µM, 10 µM, 20 µM) for 24 hours. (C) Association between ATM and NEMO was determined by the coimmunoprecipitation assay with anti-ATM, followed by immunoblotting with anti-NEMO and (D) anti-NEMO, followed by immunoblotting with anti-ATM. Representative blots from three experiments are shown. (E, F) PC-3 cells were treated with 50 nM DTX followed by ATM inhibitors or vehicle for 6 hours. (E) Association between ATM and NEMO was determined by the coimmunoprecipitation assay with anti-ATM, followed by immunoblotting with anti-NEMO, and (F) anti-NEMO followed by immunoblotting with anti-ATM. Representative blots from three experiments are shown. (G, H) PC-3 cells were treated with 20 µM cisplatin, followed by ATM inhibitors or vehicle for 24 hours. (G) Association between ATM and NEMO was determined by the co-immunoprecipitation assay with anti-ATM followed by immunoblotting with anti-NEMO, and (H) anti-NEMO followed by immunoblotting with anti-ATM. Representative blots from three experiments are shown. ATM, ataxia telangiectasia mutation; DTX, docetaxel; NEMO, NF-κB essential modulator; PD-L1, programmed cell death ligand-1.
Moreover, we found that oxidative, ethanol and electric treatments which enhanced NF-κB signaling through NEMO SUMOylation also upregulated PD-L1 expression in PC-3 cells, suggesting the key role of SUMOylation of NEMO in regulating PD-L1 signaling (online supplemental figure 8).
DTX with either NEMO or ATM inhibitor restricted tumor growth in vivo
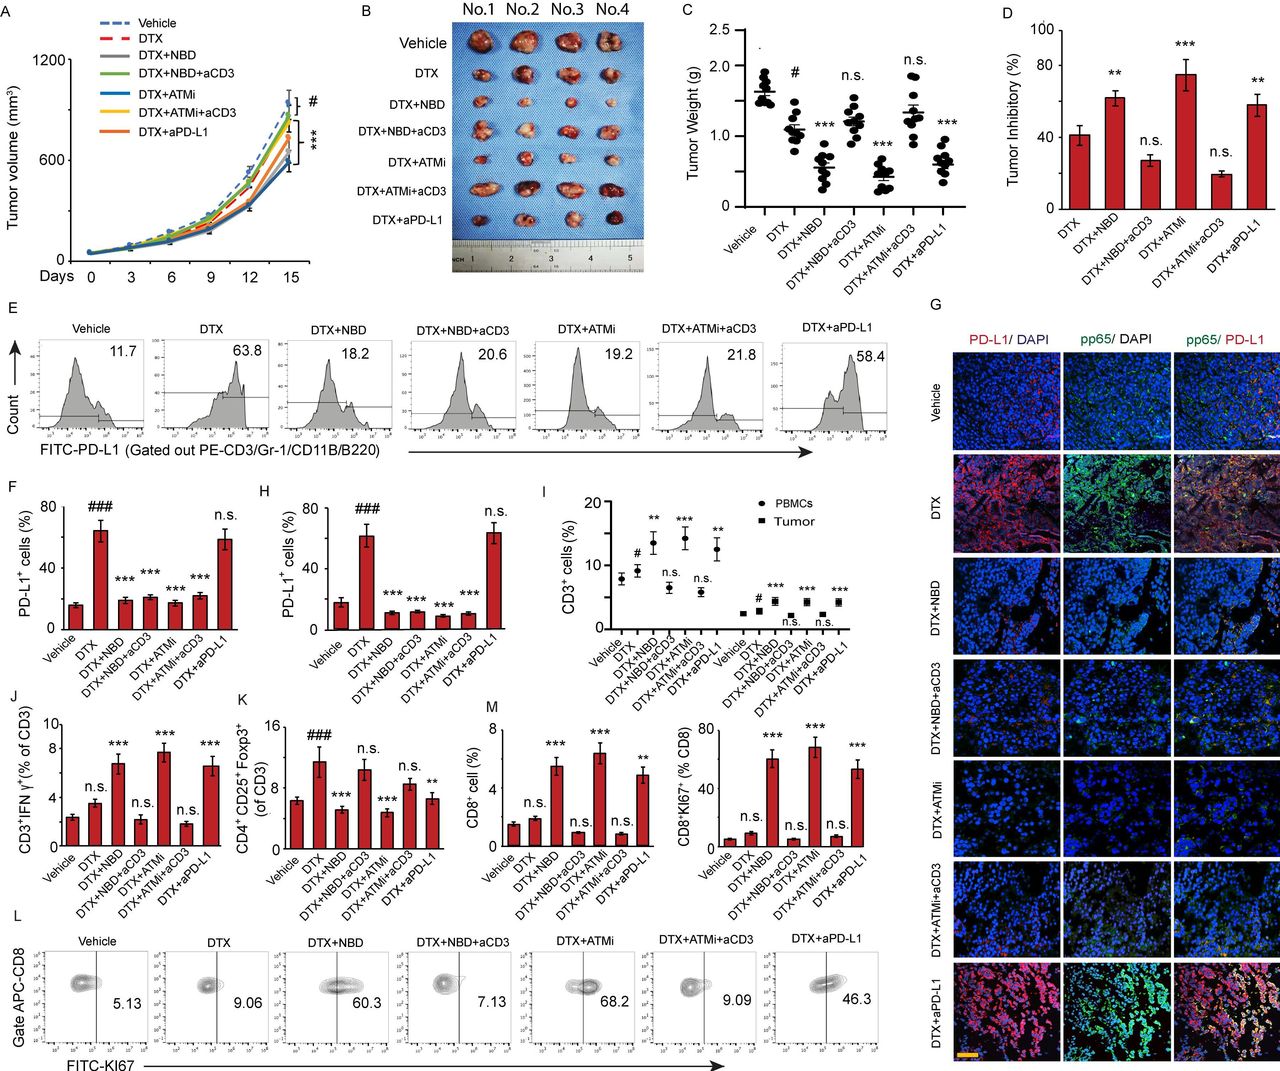
To determine whether inhibition of the ATM or NEMO could enhance the antitumor efficacy of DTX in vivo, RM-1 prostate cancer cells were injected into mice, which were subsequently treated with DTX, DTX plus KU55933, and DTX plus NBD separately, while DTX plus an anti-PD-L1 blockade was used as the therapeutic control. Although DTX alone attenuated the tumor growth, its antitumor efficacy was dramatically enhanced in combination with NBD or KU55933, which was as effective as anti-PD-L1 antibody, as indicated by the decreased tumor inhibitory rate (40.3% DTX vs. 62.8% NBD+DTX, 74.9% KU55933+DTX, 58.2% anti-PD-L1+DTX, p<0.001) (figure 6A–D). Furthermore, there was no significant difference in the antitumor effect of DTX combined with NBD or KU55933 and DTX alone when T cell function was blocked, suggesting that ATM and NEMO inhibition enhanced the antitumor effect of DTX mainly through T cells.
ATM and NEMO inhibitors promote the antitumor effect of DTX through downregulation of PD-L1. C57BL/6 mice implanted with RM-1 prostate tumors were divided to 7 groups with 10 mice per group and treated with (1) vehicle, (2) DTX, (3) NBD plus DTX, (4) NBD plus DTX and anti-CD3, (5) KU55933 plus DTX, (6) KU55933 plus DTX and anti-CD3, and (7) anti-PD-L1 plus DTX as a therapeutic control group. (A–D) ATM and NEMO inhibitors promote the antitumor effect of DTX. (A) Tumor volumes were measured at the indicated day after treatment. ANOVA, #p<0.05, compared with vehicle group; ***p<0.001, compared with DTX only group. (B) Photo of tumors in individual groups. (C) Mean tumor weight ±SEM. (D) Mean tumor inhibitory rate±SEM. (E–M) ATM and NBD inhibitors attenuate DTX-induced PD-L1 expression in prostate tumors. (E–H) Representative histograms of PD-L1 expression on cancer cells for the designated treatments with quantifications in (F). The results from three experiments. (G, H) Co-immunostaining of pp65 (green) and PD-L1 (red) in the implanted tumor sections. (G) Representative images are from one of three sections from the vehicle (n=10) and indicate treated groups (n=10). Scale bar, 20 µm. (H) Quantifications of PD-L1 positive cells in the sections from indicated treatments. (I–K) Effector function of tumor-infiltrating T cells. (I) CD3+ T cells distribution in total PBMCs and tumor tissue. (J) Ratio of CD3+IFN-γ+ T cells in total CD3+ T cells in tumor tissue. (K) Ratio of CD4+CD25+FOXP3+ regulatory T cells in total CD3+ T cells in tumor tissue. (L, M) The CD8+ T cells were first gated with APC-CD8 antibody, and then the KI67 expression was analyzed in CD8+ population with FITC-KI67 antibody. (L) Representative contour plots by FACS depicting KI67+ expression on tumor-infiltrating CD8+ T cells. (M) Quantitation of the percentages of CD8+ T cells and the percentages of proliferating CD8+KI67+ T cells in tumor. All data are shown as the mean±SEM. #P<0.05, ###p<0.001, compared with vehicle group; **p<0.01, ***p<0.001, compared with DTX only group. ANOVA, analysis of variance; DTX, docetaxel; IFN-γ, interferon-γ; NEMO, NF-κB essential modulator; n.s., non-significance; PBMCs, peripheral blood mononuclear cells; PD-L1, SEM, SE of the mean.
Mechanistic studies have indicated that DTX dramatically upregulated the expression of PD-L1. KU55933 and NBD blocked the DTX-induced PD-L1 upregulation (figure 6E,F), while dual color of tumor sections staining showed a substantial increase in the number of PD-L1+ cells with a strong pp65 signal in the nuclei of the DTX-treated sections, which was significantly reduced in the cells which treated with DTX in combination with NBD or KU55933 (figure 6G,H).
Moreover, an FACS analysis indicated that the combination of NBD or KU55933 could dramatically increase the T cell percentage both in circulation and tumors (figure 6I). Compared with the DTX-only group, DTX plus NBD or KU55933 significantly increased the ratio of CD4+IFNγ+ effector T cells and decreased the ratio of CD4+CD25+FOXP3+ regulatory T cells in the tumor (figure 6J,K). The immunotherapeutic effects of the KU55933 and NBD were comparable with the effects of anti-PD-L1 blockade. In addition, the combination of DTX with NBD or KU55933 increased the proliferation capacity of CD8+ T cells with a remarkable increase in the number of CD8+KI67+ T cells compared with DTX alone (figure 6L,M), suggesting that the inhibition of NEMO and ATM blocked the PD-L1-induced immunosuppression in prostate tumor, which was associated with exposure to DTX. Moreover, we did not observe any significant T cell activation in the groups combined with CD3 blockade antibody, supporting the notion that the antitumor effect of NEMO and ATM inhibitors depends on T cells.
To further confirm that pharmacological inhibition of NEMO and ATM enhances the antitumor efficacy of DTX, a chimeric mouse was created using PC-3 cells and PBMCs of patients (online supplemental figure 9A–H). Similar to the aforementioned results, the combination of NBD or KU55933 with DTX substantially increased the tumor inhibitory rate, while no therapeutic benefit of the combination treatment was observed in the T cell depletion groups (Online supplemental figure 9I–L). Furthermore, KU55933 and NBD attenuated the DTX-induced PD-L1 upregulation (online supplemental figure 9M–P). An immunohistochemically analysis of the CD3+ T cells in the tumor sections indicated that the inhibitors could dramatically increase the T cell tumor-infiltration and percentage of CD3+IFNγ+ effector T cells compared with that of DTX (online supplemental figure 9Q,R). Notably, the proliferation capacity of CD8+ T cells was also increased in the combination treatment groups (online supplemental figure 9S,T), confirming that the inhibition of NEMO and ATM plus DTX resulted in a significantly greater antitumor response than that by DTX alone.
Discussion
In this study, we showed that upregulation of PD-L1 expression contributed to the development of drug resistance for DTX. Moreover, we identified a new immunosuppressive and tumor promoting function of activated ATM combined with NEMO in response to DTX chemotherapy. We demonstrated that NEMO specifically binds to ATM and activates NF-κB, which is essential for PD-L1 expression in prostate cancer cells after DTX treatment.
DTX, which promotes microtubule stabilization, thus ensuring that cancer cells remain in the G2/M phase, is the first-line treatment for the advanced mPCa.11–13 However, DTX-resistance is a major cause of disease recurrence and progression. The interaction between PD-1 and PD-L1 leads to immune escape, which is one of the most important mechanisms of tumor resistance. In this study, we demonstrated that PD-L1 expression in prostate cancer cells was significantly upregulated by DTX. ATM kinase is critical for the regulation of the cell cycle checkpoint. An important assumption of this study is possible activation of ATM kinase by DTX treatment, which attenuates cells during the G2/M phase.
The classical activator for ATM is DNA damage. Recently, studies have suggested that PD-L1 expression is significantly upregulated by ATM mediated DDR signaling.22–24 41 Here, we observed the strong increase in the PD-L1 expression after the cisplatin treatments in prostate cancer cells and noted that ATM largely contributed to the upregulation of the PD-L1 expression in cancer cells in response to cisplatin. Further mechanistic studies have indicated that activated ATM associate with NEMO, which subsequently activates NF-κB, is required for ATM mediated PD-L1 expression.40 42 43 Therefore, our study has first identified a previously uncharacterized role of ATM-NEMO signaling in promoting PD-L1 transcription following chemotherapeutics.
One of the key mechanistic questions was whether the dual signal initiation model of ATM-NEMO for the PD-L1 upregulation was relevant to the PD-L1 upregulation following DTX chemotherapy in prostate cancer, which does not induce obvious DNA damage signaling. Indeed, we found that chemotherapeutic treatment with DTX caused a 2-fold higher of PD-L1 induction than cisplatin with a considerably lower dose in prostate cancer cells. Consistently, this activation involved both ATM activation and ATM-NEMO binding. Moreover, both ATM and NEMO function inhibition can blunt the PD-L1 in prostate cancer cells induced by DTX. These results revealed a novel mechanism of DTX resistance by the upregulation of PD-L1.
Our findings are clinically significant and highly relevant for the treatment of cancers that lack PD-L1 expression, such as prostate cancer. Recent reports on the PD-1/PD-L1 immunotherapy for prostate cancer are relatively disappointing.44 45 However, we have observed an increased PD-L1 expression after DTX treatment, which correlated with tumor progression in the mouse bearing the prostate tumor. The combination of DTX with the pharmacological inhibition of ATM or NBD attenuated DTX-induced PD-L1 upregulation, which had synergistically enhanced the anti-tumor efficacy of DTX.46 Mechanistically, DTX dramatically promoted the nuclear translocation of NF-κB p65 and induced PD-L1 expression. ATM phosphorylates NEMO, which results in NEMO SUMOylation, is a key step for NF-κB p65 nuclear translocation. We observed that a dose-dependent increasing of ATM-NEMO association after DTX treatment. Therefore, the NF-κB-PD-L1 axis was activated by DTX through promoting ATM-NEMO binding. ATM inhibition effectively interrupted ATM interaction with NEMO and NBD specifically blocked NEMO activation. Thus, the inhibition of NEMO and ATM along with DTX resulted in a significantly greater antitumor response than that of DTX alone.
The question was raised how ATM-NEMO mediates PD-L1 expression, which can be related to the enhanced immunosuppression following DTX chemotherapy. It has been reported that PD-1 is upregulated on the tumor-infiltrating T cells in the tumor microenvironment of prostate cancer,47 which characterized by lacking the expression of perforin and IFN-γ.48–50 We found that suppressing the PD-L1 expression by inhibiting NEMO and ATM increased the number of circulating and tumor-infiltrating T cells in both RM-1 and PC-3 tumor-bearing mice. Specifically, an increase percentage of the IFN-γ positive cytotoxic T cells and decrease of the regulatory T cells contribute to the reverse of the immunosuppressive state of tumor. Furthermore, an increase in the proliferation capacity of CD8 T cells may also play an important role in the enhancing of the antitumor effect of DTX.
Conclusion
Our study identified a previously uncharacterized type of ATM-NEMO signaling induced by DTX capable of suppressing the tumor immunity by activating PD-L1 expression. The present findings indicated that combination treatment with DTX and NEMO or ATM inhibitors can be exploited to develop a new therapeutic strategy to overcome cancer immune tolerance associated with the use of DTX, providing an alternative to PD-L1 antibodies as a means of restoring cancer immunity. This might be of great benefit for patients resistant to antibody therapy.
Supplemental material
Data availability statement
Data are available on reasonable request. The datasets used and/or analyzed during the current study are available from the corresponding author on reasonable request.
Ethics statements
Ethics approval
The ethical approval was authorized by the Institutional Review Board of the First Affiliated Hospital of Sun Yat-sen University, and written consent was obtained from all patients included.
Acknowledgments
We thank all patients and medical staff who generously contributed to this study. All authors have read and approved the final submitted version of the manuscript.
References
Supplementary materials
Supplementary Data
This web only file has been produced by the BMJ Publishing Group from an electronic file supplied by the author(s) and has not been edited for content.
Footnotes
ZW, XZ and WL contributed equally.
Contributors All authors were involved in drafting the article or revising it critically for important intellectual content. Study conception and design: ZW, XZ, WL, LC and LS. Acquisition of data: ZW, XZ, WL, QS, ZYH, XZ, HC, CM, BH, WO, JC and GZ. Analysis and interpretation of data: ZW, XZ, WL, LC and LS.
Funding This work was supported by the National Natural Science Foundation of China (grant no. 81901849 and 82071818), the Guangdong Natural Science Foundation (grant no. 2018A030310328 and 2021A1515011030), Medical Scientific Research Foundation of Guangdong Province, China (grant no. A2018344).
Competing interests No, there are no competing interests.
Provenance and peer review Not commissioned; externally peer reviewed.
Supplemental material This content has been supplied by the author(s). It has not been vetted by BMJ Publishing Group Limited (BMJ) and may not have been peer-reviewed. Any opinions or recommendations discussed are solely those of the author(s) and are not endorsed by BMJ. BMJ disclaims all liability and responsibility arising from any reliance placed on the content. Where the content includes any translated material, BMJ does not warrant the accuracy and reliability of the translations (including but not limited to local regulations, clinical guidelines, terminology, drug names and drug dosages), and is not responsible for any error and/or omissions arising from translation and adaptation or otherwise.