Article Text

Abstract
Background Osteosarcoma is the most common malignant solid tumor that affects bones, however, survival rates of patients with relapsed osteosarcoma have not improved in the last 30 years. Oncolytic virotherapy, which uses viruses designed to selectively replicate in cancer cells, has emerged as a promising treatment for solid tumors. Our group uses mesenchymal stem cells (MSCs) to transport oncolytic adenoviruses (OAds) to the tumor site, a therapeutic strategy called Celyvir. This treatment has been already applied in human patients, canine patients and different mouse models. In parallel, previous results have probed that administration of granulocyte-colony stimulating factor (G-CSF) increased immune infiltration in tumors. We then hypothesized that the mobilization of immune cells by G-CSF may increase the antitumor efficacy of Celyvir treatment by increasing the immune infiltration into the tumors.
Methods In this study, we use a murine version of Celyvir consisting in murine MSCs carrying the murine OAd dlE102—here called OAd-MSCs—in an immunocompetent model of osteosarcoma. We tested the antitumoral efficacy of the combination of OAd-MSCs plus G-CSF.
Results Our results show that treatment with OAd-MSCs or the union of OAd-MSCs with G-CSF (Combination) significantly reduced tumor growth of osteosarcoma in vivo. Moreover, treated tumors presented higher tumor infiltration of immune cells—especially tumor-infiltrating lymphocytes—and reduced T cell exhaustion, which seems to be enhanced in tumors treated with the Combination. The comparison of our results to those obtained from a cohort of pediatric osteosarcoma patients showed that the virotherapy induces immunological changes similar to those observed in patients with good prognosis.
Conclusions The results open the possibility of using cellular virotherapy for the treatment of bone cancers. Indeed, its combination with G-CSF may be considered for the improvement of the therapy.
- immunotherapy
- lymphocytes
- tumor-infiltrating
- oncolytic virotherapy
- programmed cell death 1 receptor
- t-lymphocytes
This is an open access article distributed in accordance with the Creative Commons Attribution Non Commercial (CC BY-NC 4.0) license, which permits others to distribute, remix, adapt, build upon this work non-commercially, and license their derivative works on different terms, provided the original work is properly cited, appropriate credit is given, any changes made indicated, and the use is non-commercial. See http://creativecommons.org/licenses/by-nc/4.0/.
Statistics from Altmetric.com
- immunotherapy
- lymphocytes
- tumor-infiltrating
- oncolytic virotherapy
- programmed cell death 1 receptor
- t-lymphocytes
Background
Osteosarcoma is the most common malignant solid tumor that affects bones, comprising the 20%–40% of total new diagnosed bone cancers.1 The peak incidence occurs in children and adolescents, with a second peak in those over the age of 50.1–3 Most of osteosarcoma primary tumors arise in the long bone of the limbs and are commonly located in the femur, the tibia and the humerus.4–6 The standard protocol for osteosarcoma is surgery of the primary tumor and metastases in combination with chemotherapy, which cures 60%–70% of patients. However, the 5-year survival rate of patients with metastatic or relapsed osteosarcoma is only 30% and has not changed over the past 30 years.6 7 For this reason, new therapeutic strategies for osteosarcoma need to be developed.
Cancer immunotherapy has emerged as a promising option for the treatment of solid and refractory tumors. Among the increasing variety of immunotherapies, oncolytic virotherapy uses replication-selective viruses to lyse cancer cells and activate the immune response. Following a Trojan horse strategy, our group has been working for several years in the treatment called Celyvir, consisting in human mesenchymal stem cells (MSCs) loaded with the human oncolytic adenovirus (OAd) ICOVIR-5.8 9 As MSCs present tumor tropism,10 their use as cell vehicle allows the systemic administration of the oncolytic virus, delivering high number of viral particles directly into the tumors and even improving the efficacy when compared with the administration of the virus alone.11–13
This therapy has been already tested in a clinical trial (NCT01844661) of children presenting refractory solid tumors that resulted in clinical benefits—including two complete remissions—, and an excellent safety profile.14–17 A canine variant of the therapy using dog MSCs infected with ICOCAV17—a canine OAd homologous to ICOVIR-518—has also been successfully applied in a veterinary trial of dogs presenting spontaneous solid tumors.19 The response rate was 74%, with 14.8% showing complete responses. More specifically, from the six dog patients presenting advanced osteosarcoma, two of them (33.3%) presented stabilization of the disease after treatment. These results invite to further study our viroimmunotherapy for improving this treatment in osteosarcomas.
Previous studies using oncolytic viruses in osteosarcoma models showed promising results, but most of them were performed in vitro or in immunodeficient mice, which may not mimic the real antitumor response observed in the clinic.7 20–22 Although we have developed special immunocompetent mouse models to study human OAd,23 24 these preclinical models are limited, as murine cells do not support complete replication cycle of human adenovirus.23 In order to overcome these inconveniences, we have recently developed, together with our collaborators, a complete murine version of this therapy using mouse MSCs infected with the OAd dlE102 (OAd-MSCs).25 26 OAd dlE102 is a modified mouse adenovirus type 1 that replicates selectively in murine cells with defective pRb pathway,27 which is usually found in osteosarcoma tumors.28 The administration of OAd-MSCs in immunocompetent mouse models of neuroblastoma, melanoma and renal cancer did not only reduced tumor volume but also increased the density of tumor-infiltrating lymphocytes (TILs) and CD8+ T cells in treated tumors, which recapitulated the results obtained in our clinical trials.25 26
In order to improve the antitumor effect of our cellular virotherapy, we have considered its combination with other therapeutic agents. Granulocyte-colony stimulating factor (G-CSF) is used to reduce risk of neutropenic complications in high-risk cancer patients and has been used in patients presenting different types of cancer, including osteosarcoma.29 30 Indeed, it has been published that all-cause mortality is reduced in patients receiving chemotherapy plus G-CSF support.31 Moreover, previous results shared by our collaborators showed that subcutaneous administration of G-CSF increased immune infiltration in tumors.32 This higher tumor infiltration has been extensively associated with better prognosis in different types of cancer and better therapeutic response to immunotherapies.33–35 We then hypothesize that the mobilization of immune cells by G-CSF may induce the immune infiltration in the tumors and therefore increase the antitumor efficacy of our cellular viroimmunotherapy.
We here study the antitumor efficacy of OAd-MSCs or the combination of OAd-MSCs with G-CSF (Combination) in an immunocompetent mouse model of osteosarcoma. Our results show that osteosarcoma tumors treated with OAd-MSCs or Combination significantly reduced tumor growth compared with control groups. Interestingly, Combination treatment seems to enhance the tumor infiltration of immune cells, especially of TILs, a well-known marker associated with better prognosis in different types of cancer, including osteosarcomas.
Methods
Cell lines
Two different murine osteosarcoma cell lines were used: K5 cells were obtained from a spontaneous BALB/c mouse osteosarcoma and has been extensively described,36 while MSCs deficient for p53 and Rb (p53−/−Rb−/− MSCs) were obtained in our laboratory as previously described.37 38 All cell lines were cultured in complete Dulbecco’s Modified Eagle’s Media (DMEM) (Lonza, 12–604F): DMEM supplemented with 10% fetal bovine serum (FBS) (Sigma-Aldrich, Missouri, USA), streptomycin (100 mg/mL; Lonza, Basel, Switzerland), penicillin (100 U/mL; Lonza) and glutamine (2 mM; Lonza) at 37°C in a humidified atmosphere with 5% CO2. Cells were routinely tested for mycoplasma.
OAd and citotoxicity assays
The OAd dlE102 was previously developed and described by Dr Katherine Spindler’s group.27 39 For luciferase viability assay, K5 cells and p53−/−Rb−/− MSCs were transduced with a lentiviral vector expressing the firefly luciferase. As firefly luciferase use ATP to oxidize D-Luciferin, the resulting production of light can be measured as surrogate value of active firefly luciferase produced by viable cells. Transduced cells were infected with dlE102 at multiplicity of infection (MOI) 1 and 10 for 2 hours at 37°C in DMEM without FBS. Cells were washed with phosphate-buffered saline (PBS) to remove the virus from the cell culture supernatant, and 15,000 cells/well were seeded in 48-well plate with complete DMEM. Four days later, cells were collected and luciferase activity was assayed using the Luciferase Assay System (Promega Corporation). For cytotoxicity in vitro experiments, K5 cells and p53−/−Rb−/− MSCs were infected at MOI 1, 10, 25 and 50 as described before. Seven days later, supernatant and cells were collected and cytotoxicity was measured using LIVE/DEAD viability/cytotoxicity kit for mammalian cells (L3224, Thermo Fisher Scientific).
Animal experiments
For in vivo antitumor efficacy experiments, subcutaneous tumors were established by injecting 1×10⁶ K5 cells into 7-week-old BALB/c mice. According to the treatment, groups were assigned as PBS (n=11), MSC (n=4), G-CSF (n=9), OAd-MSC (n=9) or Combination (G-CSF and OAd-MSC, n=7). For the preparation of OAd-MSC treatment, MSCs were infected with the OAd dlE102 at MOI 1 for 1 hour at 37°C in DMEM without FBS. Cells were washed two times with PBS to remove the virus from the supernatant prior to inoculation. Administration of treatment started when tumors were properly measurable (day 0), with intraperitoneal doses established as 1×10⁵ cells/mouse (MSCs or OAd-MSCs). A total of three doses were administered, separated by 4–5 days from one another. Administration of G-CSF (Filgrastim, Neupogen, Amgen Europe B.V.) in the corresponding groups (G-CSF and Combination) started 2 days before the first dose of OAd-MSCs (day −2), with two daily subcutaneous doses of G-CSF (250 µg/kg/day, 125 µg/kg/dose) separated by 8 hours during 5 days. Tumor length (L), width (W) and height (H) were measured with a caliper periodically and tumor volume was calculated as  . For Kaplan-Meier survival curves, a final volume of 100 mm3 was considered and log-rank (Mantel-Cox) test was used. Tumor weight was measured at end point.
In vivo X-ray imaging of tumors were obtained at day 13 using IVIS 200 imaging system (Caliper) and images were quantified using Living Image software (Xenogen). Two weeks after the first treatment, mice were sacrificed, and tumors were processed for flow cytometry and histology analysis.
Flow cytometry
Extracted tumors were digested with collagenase IV (1 mg/mL) in agitation for 1 hour at 37°C and mechanically homogenized using a potter-elvehjem polytetrafluoroethylene pestle when necessary. Cell suspensions were filtered through a sterile 70 µM nylon mesh cell strainer and red blood cells were lysed by incubation with Quicklysis buffer (Cytognos, Salamanca, Spain). Cell suspensions were blocked with mouse FcR Blocking (Miltenyi Biotec, Madrid, Spain) for 15 min and incubated with the following mouse monoclonal antibodies for 20 min at 4°C: CD45 (clone 30-F11), CD3 (clone 145-2 C11), CD4 (clone GK1.5), CD8 (clone 53-6.7), CD11b (clone M1/70), MHCII (clone M5/114.15.2), Ly6G (clone 1A8-Ly6g), CD206 (clone C068C2) and CD49b (clone DX5), all of them from eBioScience-Thermo Fisher Scientific; and programmed cell death protein 1 (PD-1) (clone 29F.1A12) from BioLegend (San Diego, California, USA). After incubation, cells were washed and labeled with the viability marker 7-aminoactinomycin (7AAD; Thermo Fisher Scientific) for 10 min at room temperature. Samples were acquired with MACSQuant Analyzer cytometer and analyzed using MACSQuantify analysis software (Miltenyi Biotec).
Density of the following immune cell populations was normalized to tumor weight to allow for comparisons: leukocytes (CD45+); T cells (CD45+ CD3+), subclassified in helper T cells (CD4+) and cytotoxic T cells (CD8+); natural killer (NK) cells (CD45+ CD49b+); and myeloid cells (CD45+ CD11b+), subclassified in monocytes (Ly6G− MHCII−), macrophages (Ly6G− MHCII+) and neutrophils (Ly6G+ MHCII−). M2 and N2 subsets were also considered (CD206+).
Histopathology analysis
Tumor samples were fixed and embedded within Tissue-Tek O.C.T. (4583, Sakura Europe). Ten-micrometer thick sections were stained following standard Masson’s trichrome staining protocol. Ossified mineralized and cellular areas were quantified in ImageJ applying a color threshold of 135–170 for mineralized staining. For immunohistochemistry (IHC) analysis, samples were subjected to Avidin/Biotin blocking (SP-2001, Vector Laboratories) after antigen retrieval with citrate buffer (pH=6) and endogenous peroxidase inhibition with 70% methanol, and then incubated overnight with anti-CD45 antibody conjugated to biotin (10 mg/mL, clone 30F11, Affymetrix, California, USA). Following the incubation, samples were treated with ABC kit (PK-6100, Vector Laboratories) and stained with DAB solution (SK-4100, Vector Laboratories) for the detection. All the samples were dyed with Meyer’s hematoxylin (SLCC8417, Sigma-Aldrich). Representative maps of the tumors and detailed images were obtained using NanoZoomer-SQ Digital slide scanner (C13140-01, Hamamatsu) and NDP.view2 viewing software (U12388-01, Hamamatsu).
Western blot and cytokine array
Tumor samples were mechanically and chemically disaggregated with radioimmunoprecipitation assay buffer and sonicated on ice. 20–50 µg of total protein were loaded on SDS‐PAGE gels and transferred to polyvinylidene difluoride membranes (Invitrogen, Thermo Fisher Scientific). Membranes were incubated overnight at 4°C with the primary antibodies biotin anti-CD45 (clone 30F11, Affymetrix), andhorseradish peroxidase (HRP)-conjugated anti-TATA-box binding protein (TBP). Membranes were washed with 0.1% PBS‐Tween 20 and stained using anti-CD45 with DAB solution (SK-4100, Vector Laboratories) for 15 min. Proteins were detected using Immobilon Western Chemiluminescent HRP Substrate (Millipore, Burlington, Massachusetts, USA) and images were acquired using ChemiDoc MP Imaging System (Biorad).
Extracted proteins from the tumor samples were also used to study the pro-inflammatory cytokines in the tumor microenvironment. Three hundred micrograms of protein from a pool of three tumors per group were used to perform the cytokine array assay following manufacturer’s indications (Proteome Profiler Mouse Array Panel A kit, ARY006, R&D Systems, Minnesota, USA). Cytokine expression was measured semi-quantitatively by pixel density of duplicated spots using ImageJ software.
Human osteosarcoma datasets and bioinformatics analysis of immune cells abundance
RNA-seq data of 100 human osteosarcoma specimens generated by the Therapeutically Applicable Research to Generate Effective Treatments (TARGET-phs000471) initiative were used in bioinformatics studies (https://ocg.cancer.gov/programs/target). Gene expression data were downloaded from TARGET data portal (https://portal.gdc.cancer.gov/projects) and mounted in a single data matrix on GALAXY (https://usegalaxy.org/). Immune infiltrating cells were estimated with Immune Cell Abundance Identifier (ImmuCellAI) web tool (http://bioinfo.life.hust.edu.cn/ImmuCellAI%23!/).40 ImmuCellAI is a novel gene set signature-based method for precisely estimating the abundance of 24 immune cell types, which were subsequently grouped according validated antigenic marker expression to match flow cytometry immunophenotyping panel (for subtypes grouping, see online supplemental figure 1).
Supplemental material
Human osteosarcoma survival analysis
Clinical information in terms of overall survival and vital status of the human osteosarcoma patients were associated to the previously estimated immune infiltrating cells abundance. The study cohort includes 58 patients still alive and 42 patients who have died. Survival analyses were performed using Cancer Survival Analysis Suite web application (http://bbisr.shinyapps.winship.emory.edu/CASAS/).41 Survival curves were generated using Kaplan-Meier method and log-rank test was used to test for differences in survival; p<0.05 was considered statistically significant. A univariate cox proportional hazard regression analysis was used to identify association between the abundance of immune infiltrating cells subset and overall survival; type 3 p values <0.05 were considered statistically significant and further validated by Schoenfeld residual test for proportional hazard assumption (online supplemental figure 1).
Statistical analysis
Data were analyzed and graphed with GraphPad Prism V.9 (GraphPad Software, California, USA). In vitro results were expressed as the mean+SD and in vivo results were expressed as the mean+SEM, as indicated in the figure legends. Significant differences were determined using unpaired parametric or non-parametric tests (t-test or Mann-Whitney U test, respectively). *p≤0.05, **p≤0.01, ***p≤0.001, ****p≤0.0001.
Results
OAd dlE102 induces cytopathic effect in osteosarcoma murine cells in vitro
The oncolytic effect of the OAd dlE102 was tested using two different assays in the murine tumor cell lines K5 and p53−/−Rb−/− MSCs, which has been seen to generate osteosarcomas.37 38 First, a viability assay after infection at different MOI was performed by flow cytometry (figure 1A). In both cases, infection with dlE102 at MOI 1 induced cell death (~30%) after 7 days compared with the mock condition. However, this oncolytic effect was remarkably observed and significantly increased after infection at higher MOI 10, 25 or 50 (80%–90%), with no remarkable differences regarding MOI or cell line (figure 1A,B). For further analysis, a luminescence viability assay was also performed, in which K5 cells and p53−/−Rb−/− MSCs were transduced with a lentiviral vector containing a firefly luciferase cassete, so alive cells would emit luminescence when the substrate is added. Four days after infection with the OAd dlE102 at MOI 1 and 10, significant reduction of alive cells was observed in those infected with the higher condition (figure 1C). Cytopathic effect was also observed in K5 cells and p53−/−Rb−/− MSCs 4 days after infection with the OAd dlE102 at MOI 10 (figure 1D). These results demonstrate that the OAd dlE102 induces cell death of murine osteosarcoma cells in vitro.
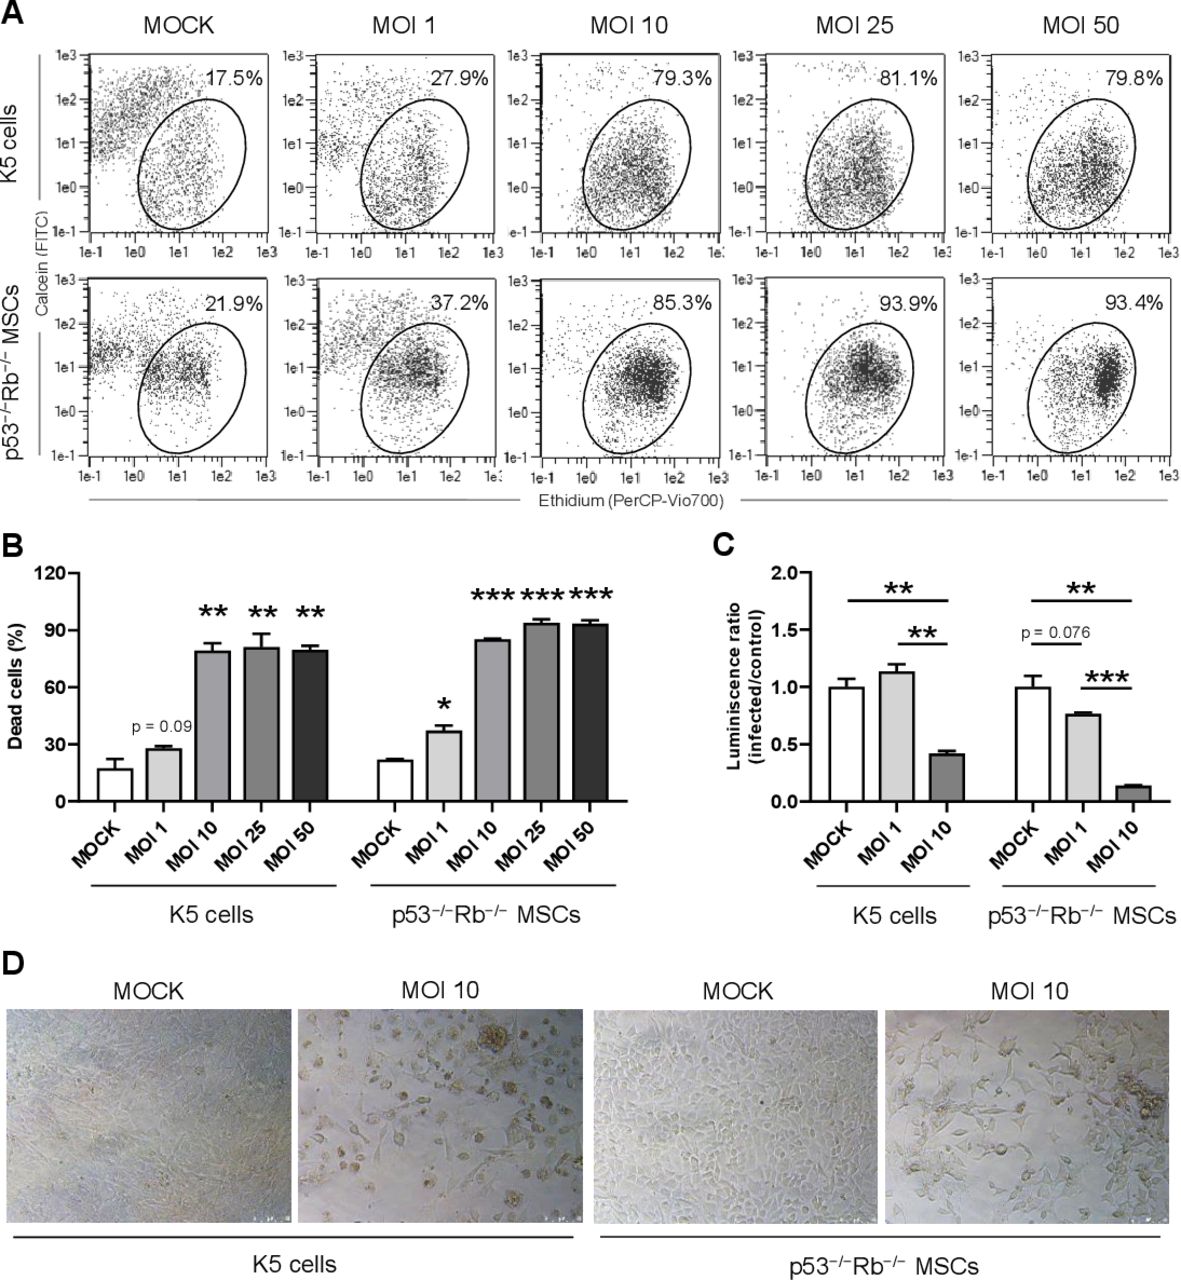
In vitro oncolytic effect of oncolytic adenovirus dlE102 in murine osteosarcoma cell lines. (A) For flow cytometry viability assay, cells were infected at different MOI (1–50) and cytotoxicity was measured 7 days later using LIVE/DEAD viability kit, showing red fluorescence for dead cells and green fluorescence for live cells. (B) Percentages refers to dead cells and statistical differences are compared with control group. (C) For luciferase viability assay, K5 cells and p53−/−Rb−/− MSCs were transduced with a lentiviral vector containing a firefly luciferase cassette and infected at MOI 1 and 10. Luminescence of alive cells was quantified 4 days later and expressed as infected/control ratio. (D) Bright field pictures show the cytopathic effect of K5 cells and p53−/−Rb−/− MSCs 4 days after infection with dlE102 at MOI 10. The experiment was repeated twice (N=2). Unpaired t-test. *p<0.05, **p<0.01, ***p<0.001. MOI, multiplicity of infection; MSCs, mesenchymal stem cells.
Treatment of osteosarcoma with OAd-MSCs and its Combination with G-CSF induces similar significant antitumor effect in vivo
For in vivo antitumor experiments, we induced osteosarcoma tumors by subcutaneous inoculation of K5 cells in immunocompetent syngeneic BALB/c mice (figure 2A). When tumors were measurable, we homogeneously divided them in five groups according to the treatment: PBS, non-infected MSCs, G-CSF, OAd-MSCs or G-CSF followed by OAd-MSCs (called Combination). Administration of G-CSF started two days (day −2) before the first dose of OAd-MSCs (day 0, figure 2A) in the corresponding groups.

In vivo antitumor efficacy of OAd-MSCs and Combination in osteosarcoma. (A) Graph represents the experimental design and antitumor effect of OAd-MSCs and Combination in BALB/c mice bearing subcutaneous K5 tumors. Lines represent the mean+SEM of tumor volume in groups treated with PBS (black, n=11), MSCs (gray, n=4), G-CSF (dark gray, n=9), OAd-MSCs (blue, n=9) or Combination (red, n=7). (B) Representative pictures and tumor volumes at end point. Mann-Whitney U test. (C) Follow-up of tumor volume in mice treated with MSCs, G-CSF, OAd-MSCs or Combination (individual values) and PBS group (mean+SEM, black line). (D, E) Tumor weight and tumor growth at end point. Mann-Whitney U test. (F) Kaplan-Meier survival curve of treated mice. Log-rank (Mantel-Cox) test. *p<0.05, **p<0.01. G-CSF, granulocyte-colony stimulating factor; MSCs, mesenchymal stem cells; OAd-MSCs, MSCs carrying the murine OAd dlE102; PBS, phosphate-buffered saline.
At end point (day 14), mice treated with either OAd-MSCs or Combination presented decreased tumor volumes and tumor weights than the PBS and the other control groups (figure 2A–D). Correlation between tumor volume and tumor weight was individually checked and statistically confirmed (online supplemental figure 2A). However, although both treatments presented antitumor efficacy, the effect of the Combination treatment did not improve the observed using OAd-MSCs alone. As a result, tumor growth was significantly decreased in groups treated with OAd-MSCs or Combination compared with those treated with PBS (figure 2E). Additional control groups treated with non-infected MSCs or G-CSF alone did not induce any antitumor effect and presented similar or even increased tumor volumes and weights than the PBS group (figure 2A–D). Interestingly, survival analysis also showed significant increased survival of mice treated with Combination compared with mice treated with either PBS, MSCs or G-CSF alone (figure 2F).
Supplemental material
These results demonstrate the antitumor efficacy of OAd-MSCs and Combination therapy for the treatment of osteosarcoma, which is not induced by the solely action of the MSCs or G-CSF. The combination of OAd-MSCs with G-CSF does not seem to improve the observed antitumor effect of OAd-MSCs alone, both presenting similar decreased tumor growth.
Treatment of osteosarcoma with OAd-MSCs or Combination therapy induces tumor-infiltration of lymphocytes in vivo
It is well accepted that the activation of the immune response plays a relevant role in the mechanism of action of oncolytic virotherapies, leading to a pro-inflammatory environment in the tumor.7 42 Indeed, previous preclinical and clinical trials have demonstrated that treatment with OAd-MSCs induced higher infiltration of different immune cells in treated tumors.24 25 We then studied the tumor-infiltrating immune populations at end point of treated and control groups.
Flow cytometry analysis showed that tumors treated with OAd-MSCs or Combination tended to present higher density of leukocytes (CD45+) than control groups, as well as a slightly non-significant increase of NK cells. More interestingly, although osteosarcoma tumors treated with OAd-MSCs presented higher density of TILs, only those treated with Combination presented a significant increase of TILs compared with control groups (figure 3A). This general increase of adaptive immune cells was observed in both CD4+ and CD8+ TILs of tumors treated with OAd-MSCs or Combination, which also presented significantly lower CD4+/CD8+ ratio (figure 3A and online supplemental figure 2B).

Tumor-infiltrating immune cells in osteosarcoma. (A) Density of tumor-infiltrating leukocytes, NK cells, and adaptive immune cells at end point expressed as percentage per gram of tumor. CD4+/CD8+ ratio is also represented. (B, C) Percentage of tumor-infiltrating lymphocytes, CD4+ and CD8+ T cells expressing PD-1 or CD137. (D) Density of tumor-infiltrating innate immune cells. (E) Ratio of pro-inflammatory/anti-inflammatory status of macrophages (M1/M2) and neutrophils (N1/N2). Mann-Whitney U test (n=3–9). *p<0.05. G-CSF, granulocyte-colony stimulating factor; LMR, lymphocyte-monocyte ratio; MSCs, mesenchymal stem cells; NLR, neutrophil-lymphocyte ratio; NK, natural killer; OAd-MSCs, MSCs carrying the murine oncolytic adenovirus dlE102; PBS, phosphate-buffered saline; PD-1, programmed cell death protein 1
In-depth study of T cell exhaustion showed that tumors treated with OAd-MSCs or Combination presented signficant lower percentage of TILs expressing programmed cell death protein 1 (PD-1) than control groups, which was also observed in CD8+ T cell subset (figure 3B). Despite some variations, no clear differences in TILs expressing CD137+ (also known as 4-1BB) were found (figure 3C). In a similar way, study of innate immune populations at end point showed no clear differences between control and treated groups (figure 3D).
We also analyzed the neutrophil-lymphocyte ratio (NLR) and the lymphocyte-monocyte ratio (LMR) in the tumor, as high levels of NLR and low levels of LMR have been previously associated to adverse prognosis in osteosarcoma.43 44 In accordance with the efficacy results, tumors from control groups did show significant higher NLR and lower LMR compared with those treated with OAd-MSCs or Combination (figure 3E), suggesting a better prognosis of the groups treated with viroimmunotherapies. No differences were observed in M1/M2 or N1/N2 ratios (figure 3F).
These results indicate that treatment of osteosarcoma with OAd-MSCs or Combination induces tumor-infiltration of adaptive immune cells—especially CD8+ TILs—, together with a reduction of the CD4+/CD8+ ratio and the T cell exhaustion. Although not significant, this increased density of TILs seems to be slightly higher in tumors treated with the combination of OAd-MSCs with G-CSF rather than with OAd-MSCs alone.
Treatment with OAd-MSCs or Combination therapy induces infiltration of immune cells in the core of the osteosarcoma tumors
Location of immune cells inside the tumors is considered as an interesting prognostic indicator, as it is included as a valuable marker in the calculation of the immunoscore.45 While flow cytometry analysis allowed quantification of this increased infiltration in osteosarcoma tumors, location of the immune cells remained unknown, so we then performed an IHC analysis of CD45+ cells in tumors treated with PBS, OAd-MSCs or Combination (figure 4A–C and online supplemental figure 3A). Location of CD45+ cells in the PBS group was mainly observed in the periphery of the malignancy, as no positive signal was detected in the core of the tumor (figure 4A). However, tumors treated with OAd-MSCs or Combination showed infiltration of CD45+ cells in both the periphery and the core of the tumors (figure 4B,C).
Supplemental material
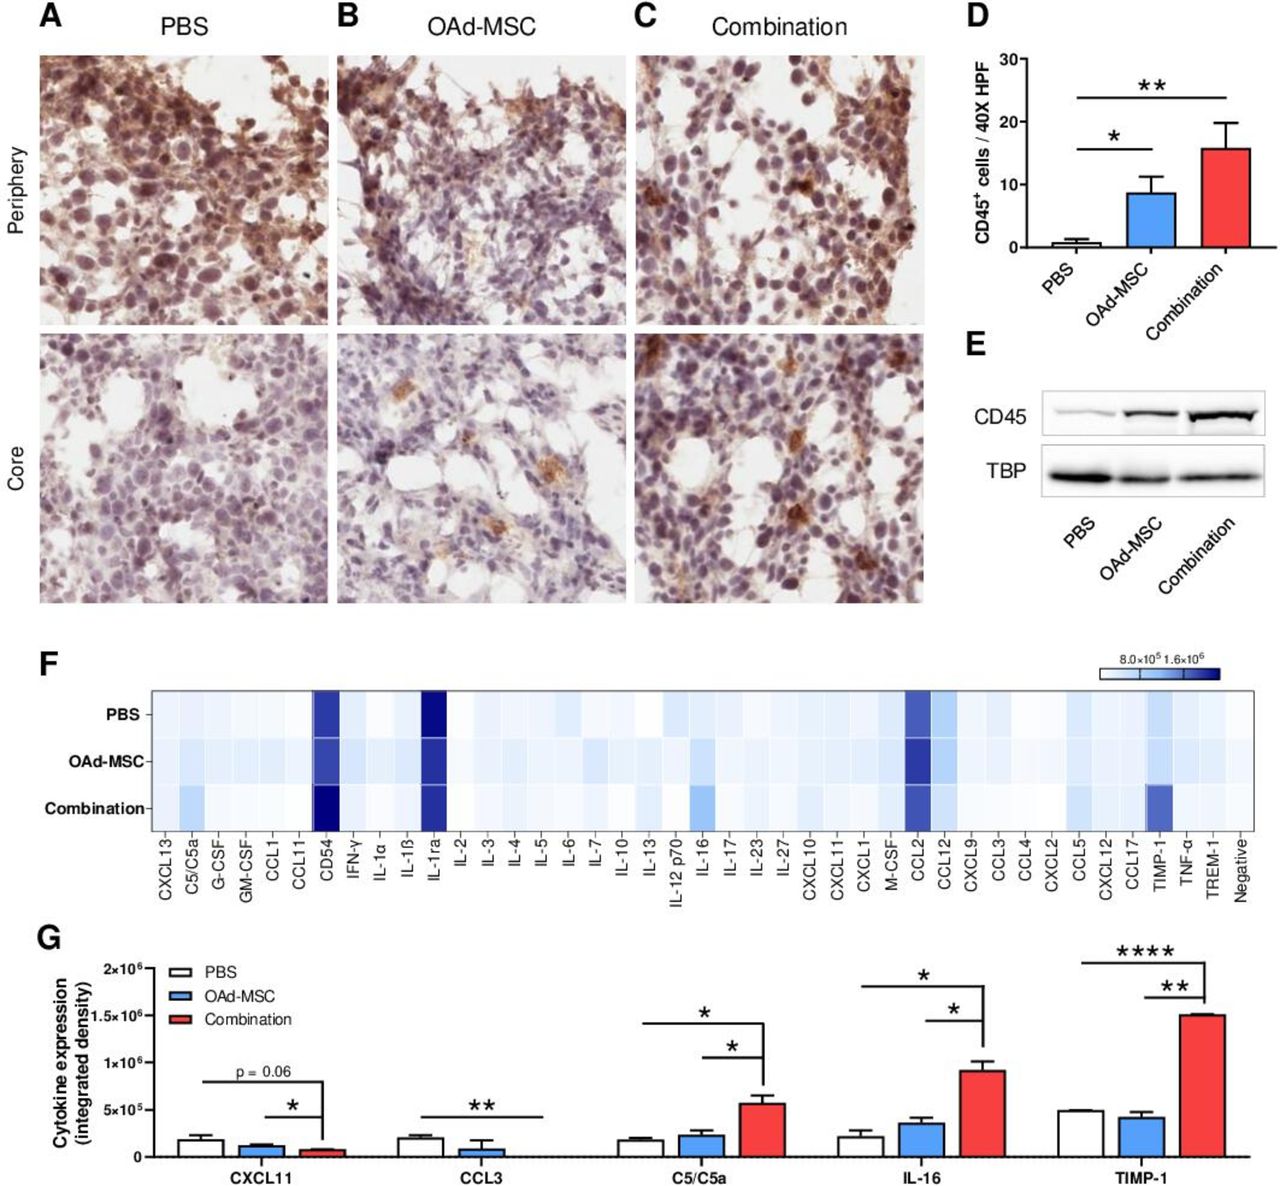
Leukocyte infiltration and tumor microenvironment in osteosarcoma after treatment with OAd-MSCs and Combination. (A–C) Representative images of immunohistochemistry of CD45+ cells in osteosarcoma tumors treated with PBS (A), OAd-MSCs (B) or Combination (C). Upper panel shows images of the periphery, while lower panel shows images of the core of the tumors. (D) Infiltration of CD45+ cells in tumors quantified in 40× high-power fields. (E) Protein expression of CD45 and TBP in tumors treated with PBS, OAd-MSCs or Combination. (F) Heat-map showing the pro-inflammatory cytokine array performed in tumors treated with PBS, OAd-MSCs or Combination. White represents the lowest expression while dark blue represents the highest expression. (G) Quantification by integrated density of pro-inflammatory cytokines differentially expressed in tumors treated with PBS, OAd-MSCs or Combination. Unpaired t-test. *p<0.05, **p<0.01, ***p<0.001, ****p<0.0001. OAd-MSCs, mesenchymal stem cells carrying the murine oncolytic adenovirus dlE102; PBS, phosphate-buffered saline; TBP, TATA-box binding protein.
Similar to results observed in flow cytometry, quantification of CD45+ cells (figure 4D) and western blot analysis (figure 4E) showed increased general infiltration of CD45+ cells in tumors treated with OAd-MSCs or Combination.
Analysis of pro-inflammatory cytokines in the tumor microenvironment (figure 4F) showed significant higher expression of C5/C5a, interleukin (IL)-16 and tissue inhibitor of metalloproteinase (TIMP)-1 in tumors treated with Combination compared with those treated with PBS or OAd-MSCs; while CXCL11 and CCL3 were reduced (figure 4G and online supplemental figure 3B,C).
These results suggest that treatment of osteosarcoma with OAd-MSCs and—especially—Combination may induce the infiltration of immune cells in the core of the tumors, probably due to a higher pro-inflammatory tumor microenvironment, as observed in the cytokine profile after treatment with Combination.
Treatment of osteosarcoma with Combination induces different histopathological characteristics in vivo, not clearly observed after treatment with OAd-MSCs
Afterwards, we decide to investigate the histopathological characteristics of the tumors. In vivo X-ray imaging showed that K5 tumors presented areas with two different histological phenotypes: an ossified mineralized area and a more cellular area (figure 5A). Interestingly, although tumors treated with OAd-MSCs presented a similar tendency, only tumors treated with Combination presented significant lower percentage of cellular area than the control groups (figure 5B). Indeed, this difference was also significant when comparing tumors treated with OAd-MSCs alone and those treated with Combination. We also studied this different phenotype using Masson’s staining (figure 5C), which resulted in a similar tendency (figure 5D). These findings suggest that treatment of osteosarcoma with the Combination therapy induces different histopathological characteristics in the tumors at end point.
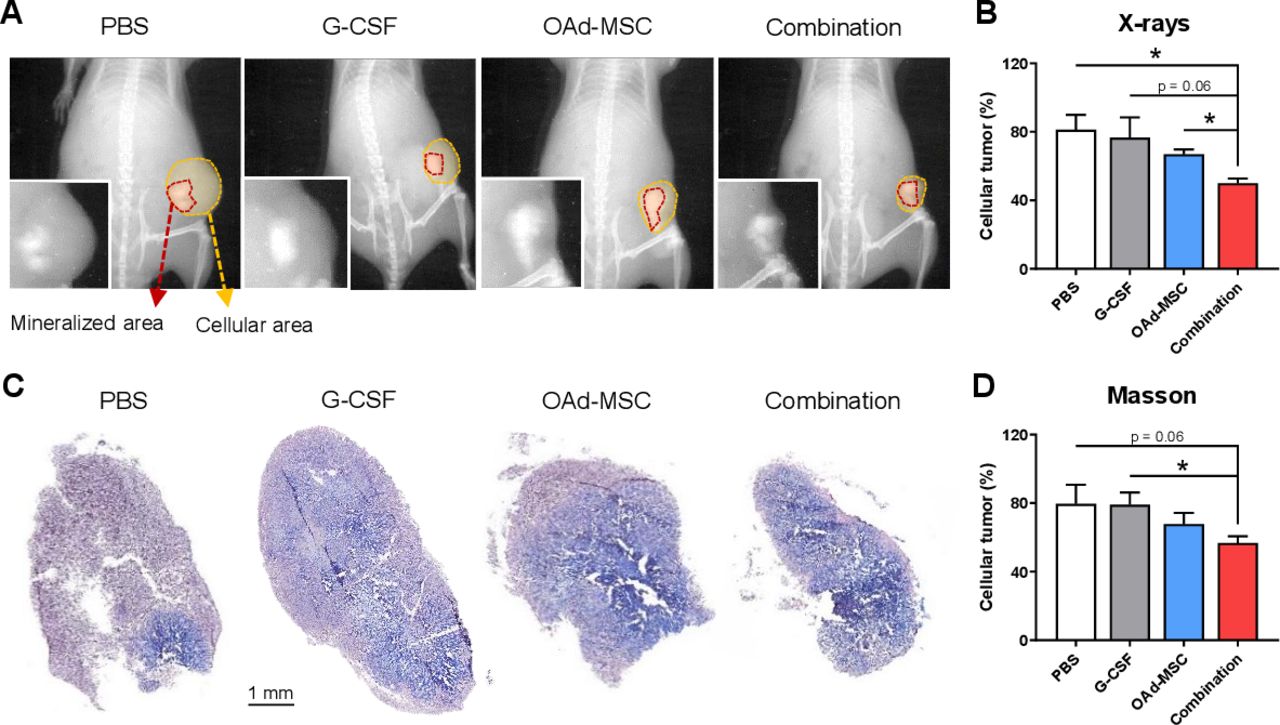
Histopathological features in osteosarcoma after treatment with OAd-MSCs or Combination. (A) Representative X-ray imaging of osteosarcoma tumors treated with PBS, G-CSF, OAd-MSCs or Combination. Mineralized area is marked in red, while cellular area is marked in yellow. (B) Percentage of cellular tumor measured in X-ray images. (C) Representative images of Masson’s-Trichrome staining. (D) Percentage of cellular tumor measured from Masson’s stained slide images. Unpaired t-test. *p<0.05. G-CSF, granulocyte-colony stimulating factor; OAd-MSCs, mesenchymal stem cells carrying the murine oncolytic adenovirus dlE102; PBS, phosphate-buffered saline.
Treatment with OAd-MSCs or Combination induces immunological changes similar to those observed in osteosarcoma patients with good prognosis
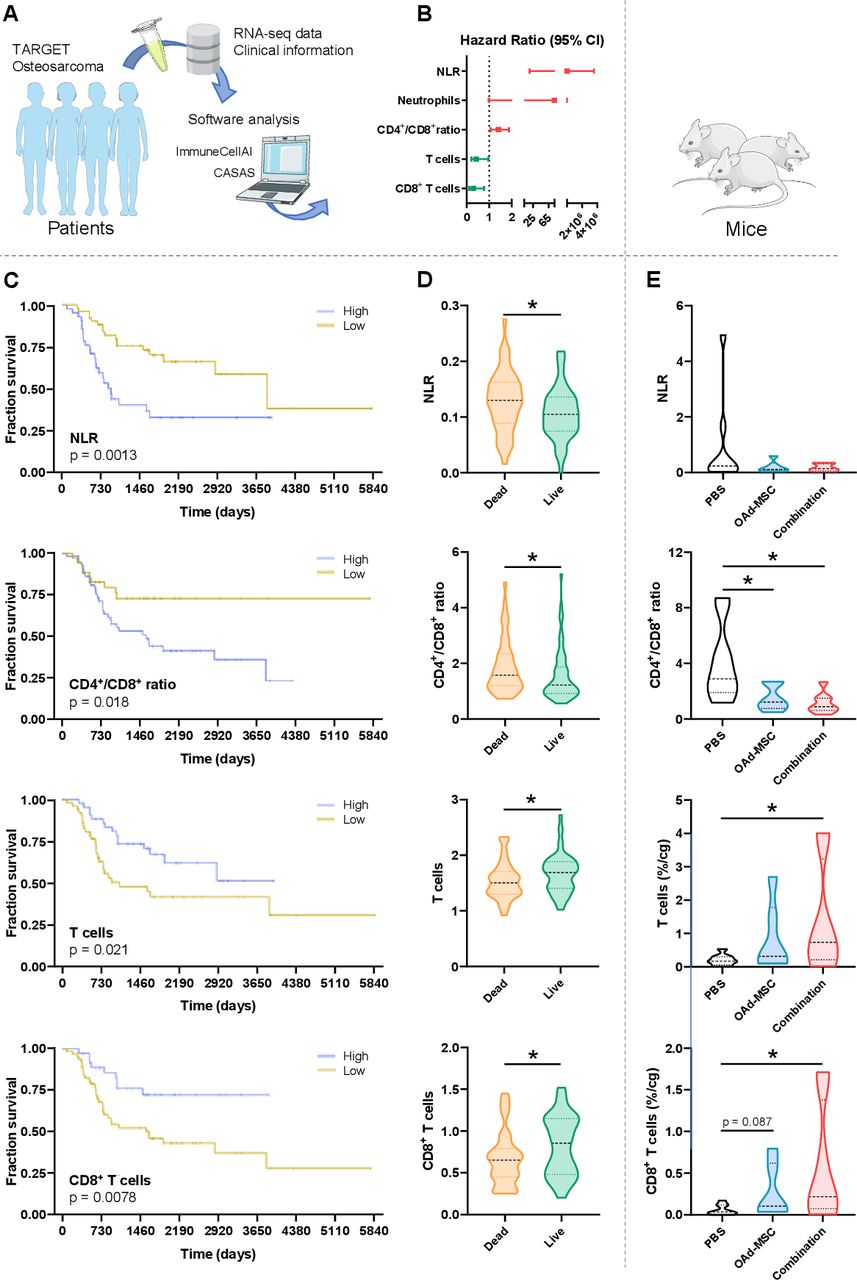
In our previous experiments we observed that treatment with OAd-MSCs and Combination induces changes in the immunological landscape of our osteosarcoma model, so we compared them to those obtained from a cohort of pediatric patients presenting osteosarcoma. TARGET Osteosarcoma project has characterized the transcriptomic profiles of 100 clinically annotated patient cases (figure 6A). Thus, we applied ImmuCellAI algorithm to estimate the abundance of several tumor infiltrating immune populations in order to characterize the immunological landscape of this study cohort (online supplemental figure 1). Following that, we performed survival analyses to identify the immunological determinants which can be responsible of a favorable outcome in human patients and see if these recapitulate the results obtained in our immunocompetent mouse model.

Comparison of preclinical results in the murine osteosarcoma model with clinical osteosarcoma patients. (A) Graph represents the experimental flow followed for the genomic analysis of osteosarcoma patients. (B) Hazard ratio of protective (<1, green) or risk factors (>1, red) regarding immune cell populations present in osteosarcoma tumors. (C) Kaplan-Meier survival curve of osteosarcoma patients regarding high (purple) or low (yellow) levels of different immune biomarkers. Log-rank (Mantel-Cox) test. (D) Violin plots represent differences in NLR, CD4+/CD8+ ratio, T cells and CD8+ T cells in patients according to their current clinical status (dead in orange; live in green). (E) Violin plots represent differences in NLR, CD4+/CD8+ ratio, T cells and CD8+ T cells in mice treated with PBS, OAd-MSCs or Combination. Mann-Whitney U test. *p<0.05. NLR, neutrophil-lymphocyte ratio; OAd-MSCs, mesenchymal stem cells carrying the murine oncolytic adenovirus dlE102; PBS, phosphate-buffered saline.
In terms of specific immune subpopulations, cytotoxic T cells, exhausted T cells, macrophages and gamma-delta T cells showed an increased abundance in patients with a favorable outcome. By contrast, neutrophils, follicular helper T cells, CD4 naïve cells and NK-T cells were more abundant in patients with a worse prognosis (online supplemental figure 1). However, as we observed in our mouse model, the balance of different immune populations also determinates a favorable antitumor immune context. In accordance with our hypothesis, univariate cox proportional hazard regression analysis identified NLR, neutrophils abundance and CD4+/CD8+ ratio as risk factors, while total T cells and CD8+ T cells subsets represented protective factors for osteosarcoma patients (figure 6B and online supplemental figure 1). The relevance of these immune markers was later confirmed by differences in survival, as patients presenting a lower NLR or CD4+/CD8+ ratio, or a higher abundance of total T cells or CD8+ T cells subsets, presented a significant longer overall survival (figure 6C). These significant differences were also observed when dividing patients according to their live/dead status, as alive patients presented significant decreased NLR and CD4+/CD8+ ratio, and increased abundance of total T cells and CD8+ T cells subsets compared with deceased patients (figure 6D).
These four immune biomarkers of better overall survival in osteosarcoma patients were accordingly decreased or increased in our mice treated with OAd-MSCs and—especially—Combination (figure 6E), which suggests a better overall prognosis induced by our cellular virotherapy.
Discussion
While oncolytic virotherapy has reached the clinical field, its use against osteosarcoma is only reported in three clinical trials to date (NCT00931931, NCT00503295, NCT01169584). Here, our results showed that tumor volumes of mice treated with OAd-MSCs were significantly reduced by 45% compared with those treated with PBS. Interestingly, this antitumor effect of OAd-MSCs is similar to the observed previously in immunocompetent mouse models of neuroblastoma (50%),26 renal adenocarcinoma (51%) and melanoma (56%),25 which reinforces our previous idea of a common mechanism of action independent from the tumor type. As a whole, while response of osteosarcoma to other immunotherapies has not been as good as expected,46 the positive similar results of our cellular virotherapy in this and other different type of tumors highlight the potential possibilities of Celyvir for the treatment of osteosarcoma.
It has been widely demonstrated that adaptive immune response plays a crucial role in the mechanism of action of the therapy.35 42 Previous studies involving oncolytic viruses for the treatment of osteosarcoma were mainly performed in vitro or in immunodeficient mice, which allows to study the lytic effect of the viruses, but do not take into account the triggered immune response.7 20–22 Here we showed that osteosarcoma tumors treated with OAd-MSCs presented increased tumor-infiltration of immune cells in the core, a finding also observed after treatment with this therapy in our lung adenocarcinoma model.24 Furthermore, treatment with OAd-MSCs induced higher density of CD8+ TILs compared with control groups, which has been positively correlated with survival and improved clinical outcome in osteosarcoma and advanced cancers.33 47 In a similar way, immune markers associated with better overall survival in osteosarcoma, such as low NLR or high LMR,43 44 did also perform significantly better in tumors treated with the cellular virotherapy. In fact, all these correlations regarding immune markers and better clinical outcomes were confirmed in our independent study using RNA-seq and clinical data from the TARGET OS project. This validated that the therapy with OAd-MSCs or Combination reproduces some immune context features of patients with good prognosis.
Following our treatment, activation of the immune response was not only observed in infiltration, but also in a lower T cell exhaustion. PD-1 receptor is expressed on the surface of T lymphocytes and represses its activation signal when binding to the PD-1 ligands. As a result, T cells with high PD-1 expression lose the ability to eliminate cancer and PD-1+ TILs are therefore associated with poor clinical outcome.47–49 We here show that osteosarcoma tumors treated with OAd-MSCs presented lower percentage of TILs and CD8+ T cells expressing PD-1 than those from control groups, thus suggesting a decreased T cell exhaustion and, consequently, improved tumor control. In this regard, blocking of this checkpoint inhibitor in mouse models of osteosarcoma has been seen to suppress tumor growth and improve survival outcomes.6 50 However, we did not find differences in TILs expressing CD137, another agonist of T cell activation whose inhibition also suppresses osteosarcoma growth in mice.51 Two recent publications have also demonstrated this mentioned reduction of PD-1+ TILs in renal adenocarcinoma and melanoma tumors after treatment with OAd-MSCs,25 as well as a reduction in PD-1hi Tim-3+ CD8+ T cells after infection with an oncolytic virus.52
These changes in the immune populations might be a consequence of the pro-inflammatory status induced by the treatment in the tumor microenvironment. In this regard, tumors treated with the Combination showed higher expression of the pro-inflammatory cytokines C5/C5a, IL-16 and TIMP-1. From these, it is notable that high expression of the gene C5 has been prognostically correlated with overall survival in bone tumors.53 Indeed, our previous study also showed increased expression of the same cytokines in the tumor microenvironment of melanoma and renal tumors after treatment with OAd-MSCs.25 However, it is relevant to note that osteosarcomas are poorly immunogenic tumors54—especially in comparison to melanoma—, which may explain the necessity of the combination with G-CSF to induce this pro-inflammatory status in the tumor microenvironment. This fact may also explain the slightly better performance of Combination treatment in the flow cytometry, IHC and histopathological studies when compared with OAd-MSCs alone. As a whole, these results emphasize the idea that the mechanism of action of the cellular virotherapies does not only rely on the lytic effect of the virus, but also on the capacity of the treatment to activate the immune response and induce a pro-inflammatory profile in the tumor microenvironment.
In this work we hypothesized that the combination of OAd-MSCs with G-CSF would improve the efficacy of the treatment Celyvir. G-CSF is a growth factor commonly administered after some treatments of cancer that induces the production of white blood cells and their mobilization into the blood stream, thus increasing the number of circulating immune cells. As our cellular virotherapy induces an activation of the immune system against tumors24—which has been also confirmed in osteosarcoma—, we hypothesized that the highest presence of immune cells in the blood stream would induce a higher recruitment of these into the tumors, leading to an increased antitumor efficacy. Previously, other authors have described that the combination of radiotherapy and G-CSF enhances the tumor-specific adaptive immune response (abscopal effect) at both local and distal sites,55 and the combination of radiotherapy and G-CSF has a favorable impact on outcome in patients with lung cancer.56 Here, the timing for our treatment administration was chosen for two well-described reasons: on the first place, the peak of mobilization of immune cells in the blood induced by G-CSF occurs 4 days after the first administration57 58; on the second place, homing of OAd-MSCs to the tumor site is detected at 24–48 hours after systemic administration.23–25 Our goal of synchronizing both events might have been a double-edged sword, as it is also possible that the systemically administered OAd-MSCs has suffered an immune response of the mobilized cells in their way to the tumor site. Although treatment with Combination and OAd-MSCs apparently presented similar reduced tumor volumes at end point, Combination therapy had a better performance in survival, pro-inflammatory profile and tumor-infiltration of leukocytes, TILs and CD8+ T cells, especially when compared with PBS group. For these reasons, we consider that our hypothesis was only partially supported, as Combination treatment did not improve the antitumor effect of OAd-MSCs in osteosarcoma, but increased different immune markers associated with better prognosis.
Histologically, tumors treated with OAd-MSCs or Combination—which presented smaller volumes—showed decreased cellularity, as most of the malignancy presented mineralized phenotype. This higher cellularity only observed in control groups has been previously described in osteosarcoma tumors presenting uncontrolled growth after a long period, with these areas corresponding to abundant expansion of a few clones.38
In conclusion, treatment with OAd-MSCs or the Combination of OAd-MSCs with G-CSF significantly reduces tumor growth in an osteosarcoma mouse model, which opens the possibility of using our cellular virotherapy for the treatment of bone cancers. Treated tumors presented higher tumor infiltration of immune cells, especially TILs, and reduced T cell exhaustion, which seems to be enhanced in tumors treated with the Combination. Although further study is needed, the combination of OAd-MSCs with G-CSF may be considered for the improvement of the therapy.
Acknowledgments
The oncolytic adenovirus dlE102 was kindly given by Dr Michael Robinson, while G-CSF was kindly given by Dr Manuel Ramírez Orellana. We also thank Dr Manuel Ramírez Orellana and Dr Manuel Leónidas Espinoza for sharing data regarding G-CSF administration. Images for the graphical scheme of in vivo experiments were obtained and modified from SMART—Servier Medical Art under a Creative Common Attribution 3.0 Unported License.
References
Supplementary materials
Supplementary Data
This web only file has been produced by the BMJ Publishing Group from an electronic file supplied by the author(s) and has not been edited for content.
Footnotes
Twitter @Fesisisimo, @GamberaStefano, @JavierGC280
Contributors JG-C and AM-M conceived the project. JG-C obtained funding for the project. AM-M performed the in vitro and in vivo experiments and collected and analyzed the data. SG and AL performed the WB and IHC. SG designed and performed bioinformatic studies and survival analysis. AM-M performed the statistical analyses. JG-C and AM-M designed and supervised the study. AM-M, JG-C and SG wrote the paper. All authors revised and approved the manuscript.
Funding This study was funded by the Instituto de Salud Carlos III of Spain (grant numbers PI14CIII/00005 and PI17CIII/00013), Consejería de Educación, Juventud y Deporte of Comunidad de Madrid (grant number P2017/BMD-3692), Fundación Oncohematología Infantil, Asociación Pablo Ugarte and AFANION, whose support we gratefully acknowledge.
Competing interests None declared.
Patient consent for publication Not required.
Ethics approval All procedures involving animals were approved by the Animal Research and Welfare Ethics Committee (Comité de Ética de la Investigación y de Bienestar Animal) of the Instituto de Salud Carlos III and Comunidad de Madrid (PROEX 347/15), where the studies were conducted.
Provenance and peer review Not commissioned; externally peer reviewed.
Data availability statement Data are available upon reasonable request. All data relevant to the study are included in the article or uploaded as supplementary information. Further data are available upon reasonable request.
Supplemental material This content has been supplied by the author(s). It has not been vetted by BMJ Publishing Group Limited (BMJ) and may not have been peer-reviewed. Any opinions or recommendations discussed are solely those of the author(s) and are not endorsed by BMJ. BMJ disclaims all liability and responsibility arising from any reliance placed on the content. Where the content includes any translated material, BMJ does not warrant the accuracy and reliability of the translations (including but not limited to local regulations, clinical guidelines, terminology, drug names and drug dosages), and is not responsible for any error and/or omissions arising from translation and adaptation or otherwise.