Article Text

Abstract
Background Glypican-3 (GPC3), a cell surface glycoprotein that is pathologically highly expressed in hepatocellular carcinoma (HCC), is an attractive target for immunotherapies, including chimeric antigen receptor (CAR) T cells. The serum GPC3 is frequently elevated in HCC patients due to the shedding effect of cell surface GPC3. The shed GPC3 (sGPC3) is reported to block the function of cell-surface GPC3 as a negative regulator. Therefore, it would be worth investigating the potential influence of antigen shedding in anti-GPC3 CAR-T therapy for HCC.
Methods In this study, we constructed two types of CAR-T cells targeting distinct epitopes of GPC3 to examine how sGPC3 influences the activation and cytotoxicity of CAR-T cells in vitro and in vivo by introducing sGPC3 positive patient serum or recombinant sGPC3 proteins into HCC cells or by using sGPC3-overexpressing HCC cell lines.
Results Both humanized YP7 CAR-T cells and 32A9 CAR-T cells showed GPC3-specific antitumor functions in vitro and in vivo. The existence of sGPC3 significantly inhibited the release of cytokines and the cytotoxicity of anti-GPC3 CAR-T cells in vitro. In animal models, mice carrying Hep3B xenograft tumors expressing sGPC3 exhibited a worse response to the treatment with CAR-T cells under both a low and high tumor burden. sGPC3 bound to CAR-T cells but failed to induce the effective activation of CAR-T cells. Therefore, sGPC3 acted as dominant negative regulators when competed with cell surface GPC3 to bind anti-GPC3 CAR-T cells, leading to an inhibitory effect on CAR-T cells in HCC.
Conclusions We provide a proof-of-concept study demonstrating that GPC3 shedding might cause worse response to CAR-T cell treatment by competing with cell surface GPC3 for CAR-T cell binding, which revealed a new mechanism of tumor immune escape in HCC, providing a novel biomarker for patient enrolment in future clinical trials and/or treatments with GPC3-targeted CAR-T cells.
- antigens
- tumor-associated
- carbohydrate
- liver neoplasms
- receptors
- chimeric antigen
- immunotherapy
- immune evation
Data availability statement
All data relevant to the study are included in the article or uploaded as online supplemental information.
This is an open access article distributed in accordance with the Creative Commons Attribution Non Commercial (CC BY-NC 4.0) license, which permits others to distribute, remix, adapt, build upon this work non-commercially, and license their derivative works on different terms, provided the original work is properly cited, appropriate credit is given, any changes made indicated, and the use is non-commercial. See http://creativecommons.org/licenses/by-nc/4.0/.
Statistics from Altmetric.com
- antigens
- tumor-associated
- carbohydrate
- liver neoplasms
- receptors
- chimeric antigen
- immunotherapy
- immune evation
Background
Liver cancer is a leading cause of cancer-related death with an increasing incidence worldwide. Primary hepatocellular carcinoma (HCC) is the most common type of liver cancer.1 HCC is generally resistant to chemotherapy, radiotherapy and specific inhibitors, including sorafenib and lenvatinib; most HCC patients cannot receive curative treatment based on current restrictive criteria and exhibit an extremely poor prognosis.2 3 Additionally, immunotherapies using immune checkpoint inhibitors have shown benefits in only a small proportion of HCC patients, possibly because of the complex immunosuppressive microenvironment.4 5 Thus, there is an urgent need to develop new effective therapeutic strategies for HCC.
Glypican-3 (GPC3) is a cell-surface glycophosphatidylinositol (GPI)-anchored protein that belongs to the heparan sulfate (HS) proteoglycan family, which plays important roles in cell growth, differentiation and migration. Many studies have shown that GPC3 is highly expressed in HCC, while its expression is absent in most nonmalignant adult tissues. GPC3 is currently used as an informative immunohistochemical biomarker for HCC, and it is believed to be an attractive target for HCC therapy.6 7 Various GPC3-targeted strategies have been developed or evaluated in HCC.8 9 Our previous work showed that GPC3-specific immunotoxin and antibody drug conjugates presented potent anticancer activity in vitro and in vivo.10 11 Recently, chimeric antigen receptor (CAR) T cells, which have shown promising curative effects in hematological tumors, have been applied for the development of novel GPC3-targeted therapies in HCC and have shown preliminary effects in some studies12–15 and clinical trials.8 9 16 However, the response rate in the clinical setting is still far from satisfactory, and it is not clear how HCC cells may escape from CAR-T cells.
GPC3 is composed of a 70 kDa core protein and two HS side chains with highly negative charges, which can help GPC3 recruit and concentrate many essential ligands from the tumor microenvironment and facilitate their recognition of corresponding receptors.17–19 Our previous studies have demonstrated that GPC3 functions as a coreceptor to modulate Wnt/β-catenin signaling to promote cell proliferation in HCC.19–21 Similar to other glypicans, GPC3 can be released from the cell surface and can be found around tumors or in the circulation.22 Several studies have shown that serum GPC3 levels are significantly elevated in HCC patients compared with healthy individuals23–25 and that local tumor GPC3 concentrations in HCC may also be much higher than those in normal tissues. Previous studies also showed that recombinant soluble GPC3 could inhibit HCC cell growth in vitro and in vivo,26 27 suggesting that shed GPC3 (sGPC3) may compete with cell-surface GPC3 to bind GPC3-interacting molecules or may even block GPC3-targeted therapies.
Many tumor antigens are actively shed from cell surface, and such shedding can be expected to significantly influence the efficiency of anticancer treatment targeting these antigens.28 29 However, it is not very clear how antigen shedding is involved in CAR-T therapy, especially in solid tumors, which compared with hematological malignancies exhibit a relatively isolated and enclosed microenvironment. Therefore, it is worth analyzing the role of sGPC3 in CAR-T cell therapy regimens for HCC, with the expectation of identifying novel diagnostic and/or prognostic indications.
In the current study, based on GPC3-specific antibodies developed in our previous work, we established GPC3-targeted CAR-T cells and studied how sGPC3 influenced CAR-T cell activation and cytotoxicity in HCC models in vitro and in vivo. In short, our results showed that sGPC3 can impair the antitumor activities of CAR-T cells in HCC by competing with cell-surface GPC3, resulting in the escape of tumors from immunotherapy.
Methods
Clinical samples and cells
The HCC tumor tissue, normal liver tissue specimens and serum used in the current study were obtained from patients recruited from Nanjing Drum Tower Hospital (Nanjing, Jiangsu, China) between January 2018 and April 2019, and Nanjing Jinling Hospital (Nanjing, Jiangsu, China) between October 2020 and December 2020. This study was approved by the Ethical Committee of the participating hospitals, and every patient provided written informed consent. HepG2, Hep3B, A431 and HEK293T cells were purchased from the American Type Culture Collection (Manassas, Virginia, USA). Huh7 cells were obtained from Xin-Wei Wang at the National Cancer Institute, NIH. The HEK293 TOPFlash stable cell line was a gift from Dr. Jeremy Nathans, Johns Hopkins Medical School. The A431-GPC3 stable cell line was generated in our previous work.21 The Hep3B-sGPC3 and Huh7-sGPC3 stable cell lines were generated by transducing cells with a truncated GPC3 (Q25-S550) sequence in a lentivirus. Peripheral blood mononuclear cells (PBMCs) were isolated by the Ficoll density centrifugation of healthy donors’ blood, obtained under the ethics protocol approved by Nanjing Jinling Hospital (Nanjing, Jiangsu). The isolated PBMCs were cultured in RPMI 1640 Medium (Roswell Park Memorial Institute 1640 Medium, HyClone, Logan, Utah, USA) supplemented with 10% fetal bovine serum (Gibco, Murphysboro, IL), 100 U/mL penicillin, and 0.1 mg/mL streptomycin, with incubation under 5% CO2 at 37°C. All other cell lines were cultured in Dulbecco’s modified Eagle’s medium (HyClone) supplemented with 10% fetal bovine serum (VACCA, Murphysboro, Illinois, USA), 100 U/mL penicillin and 0.1 mg/mL streptomycin (HyClone). All cell lines were confirmed free of mycoplasma contamination by PCR.
Antibodies and recombinant proteins
YP7 and 32A9 are GPC3-specific monoclonal antibodies generated in our previous studies.30–32 YP7 is a mouse antibody and was humanized (named hYP7) for the generation of CAR-T cells. The recombinant sGPC3 (Q25-S550) protein with a hexa-histidine tag at the C-terminal end, or with a wild-type human Fc (hFc) tag or mutant hFc tag containing three mutations (N297A/L234A/L235A) reported to abolish unexpected binding to the Fcγ receptor33 34 were cloned into the pFUSE vector (InvivoGen, San Diego, California, USA). All the above plasmids were expressed in HEK293T cells. After collecting the supernatant, protein purification was accomplished following our previous protocol.35 Recombinant sCD19(P20-K291) with either Fc tag or mutant Fc tag were also purified as the negative control antigen.
Serum GPC3 detection
A 32A9 IgG (4 µg/mL) was used to coat ELISA wells at 4°C overnight. After blocking, diluted serum or standard recombinant GPC3 protein were added and incubated at 4°C overnight. After washing, biotin labeled YP7-IgG (1 µg/mL) was added and then detected by Streptavidin-HRP antibody (Life Tech, Peoria, Illinois, USA). TMB and H2SO4 were added to detect the OD450nm value.
Generation and expansion of CAR-T cells
hYP7, 32A9 and FMC63-based second-generation 4-1BB CARs were designed and packaged into a lentivirus as we described previously.32 Then, T cells were isolated from PBMCs using a CD8+CD4+ negative isolation kit (STEMCELL Technologies, Vancouver, Canada) and stimulated with anti-CD3/anti-CD28 beads (Thermo Fisher Scientific, Waltham, Massachusetts, USA) at a bead-to-cell ratio of 2:1 with recombinant human IL-2 (300 U/mL) for 24 hours. T cells were then transduced with the lentiviruses expressing CARs at a multiplicity of infection of 10:1. The transduced T cells were fed with fresh medium containing IL-2 and counted every other day. Once the cells were greatly expanded approximately 10 days, they were collected for assays or frozen for later use.
In vitro CAR-T cell activation and cytotoxicity assays
CAR-T cells were treated with recombinant sGPC3 or the cell culture supernatant or were cocultured with target tumor cells (in 96-well U-bottom plates) at different ratios for the indicated time periods. The supernatants were collected for cytokine release assays with sandwich ELISA kits (MultiSciences Biotech, Hangzhou, China) or were used to measure specific cytotoxicity in a lactate dehydrogenase cytotoxicity assay (Promega, Madison, Wisconsin, USA).
In vivo animal studies
Immunodeficient NCG (Nobese Diabetic (NOD)/ShiLtJGpt-Prkdcem26Cd52Il2rgem26Cd22/Gpt) mice which were established by knocking out Prkdc and Il2rg, and BALB/c nu/nu nude mice were purchased from the Model Animal Research Center of Nanjing University. A total of 5×10⁶ luciferase-expressing Hep3B, Hep3B-Mock or Hep3B-sGPC3 cells were suspended in 200 µL of PBS and subcutaneously (s.c.) inoculated into the right flank of 4- to 6-week-old NCG female mice that were shaved with an electric clipper. Tumor size and weight were measured regularly with a digital caliper. Tumor volume was calculated as length×width2×0.5. When the average tumor size reached the indicated size, the mice were intravenously injected with 5–10 million of the indicated T cells in a volume of 200 µL. Tumor lesions were also visualized weekly using the Xenogen IVIS Lumina system (PerkinElmer). Mice were euthanized when they showed any sign of sickness or when the tumor size reached 2000 mm3.
Statistical analysis
All statistical analyses were performed using GraphPad Prism V.8 software (GraphPad Software). Representative results were obtained in at least three independent experiments. The statistical analysis of differences between samples was performed using the t-test of means. The expression of GPC3 in human tissues and serum were compared using the Kruskal-Wallis test and Mann-Whitney U test, respectively. Two-way analysis of variance and the log-rank test were used for tumor growth curve and mouse survival curve analysis. A P<0.05 was considered statistically significant.
Results
Construction of CAR-T cells targeting GPC3 in HCC
As GPC3 has been reported to be an HCC-specific regulator that promotes tumor growth, we first examined its expression in both HCC tumor tissues and HCC cell lines. Immunohistochemistry staining showed that GPC3 was expressed on the membrane and in the cytoplasm of HCC tumor tissues but not in peritumor liver tissues or non-tumor liver tissues (figure 1A). Huh7, Hep3B and HepG2, the three widely used liver cancer cell lines, all showed strong expression of GPC3 in whole-cell lysates and on the cell membrane (online supplemental figure S1). We next knocked out GPC3 expression in Hep3B cells via a CRISPR-Cas9 strategy21 and then s.c. inoculated them into nude mice. In contrast to the rapid tumor growth observed in the wild-type Hep3B group, nude mice inoculated with GPC3-knockout Hep3B cells exhibited delayed initiation and slower growth of xenograft tumors (figure 1B), verifying the proliferative effect of GPC3 on HCC tumor progression.
Supplemental material

Construction of two CAR-T cells targeting GPC3. (A) IHC staining of GPC3 in human HCC tumor tissues (n=26), peritumor tissues (n=25) and non-tumor liver tissues (n=9). The staining intensity index was recorded as the total staining intensity per unit of tissue area. Scale bars: 4×, 500 µm; 20×, 100 µm. **P<0.01 (Kruskal-Wallis test). (B) In vivo tumor growth comparison of Hep3B cells and Hep3B-GPC3 KO cells. Five million Hep3B cells and Hep3B-GPC3 KO cells were subcutaneously inoculated into BALB/c nu/nu mice. Each group: n=7. Western blot showed the KO efficiency of GPC3. Values represent the mean±SE ****P<0.0001 (two-way ANOVA). (C) Schematic Cartoon of GPC3 and anti-GPC3 monoclonal antibodies (blue, hYP7; red, 32A9). (D) Flow cytometry to detect the binding activity of hYP7 and 32A9 on A431-GPC3 cells. Gray peak: isotype control. (E) Schematic diagrams of anti-GPC3 cars designed in the second-generation 4-1BB format. Anti-CD19 CAR based on the FMC63 antibody was used as a control CAR. (F) The representative transduction efficiency of anti-GPC3 CARs and anti-CD19 CAR in T cells with the lentivirus system. GFP-positive cells were gated as CAR-T cells. ANOVA, analysis of variance; CAR, chimeric antigen receptor; GFP, green fluorescent protein; GPC3, glypican-3; HCC, hepatocellular carcinoma; hYP7, humanized YP7; IHC, immunohistochemistry; KO, knockout; WT, wild type.
The mature GPC3 contains a conformational protein core and a C-terminal flexible linker. The conformational protein core of GPC3 is made of several α-heliex and strengthened by seven disulfide bounds. The flexible C-terminal linker connected the protein core of GPC3 to cell membrane through GPI linkage. Our previous work generated two monoclonal antibodies 32A9 and YP7, which targeted the protein core and C-terminal flexible region, respectively.30 32 Therefore, the GPC3 molecule recognized by both 32A9 and YP7 might represent a structure close to its native conformation (figure 1C). Both YP7 and 32A9 recognized cell membrane GPC3 (mGPC3) effectively (figure 1D), indicating their potential for application in CAR-T cell construction. We then synthesized 4-1BB CAR in a second-generation format based on hYP7 and 32A9 scFv sequences (figure 1E) and produced virus particles in a lentivirus packaging system. Human T cells were efficiently transduced with the lentivirus encoding hYP7-CAR, 32A9-CAR and control CAR against CD19 (figure 1F and online supplemental figure S2).
CAR-T cells targeting GPC3 inhibited HCC tumor growth in vitro and in vivo
To evaluate the antitumor activity of CAR-T cells against GPC3 in vitro, hYP7 CAR-T cells and 32A9 CAR-T cells were incubated with GPC3-overexpressing A431 cells at different ratios for cytotoxicity determination. A431-GPC3 cells were efficiently lysed by the CAR-T cells targeting GPC3 in a dose-dependent manner, while wild-type A431 cells were not killed (figure 2A). Similarly, HCC cells expressing endogenous GPC3 responded well to the treatment of hYP7 CAR-T cells and 32A9 CAR-T cells but not to the parallel treatment of anti-CD19 CAR-T cells (figure 2B). When cocultured with HCC cells, CAR-T cells targeting GPC3 showed increases in the release of IL-2, interferon-γ and tumor necrosis factor-α compared with mock-transduced T cells (figure 2C,D), indicating efficient activation of hYP7 CAR-T cells and 32A9 CAR-T cells in vitro. Moreover, we treated immunodeficient mice carrying Hep3B xenograft tumors with GPC3-specific CAR-T cells or CD19-specific CAR-T cells. Most of the tumors in mice receiving GPC3-specific CAR-T cells showed complete remission (CR), whereas those receiving CD19-specific CAR-T cells exhibited rapid tumor growth that was as fast as that of PBS-treated tumors (figure 2E,F). Taken together, the results indicated that hYP7 CAR-T cells and 32A9 CAR-T cells were feasible and effective HCC immunotherapies against GPC3 in vitro and in vivo.
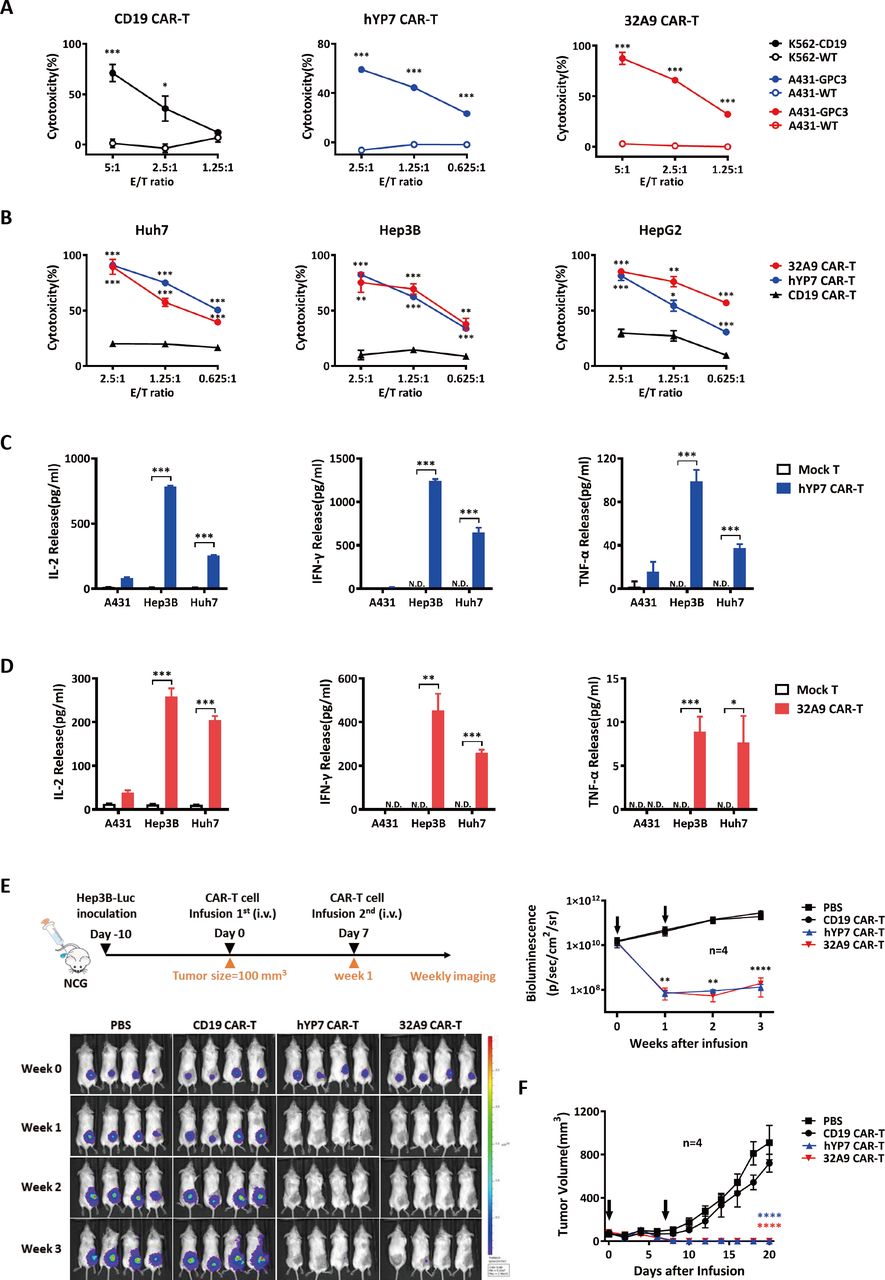
Antitumor activity of GPC3-specific CAR-T cells in vitro and in vivo. (A, B) LDH assays to show the cytotoxicity of hYP7 CAR-T cells and 32A9 CAR-T cells on A431 cells and A431-GPC3 cells (A) or native liver cancer cells (B). CAR-T cells and target cells were cocultured at the indicated E/T ratios for 16 hours. (C, D) ELISA to measure the released cytokines of hYP7 CAR-T cells (C) and 32A9 CAR-T cells (D) when targeting HCC cells for 24 hours at an E/T ratio of 1:1. (A–D) experiments were repeated with T cells derived from four donors. Data from one of four repeated experiments are presented as the mean±SD. (E) In vivo antitumor activity of anti-GPC3 CAR-T cells. NCG mice with Hep3B-luciferase xenograft tumors were intravenous injected with two doses of 10 million hYP7 CAR-T cells, 32A9 CAR-T cells or CD19 CAR-T cells when the average tumor size reached approximately 100 mm3. Tumor size was measured via bioluminescence imaging weekly (E) or with a digital caliper every other day (F). The arrow indicates the time point of CAR-T cell infusion. Each group: n=7. Values represent the mean±SE *P<0.05; **P<0.01; ***P<0.001; ****P<0.0001. (A–E) Two-tailed Student’s t-test; (F) Two-way ANOVA. ANOVA, analysis of variance; CAR, chimeric antigen receptor; E/T, effector: target; GFP, green fluorescent protein; GPC3, glypican-3; HCC, hepatocellular carcinoma; hYP7, humanized YP7; IHC, immunohistochemistry; LDH, lactate dehydrogenase; Luc, luciferase; N.D., undetectable; WT, wild type.
sGPC3 inhibited HCC cell proliferation and blocked the activation of Wnt signaling induced by GPC3
To investigate the role of sGPC3, we first detected the serum concentration of sGPC3 in HCC patients. Compared with the overall low expression of sGPC3 in non-tumor patients, 6 of 30 HCC patients exhibited significantly elevated expression of sGPC3 (15–65 ng/mL) (figure 3A). We then constructed sGPC3-overexpressing Hep3B cells and Huh7 cells by transfecting a truncated GPC3 lacking the GPI attachment domain. Both cell lines secreted a large quantity of glycosylated sGPC3 into the culture medium. Although we did not directly observe the expression of sGPC3 in the HCC supernatant, Hep3B cells did secrete sGPC3, which could be detected after being concentrated in an immunoprecipitation assay (figure 3B). The introduction of sGPC3 did not affect the expression of cell mGPC3 since sGPC3-overexpressing and mock-transfected cells showed equivalent amounts of surface GPC3 staining (figure 3C). Next, we compared the cell proliferation rate of mock-transfected cells and sGPC3-overexpressing HCC cells. The results showed that sGPC3-overexpressing cells grew at a significantly lower rate than mock-transfected cells, suggesting the inhibitory effect of sGPC3 on HCC cell proliferation (figure 3D). Wnt signaling is one of the key cancer signaling pathways regulating HCC tumor progression, and our previous investigation demonstrated a precise mechanism of GPC3 acting as a Wnt coreceptor.21 We found that the mGPC3-induced activation of the Wnt-TOPFlash reporter was suppressed by the co-expression of sGPC3 (figure 3E), indicating the negative regulation on mGPC3-induced cancer signaling by sGPC3. In addition to sGPC3-overexpressing cells, we also purified the recombinant sGPC3 protein fused with a hexahistidine tag. The recombinant sGPC3 could be recognized by both 32A9 and YP7, indicating its conformation is similar to native GPC3 (figure 3F). Similarly, recombinant sGPC3 also blocked the growth of Hep3B cells and inhibited mGPC3-induced activation of the Wnt-TOPFlash reporter (figure 3G,H). Taken together, these results indicated that the truncated sGPC3 used here exhibited similar structure identity and biological function as the native sGPC3, and could conceptually mimic the sGPC3 in our study.
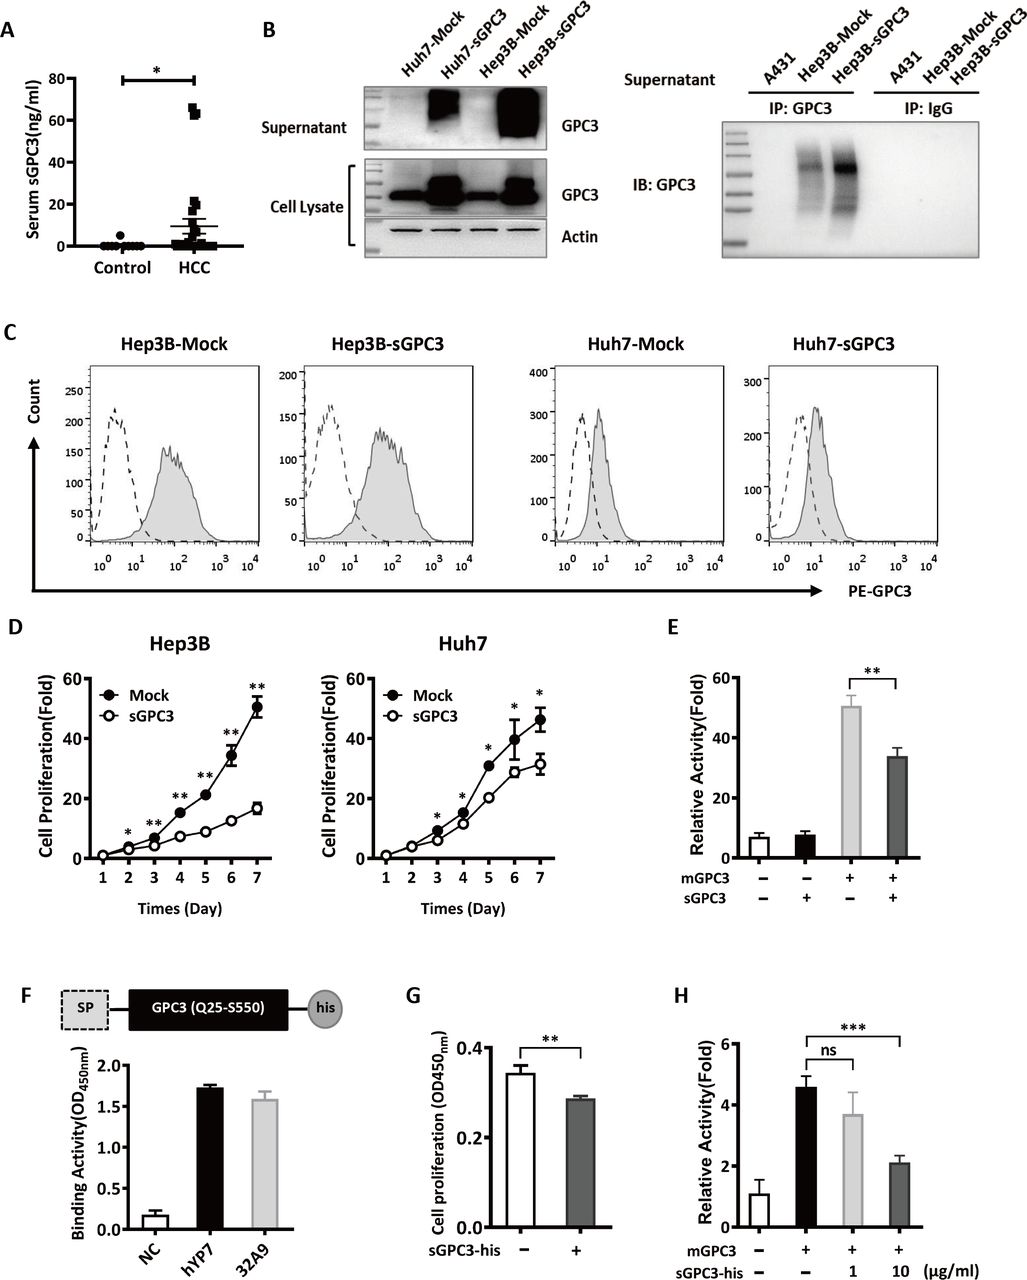
The inhibitory effect of sGPC3 on HCC cell proliferation and the activation of Wnt signaling in vitro. (A) ELISA to detect the serum concentration of sGPC3 in non-tumor patients (n=10) and HCC patients (n=30), values represent the mean±SD *P<0.05 (Mann-Whiteny U test). (B) Western blot to detect the expression of sGPC3 and total GPC3 in sGPC3-overexpressing HCC cells (left), and immunoprecipitation to compare the expression of sGPC3 in the culture supernatants of Hep3B and Hep3B-sGPC3 cells (right). (C) Flow cytometric analysis of surface GPC3 expression in sGPC3-expressing HCC cells. Dashed line: isotype control, full line: GPC3 staining. (D) WST-8 assays to detect the proliferation of sGPC3-overexpressing HCC cells in vitro. (E) TOPFlash reporter assay to detect the mGPC3-induced activation of Wnt signaling. mGPC3 transfected HEK293 TOPFlash cells were cotransfected with sGPC3, then followed by Wnt3a conditioned medium stimulation. (F) Schematic construct of the recombinant sGPC3-his protein and its binding activity to anti-GPC3 monoclonal antibodies. (G) WST-8 assays to detect the cell proliferation of Hep3B cells treated with 50 µg/mL sGPC3-his protein for 4 days. (H) TOPFlash reporter assay to detect the mGPC3-induced activation of Wnt signaling. mGPC3 transfected HEK293 TOPFlash cells were treated with the sGPC3-his protein, then followed by Wnt3a conditioned medium stimulation. Data from one of three repeated experiments are presented as the mean±SD *P<0.05; **P<0.01; ***P<0.001 (D, E, G, H) two-tailed Student’s t-test). GPC3, Glypican-3; HCC, hepatocellular carcinoma; IB, immunoblot; IP, immunoprecipitation; mGPC3, membrane GPC3; ns, not significant; sGPC3, shed GPC3.
sGPC3 blocked the activation and cytotoxicity of GPC3-specific CAR-T cells in vitro
Given that sGPC3 is able to compete with mGPC3 for the binding of its ligand during tumor growth, it is also possible that anti-GPC3 CAR-T cells can be distracted by sGPC3 around tumor cells during the recognition of GPC3-positive cells, and the activation and cytotoxicity of anti-GPC3 CAR-T cells are therefore hampered to some extent. As we predicted, hYP7 CAR-T cells and 32A9 CAR-T cells showed dramatically impaired cytotoxicity (figure 4A), deficient cytokine release (figure 4C and online supplemental figure S3A) when targeting sGPC3-overexpressing HCC cells compared with HCC-Mock cells. Similar impaired effects were also observed when recombinant GPC3 was added to the wells containing GPC3-specific CAR-T cell and HCC cocultures (figure 4B,D and online supplemental figure S3B,C).
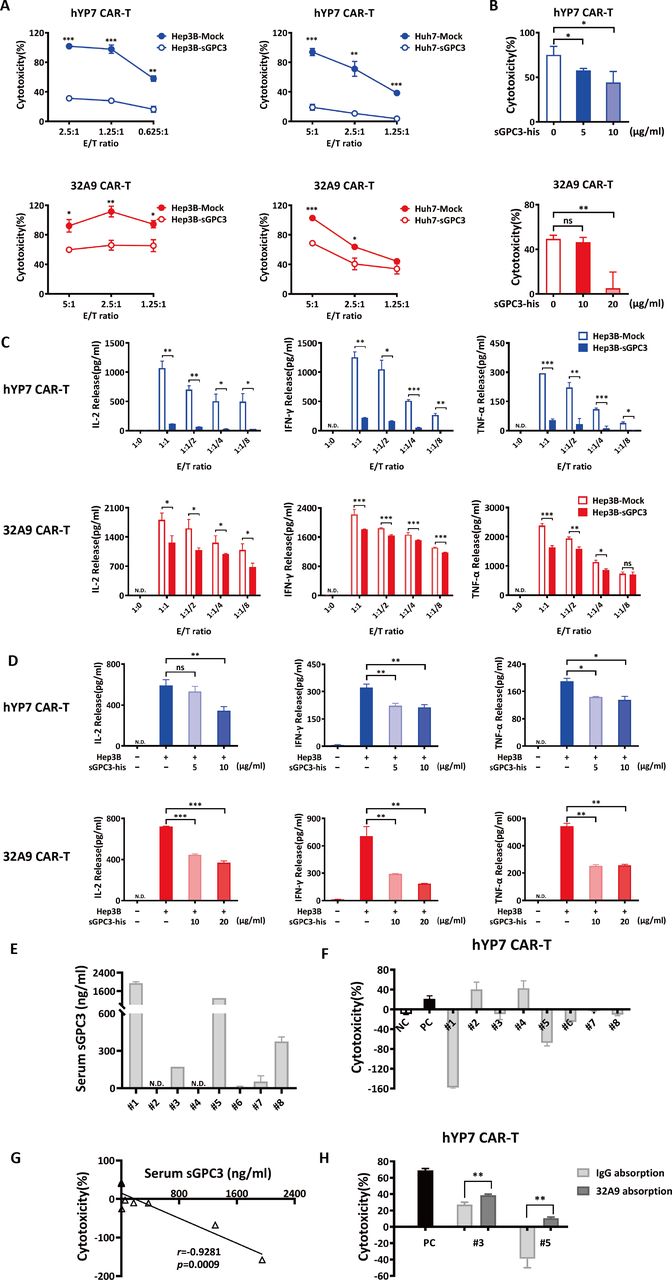
sGPC3 inhibited the activation and cytotoxicity of GPC3-specific CAR-T cells in vitro. (A, B) LDH assays to detect the cytotoxicity of GPC3-specific CAR-T cells targeting Hep3B-Mock cells and Hep3B-sGPC3 cells at the indicated E/T ratio for 16 hours (A) or targeting Hep3B cells in the presence of recombinant sGPC3-his protein at an E/T ratio of 2:1 for 16 hours (B). (C, D) The detection of the cytokine release of hYP7 CAR-T cells and 32A9 CAR-T cells targeting Hep3B-sGPC3 cells for 16 hours at the indicated E/T ratio (C) or targeting Hep3B cells in the presence of recombinant sGPC3-his protein at an E/T ratio of 2:1 for 16 hours (D). (E) ELISA to detect the serum concentration of sGPC3 in HCC patients. (F) LDH assays to detect the cytotoxicity of hYP7 CAR-T cells targeting Hep3B cells at E/T ratio of 1:1 for 12 hours in the presence of 5% serum from HCC patients. (G) Negative correlation between serum sGPC3 level and cytotoxicity of hYP7 CAR-T cells (Pearson correlation). (H) Cytotoxicity of hYP7 CAR-T cells treated with HCC serum samples which were pre-cleaned by 1 µg/mL anti-GPC3 antibody (32A9) or human IgG. (A–D) Experiments were repeated with T cells derived from three donors. Data from one of three repeated experiments are presented as the mean±SD *P<0.05; **P<0.01; ***P<0.001 (two-tailed Student’s t-test). CAR, chimeric antigen receptor; E/T, effector: target; GFP, green fluorescent protein; GPC3, Glypican-3; HCC, hepatocellular carcinoma; hYP7, humanized YP7; LDH, lactate dehydrogenase; N.D., undetectable; ns, not significant; sGPC3, shed GPC3.
HCC patient-derived sGPC3 inhibited the cytotoxicity of CAR-T cells
To confirm the blocking effect of patient-derived sGPC3 on CAR-T cells, we freshly collected eight HCC patients’ serum to perform ex vivo examination. Totally four samples had detectable sGPC3 (50% of total samples) in which two samples exhibited high level (25% of total samples) (figure 4E). We then treated hYP7 CAR-T and Hep3B cocultured cells with the patients’ serum. We found that the serum with high expression level of sGPC3 exhibited reduced cytotoxicity (figure 4F), and such inhibition was closely correlated with the concentration of serum sGPC3 (figure 4G). To confirm whether the inhibitory effect was induced by serum sGPC3, we selected two sGPC3-positive serum and performed antibody absorption. After we added 32A9-agrose protein A beads into the serum to remove the sGPC3, the cytotoxicity of hYP7 CAR-T cells was reversed (figure 4H). These results indicated that sGPC3 directly mediated the inhibitory effect of the serum on the cytotoxicity of CAR-T cells.
Hep3B-sGPC3 cells exhibited a worse response to the treatment of GPC3-specific CAR-T cells in vivo
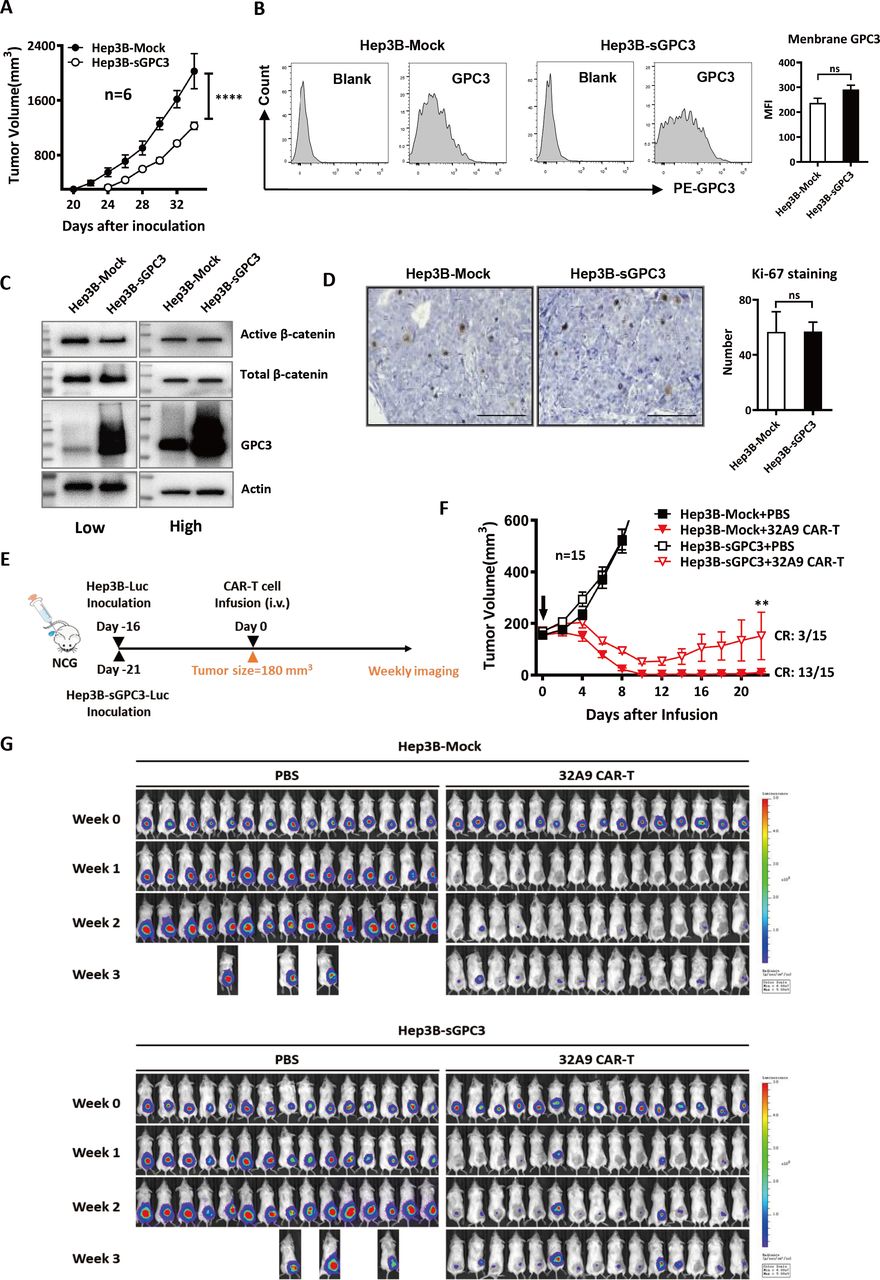
To evaluate the inhibitory effect of sGPC3 on CAR-T cell therapy in vivo, we s.c. inoculated Hep3B-Mock cells or Hep3B-sGPC3 cells into NCG mice. Consistent with our in vitro results, the tumors in the Hep3B-sGPC3 group showed delayed tumor initiation compared with those in the Hep3B-Mock group. Hep3B-sGPC3 cells took longer time to grow to same tumor size in vivo (figure 5A). As we would start CAR-T cell treatment when mice of two groups were under the same tumor burden, we first evaluated whether Hep3B-sGPC3 tumors exhibited different biological features compared with Hep3B-Mock tumors under this condition. We did not observe significant difference of surface GPC3, β-catenin activation and Ki-67 staining when Hep3B-Mock tumors and Hep3B-sGPC3 tumors were in similar size (figure 5B-D). These results might help us to exclude the potential fundamental changes of the tumor caused by overexpressing sGPC3.

sGPC3 caused an earlier tumor relapse after 32A9 CAR-T cell treatment in vivo. (A) Tumor growth of NCG mice inoculated with 5 million Hep3B-Mock or Hep3B-sGPC3 cells subcutaneously. Each group: n=6. Values represent the mean±SE ****P<0.0001 (two-way ANOVA). (B) Flow cytometry analysis of surface GPC3 on tumor cells isolated from Hep3B-Mock or Hep3B-sGPC3 xenograft in NCG mice. Each group: n=3. (C) Detection of total and active β-catenin in Hep3B-Mock cells or Hep3B-sGPC3 tumor xenograft by Western blotting. Low: low tumor burden (~250 mm3), high: high tumor burden (~800 mm3). (D) IHC staining of Ki-67 expression of Hep3B-Mock or Hep3B-sGPC3 xenograft. Scale bar:100 µm and n=3 in each group. (E) Schematic diagram of CAR-T cell treatment. NCG mice were subcutaneously inoculated with luciferase-expressing Hep3B-Mock and Hep3B-sGPC3 cells. When the average tumor size of each group reached ~180 mm3, 10 million 32A9 CAR-T cells were infused into mice by intravenous injection. (F) Tumor volume was measured with an electronic caliper every other day. The arrow indicates the time point of CAR-T cell infusion. Values represent the mean±SE **P<0.01 (two-way ANOVA). (G) Weekly bioluminescence imaging of mice after CAR-T cell infusion. Each group: n=15. ANOVA, analysis of variance; CAR, chimeric antigen receptor; CR, complete remission; IHC, immunohistochemistry; Luc, luciferase; ns, not significant; sGPC3, shed Glypican-3.
When the average tumor volume of each group reached approximately 180 mm3 (day 16 for the mock group vs day 21 for the sGPC3 group), the mice were infused with 32A9 CAR-T cells intravenously one time and observed for 3 weeks (figure 5E). Our results showed that both the Hep3B-Mock tumors and Hep3B-sGPC3 tumors in mice treated with CAR-T cells started to shrink (below the initial size) within a week. At the end of week three, when the tumors in the PBS groups reached the endpoint, the sizes of most of the tumors in the Hep3B-Mock group treated with CAR-T cells were still below the limit of detection, whereas those in the Hep3B-sGPC3 group rapidly grew back after week 2. The CR ratio of the mice was 13/15 in the Hep3B-Mock group but only 3/15 in the Hep3B-sGPC3 group at the end of week three after CAR-T cell treatment (figure 5F,G). Therefore, 32A9 CAR-T cells showed less efficacy in mice with Hep3B-sGPC3 tumors than in those with Hep3B-Mock tumors.
Next, we assessed the role of sGPC3 in CAR-T cytotoxicity against larger tumors in vivo. The mice were intravenously injected with two doses (the first contained 5×10⁶ T cells; the second, 1×10⁷ T cells) of GPC3-specific CAR-T cells weekly when the tumor volume reached approximately 400 mm3 (figure 6A and online supplemental figure S4). Under 32A9 CAR-T cell treatment, approximately half of the tumors in the Hep3B-Mock group started to shrink after the second infusion, and the survival of the mice was significantly extended; however, the tumors in the Hep3B-sGPC3 group did not exhibit obvious shrinkage, and the survival of the mice was not considerably improved (ffigure 6B,C). The hYP7 CAR-T cells exerted stronger cytotoxicity in mice than the 32A9 CAR-T cells. In response to hYP7-CAR-T cell treatment, which extended the survival of mice significantly, the tumors in the Hep3B-Mock group exhibited shrinkage relatively early and grew back gradually, whereas the tumors in the Hep3B-sGPC3 group were inhibited after the second injection and recovered rapidly (figure 6B and D).
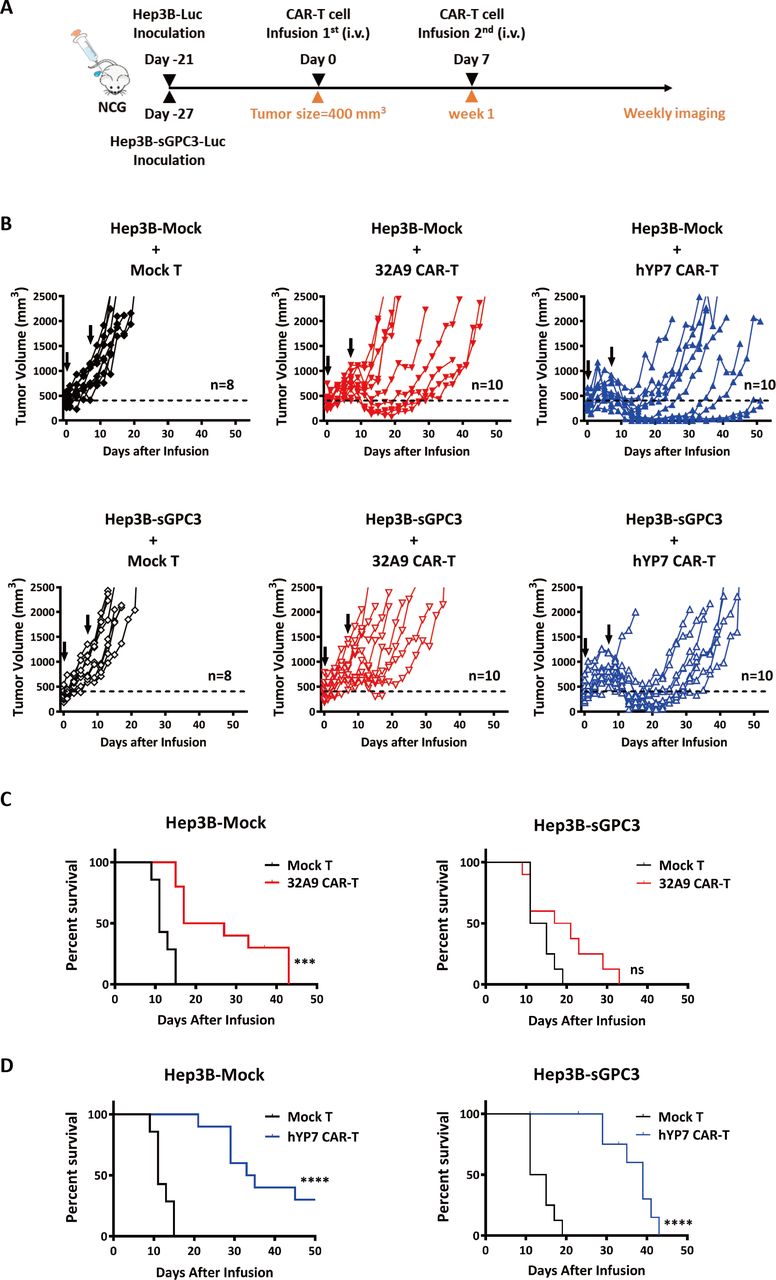
sGPC3 induced a worse response to GPC3-specific CAR-T cell treatments when mice were under a greater tumor burden. NCG mice were inoculated with luciferase-expressing Hep3B-Mock and Hep3B-sGPC3 cells subcutaneously. When the average tumor size of each group reached ~400 mm3, hYP7 CAR-T cells and 32A9 CAR-T cells were infused into mice by intravenous injection. (A) Schematic diagram of CAR-T cell treatments. (B) Individual tumor growth curve of each group. The arrow indicates the time point of CAR-T cell infusion. (C, D) Kaplan-Meier survival curve of the 32A9 CAR-T cell-treated groups (C) or hYP7 CAR-T cell-treated groups (D). Mock T cell-treated group: n=8, 32A9 CAR-T cell-treated groups: n=10 and hYP7 CAR-T cell-treated groups: n=10. ***P<0.001; ****P<0.001 (log-rank test). CAR, chimeric antigen receptor; hYP7, humanized YP7; ns, not significant; sGPC3, shed Glypican-3.
In general, these results indicated that mice with sGPC3-overexpressing Hep3B tumors exhibited a worse response to treatment with GPC3-specific CAR-T cells.
sGPC3 competes with mGPC3 for the binding of CAR-T cells
To investigate the possible mechanism of the blocking effect on CAR-T cells mediated by sGPC3, we first incubated recombinant sGPC3 with GPC3-specific CAR-T cells. Both 32A9 CAR-T cells and hYP7 CAR-T cells could specifically bind to recombinant sGPC3 (figure 7A). To determine whether sGPC3 could induce the activation of CAR-T cells, we treated GPC3-specific CAR-T cells with the culture supernatant from Hep3B-sGPC3 cells or recombinant GPC3. The cultured Hep3B-sGPC3 supernatant did not trigger GPC3-specific CAR-T cells to express IL-2 (figure 7B). In addition, we found that free recombinant GPC3, in either monomeric (sGPC3-his) or dimeric format (sGPC3-Fc mut), could not induce effective secretion of IL-2 (figure 7C and online supplemental figure S5). Therefore, sGPC3 bound to GPC3-specific CAR-T cells normally but failed to induce the efficient activation of CAR-T cells. Interestingly, we found that sGPC3 exhibited strong activating effect on CAR-T cells when coated on the plate (online supplemental figure S5). These phenomena were consistent with the previous study demonstrating that soluble antigen would not trigger the activation of CAR-T cells unless they are in dimerization or crosslinking format.36

sGPC3 blocked GPC3-specific CAR-T cells from binding membrane GPC3 positive tumor cells. (A) Flow cytometry to detect the binding activity of the sGPC3- his protein on GPC3-specific CAR-T cells. CAR-T cells were incubated with 5 μg/ml sGPC3-his for detection. ELISA was performed to measure the secretion of IL-2 in the culture supernatants of CAR-T cells treated with the culture supernatant of Hep3B-sGPC3 cells (B) or sGPC3-his protein (C) for 16 hours. CAR-T cells cocultured with Hep3B cells were used as positive control. (D, E) Flow cytometry to detect the binding of hYP7 CAR-T cells and mCherry positive Hep3B cells. Cells were incubated on ice at an E/T ratio of 5:1 for 1 hour in the presence of sGPC3-his protein (D) or culture supernatant of Hep3B-sGPC3 cells (E). Experiments were repeated with T cells derived from three donors. Data from one of three repeated experiments are presented as the mean±SD. **P<0.01; ***P<0.001. (F) Proposed working model of sGPC3 in GPC3- specific CAR-T cell therapy. CAR, chimeric antigen receptor; hYP7, humanized YP7; IL-2, interleukin; MFI, mean florescence intensity; N.D., undetectable; ns, not significant; sGPC3, shed glypican-3; sup., supernatant.
We further evaluated whether recombinant sGPC3 or Hep3B-sGPC3 cultured supernatant would affect the recognition of CAR-T cells and target cells. We found that the recognition of hYP7 CAR-T cells and Hep3B cells could be blocked by adding recombinant sGPC3 in a dose-dependent manner (figure 7 and online supplemental figure S6). Similar blocking effect was also observed after adding the culture supernatant of Hep3B-sGPC3 cells (figure 7E). Therefore, these results indicated that sGPC3 affect CAR-T cells as a competitor of mGPC3.
In summary, our results demonstrated that sGPC3 functions as a dominant-negative regulator to compete with mGPC3 for the binding of CAR-T cells, leading to deficient activation and blocked cytotoxicity of GPC3-targeted CAR-T cells (figure 7F).
Discussion
Solid tumors are composed of multiple components, including tumor cells, stroma cells, blood vessels, and infiltrated immune cells. These components form a relatively isolated but complicated microenvironment which constitutes a major barrier to the development of an effective strategy for curing solid tumors.37–39 To pursue better efficacy, more attention is focused on improving poor tumor penetration and/or overcoming the inactivation of immune cells in solid tumors.40 41 However, whether the tumor antigen itself is involved in the insufficient response of solid tumors to antitumor treatments is still obscure.
In the current study, we showed that in addition to GPC3-mediated cancer signaling and tumor growth, the efficacy of GPC3-specific CAR-T cells is also blocked by sGPC3 in vitro and in vivo. This competitive inhibition is consistent with the universal agonistic effect of shed cell-surface proteoglycan on their corresponding membrane proteoglycans. Cell-surface proteoglycans include two major subfamilies: syndecans and glypicans.42 43 In contrast to the well-described proteolytic cleavage of syndecans by matrix metalloproteinase, disintegrin and metalloproteinase domain-containing proteins (ADAMs), and ADAMs with thrombospondin domains,42 there is limited available evidence demonstrating how the shedding of glypicans occurs. Notum, a palmitoleoyl-protein carboxylesterase, has been reported to induce the release of GPI-anchored proteins, including glypicans44; ADAM17 is regarded as the specific sheddase cleaving glypican-1.45 We overexpressed or purified truncated GPC3 lacking the GPI-anchoring domain to mimic the native sGPC3. Although this truncated form of GPC3 was evaluated to have similar structure identity and biological function to the native GPC3, it is still necessary to identify the detailed shedding process of GPC3, including the cleavage site, GPC3-specific sheddase and the leading cause of the shedding process of GPC3 in HCC.
We constructed sGPC3-overexpressing HCC cells to investigate the influence of sGPC3 on CAR-T cell treatment in vitro and in vivo. Under similar tumor burden, sGPC3-overexpressing-HCC tumor and Mock-HCC tumor exhibited similar levels of surface GPC3 expression, cell proliferation rate and activation of β-catenin. These phenomena suggested that the impaired anti-tumor activity of CAR-T cells observed in our study might be mainly caused by the sGPC3-induced blocking effect. However, this model might only represent a simplified shedding process of GPC3. Therefore, it would be necessary to further evaluate the sGPC3-induced resistance to CAR-T treatment in a model with more clinical-relevance, such as an orthotopic model by implanting patient-derived HCC tumors with GPC3 shedding that naturally occurs.
In vitro experiments showed that free sGPC3 did not induce the efficient activation of CAR-T cells. Accordingly, previous reports showed that monomeric forms of CAR ligands, such as mesothelin (MSLN), cannot trigger CAR signaling.46 Moreover, others also reported that anti-GFP CAR-T cells and anti-transforming growth factor-β CAR-T cells could be activated only when soluble antigen were dimerized or crosslinked.36 In our study, we observed that the crosslinked sGPC3 triggered the activation of CAR-T cells in vitro (online supplemental figure S5). This observation indicates that the effect of sGPC3 on CAR-T cells would be more complicated if sGPC3 was crosslinked in HCC tumor locally through its HS chains or other extracellular matrix molecules. Therefore, it would be interesting to examine this point in orthotopic mouse model or a mouse HCC tumor model. Besides activation, more detailed issues such as T cell exhaustion should also be examined to evaluate the effect of crosslinked shed antigen.
Our study provides a proof-of-concept example showing that the antigen shedding might cause worse response to immunotherapy in HCC. A recent study on secreted Programmed cell death-Ligand 1 (sPD-L1) variants showed that sPD-L1 functioned as a decoy of a PD-L1 blockade antibody.29 This inhibitory trend of sPD-L1 is consistent with our current observations to some extent. MSLN presents a substantial amount of shedding in many tumor types. However, MSLN shedding seems to exert no significant blocking effect on MSLN-specific CAR-T cells in vitro.46 Thus, whether the sGPC3-induced inhibitory effect on CAR-T cells observed here is only an antigen-specific phenomenon or represents a universal immune escape mechanism in solid tumors requires further investigation.
In conclusion, we have generated novel anti-GPC3 CAR-T cells for the treatment of HCC and demonstrated that sGPC3 attenuates the antitumor activities of CAR-T cells in vitro and in vivo, possibly by competing with membrane-bound GPC3 to bind CAR-T cells, indicating that sGPC3 may serve as a meaningful indicator for the prognosis of CAR-T therapy. Our results provide a new understanding of the mechanisms of tumor immune escape in HCC patients after receiving immunotherapies targeting GPC3.
Data availability statement
All data relevant to the study are included in the article or uploaded as online supplemental information.
Ethics statements
Ethics approval
All mice received humane care according to the criteria outlined in the Guide for the Care and Use of Laboratory Animals prepared by the National Academy of Sciences and published by the National Institutes of Health. All mice were housed and treated under the protocol approved by the Ethics Committee of the Animal Core Facility of Nanjing Medical University. Analysis with patient samples was approved by the Institutional Review Boards of the participating hospitals.
Acknowledgments
We thank Yen Phung and Yi-Fan Zhang (National Cancer Institute or NCI) for isolating and humanizing the YP7 antibody, and Dr. Mei Zhang (First Affiliated Hospital of Nanjing Medical University) for optimizing the CAR-T cell culture protocol. The National Cancer Institute (NCI) holds patent rights to the anti-GPC3 YP7 antibody in many jurisdictions, including the USA, China, Japan, South Korea, Singapore, and Europe. Anyone interested in licensing the YP7 antibody can contact Dr. Mitchell Ho (NCI) for additional information.
References
Supplementary materials
Supplementary Data
This web only file has been produced by the BMJ Publishing Group from an electronic file supplied by the author(s) and has not been edited for content.
Footnotes
LS and FG contributed equally.
Contributors LS, FG, ZG, LA, NL, SM and MJ performed the experiments; LS, FG, TD, SJ, NL, PL and WG analyzed the data; NL constructed the GPC3 (hYP7) CAR plasmid; BS and SJ provided the clinical samples; TD, MH and WG designed and conducted the research; TD and WG wrote the manuscript; MH revised the manuscript. All authors read and approved the final manuscript.
Funding This research was supported by the National Natural Science Foundation of China (No. 81773260; No. 81972284) and the National Natural Science Foundation Youth Project of Jiangsu, China (No. BK20171047). The development of the YP7 and humanized YP7 (hYP7) antibodies was supported by the Intramural Research Program of the National Institutes of Health (NIH), National Cancer Institute (NCI) (Z01 BC010891 and ZIA BC010891 to MH).
Competing interests No, there are no competing interests.
Provenance and peer review Not commissioned; externally peer reviewed.
Supplemental material This content has been supplied by the author(s). It has not been vetted by BMJ Publishing Group Limited (BMJ) and may not have been peer-reviewed. Any opinions or recommendations discussed are solely those of the author(s) and are not endorsed by BMJ. BMJ disclaims all liability and responsibility arising from any reliance placed on the content. Where the content includes any translated material, BMJ does not warrant the accuracy and reliability of the translations (including but not limited to local regulations, clinical guidelines, terminology, drug names and drug dosages), and is not responsible for any error and/or omissions arising from translation and adaptation or otherwise.