Article Text

Abstract
Background The satisfactory prognostic indicator of gastric cancer (GC) patients after surgery is still lacking. Perioperative plasma extracellular vesicular programmed cell death ligand-1 (ePD-L1) has been demonstrated as a potential prognosis biomarker in many types of cancers. The prognostic value of postoperative plasma ePD-L1 has not been characterized.
Methods We evaluated the prognostic value of preoperative, postoperative and change in plasma ePD-L1, as well as plasma soluble PD-L1, in short-term survival of GC patients after surgery. The Kaplan-Meier survival model and Cox proportional hazards models for both univariate and multivariate analyzes were used. And the comparison between postoperative ePD-L1 and conventional serum biomarkers (carcinoembryonic antigen (CEA), cancer antigen 19–9 (CA19-9) and CA72-4) in prognostic of GC patients was made.
Results The prognostic value of postoperative ePD-L1 is superior to that of preoperative ePD-L1 on GC patients after resection, and also superior to that of conventional serum biomarkers (CEA, CA19-9 and CA72-4). The levels of postoperative ePD-L1 and ePD-L1 change are independent prognostic factors for overall survival and recurrence free survival of GC patients. High plasma level of postoperative ePD-L1 correlates significantly with poor survival, while high change in ePD-L1 level brings the significant survival benefit.
Conclusions The level of plasma postoperative ePD-L1 could be considered as a candidate prognostic biomarker of GC patients after resection.
- gastrointestinal neoplasms
- immune evation
This is an open access article distributed in accordance with the Creative Commons Attribution Non Commercial (CC BY-NC 4.0) license, which permits others to distribute, remix, adapt, build upon this work non-commercially, and license their derivative works on different terms, provided the original work is properly cited, appropriate credit is given, any changes made indicated, and the use is non-commercial. See http://creativecommons.org/licenses/by-nc/4.0/.
Statistics from Altmetric.com
Introduction
Gastric cancer (GC) is one of the most frequent cancers worldwide, and the prevalence is especially high in East Asia.1 Currently, the standard treatment for GC, surgical resection with or without perioperative chemotherapy and postoperative chemotherapy, has improved the long-term survival outcomes.2–4 However, many GC patients experience recurrence, and GC is the second-leading cause of cancer-related deaths.1 5 Clinically, the standard serum biomarkers for GC, such as carcinoembryonic antigen (CEA), cancer antigen 72–4 (CA72-4) and cancer antigen 19–9 CA19-9 (CA19-9), lack sufficient discrimination to distinguish patients with good or poor prognosis.6–8 In addition to pathological TNM (Tumor Node Metastasis) staging, there still lack satisfactory prognostic indicators of GC patients after surgery, which is critically important in determine optimal postoperative strategies.
The use of immune checkpoint protein inhibitors in cancer therapies has proven to be a revolutionary breakthrough in recent years.9–12 As an important immune checkpoint pathway, the interaction of programmed cell death-1 (PD-1) on T-cells with its ligand, programmed cell death ligand-1 (PD-L1) on immune and tumor cells, limits antigen-driven T cell activation.10 13 PD-L1 is a membrane bound ligand that is up-regulated in almost all types of tumors and associated with poor prognosis.11 14 The PD-1/PD-L1 inhibitors have also been emerging as a novel treatment strategy for advanced GC.15 16 Subsequently, extracellular PD-L1 (ePD-L1), including soluble PD-L1 (sPD-L1)17–19 and extracellular vesicular (EV) ePD-L1,20 21 has been characterized and was proved to be associated with anti-PD-L1/PD-1 therapy in different solid tumors.22 23 In particular, preoperative plasma ePD-L1 of various malignancies has been reported to have immunosuppressive activity and associated with tumor progression.24 25 In GC, preoperative plasma ePD-L1 level has also been reported to be associated with tumor prognosis in a study with a small number of patients.26 However, to our knowledge, the prognostic value of postoperative plasma PD-L1, especially ePD-L1, has not been reported. Considering that tumor tissue is the main source of plasma PD-L1, the level of postoperative plasma PD-L1 might reflect the presence and area of residual or metastatic tumor lesions, and hence associated with patients’ prognosis.
The objective of this study was to investigate the impact of preoperative and postoperative plasma PD-L1 (including sPD-L1 and ePD-L1) on short-term survival rate and cancer recurrence in GC patients who accept surgical resection. These results will be helpful in determine optimal postoperative strategies for patients with cancer.
Methods
Patients and sampling
This study enrolled the GC patients who accepted resection between October 2018 and April 2019 at Shanxi Provincial Cancer Hospital (Taiyuan, China). Exclusion criteria were: cases with preoperative treatment (n=18), cases with previous gastric surgery (n=6), cases with previous or present tumors other than GC (n=7), cases with infection or inflammatory disease within 30 days (n=11), cases with palliative surgery only (n=13), cases who were lost to follow-up (n=8). In total, 313 patients were included in this study. The patients’ demographic, laboratory (including serum levels of CEA, CA19-9 and CA72-4, all were measured using Elecsys-electrochemical Immune Assays), imaging, pathological, surgical data were collected and reviewed through hospital registry systems by two academic gastroenterologists. All patients were followed up for at least 18 months since operation. Peripheral blood specimens were collected 0–7 days before and 7–10 days after surgical operation, and centrifuged at 1000×g for 10 min at room temperature. Plasma was collected and subjected to a second centrifugation of 15 min 2500×g at room temperature to obtain platelet-free plasma which was stored in aliquots at −70°C. All subjects had provided written informed consent.
Isolation and characterization of EVs
EVs were isolated using the Total Exosome Isolation Kit (from plasma) (ThermoFisher Scientific) as described previously.25 In brief, plasma samples were centrifuged at 2500×g for 10 min at room temperature, the supernatant was diluted 1:1 in PBS (phosphate buffer saline), and then 0.2 vol of Exosome Precipitation Reagent (from plasma) was added. After incubated at room temperature for 10 min, the mixture was centrifuged at 10 000×g for 5 min at room temperature. The resulting pellet was resuspended into 50 μL of PBS.
The EV morphology was examined using transmission electron microscope. Isolated EVs were fixed and were loaded on a 300 mesh copper grid. EVs were stained with 2% phosphotungstic acid for 1–2 min and dried under an electric incandescent lamp for 10 min. Data were acquired using a transmission electron microscope (JEOL JEM-2100) at an accelerating voltage of 160 KV. The number and size of EVs were examined through nanoparticle tracking analysis (NTA). A NanoSight NS300 with a 405 nm laser instrument (Malvern Instruments, UK) was used.
The EVs and ePD-L1 were also characterized through immunofluorescence staining. The platelet-free plasma was centrifuged at 2500×g for 10 min at room temperature, the supernatant was stained with the FITC-anti-CD63 (10 µg/mL) and PerCP-anti-PD-L1 (10 µg/mL) for 2 hours at room temperature. The stained EVs were purified using Total Exosome Isolation Kit (from plasma) and smeared on glass slide. A laser-scanning confocal microscope (TCS SP8 STED, Leica, magnification 63×10) was used to visualize the stained EVs. The number of CD63 or PD-L1 positive EVs was analyzed through ImageJ software (National Institutes of Health, USA).
ELISA assay
Plasma soluble or EV PD-L1 levels were determined by Human B7H1/PD-L1 ELISA Kit (RayBioetch) according to the manufacturer’s instructions, as our previous description.25 The EVs derived from the plasma were resuspended in the same volume of PBS as the plasma they were originally derived from. For samples lower than the minimum detectable concentration of PD-L1, a re-examination was performed using a quantity five times (for EVs) or two times (for plasma) of the standard dose. For the sample which was still lower than the detect limitation (5 pg/mL) after re-examination, its concentration was defined as 5 pg/mL. The concentration of sPD-L1 was calculated by subtracting the concentration of ePD-L1 from that of plasma total PD-L1 (tPD-L1).
Statistics
The primary endpoint of this study was the association between prognosis and the preoperative, postoperative and the change of plasma levels of ePD-L1, sPD-L1 and tPD-L1. The PD-L1 change (value of postoperative PD-L1 reduction compared with preoperative level) was calculated by subtracting the concentration of postoperative PD-L1 from that of preoperative PD-L1. TNM staging was performed according to the eighth edition of the Union for International Cancer Control TNM classification.27 Concomitant disease refers to chronic diseases that do not meet the exclusion criteria, such as hypertension, diabetes. Gastrectomy, lymph node dissection and adjuvant chemotherapy were carried out according to Japanese Gastric Cancer Treatment Guidelines 2018 (fifth edition).4 Postoperative complications were defined as intra-abdominal infectious complications of grade II or higher according to the Clavien-Dindo classification.28 Overall survival (OS) was defined as the time from surgery to death from any cause. Recurrence-free survival (RFS) was defined as the time from surgery to either the first recurrence or death from any cause.
Continuous variables are presented as median (first to third quartile). Differences between groups were compared using the Fisher’s exact test for categorical variables and the Wilcoxon rank-sum test for continuous variables. RFS and OS curves were estimated using the Kaplan-Meier method, and survival differences were compared using the log-rank test. Cox proportional hazards models were used for both univariate and multivariate analyzes, and results are expressed as HR and 95% CI. A two-sided p<0.05 was considered statistically significant. Statistical analyses were performed with SPSS V.24.0 .
Results
Demographic and clinical characteristics by plasma PD-L1 levels
A total of 313 GC patients were enrolled in this study. The plasma PD-L1 was subgrouped into EV PD-L1 (ePD-L1) and (EV excluded)sPD-L1. The plasma tPD-L1 was also included in this study. Plasma EVs were isolated using the Total Exosome Isolation Kit (from plasma) and verified by transmission electron microscopy (online supplemental figure 1A) and NTA (online supplemental figure 1B). The expression of PD-L1 on plasma EVs was identified by confocal microscopy imaging by randomly selected two patients with low (online supplemental figure 1C) and high (online supplemental figure 1D) content of ePD-L1. The percentage of PD-L1 positive vesicles in CD63 positive vesicles was calculated and the results consistent with those from ELISA assay (online supplemental figure 1E).
Supplemental material
Table 1 lists the demographic and clinical characteristics by the preoperative, postoperative and change in ePD-L1 levels. The high preoperative ePD-L1 group included more patients with higher T stage, higher N stage, higher total TNM stage, large amount of intraoperative blood loss and postoperative complications than the low preoperative ePD-L1 group. The high postoperative ePD-L1 group included more patients with higher T stage, higher N stage, higher M stage and higher total TNM stage than the low postoperative ePD-L1 group. The group with high ePD-L1 change included more patients with undifferentiated histological type, higher T stage, higher N stage, total gastrectomy, longer operation time, lymphadenectomy and postoperative complications than the group with low ePD-L1 change.
Study cohort characteristics according to ePD-L1 (n=313)
Online supplemental table 1 lists the demographic and clinical characteristics by the preoperative, postoperative and change in sPD-L1 levels. The high preoperative sPD-L1 group included more patients with higher T stage, fewer patients with concomitant disease and lymphadenectomy than the low preoperative sPD-L1 group. The high postoperative sPD-L1 group included more patients with higher N stage and adjuvant chemotherapy than the low postoperative sPD-L1 group. The group with high sPD-L1 change included fewer patients with concomitant disease, large amount of intraoperative blood loss and adjuvant chemotherapy than the group with low sPD-L1 change.
Supplemental material
Online supplemental table 2 lists the demographic and clinical characteristics by the preoperative, postoperative and change in tPD-L1 levels. The high preoperative tPD-L1 group included more patients with higher T stage, higher N stage and postoperative complications than the low preoperative tPD-L1 group. The high postoperative tPD-L1 group included more patients with lower body mass index (BMI), higher T stage, higher N stage and higher total TNM stage than the low postoperative tPD-L1 group. The group with high tPD-L1 change included more patients with male sex, younger age, higher T stage, higher total TNM stage, longer operation time and fewer patients with concomitant disease than the group with low tPD-L1 change.
Supplemental material
Kaplan-Meier survival analysis
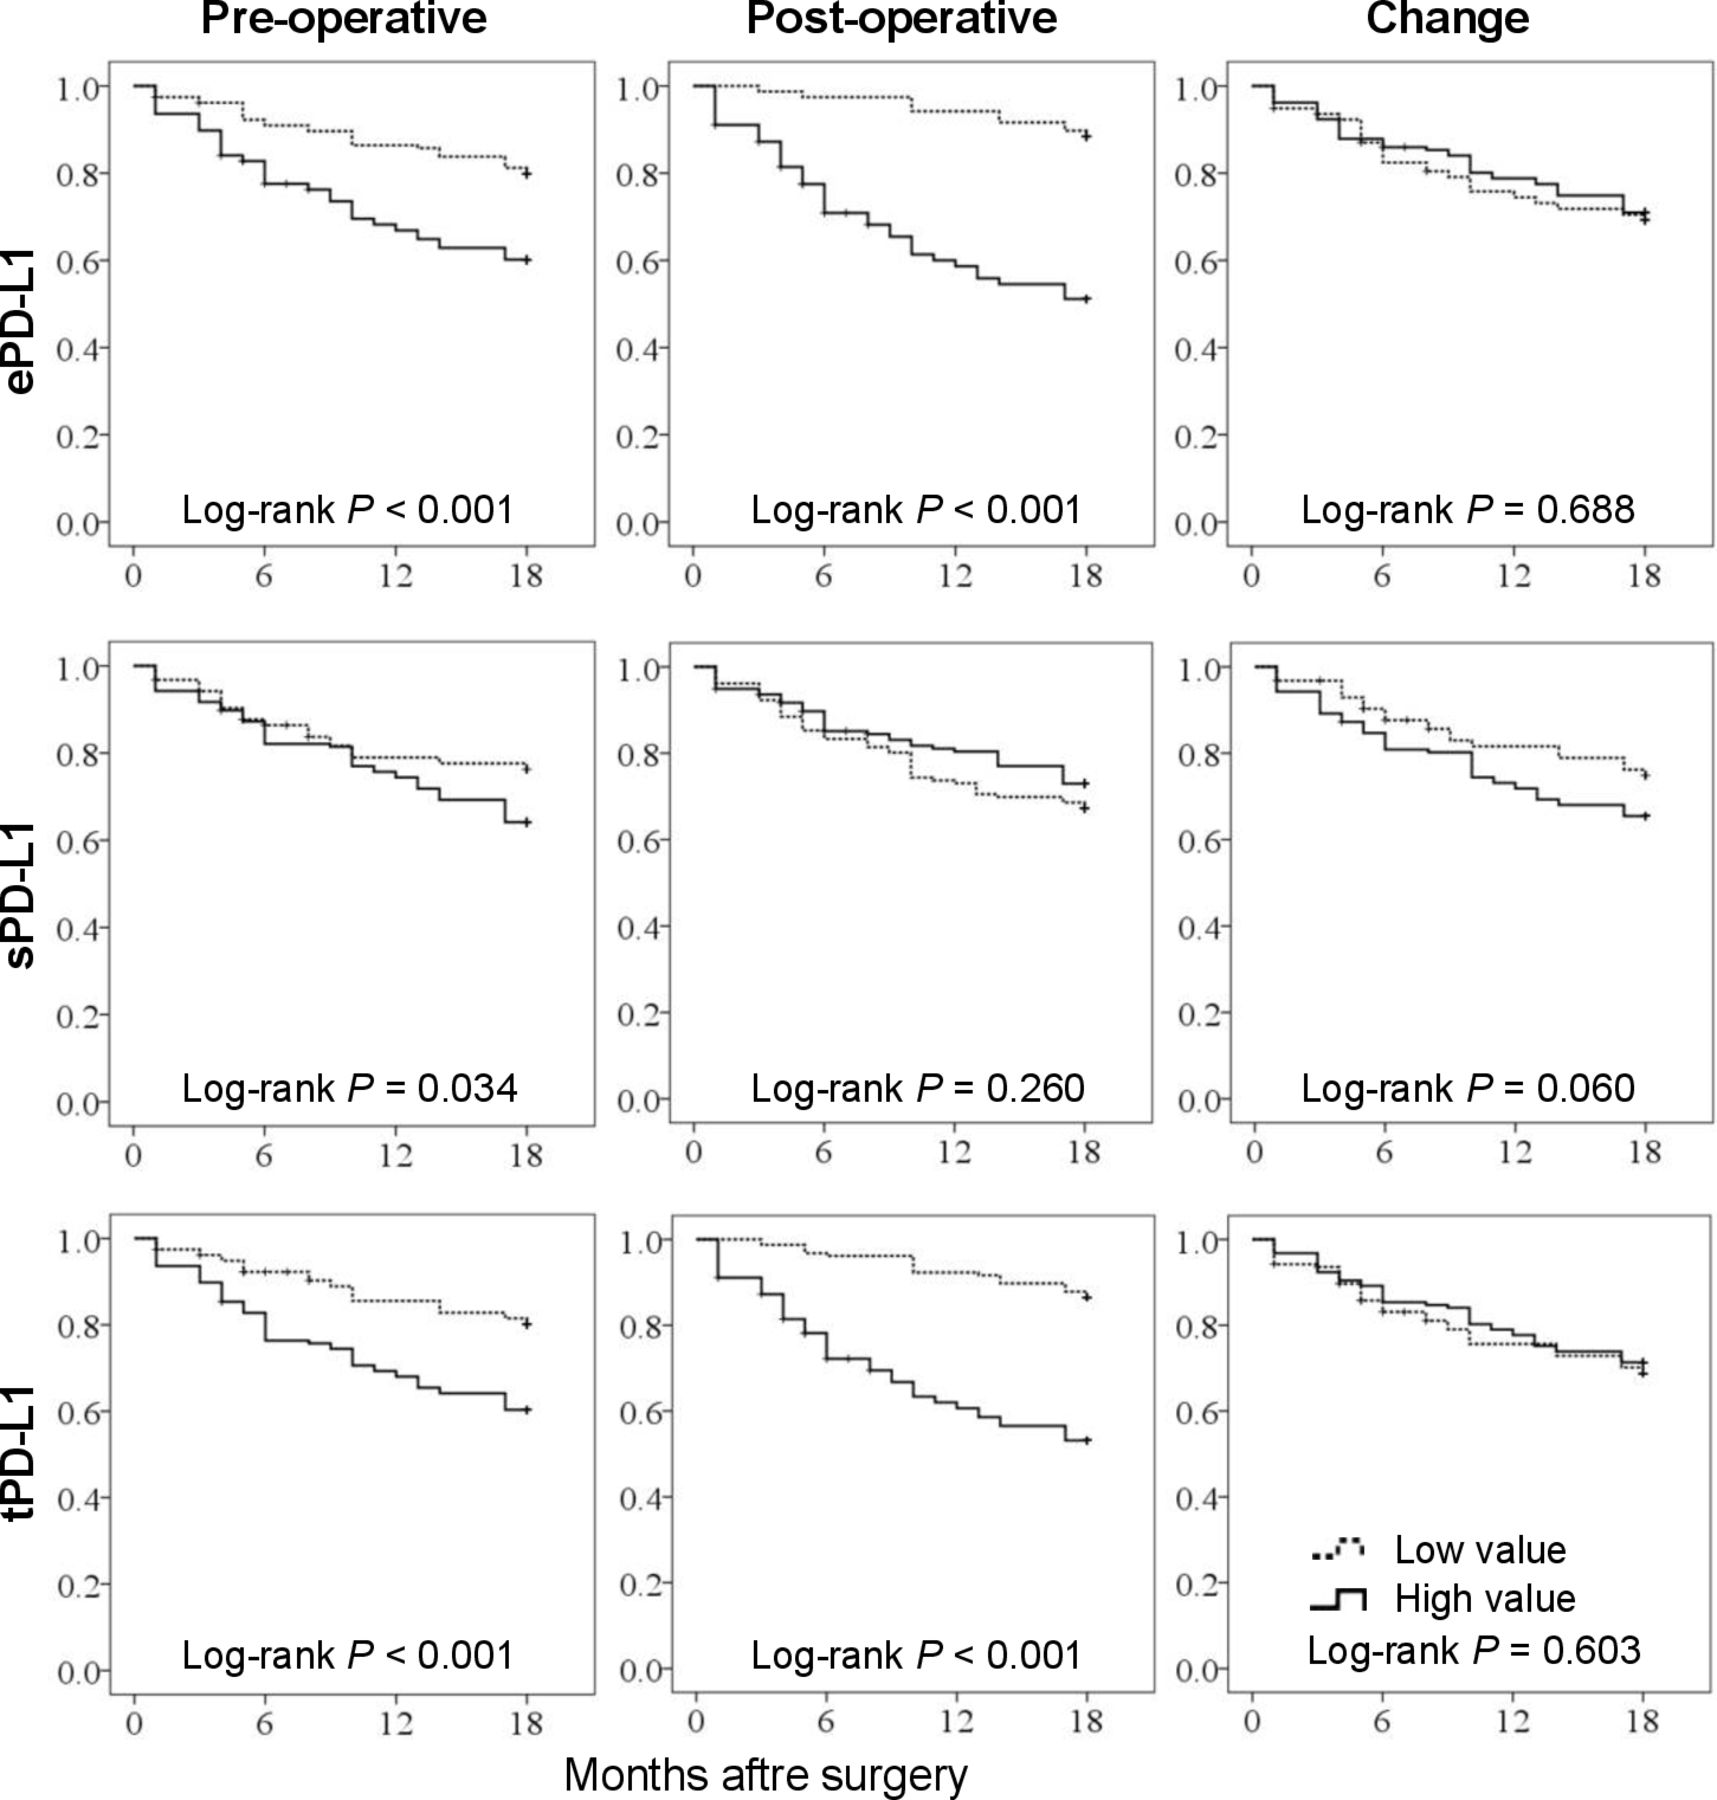
At the follow-up duration of 18 months for the censored cases, 78 (24.9%) patients died and 92 (29.4%) patients developed a recurrence or death event. The OS was significantly worse in patients with high preoperative ePD-L1 (p<0.001), high postoperative ePD-L1 (p<0.001), high preoperative tPD-L1 (p<0.001) and high postoperative tPD-L1 (p<0.001) than in those groups with corresponding low value (figure 1). The cut-off value of each index was defined as corresponding median value (table 1, online supplemental tables 1 and 2). There was no significant difference in OS between the patients with high and low value of preoperative, postoperative or change in sPD-L1. Similarly, the RFS was also significantly worse in the group with high preoperative ePD-L1 (p<0.001), high postoperative ePD-L1 (p<0.001), high preoperative tPD-L1 (p<0.001) and high postoperative tPD-L1 (p<0.001) than in those groups with corresponding low value (figure 2). In addition, the high preoperative sPD-L1 group had worse RFS than the low preoperative sPD-L1 group (p=0.034).
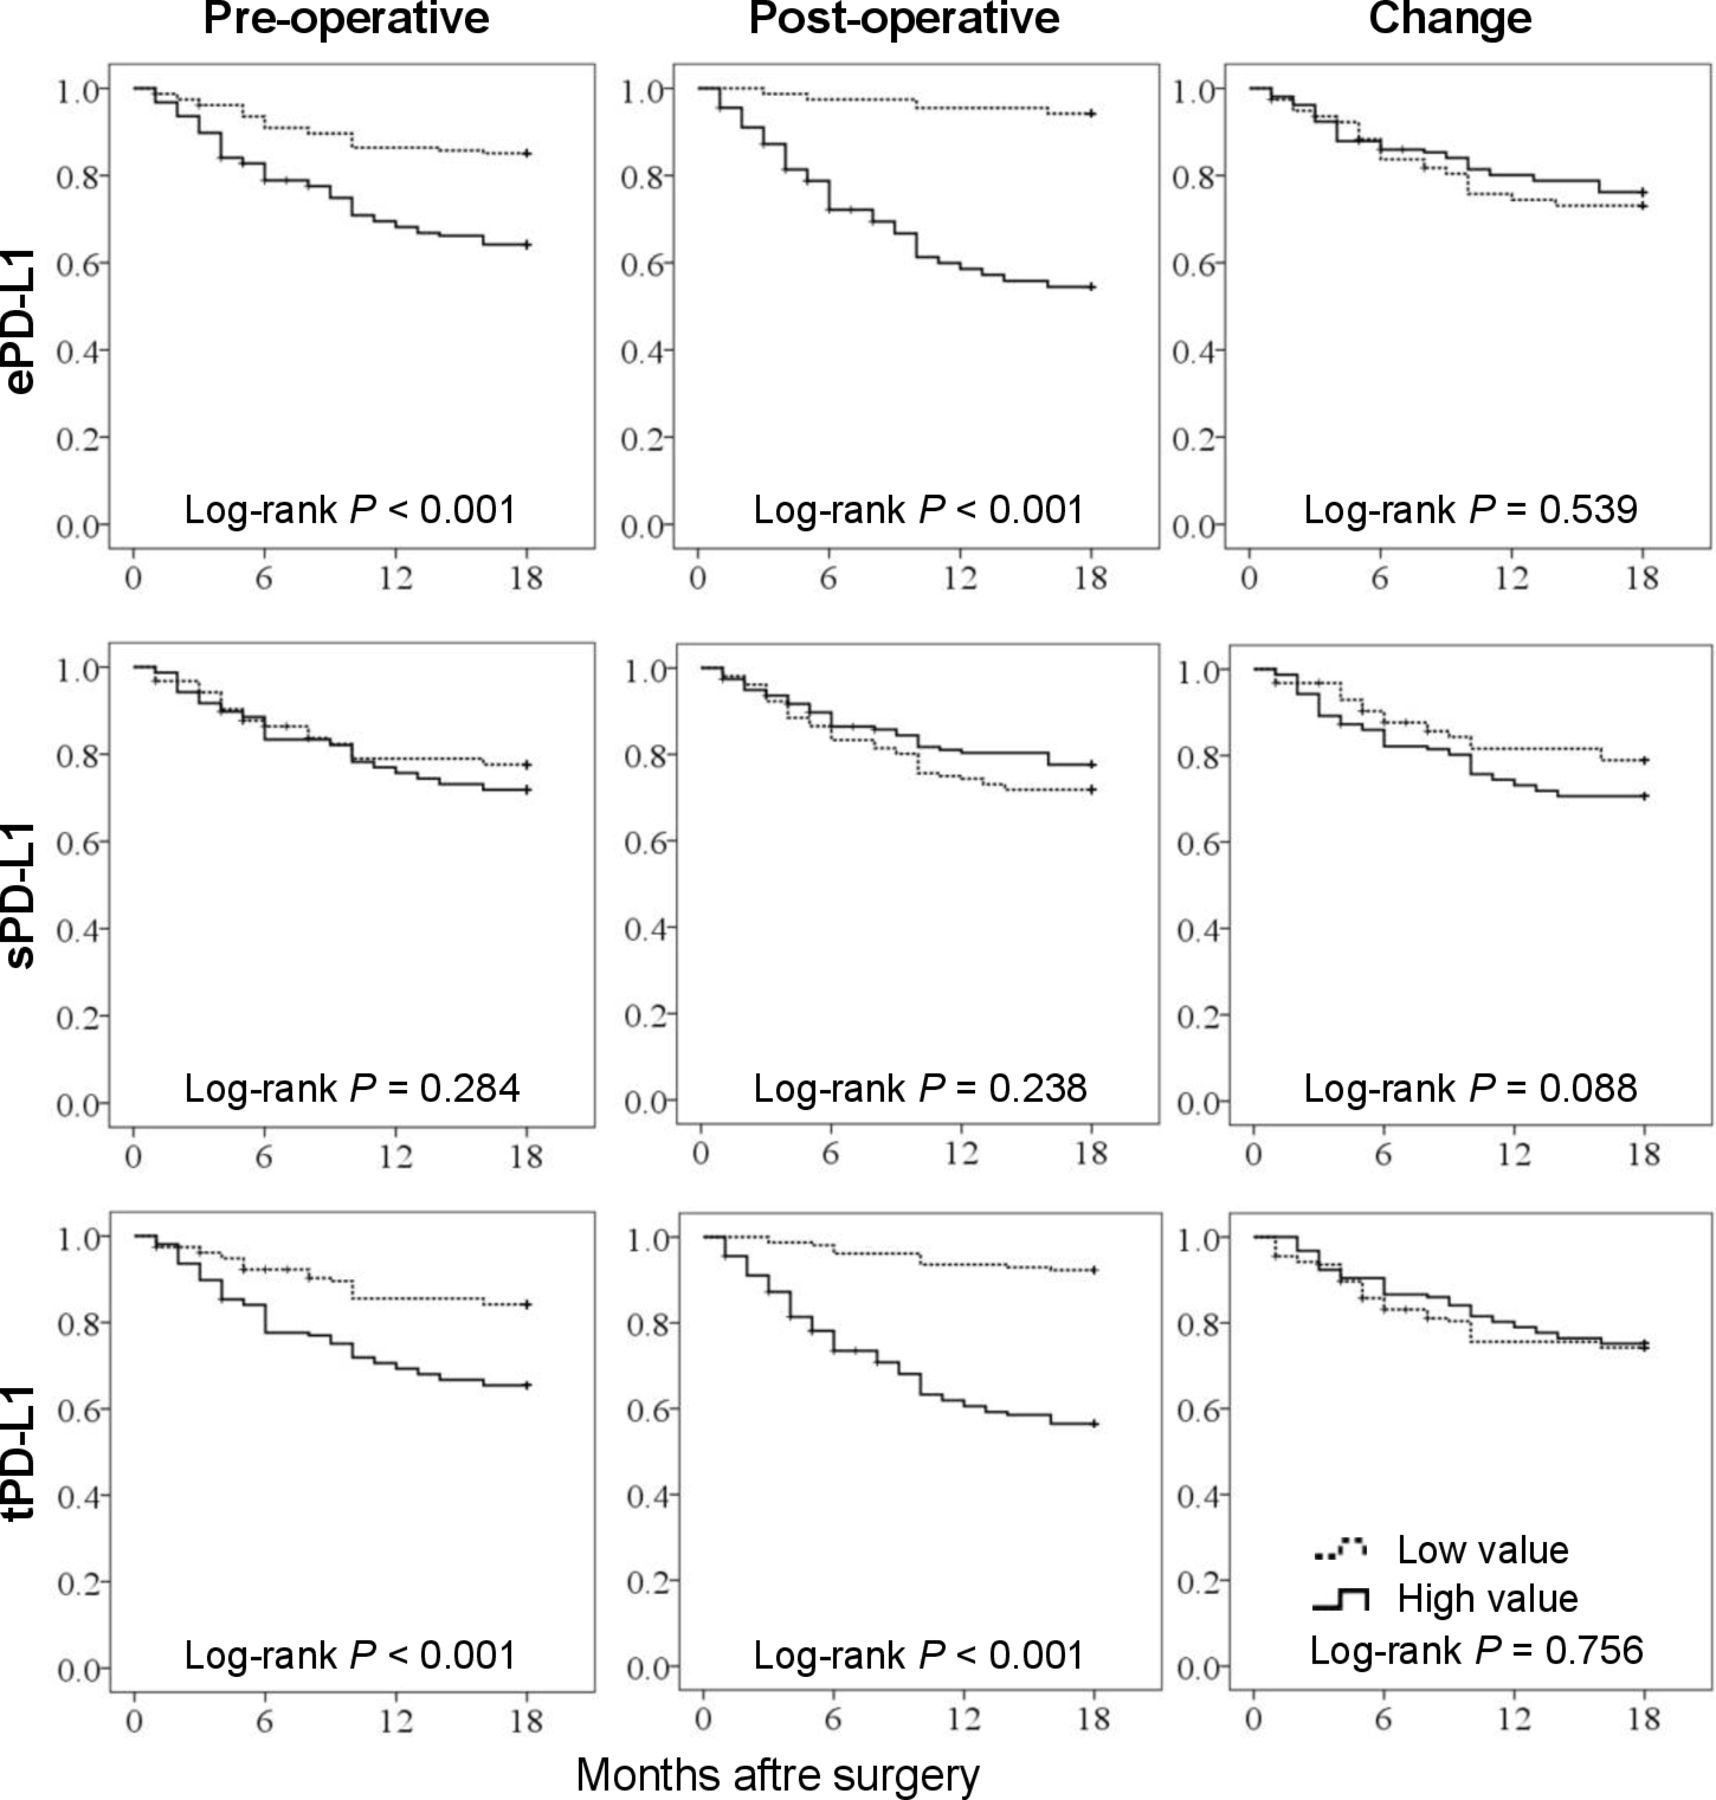
Kaplan-Meier curves estimate for overall survival (n=313). The cut-off value of each index was defined as corresponding median value. ePD-L1, plasma extracellular vesicular programmed cell death ligand-1; sPD-L1, plasma soluble PD-L1; tPD-L1, plasma total PD-L1.

Kaplan-Meier curves estimate for recurrence-free survival (n=313). The cut-off value of each index was defined as corresponding median value. ePD-L1, plasma extracellular vesicular programmed cell death ligand-1; sPD-L1, plasma soluble PD-L1; tPD-L1, plasma total PD-L1.
Results of univariate COX regression analyzes (n=313)
Univariate and multivariate Cox proportional hazards regression analyses
In the univariate analysis (table 2), patients’ BMI, undifferentiated type, Borrmann typing, pathological T, N, M and total TNM stage, concomitant disease and lymphadenectomy were significant associated factors for both OS and RFS. Adjuvant chemotherapy was associated with OS but not associated with RFS (p=0.094). And hence, these factors, as well as patients’ age and sex, were included into the multivariate regression analysis as confounding factors. The pathological T, N and M stage were replaced by total TNM stage to avoid over analysis. In addition to these nine confounding factors, the preoperative, postoperative and change in PD-L1s were included into the final Cox multivariate regression analysis model in turn, to assess their independent prognostic value for OS and RFS. The multivariate analyzes identified postoperative ePD-L1 (HR 1.136, 95% CI 1.098 to 1.174, p<0.001), ePD-L1 change (HR 0.914, 95% CI 0.878 to 0.951, p<0.001), postoperative tPD-L1 (HR 1.086, 95% CI 1.059 to 1.113, p<0.001) and tPD-L1 change (HR 0.978, 95% CI 0.959 to 0.997, p=0.023) as the independent prognostic factors for OS (figure 3A). Results of the multivariate analyses for RFS demonstrated that postoperative ePD-L1 (HR 1.137, 95% CI 1.103 to 1.172, p<0.001), ePD-L1 change (HR 0.921, 95% CI 0.890 to 0.954, p<0.001), postoperative tPD-L1 (HR 1.085, 95% CI 1.061 to 1.110, p<0.001) and tPD-L1 change (HR 0.982, 95% CI 0.965 to 0.999, p=0.037) were the independent prognostic factors (figure 3B). By contrast, the preoperative ePD-L1 and preoperative tPD-L1, as well as preoperative, postoperative and change in sPD-L1, were not independent prognostic factors for both OS and RFS. The complete results of the multivariate COX regression analysis for OS and RFS were shown in online supplemental tables 3–8.
Supplemental material
Supplemental material
Supplemental material
Supplemental material
Supplemental material
Supplemental material

Results of multivariate COX proportional hazards regression analyzes for overall survival (OS) and recurrence-free survival (RFS). Data were adjusted for patients’ age, sex, BMI, undifferentiated type, Borrmann typing, pathological total TNM stage, concomitant disease, lymphadenectomy and adjuvant chemotherapy. n=313. BMI, body mass index; ePD-L1, plasma extracellular vesicular programmed cell death ligand-1; sPD-L1, plasma soluble PD-L1; tPD-L1, plasma total PD-L1.
Comparison of prognostic efficiency between postoperative ePD-L1 and conventional serum biomarkers
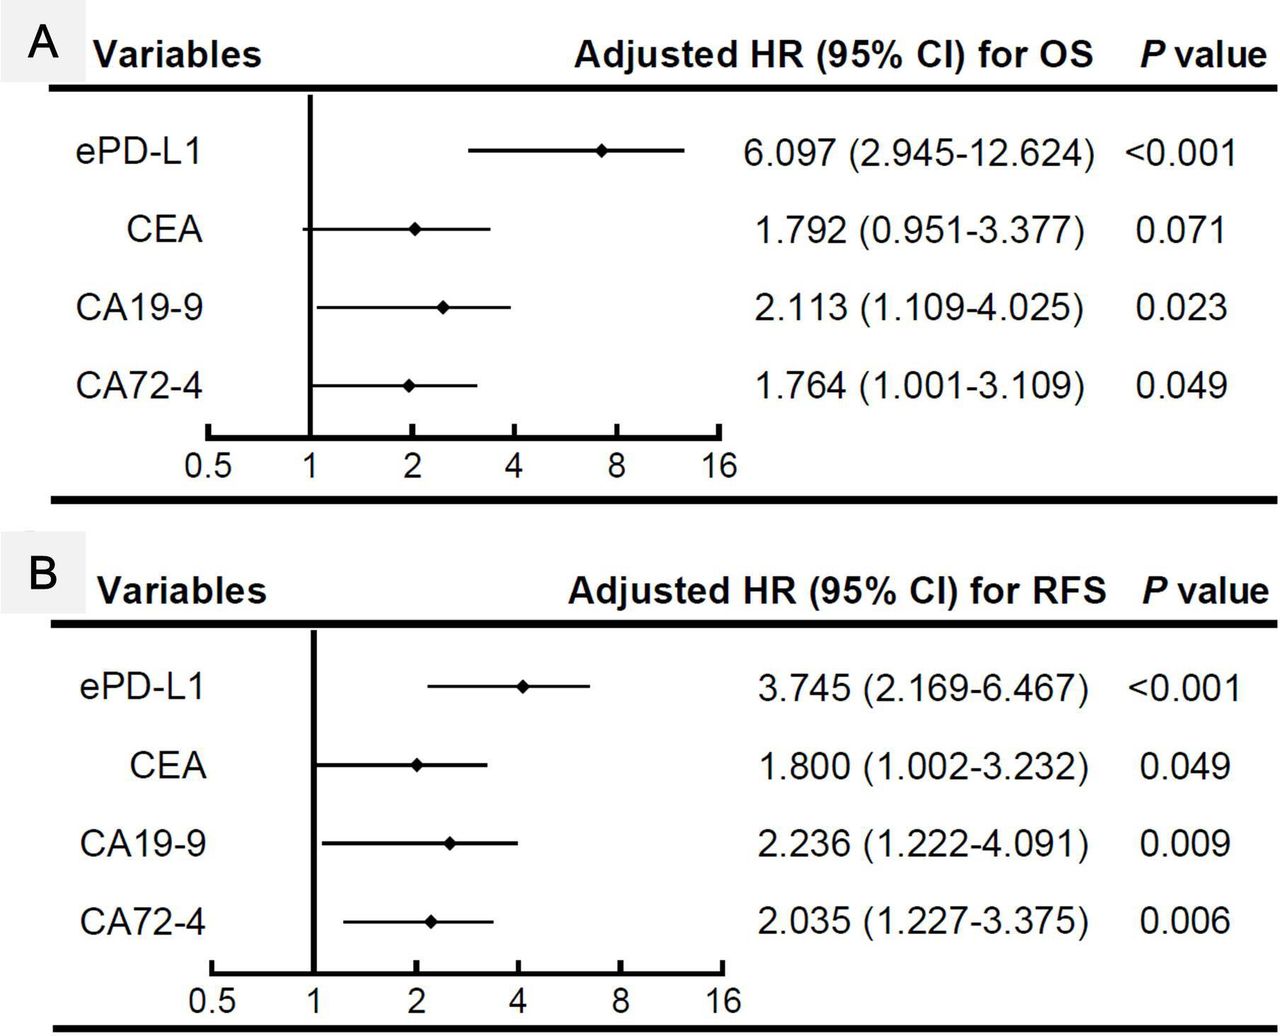
We selected the most powerful indicator of our research objectives (postoperative ePD-L1) to compare the survival performance with three conventional serum biomarkers (preoperative CEA, CA19-9 and CA72-4) in a subgroup of our study cohort (n=291, data of the other 22 patients were not available). Due to the different unit standards, all four indicators were converted into binary variables. The cut-off value of ePD-L1 was defined as the median value (8.75 pg/mL). The cut-off values of CEA, CA19-9 and CA72-4 were defined as 5 ng/mL, 27 U/mL and 5.3 U/mL, respectively (according to a similar study9). In Kaplan-Meier survival analysis (figure 4), all four indicators demonstrated with significant distinguish abilities in both OS and RFS. However, the postoperative ePD-L1 had the best ability to distinguish the better or worse OS and RFS (both p<0.001). In Cox proportional hazards regression analysis (figure 5 and online supplemental table 9), all four indicators showed significant HR for OS and RFS in univariate analyses. However, the prognostic value of serum CEA on OS was not significant in multivariate analysis, after adjusted for the nine variables mentioned above. The postoperative ePD-L1 demonstrated the highest prognostic value for both OS and RFS, either in univariate or in multivariate analysis. The HR (95% CI) and p value of these four indicators were: 6.097 (2.945 to 12.624),<0.001 (OS of ePD-L1); 3.745 (2.169 to 6.467), <0.001 (RFS of ePD-L1); 1.792 (0.951 to 3.377), 0.007 (OS of CEA); 1.800 (1.002 to 3.232), 0.049 (RFS of CEA); 2.113 (1.109 to 4.025), 0.023 (OS of CA19-9); 2.236 (1.222 to 4.091), 0.009 (RFS of CA19-9); 1.764 (1.001 to 3.109), 0.049 (OS of CA72-4) and 2.035 (1.227 to 3.375), 0.006 (RFS of CA72-4).
Supplemental material
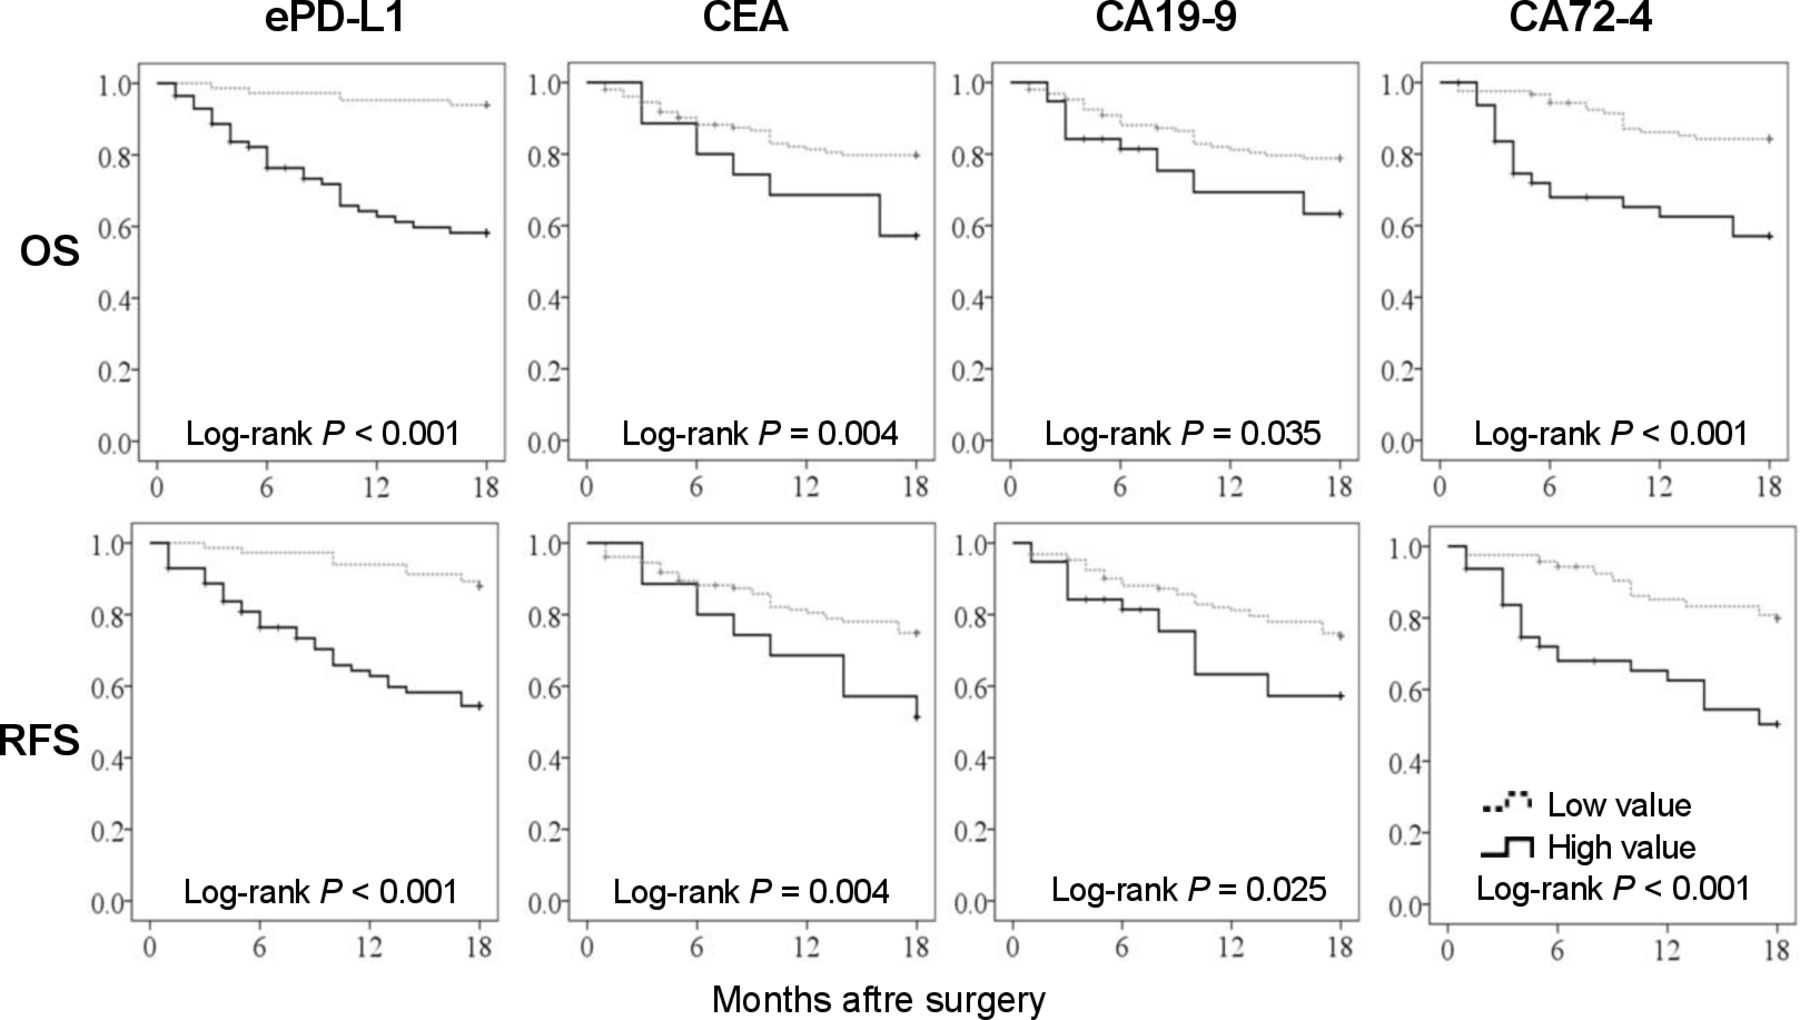
Comparison of Kaplan-Meier curves estimate for OS and RFS between postoperative ePD-L1 and conventional serum biomarkers (carcinoembryonic antigen (CEA), cancer antigen 19–9 (CA19-9) and CA72-4) (n=291). The cut-off value of ePD-L1, CEA, CA19-9 and CA72-4 were 8.75 pg/mL, 5 ng/mL, 27 U/mL and 5.3 U/mL, respectively. ePD-L1, extracellular vesicular programmed cell death ligand-1; RFS, recurrence-free survival; OS, overall survival.

Comparison of the results of multivariate COX proportional hazards regression analyzes for OS (A) and RFS (B) between ePD-L1, CEA, CA19-9 and CA72-4 (n=291). Data were adjusted for patients’ age, sex, BMI, undifferentiated type, Borrmann typing, pathological total TNM stage, concomitant disease, lymphadenectomy and adjuvant chemotherapy. The value of ePD-L1, CEA, CA19-9 and CA72-4 were converted into binary variables for the convenience of comparison, with corresponding cut-off value of 8.75 pg/mL, 5 ng/mL, 27 U/mL and 5.3 U/mL, respectively. BMI, body mass index; CEA, carcinoembryonic antigen; ePD-L1, extracellular vesicular programmed cell death ligand-1; OS, overall survival.
Discussion
The present study evaluated the relationships of different forms of plasma PD-L1s with short-term (18 months) prognosis of GC patients who underwent surgical resection. Our results demonstrate that levels of postoperative ePD-L1, postoperative tPD-L1, ePD-L1 change and tPD-L1 change are independent prognostic factors for OS and RFS of GC patients. High plasma levels of postoperative ePD-L1 and postoperative tPD-L1 correlate significantly with poor OS and RFS, while high change in ePD-L1 and tPD-L1 levels bring the significant benefit to OS and RFS. By comparison, postoperative ePD-L1 exhibits higher prognostic value for OS and RFS not only than other forms of plasma PD-L1, but also than the conventional serum biomarkers (CEA, CA19-9 and CA72-4). The levels of preoperative ePD-L1 and preoperative tPD-L1 are significant prognostic factors in univariate analyzes but not in multivariate analyzes, indicating their prognostic potencies are not independent of clinical characteristics, such as patients’ BMI, histological type, Borrmann typing, pathological stage, concomitent disease, lymphadenectomy and adjuvant chemotherapy, which are also significant prognostic factors for OS and RFS. Similarly, the level of plasma sPD-L1 is not an independent prognostic factor for OS and RFS of GC patients. To our knowledge, this is the first report on the relationship of postoperative plasma ePD-L1 with tumor prognosis.
PD-L1 is expressed on the cell surface and is up-regulated in almost all types of tumors.13 14 As an important immune checkpoint ligand, tumor PD-L1 binds the PD-1 receptor on CD8 +T cells, leading to immunosuppressive tumor microenviroment.13 29 Tumor PD-L1 expression has been explored as a predictive biomarker for tumors of different types.14 30 With the great development of immune checkpoint inhibitors in cancer therapies, PD-1/PD-L1 inhibitors have been emerging as a novel treatment strategy for advanced GC.15 16 However, not all PD-L1 positive patients respond well to PD-1/PD-L1 inhibitors. And in previous GC studies, contradictory results had been reported that PD-L1 was associated with both good31 and poor32 prognosis. The reason for these contradictory findings is uncertain, but could in part be attributed to the different levels of ePD-L1. Recent reports demonstrated that serum sPD-1 and PD-L1 levels were independent prognostic factors susceptible to anti-PD-L1/PD-1 therapy in different solid tumors.22 23 More recently, PD-L1 has been found expressed on the surface of EVs33 and tumor cell-derived EVs have contributed to immunosuppression through membrane PD-L1.23 24 Our recent report demonstrated that value of plasma ePD-L1 is better than sPD-L1 in the prognosis of cancer patients.25 This may be due to the cell membrane expression of ePD-L1, which preserves more of its immunosuppressive function on T cells than sPD-L1. A recent study reported the same results as ours that plasma ePD-L1 significantly associated with prognosis than sPD-L1 in GC patients.26 The present study also demonstrates that ePD-L1 is a more powerful marker than sPD-L1 and tPD-L1 in survival prognosis of GC patients after resection.
Our previous report demonstrated that the level of plasma ePD-L1 was significantly correlated with tumor PD-L1 expression,25 indicating that the tumor tissue is the major origin of plasma ePD-L1. And hence in patients with cancer, with the resection of tumor tissue, the plasma level of ePD-L1 will change significantly after surgery. Therefore, the level of postoperative plasma ePD-L1 can reflect the residual or metastatic tumor tissue more than the preoperative level. While the presence and area of residual or metastatic tumor lesions is an important indicator in patients’ treatment and prognosis after surgery. However, the prognostic value of postoperative plasma PD-L1 has not been reported to our knowledge. From the results of the present study, we can conclude that, after adjusting for chief clinical characteristics, the postoperative ePD-L1 maintained the significant correlation with patients’ survival, while the preoperative ePD-L1 not. The level of ePD-L1 change (value of postoperative reduction), which reflecting the resection of tumor tissue, also significantly correlated with patients’ survival, but the correlation was smaller than that of postoperative ePD-L1.
The residual and metastatic tumor foci are important prognostic factors for postoperative tumor patients. Indeed, our study also shown that the patients with reported tumor residue after surgery had worse survival outcomes than those without (data not shown). The detection of residual foci after GC surgery is mainly based on the general observation during the operation and histological analysis of the edge of excised tissue. Therefore, an extremely small residual tumor can be easily ignored.34 In addition, it is almost impossible to detect a minimal potential metastasis, as it is reported that the small cancer metastasis often occurs very early, but it is difficult to be detected.35 And hence, for the patients without positive report of residual or metastatic tumor after surgery, a marker that can indicate the potential residual or metastatic tumor is much needed. In this sense, postoperative plasma ePD-L1 may be an appropriate choice.
This study has several limitations. First, we enrolled a relatively small number of patients at a single Chinese institution. To reduce the selection bias as much as possible, the collection of patients was consecutive between October 2018 and April 2019. A multicenter study with more patients enrolled will be required. Second, the observation period of patients is relatively short. The present study observed the death and recurrence events in the first 18 months after surgery of GC patients. According to the results of several large clinical studies,36–38 the mortality in the first 18 months after section of GC patients accounted for about half of the long-term (5–10 years) mortality. Therefore, the death events in the first 18 months after surgery can objectively reflect the short-term survival rate, and can to some extent reflect the long-term survival status of GC patients. A long-term follow-up study is needed to assess plasma PD-L1-related late survival prognosis.
In summary, the current results validate a previous report on the association between plasma PD-L1 and prognosis of GC patients.26 More importantly, we demonstrate for the first time that high postoperative ePD-L1 level associates with a significantly increased risk of death, and a high drop in ePD-L1 level associates with a significantly decreased risk of death in GC patients after resection. Our results demonstrate the emerging roles of plasma postoperative ePD-L1 as a prognostic biomarker of tumor patients after resection, which is even superior to conventional serum biomarkers (CEA, CA19-9 and CA72-4) in prognostic of GC patients.
Acknowledgments
The authors would like to acknowledge the Key Laboratory of Cell physiology, Ministry of Education (Shanxi Medical University, Taiyuan, China) for providing the space and equipment for conducting the experiments.
References
Supplementary materials
Supplementary Data
This web only file has been produced by the BMJ Publishing Group from an electronic file supplied by the author(s) and has not been edited for content.
Footnotes
GL and GW contributed equally.
Contributors JX and BY conceived this study. GW and GL conceived and performed the experiments. GL, JM and ZG recruited the participants. KT, TL, FC, YJ, XW, QM, KQ, XZ and JP collected the samples. FL, BX, GF, YN and TG collected the clinical data. GW and GL analyzed the data. HZ and XD developed statistical analysis. GW and GL wrote the manuscript. JX and BY supervized the research. GW and GL contributed equally in this paper. All authors participated in revising the manuscript and agreed to the final version.
Funding This work was supported by following foundations: (1) National Natural Science Foundation of China (No. 30901821, 81172136, 82072737, 81201810), (2) Natural Science Foundation of Shanxi (No. 201701D121165, 201901D111190), (3) Research Project Supported by Shanxi Scholarship Council of China(No. 2020-194), (4) International Science and Technology Cooperation Project of Shanxi Provincial Key R&D Program (No. 201703D421023), (5) Shanxi Youth Science and Technology Research Fund (No. 201801D221069), (6) Open Fund from Key Laboratory of Cellular Physiology (Shanxi Medical University), Ministry of Education, China (No. KLMEC/SXMU202011), (7) Shanxi '1331 Project' Key Subjects Construction (No. 1331KSC) (8) Shanxi Province Science Foundation for Distinguished Young Scholar (No. 201901D211547), (9) Science and Research Fund of Shanxi Health Commission(No. 2019059), (10) the Doctor Project of Shanxi Cancer Hospital, China (No. 2017A06), (11) the Key Research Project of Shanxi Province, China (No. 201703D321010-1), (12) Natural Science Foundation of Guangdong Province, China (No. 2015A030313057).
Competing interests No, there are no competing interests.
Patient consent for publication Obtained.
Ethics approval This study was approved by Shanxi Cancer Hospital Ethics Committee (No. 2019068).
Provenance and peer review Not commissioned; externally peer reviewed.
Data availability statement Data are available on reasonable request. All data that support the findings of this study are available from the corresponding author BY on reasonable request.
Supplemental material This content has been supplied by the author(s). It has not been vetted by BMJ Publishing Group Limited (BMJ) and may not have been peer-reviewed. Any opinions or recommendations discussed are solely those of the author(s) and are not endorsed by BMJ. BMJ disclaims all liability and responsibility arising from any reliance placed on the content. Where the content includes any translated material, BMJ does not warrant the accuracy and reliability of the translations (including but not limited to local regulations, clinical guidelines, terminology, drug names and drug dosages), and is not responsible for any error and/or omissions arising from translation and adaptation or otherwise.