Article Text

Abstract
Background High-risk neuroblastomas (HR-NBs) are rare, aggressive pediatric cancers characterized by resistance to therapy and relapse in more than 30% of cases, despite using an aggressive therapeutic protocol including targeting of GD2. The mechanisms responsible for therapy resistance are unclear and might include the presence of GD2neg/low NB variants and/or the expression of immune checkpoint ligands such as B7-H3.
Method Here, we describe a multiparametric flow cytometry (MFC) combining the acquisition of 106 nucleated singlets, Syto16pos CD45neg CD56pos cells, and the analysis of GD2 and B7-H3 surface expression. 41 bone marrow (BM) aspirates from 25 patients with NB, at the onset or relapse, are analyzed, comparing results with cytomorphological analysis (CA) and/or immunohistochemistry (IHC). Spike in experiments assesses the sensitivity of MFC. Kaplan-Meier analysis on 498 primary NBs selects novel prognostic markers possibly integrating the MFC panel.
Results No false positive are detected, and MFC shows high sensitivity (0.0005%). Optimized MFC identifies CD45negCD56pos NB cells in 11 out of 12 (91.6%) of BM indicated as infiltrated by CA, 7 of which coexpress high levels of GD2 and B7-H3. MFC detects CD45negCD56posGD2neg/low NB variants expressing high surface levels of B7-H3 in two patients with HR-NB (stage M) diagnosed at 53 and 139 months of age. One of them has a non-MYCN amplified tumor with unusual THpos PHOX2Bneg phenotype, which relapsed 141 months post-diagnosis with BM infiltration and a humerus lesion. All GD2neg/low NB variants are detected in patients at relapse. Kaplan-Meier analysis highlights an interesting dichotomous prognostic value of MML5, ULBPs, PVR, B7-H6, and CD47, ligands involved in NB recognition by the immune system.
Conclusions Our study validates a sensitive MFC analysis providing information on GD2 and B7-H3 surface expression and allowing fast, specific and sensitive evaluation of BM tumor burden. With other routinely used diagnostic and prognostic tools, MFC can improve diagnosis, prognosis, orienting novel personalized treatments in patients with GD2low/neg NB, who might benefit from innovative therapies combining B7-H3 targeting.
- immunotherapy
- tumor biomarkers
- neuroblastoma
- antigens
- neoplasm
- immune evation
Data availability statement
All data relevant to the study are included in the article or uploaded as supplementary information. NA.
This is an open access article distributed in accordance with the Creative Commons Attribution Non Commercial (CC BY-NC 4.0) license, which permits others to distribute, remix, adapt, build upon this work non-commercially, and license their derivative works on different terms, provided the original work is properly cited, appropriate credit is given, any changes made indicated, and the use is non-commercial. See http://creativecommons.org/licenses/by-nc/4.0/.
Statistics from Altmetric.com
Background
Neuroblastoma (NB) is the most frequent extracranial solid tumor of childhood, with a median age at diagnosis of 17 months. Despite its classification as a rare disease, it represents a worldwide emergency. It arises from cells of the embryonic neural crest with a primary mass commonly located in the adrenal medulla or sympathetic ganglia. NB shows a notable heterogeneity in histology and clinical behavior, ranging from low-risk to high-risk diseases. Unlike the progress observed in the cure of other childhood neoplasia, NB still represents an unmet medical need, causing 10% of mortality in children with cancer. Localized NB (stages L1 and L2) have different outcomes mainly depending on the presence/absence of amplification of the transcription factor MYCN, the major NB oncogenic driver. On diagnosis, about 50% of NB present with metastasis and include rare stage MS tumors characterized by a high rate of spontaneous regression and favorable outcome, and highly aggressive tumors (stage M). High-risk NB (HR-NB) are characterized by resistance to therapy and relapse in more than 30% of cases, commonly represented by bone marrow (BM) metastasis.1–3 Failure of treatment occurs despite the aggressive therapy combining chemotherapy, surgery, autologous hematopoietic stem cell transplantation, radiotherapy, and immunotherapy.
Immunotherapy is currently based on the infusion of a chimeric monoclonal antibody targeting the NB-associated oncofetal differentiation antigen GD2.4 The mechanisms responsible for resistance to this therapy have not been fully elucidated. These may include (1) the presence, at the onset or after therapy, of GD2negative or GD2low tumor variants; these have been detected in up to 12% of patients5; (2) the constitutive or induced surface expression of B7-H36 7 and PD-Ls8 9 immune checkpoint ligands, which may reduce the activity of FcγR+ cells (NK, macrophages), even when engaged by therapeutic antibodies. None of the current diagnostic/prognostic procedures (imaging techniques, 123I-metaiodobenzylguanidine scintigraphy, cytological analysis of bone marrow (BM) aspirates, and histological/immunohistochemical analysis of trephine biopsies) provides precise information about the surface density of GD2 at the time of immunotherapy, making it impossible to correlate the GD2 expression levels and response to therapy. Notably, this information cannot be acquired from the retrospective analysis of stored paraffin-embedded tumor tissues due to the lipid nature of the GD2 antigen. Moreover, standard diagnostic procedures do not include the quantitative analysis of B7-H3, although high expression levels in primary tumors have been shown to represent a hallmark of worse prognosis in patients suffering from different kinds of tumors including NB.7 10
Thus, particularly in metastatic HR-NB, patients would benefit from novel diagnostic approaches capable of providing information about the expression levels of current (GD2) or innovative (B7-H3) targetable tumor antigens. The analysis would be helpful to predict the response to immunotherapy, patients’ prognosis, and to promptly detect changes in the tumor’s phenotype driven by the therapy and/or immune selection pressure.
To answer this diagnostic/prognostic need, we set up and validate in a cohort of patients with NB a specific and sensitive multiparametric flow cytometry (MFC) method able to unequivocally identify, quantify and characterize the NB surface phenotype, particularly in terms of GD2 and B7-H3 expression. MFC would be useful and informative in all patients, in association with the cytomorphology of aspirates and histochemistry of biopsies, the gold standards for the assessment of NB disease11 and, in particular, in children younger than 1 year in whom diagnostic approaches like BM trephine biopsies cannot be performed. The Kaplan-Meier analysis on 498 primary NB also identified novel interesting antigens with a prognostic value whose analysis could further implement the MFC panel.
Methods
Patients
The study was performed on 49 anonymized samples of BM aspirates (tables 1 and 2 and online supplemental table S1) derived from 33 patients with possible NB at onset (n=20), at relapse (n=11) or off-therapy (n=2). For the relapsing patient ID 4210, two different BM aspirates at different time from relapse were analyzed. Cases were enrolled at IRCCS Istituto G. Gaslini and Ospedale Pediatrico Bambino Gesù. All the samples had been collected by Biobanca IntegrataTessuto-genomica – BIT, Istituto IRCCS G. Gaslini, Genova, Italia. Histologic diagnosis had been made on tumor samples (surgical or core biopsies or surgical specimens from resection) paired to BM aspirates analyzed in this study (table 3 and online supplemental table S2). Histologic diagnosis was made according to the International Neuroblastoma Pathology Classification.12 Staging was established according to the International Neuroblastoma Staging System.13
Supplemental material
MFC analysis of BM aspirates: summary of the results
Summary of results obtained by optimizing MFC analysis
Cell isolation and NB enrichment
BM aspirate samples collected in EDTA were processed within 3 hours from their arrival. BM cell suspensions were obtained by Ficoll-Paque density gradient (Euroclone S.P.A., Italy). Samples derived from patients in online supplemental table S1 were represented by a pool of bilateral BM aspirates derived from right iliac crest (RIC) and left iliac crest (LIC), whereas samples derived from patients in tables 1 and 2 were represented by separate BM aspirates derived from RIC and/or LIC according to consensus criteria currently followed in analyzing NB infiltration in the BM and established by the International Neuroblastoma Response Criteria Bone Marrow Working Group (INRC BMWG).11 Enriched NB cells from PT#1–PT#8 were obtained by CD45 depletion using an Enrichment of Circulating Tumor Cells kit (RosetteSep, Stem-Cell Technologies, Vancouver, Canada).6
Flow cytometry analysis
For one-color flow cytometry analysis (FACSCalibur Becton Dickinson, Mountain View, California, USA), cells were stained with the appropriate mAbs (30min, 4°C), washed once with BD FACSflow (5% FCS) and stained with phycoerythrin (PE)-conjugated isotype-specific goat anti-mouse second reagent (Southern Biotechnology Associated, Birmingham, Alabama, USA) (30′, 4°C). On every experimental session, the flow cytometer performances were controlled, the reproducibility of the fluorescence intensity was aligned using calibrated microsphere (Becton Dickinson, Mountain View, California, USA) and isotype-matched PE-conjugated goat anti-mouse second reagent was used as controls.
For MFC analysis, BM-derived cells were incubated for 10′ with human FcR Blocking Reagent (Miltenyi Biotec, BergischGladbach, Germany) than washed once with serum-free RPMI 1640 medium and incubated with both fluorochrome-conjugated primary antibodies and Syto16 reagent (50 μL/sample of 0.5 μM) (30′, 4°C). Finally, samples were diluted in 500 μL of FACSflow (5% FCS) before acquisition (FACSVerse flow cytometer-BD). BD FACSuite CS&T Beads were daily used to control the cytometer performances.
CellQuestPro or the FacsSuite software (Becton Dickinson, Mountain View, California, USA) were used for analyzing one color or MFC acquisition files, respectively.
Kaplan-Meier analysis in patients with NB
Correlation between overall (OS) and event-free survival (EFS) probability of patients with NB and levels of mRNA expression of CD73, CD105, vimentin, MML5, ULBPs, PVR, B7-H6 and CD47 molecules was carried out using the gene expression profile of 498 NB specimens measured by the Illumina HiSeq 2000 RNAseq platform (GEO accession: GSE62564). Samples are relative to NB primary tumors collected at the time of diagnosis. Profiles and clinical data were retrieved from the R2: genomic analysis and visualization platform (http://r2.amc.nl). Expression cut-off values for selected genes were calculated by Kaplan-Meier scan method as previously reported. OS and EFS curves were plotted by the Kaplan-Meier method and were compared with the log-rank test. P values were corrected for multiple hypotheses testing by Bonferroni method.
Results
Setting up of the MFC gating strategy and preliminary analysis of the MFC panel’s performance
To set up and validate an MFC panel for the identification and phenotypic characterization of NB in the BM, we started analyzing BM aspirates from a small cohort of patients, either at the onset or relapse, most of which diagnosed with stage M (online supplemental table S1). In these preliminary experiments, samples were enriched in NB cells by immune-depletion of CD45-positive hematopoietic cells6 (. To establish the gating strategy, we considered physical parameters, Forward Scatter (FSC) and Side Scatter (SSC), and focused on the expression of the GD2 and B7-H3 NB-associated makers (online supplemental table S1 and figure S1).6 According to previously published data, in most patients, both at the onset and relapse, NB cells expressed good levels of both molecules. However, exceptions were detected. In particular, in a patient (PT#7), NB cells expressed very low surface levels of GD2 and high levels of B7-H3. Interestingly, PT#7 was a patient who relapsed with BM metastasis after being diagnosed, at the onset, with MYCN gain, localized disease. Conversely, in another patient (PT#4, stage M), metastasizing NB cells were characterized at the onset by a very low expression of B7-H3 and high levels of GD2. On the other hand, the CD56 (NCAM) molecule was expressed at similar levels in all patients, including PT#7 and PT#4 (see online supplemental material and methods for the list of mAbs used in this study).
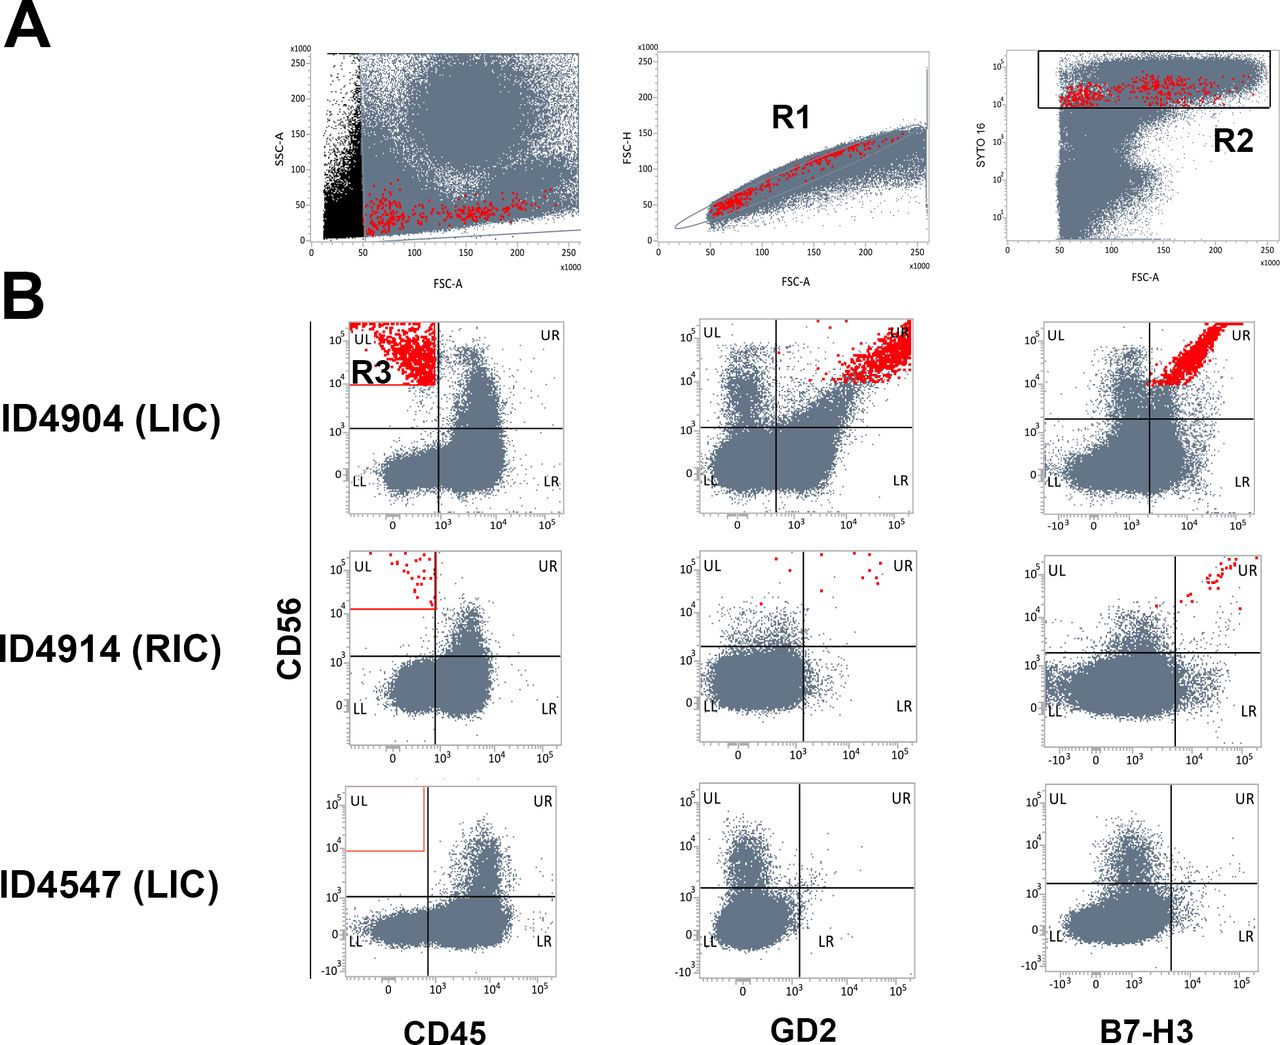
Because of these observations, we considered unsuitable an initial gating strategy based on the GD2 and B7-H3 positivity. Therefore, we analyzed BM aspirates from three additional patients (considering NB cell selection based on the FSC threshold, lack of CD45, and presence of CD56 molecule (figure 1 and table 1). By ating singlets, further selected for their positivity with the DNA Dye Syto16 reagent (staining nucleated events),we excluded cell aggregates. The analysis also excluded debris and not nucleated events, mainly represented by reticulocytes/red blood cells. We selected singlets Syto16pos cells (R1+R2) characterized by an FSC >50,000 (figure 1A), which were analyzed for the expression of CD45 and CD56 (R3 in figure 1B), GD2, and B7-H3 molecules. A CD45neg population expressing high levels of CD56 was identified in BM aspirates indicated as NB infiltrated by cytomorphological analysis (CA, online supplemental material and methods). Results from patients ID 4904 (left iliac crest-LIC) and ID 4914 (right iliac crest-RIC) (CA score 3+ and 1+, respectively) are shown in figure 1B. Importantly, the CD45neg CD56pos population coexpressed GD2 and B7-H3, thus matching the most conventional NB surface phenotype.6 It is of note that infiltrating NB cells showed a wide range of FSC values, indicating a marked tumor heterogeneity (figure 1A). In the patient ID 4547 (LIC), indicated as not infiltrated by CA, cells falling in the R3 gate (CD45neg CD56pos) and coexpressing GD2 and B7-H3 were virtually absent (1 cell detected out of 374,494 cells analyzed) (figure 1B and table 1).

Identification of neuroblastoma (NB) cells in bone marrow (BM) aspirates: multiparametric flow cytometry (MFC) gating strategy. (A) Singlets (R1) with forward side scatter (FSC) >50,000 and positivity to Syto16 (R2) were gated excluding debris, aggregates, and non-nucleated cells. A representative NB-infiltrated BM aspirate (ID 4904) is shown. (B) CD45neg CD56pos cells (R3) were analyzed for GD2 and B7-H3 expression. Three representative BM aspirates are shown. ID 4904 (left iliac crest (LIC), cytomorphological analysis (CA) score 3+), ID 4914 (right iliac crest (RIC), CA score 1.5+), and ID 4547 (LIC, CA non-infiltrated). NB cells are highlighted in red.
To consolidate the performance of the MFC panel in terms of specificity and sensitivity, 14 additional BM aspirates (including those derived from the opposite iliac crest of patient ID 4914 and ID 4547, table 1) were analyzed applying the set-up gating strategy described above. In the case of samples considered infiltrated by CA, CD45neg CD56pos cells coexpressing GD2 and B7-H3 were unequivocally detected with percentages ranging from 6.515205 to 0.012612 and CD56 mean fluorescence intensity (MFI) ≥46,177 (see patients ID 4904 LIC, ID 4914 RIC and ID 4930 LIC and RIC in table 1). The count number of cells identified ranged from a maximum of 3710 cells in RIC of patient ID 4930 (CA score 2.5+), with 89,128 total events acquired, to a minimum of 28 cells in RIC of patient ID 4914 (CA score 1.5+), with 222,000 total events acquired. CD45neg CD56pos cells were undetectable in two samples, LIC of patient ID4908 (CA score 1+), whose RIC was considered not infiltrated by CA, and LIC of patient ID 4914 considered by CA with uncertain infiltration (1 cluster/3 smear).
We also analyzed samples indicated as non-infiltrated by the CA and, in some cases, even by immunohistochemistry (IHC) (online supplemental material and methods) (table 1). In all samples, MFC analysis did not detect CD45neg CD56pos populations. In particular, in 11 out of 11 samples analyzed, the cell number ranged only from 0 to 3, with a percentage ranging from 0 to 0.00075 when more than 400,000 events were acquired. Importantly, the rare CD45neg CD56pos cells detected in these patients did not express GD2 while being positive for B7-H3. Thus, if considering the possible NB infiltration in the BM as positive/negative based on the presence/absence of CD45neg CD56pos cells with the more conventional GD2pos, B7-H3pos phenotype, in 15 out of 17 samples analyzed the MFC results matched the CA and/or IHC analyses. Overall, these preliminary data suggested a good specificity of the MFC method, although with a sensitivity possibly lower than optimal.
Optimization of the MFC panel points out its high specificity and sensitivity
The preliminary validation of the MFC panel above was performed acquiring different numbers of total events depending on the sample size, up to a maximum of 400,000 (table 1). To better evaluate the specificity and sensitivity of our method, we analyzed additional 24 BM aspirates from 15 patients, suspected of being affected by NB, acquiring a high and defined number of events equal to 106/sample (table 2). Again, despite the high number of acquired events, CD45neg CD56pos GD2pos cells were never detected in samples evaluated as negative by CA. The very rare (up to 3 cells) CD45neg CD56pos B7-H3pos cells detected lacked GD2 expression (table 2). Only in one sample (ID 4790 RIC), these cells were well represented (81 cells) (table 2 and figure 2, upper panel) and were characterized by MFI values of CD56 (17,339) and B7-H3 (118,179) much lower and higher, respectively, than those observed in classical NB cells (tables 1 and 2). To understand the nature of this unusual cell population, we expanded its phenotypic characterization. As shown in figure 2 (lower panel), these cells expressed high levels of HLA class I (HLA-I) and CD73 molecules, suggesting their possible belonging to the mesenchymal lineage.14 With this single exception requiring additional investigation, the MFC optimized analysis confirmed the high specificity of the method with 100% matching results between MFC and CA in samples indicated non-infiltrated by CA. In 11 out of 12 (91.6%) samples indicated infiltrated by CA, we confirmed the presence of CD45neg CD56pos GD2pos B7-H3pos populations (table 2 and representative patients in figure 3A). However, despite the high number of cells acquired, in one sample indicated infiltrated by CA (ID 4937 RIC, score 1.5+), again, CD45neg CD56pos GD2pos B7-H3pos cells were undetectable (table 2 and figure 3B).

Optimization of the multiparametric flow cytometry (MFC) analysis. Bone marrow (BM) aspirates were analyzed by MFC applying the gating strategy described in figure 1 and acquiring 106 events/sample. MFC of BM aspirate of patient ID 4790 (RIC) indicated as non-infiltrated by CA. CD45neg CD56pos GD2neg B7-H3pos cells (highlighted in black) were analyzed for the expression of the indicated molecules. In the lower panel, light gray profiles refer to cells incubated with isotype-matched controls. Values refer to mean fluorescence intensity (MFI) and were calculated by subtracting MFI of isotype-matched controls.
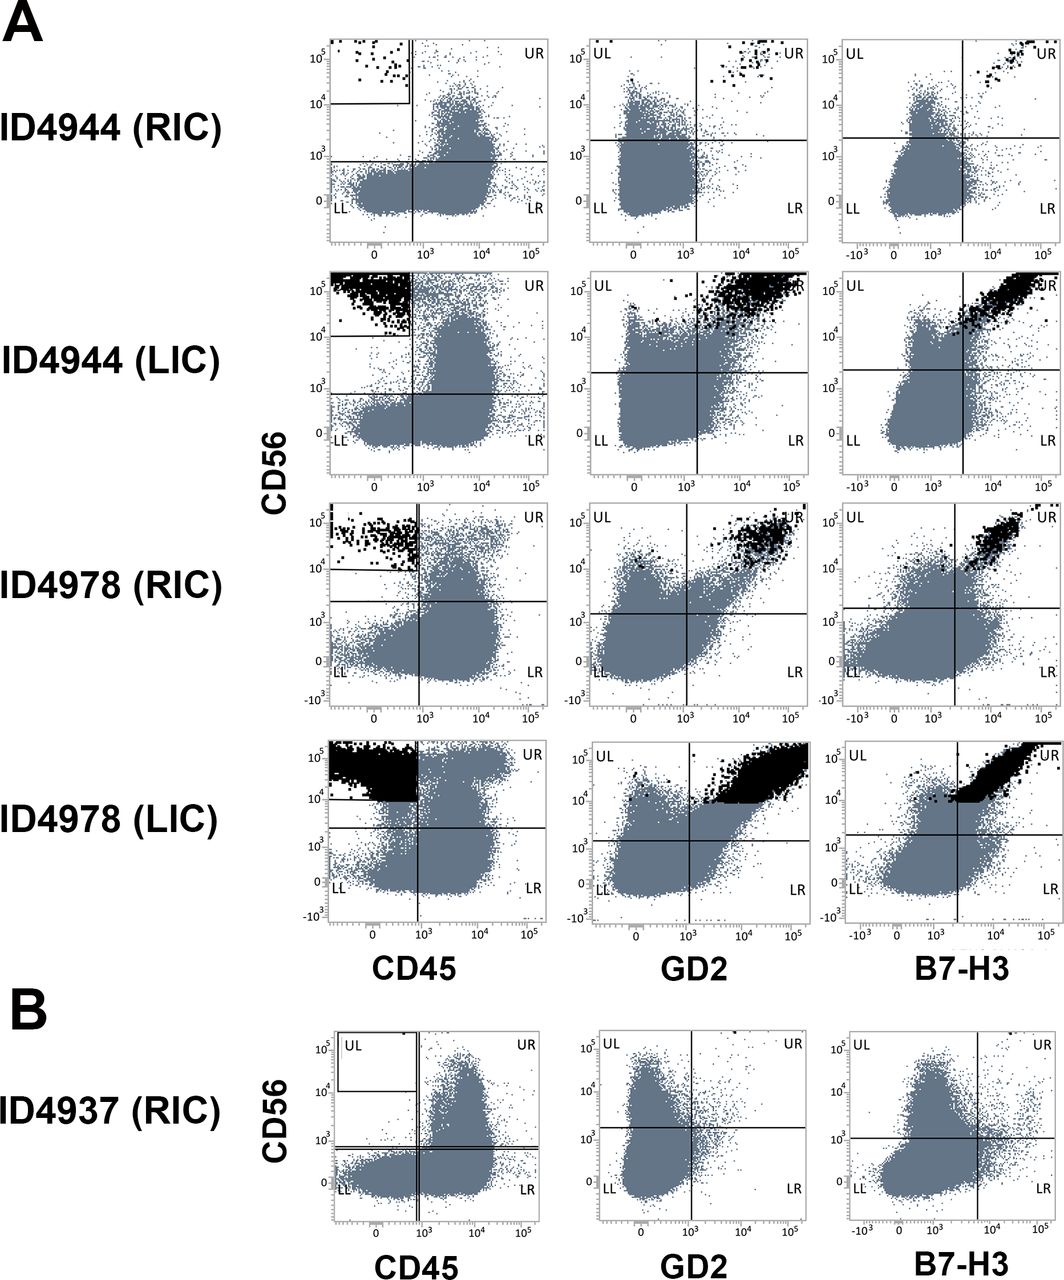
Optimization of the multiparametric flow cytometry (MFC) analysis. Optimized MFC analysis of five bone marrow aspirates from three representative patients (ID 4944, ID 4978 and ID 4937), indicated infiltrated by CA. Panels (A) and (B) show matching and unmatching results, respectively.
Summary of biological and clinical information of patients characterized by GD2neg/low NB variants
We further investigated the sensitivity threshold of the MFC method analyzing samples containing a defined and known number of tumor cells. To this end, we performed spike-in experiments using the HTLA-230 NB cell line (online supplemental material and methods). Different numbers of HTLA-230 cells (ranging from 2 to 2000 cells) were mixed with 2×10⁶ peripheral blood mononuclear cells (PBMCs) from healthy donors, creating tumor cell dilutions ranging from 1/106 to 1/103. Each sample was analyzed using the gating strategy described above, although the FSC value required an adjustment due to the bigger size of the NB cell line as compared with ex-vivo derived NB cells. Results from two independent experiments are shown in online supplemental table S3 and figure S2. The acquisition of samples containing known numbers of HTLA-230 cells provided us with the minimum number of cells detectable for each dilution. HTLA-230 were still detectable at 10 cells in 2×10⁶ PBMC, with numbers similar to that detected with the cell line alone. This indicates a high sensitivity of the method, which is capable of detecting a percentage of NB as low as 0.0005%.
MFC detection of GD2neg/low NB variants expressing B7-H3 molecule
As described above, in most samples (7 of 12) indicated as infiltrated by CA (score ≥1.5), we detected CD45neg CD56pos populations that expressed high levels of GD2 and B7-H3 antigens (ID 4944 RIC and LIC; ID4978 RIC and LIC; ID5013 LIC; ID5018 RIC; ID4210 RIC) (table 2 and representative analysis in figure 3A), with cell numbers ranging from 38 to more than 70,000. On the contrary, in two patients (ID 3372 and ID 4701), high numbers of CD45neg CD56pos cells were detected that were characterized by the GD2neg/low phenotype (figure 4A,B, respectively, upper panels). Importantly, these cells expressed high levels of B7-H3 (MFI >10,000) and low or null levels of HLA- I molecules (MFI <600) (figure 4A,B, lower panels), hallmarks of NB tumor cells. These cells also lacked CD73 and CD13, molecules commonly associated with the mesenchymal lineage,15 thus confirming the tumor nature of this unconventional GD2neg/low population. Looking at the clinical parameters, both patients were affected by HR-NBs. ID 4701 was diagnosed at the age of 139 months and relapsed 30 months from the onset of the disease. ID 3372 was diagnosed at the age of 53 months, and relapsed at the age of 194 months (table 3). The recurrent tumor of ID 3372 was a humeral bone metastasis with less differentiated morphology, CD56, synaptophysin, and TH positivity, while chromogranin and Phox-2B turned out to be negative. A wider panel of markers was analyzed (including vimentin, cytokeratins, CD99, WT1, LCA) to exclude its belonging to other small round cell tumors.
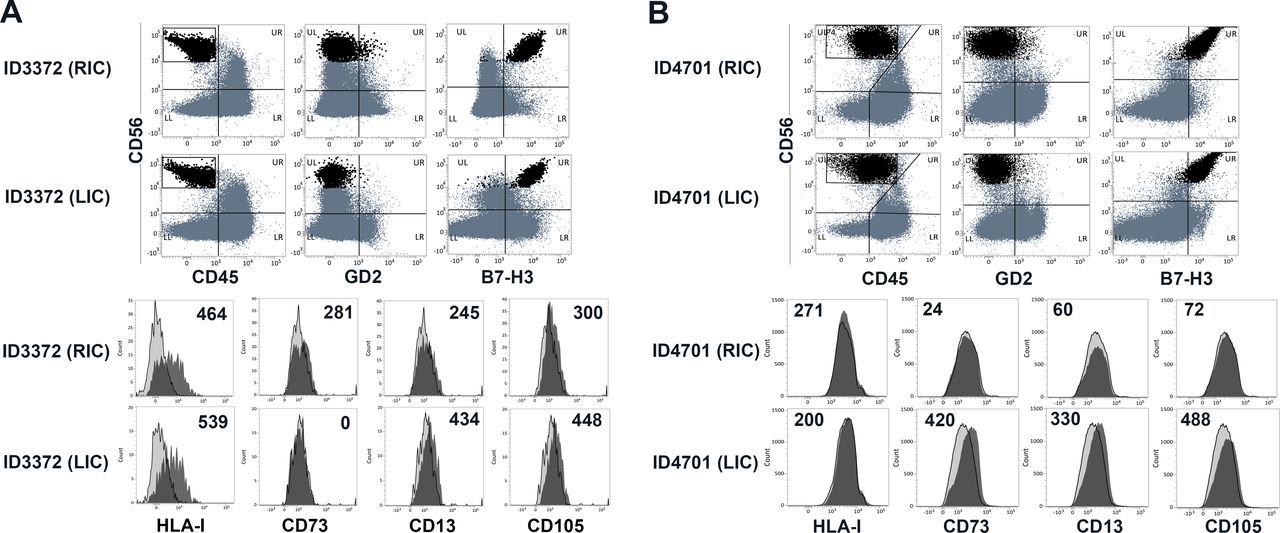
Identification of GD2neg/GD2low neuroblastoma (NB) cell populations in relapsing patients expressing B7-H3 molecules. Bone marrow aspirates of patient ID 3372 (RIC (CA score 2.5+) and LIC (CA score 1.5+) (A), and patient ID 4701 RIC (CA score 3.5+) and LIC (CA score 1.5+) (B) were analyzed by optimized multiparametric flow cytometry (MFC). CD45neg CD56pos GD2neg B7-H3pos cells (highlighted in black) were analyzed for additional molecules, indicated in the lower panels. In the lower panels, light gray profiles refer to cells incubated with isotype-matched controls. Values refer to mean fluorescence intensity (MFI) and were calculated by subtracting MFI of isotype-matched controls.
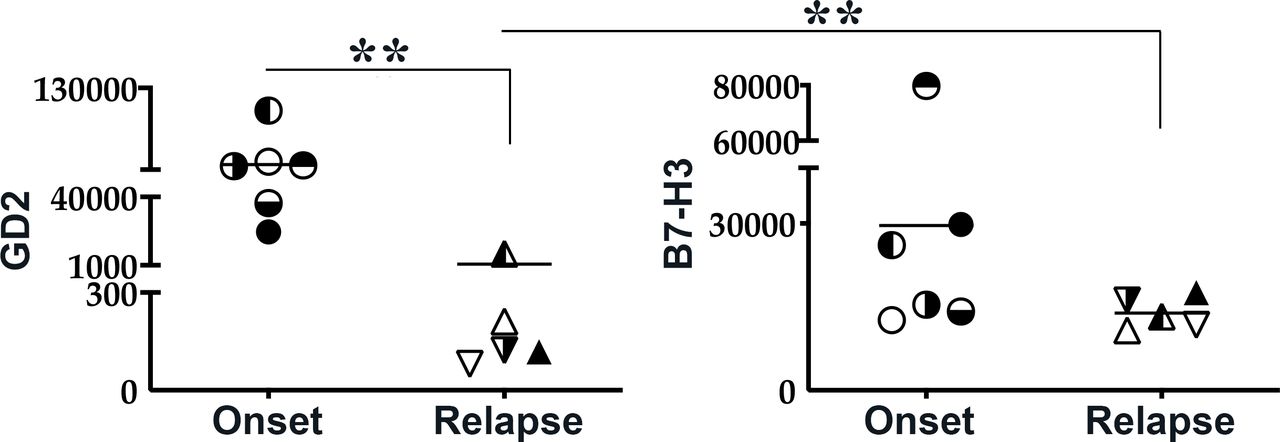
Unconventional GD2neg/low tumor variants derived from patients at relapse. Moreover, plotting MFI of GD2 and B7-H3 molecules of all NB populations analyzed by MFC showed that relapsing tumors have significantly lower expression of GD2 as compared with tumors derived from patients at the onset (figure 5). On the contrary, no significant differences in terms of B7-H3 expression were observed, suggesting that B7-H3 might represent an optimal diagnostic marker and an additional/alternative targetable molecule, particularly in relapsing patients.

In relapsing patients, GD2 but not B7-H3 shows a significant reduction in its mean fluorescence intensity (MFI) as compared with neuroblastoma (NB) derived from patients at the onset. MFI of GD2 or B7-H3 expression on NB derived from patients at the onset or at relapse. Each symbol represents MFI of the two molecules in a single patient. Median value is shown. **p<0.005.
Kaplan-Meier analysis in patients with NB guides the implementation of the MFC panel
An exclusive advantage of MFC is the possibility to easily update the mAbs panel according to the rapidly growing amount of interesting tumor markers. To guide the selection of promising diagnostic/therapeutic targets, we performed the Kaplan-Meier scan analysis on 498 human NB primary specimens and evaluated the prognostic role of different NB-associated molecules. These included PVR (CD155)16 17 and B7-H6,18 19 ligands of DNAM-1 and NKp30 activating receptors, respectively, which are crucial for the NK-mediated killing of metastasizing NB cells. Also, the expression of MML5, a ligand of NKp44, ULBP2 and ULBP3, ligands of NKG2D20 21 as well as CD47, a ‘don’t eat me’ molecule, were considered (figures 6 and 7).22 23

Kaplan-Meier curves for overall (OS) and event-free survival (EFS) of patients with neuroblastoma (NB) stratified by MML5 or ULBPs expression. Kaplan-Meier plots for OS and EFS of a population of 498 patients with NB (Y-axis) in a specified time interval expressed in years (X-axis). Patients were stratified according to activating receptors ligands MML5, ULBP2 and ULBP3. Cut-off for high or low marker expression was chosen by Kaplan-Meier scan method and is reported on top of each plot. The number of patients with high or low marker expression is displayed on top of each curve. Survival curves relative to high or low marker expression are colored in blue or red respectively. The black symbol on a survival curve indicates that a patient was lost at follow-up time. Significance of the differences between the two survival curves was assessed by log-rank test. P values were corrected for multiple hypotheses testing by Bonferroni method and displayed at the bottom right part of each plot (Bonf p). Corrected p values lower than 0.05 were considered statistically significant.

Kaplan-Meier curves for overall (OS) and event-free survival (EFS) of patients with neuroblastoma (NB) stratified by PVR, B7-H6 or CD47 expression. Kaplan-Meier plots for OS and EFS of a population of 498 patients with NB (Y-axis) in a specified time interval expressed in years (X-axis). Patients were stratified according to PVR, B7-H6 or CD47 gene expression. Cut-off for high or low marker expression was chosen by Kaplan-Meier scan method and is reported on top of each plot. The number of patients with high or low marker expression is displayed on top of each curve. Survival curves relative to high or low marker expression are colored in blue or red respectively. The black symbol on a survival curve indicates that a patient was lost at follow-up time. Significance of the differences between the two survival curves was assessed by log-rank test. P values were corrected for multiple hypotheses testing by Bonferroni method and displayed at the bottom right part of each plot (Bonf p). Corrected p values lower than 0.05 were considered statistically significant.
The analysis showed a clear dichotomy regarding the prognostic role of the ligands analyzed. As expected, high expression of MML5 and ULBPs significantly correlates with better Overall Survival (OS) and Event-Free Survival (EFS) (figure 6). Unexpectedly, however, high PVR and B7-H6 expressions, as well as low expression of CD47, were associated with worse EFS and OS (figure 7). A possible explanation could rely on the complex nature of these ligands, which have different, and sometimes opposite, roles in tumor-cell biology. For example, PVR and B7-H6 have been described to promote invasiveness and epithelial-mesenchymal transition (EMT)24 25 in glioma and breast cancer, and PVR is also expressed by tumor-associated endothelium.26 Importantly, PVR also represents the ligand of TIGIT, an inhibitory receptor expressed by T and NK cells.27 Thus, both the tumor-promoting roles of PVR and its interaction with TIGIT might overcome the benefit derived from its recognition by the DNAM-1 activating receptor, thus justifying the negative prognostic value of the high PVR expression. It cannot be excluded that the opposite prognostic significance of these ligands, MML5 and ULBPs versus PVR, B7-H6 and CD47 could be associated with different stages of NB development. For example, high PVR and B7-H6 expression could identify a more aggressive, undifferentiated NB, while CD47 could identify a less aggressive, more differentiated tumor.28
Discussion
Most HR-NB patients presenting with BM metastases at diagnosis or relapse have an unfavorable prognosis, despite the application of very aggressive multimodal therapies. The reasons for resistance to therapy are far to be elucidated. The standard treatment includes a maintenance phase characterized by autologous stem cell transplantation followed by anti-GD2 immunotherapy.1–4 Although highly expressed by most NBs, GD2 is missed or expressed at very low levels in a relevant proportion of patients.5 None of the criteria used so far for monitoring the response to immunotherapy includes the evaluation of GD2 surface intensity. This is quite surprising if considering that the presence and surface density of targeted molecules are key factors to unleash efficient antibody-dependent cytotoxicity mediated by FcγRpos effectors such as NK cells.
Our study, describing a novel MFC approach, has, at first, the intent to provide a new tool to improving diagnosis and prognosis in HR-NB patients, also filling the gap of quantification of GD2 surface expression in BM metastasis. Indeed, our method, focusing on the initial selection of CD45neg CD56pos cells, allows the identification of both GD2positive and GD2negative variants. Importantly, our gating strategy takes advantage of the selection of nucleated cells, allowing also the inclusion of events characterized by low FSC, thus considering the great size variability of NB cells.29 Indeed, CD45neg CD56pos GD2pos B7-H3pos cells show a very wide distribution in terms of FSC values (see NB cells highlighted in red in figure 1A). The method is highly specific, lacks false-positive results, and did not detect tumor cells in 100% of samples (n=23) considered as negative by cytomorphological analysis (CA) and/or immunohistochemistry (IHC) (tables 1 and 2). When optimizing the MFC method, acquiring a highly defined number of events (106), we detect NB cell populations in virtually all BM aspirates indicated as infiltrated by CA. The analysis shows a single discordant result (ID4937 in table 2). This hardly correlates with a low sensitivity of the method, which is capable of identifying 10 NB cells in 2×10⁶ hematopoietic cells. A possible explanation could be the random absence of NB cells in the single sample volume used for flow cytometry, a risk that can be reduced by performing triplicates for each analysis. An additional possibility could be the loss of tumor cells during the isolation and staining procedures. In our experiments, BM aspirates were analyzed upon cell isolation by Ficoll-Paque density gradient. Moreover, as suggested by spike-in experiments, the cell numbers detected during flow cytometry acquisition were generally lower than those expected, considering the number of NB cells added to PBMC at the beginning of the staining procedure. Thus, further optimization is required that will include the application of the MFC method to whole BM aspirates, upon lysis of red blood cells, and eventually, the future automatization of the procedure.
The high specificity and sensitivity of our MFC suggest that it might represent a more performing diagnostic tool than the CA, which is routinely used to detect BM infiltration. Indeed, CA has a documented low sensitivity, being unable to detect a tumor burden <0.1%,30 and is extremely dependent on the operator’s experience, who has to deal with the great cellular heterogeneity of samples also containing huge numbers of large hematopoietic precursors. Along this line, other groups have documented that, in case of discrepancy between CA and flow cytometry, immunocytochemistry (IC)/immunohistochemistry (IHC) analysis evaluating GD2, CD56, chromogranin, and synaptophysin expression confirmed CA positivity only in 25% of cases.30 In the rare cases of samples resulting positive at CA and negative at MFC, it should be recommended to deepen the analysis by performing IC/IHC and/or highly sensitive quantitative PCR (qPCR) analysis (PHOX2B and TH).11 31
Multiple approaches could be useful also to clarify the tumorous nature of the CD45neg CD56pos GD2neg B7-H3pos population, which was well detectable in the BM of 1 out of 33 patients analyzed and expressed several MSC markers. The patient (ID 4790) presented with a stage L1 disease and BM indicated as negative by CA. It is of note that most surface markers associated with the MSC lineage14 15 can be also expressed by NB cells, as indicated by the analysis of prototypical NB cell lines (online supplemental figure S3). HLA-I expression may be more informative since metastasizing NB cells generally lack these molecules.6 32 NB metastases characterized by low HLA-I expression may exist, as shown in patient 7 (online supplemental figure S1) and patient ID 3372 (figure 4A), but, to our knowledge, high HLA-I expression has never been detected. Hence, the high HLA-I expression characterizing the cell population detected in patient ID 4790 would support their belonging to MSCs. However, it could not be neglected that the HLA-I expression may change during the disease course. In this context, combined diagnostic approaches including MFC should be useful also for the accurate, longitudinal characterization of metastases in relapsing patients, which might upregulate HLA-I under the stimulation of interferon-γ (IFN-γ) and/or tumor necrosis factor-α (TNFα)33–35 released by the immune effectors, particularly when engaged by the immunotherapeutic anti-GD2 antibody. The MSC-like cells detectable in BM aspirates of relapsed patients should be deeply characterized and monitored, taking also into consideration that relapsing NB harbor mutations involved in the EMT.36 Along this line, the Kaplan-Meier scan analysis was also performed stratifying patients for mRNA expression of CD73 and CD105, the MSC-associated molecules analyzed on ID 4790, ID 3372 and ID4701, and vimentin (online supplemental figure S4). High vimentin mRNA expression was associated with worse OS and EFS probability, whereas high CD73 and CD105 mRNA expression correlated with a better prognosis. Other studies on primary tumors, however, showed a negative impact for CD105pos cells in NB,37 38 and opposite prognostic values for CD73 were detected, depending on the cancer type analyzed.39 It is conceivable that the MFC method might give an important contribution clarifying the prognostic role of CD73, CD105, and other MSC-associated molecules in metastatic NB, being capable of providing data at the protein level, selectively gating on tumor cells and excluding cells of the tumor microenvironment that contributed to the whole transcriptome present in the Illumina HiSeq 2000 RNAseq platform. Future MFC analysis will also be implemented with the analysis of additional promising prognostic markers and/or immunotherapeutic targets emerged in our studies such as PVR, whose inhibitory receptor TIGIT is currently targeted in several ongoing preclinical and clinical studies in different tumor histotype.40
Combined methodological approaches might solve diagnostic doubts. In particular, our MFC shows advantages compared with CA and qPCR since it can provide more precise characterization and quantification of tumor burden, which might have a prognostic impact even stronger than qPCR.41 In this context, we will prospectively correlate our results, in terms of the detected number of cells in BM aspirates, with EFS and OS. Future studies will also stratify patients for GD2 surface densities (MFI). Indeed, another exclusive advantage of the MFC approach is to provide precise quantification of GD2 surface expression, not measurable by qPCR or IHC analysis due to the lipid nature of this molecule, which also hampers the retrospective analysis of stored paraffin-embedded tissues. MFC may be useful to define a minimum MFI threshold requirement to respond to anti-GD2 immunotherapy. In vitro studies can help to define this threshold by performing experiments testing the anti-GD2-dependent cellular cytotoxicity mediated by FcγR+ immune cells and using as targets NB cells expressing different surface levels of GD2. The efficacy threshold needs to be further validated by performing the MFC analysis in a wide cohort of patients and correlating EFS and OS with GD2 surface expression/density. It will also be relevant to extend the quantifications of GD2 surface density to tumor lesions localized at sites different from BM.
Importantly, as compared with the previously published MFC panels, our MFC method has the peculiar property of evaluating MFI of B7-H3, another important prognostic marker and targetable molecule.6 42 43 This is highly relevant since patients with GD2neg/low NB variants might not benefit from anti-GD2 immunotherapy while having heavy side effects. It is the case of patients ID 3372 and ID 4701 identified in our study. These patients might benefit from targeting other immunotherapeutic molecules including B7-H3 that was expressed at high levels by the GD2neg/low NB variants (figure 4, tables 2and and 3). B7-H3 may represent an optimal target for approaches of immunotherapy in different tumors including NB44–47. After promising preclinical studies, B7-H3 is targeted by antibodies or Chimeric Antigen Receptor (CAR)-engineered T cells in several ongoing clinical trials. B7-H3 is an immune checkpoint ligand inhibiting both innate and adaptive immunity, has a prognostic value, a consolidated role in tumor progression, and is highly expressed by NB cells and tumor vessels. Interestingly, B7-H3 is not expressed by lymphoblastic lymphomas and the blastemal component of Wilms’ tumors,10 also representing a useful tool for the differential diagnosis of small round cell tumors. Providing information about the surface expression of alternative targets may be fundamental in the case of GD2 with MFI below the therapeutic response cut-off and in relapsed patients who have already experienced anti-GD2 therapies. In these patients, the B7-H3 surface expression could be even increased since it is upregulated by IFN-γ.34 In the perspective of B7-H3-based immunotherapy, it is relevant to point out that B7-H3 shows low or null protein surface expression in most normal tissues.48 An exception is represented by the MSC compartment. However, co-targeting of NB and MSC might increase the effectiveness of B7-H3-based immunotherapeutic approaches. Indeed, it has been shown in preclinical models that the elimination of CD105+ cells in the tumor microenvironment significantly improved the efficacy of therapeutic anti-GD2 mAb.38
To conclude, the MFC method described here is capable of providing in a few hours a specific and sensitive evaluation of metastatic burden, surface expression of standard, and novel immunotherapeutic targets. Combined with other routinely used analysis, it might be applied in large multicenter prospective studies for diagnostic/prognostic purposes and for orienting novel personalized therapeutic approaches in children with NB who cannot benefit from current standard therapies (online supplemental file 2).
Supplemental material
Data availability statement
All data relevant to the study are included in the article or uploaded as supplementary information. NA.
Ethics statements
Ethics approval
The investigation was performed after approval by the ethical committee (number 004-28/05/2018). Committee and the procedures were in accordance with the Declaration of Helsinki 1975.
Acknowledgments
We thank all patients and their families, the BIT-Gaslini Biobank, IRCCS Istituto Giannina Gaslini (Largo G. Gaslini, 5, Genova, Italy) for providing us with specimens. We also thank Dr A Kunkl (Ospedale Policlinico San Martino IRCCS, Genova, Italy) for the fruitful discussion. MM was the recipient of a fellowship awarded by Associazione Italiana per la Lotta al Neuroblastoma O.N.L.U.S.
References
Supplementary materials
Supplementary Data
This web only file has been produced by the BMJ Publishing Group from an electronic file supplied by the author(s) and has not been edited for content.
Footnotes
Twitter @RCastriconi
Contributors Conceptualization: CB, RC and AD. Data curation and formal analysis: RC, AD, DC, GR and ARS. Investigation, AD, FS and ARS. Methodology: AD, DC, GR, FS and ARS. Resources: MM, KM, MS, GMS, AT, FL, AC, AE, MC and AG. Writing—original draft: RC, CB and ARS. Writing—review and editing: FL, ARS, AE, MC, AG, CB, RC and AD.
Funding The authors have not declared a specific grant for this research from any funding agency in the public, commercial or not-for-profit sectors.
Competing interests CB and RC are coinventors of the patent: 'Therapeutic and diagnostic methods and compositions targeting 4IgB7H3 and its counterpart NK cell receptor' (Application number 11186925.1 e 05775603.3).
Provenance and peer review Not commissioned; externally peer reviewed.
Supplemental material This content has been supplied by the author(s). It has not been vetted by BMJ Publishing Group Limited (BMJ) and may not have been peer-reviewed. Any opinions or recommendations discussed are solely those of the author(s) and are not endorsed by BMJ. BMJ disclaims all liability and responsibility arising from any reliance placed on the content. Where the content includes any translated material, BMJ does not warrant the accuracy and reliability of the translations (including but not limited to local regulations, clinical guidelines, terminology, drug names and drug dosages), and is not responsible for any error and/or omissions arising from translation and adaptation or otherwise.