Article Text

Abstract
Background The immune suppressive tumor microenvironment (TME) that inhibits T cell infiltration, survival, and antitumor activity has posed a major challenge for developing effective immunotherapies for solid tumors. Chimeric antigen receptor (CAR)-engineered T cell therapy has shown unprecedented clinical response in treating patients with hematological malignancies, and intense investigation is underway to achieve similar responses with solid tumors. Immunologically cold tumors, including prostate cancers, are often infiltrated with abundant tumor-associated macrophages (TAMs), and infiltration of CD163+ M2 macrophages correlates with tumor progression and poor responses to immunotherapy. However, the impact of TAMs on CAR T cell activity alone and in combination with TME immunomodulators is unclear.
Methods To model this in vitro, we utilized a novel co-culture system with tumor cells, CAR T cells, and polarized M1 or M2 macrophages from CD14+ peripheral blood mononuclear cells collected from healthy human donors. Tumor cell killing, T cell activation and proliferation, and macrophage phenotypes were evaluated by flow cytometry, cytokine production, RNA sequencing, and functional blockade of signaling pathways using antibodies and small molecule inhibitors. We also evaluated the TME in humanized mice following CAR T cell therapy for validation of our in vitro findings.
Results We observed inhibition of CAR T cell activity with the presence of M2 macrophages, but not M1 macrophages, coinciding with a robust induction of programmed death ligand-1 (PD-L1) in M2 macrophages. We observed similar PD-L1 expression in TAMs following CAR T cell therapy in the TME of humanized mice. PD-L1, but not programmed cell death protein-1, blockade in combination with CAR T cell therapy altered phenotypes to more M1-like subsets and led to loss of CD163+ M2 macrophages via interferon-γ signaling, resulting in improved antitumor activity of CAR T cells.
Conclusion This study reveals an alternative mechanism by which the combination of CAR T cells and immune checkpoint blockade modulates the immune landscape of solid tumors to enhance therapeutic efficacy of CAR T cells.
- tumor microenvironment
- immunotherapy, adoptive
- macrophages
Data availability statement
Data are available upon reasonable request. All data relevant to the study are included in the article or uploaded as supplementary information.
This is an open access article distributed in accordance with the Creative Commons Attribution Non Commercial (CC BY-NC 4.0) license, which permits others to distribute, remix, adapt, build upon this work non-commercially, and license their derivative works on different terms, provided the original work is properly cited, appropriate credit is given, any changes made indicated, and the use is non-commercial. See http://creativecommons.org/licenses/by-nc/4.0/.
Statistics from Altmetric.com
What is already known on this topic
Chimeric antigen receptor (CAR) T cell therapy induces programmed death ligand-1 (PD-L1) expression in tumors, which may limit their therapeutic activity. Combining anti-programmed cell death protein-1 or anti-PD-L1 immune checkpoint blockade with CAR T cell therapy may reinvigorate antitumor activity of CAR T cells in both hematologic and solid tumor malignancies. The role of macrophage PD-L1 expression in CAR T cell therapy, and the impact of PD-L1 blockade on macrophage-induced immunosuppression in combination with CAR T cells, remain to be investigated.
What this study adds
Our study demonstrates that combining PD-L1 blockade and CAR T cells alters the tumor microenvironment by directly inhibiting M2 macrophage-induced immunosuppression and their survival, providing an alternative mechanism of action of immune checkpoint blockade in combination with CAR T cells.
How this study might affect research, practice or policy
This study provides a rationale for combining PD-L1 blockade and CAR T cell therapy to treat macrophage-rich tumors.
Introduction
Adoptive transfer of chimeric antigen receptor (CAR)-engineered T cells has demonstrated robust and durable clinical efficacy in patients with B-cell malignancies,1–3 but to date has shown underwhelming response rates in patients with solid tumors.4 5 This clinical observation is in large part attributed to the immune-suppressive tumor microenvironment (TME) of solid tumors, comprising infiltrating myeloid cells and regulatory T cells that inhibit endogenous antitumor immunity and adoptively transferred cell therapies. Overcoming this challenge will be critical to unleashing the full potential for CAR T cell therapies for solid tumors, and likely will require disease-specific and context-specific considerations.
Tumor-associated macrophages (TAMs) are the most abundant immune cells in many solid tumors, and TAM infiltration strongly correlates with tumor progression and poor prognosis in various solid tumors6–10 and lymphoma.11 While macrophages retain phenotypic and functional plasticity, the majority of TAMs are immune suppressive, M2-like macrophages with complex pro-tumor functions. TAMs secrete various cytokines and growth factors including interleukin (IL)-10, transforming growth factor-beta (TGF-β), vascular endothelial growth factor (VEGF), and C-X-C motif ligand (CXCL) 12 to drive cancer progression through immune suppression, tumor angiogenesis, invasion and metastasis.12–14 TAMs also play critical roles in response and resistance to common cancer therapies such as chemotherapy, radiation therapy,15 angiogenesis16 and hormone deprivation therapy,17 and numerous macrophage-modulating approaches have shown improved therapeutic efficacy in preclinical studies.12 18–21
Preclinical studies also demonstrated that TAMs mediate resistance to immune checkpoint blockade (ICB),22–24 and targeting TAMs likely alters outcomes of clinical interventions.25 Programmed cell death protein-1 (PD-1) and programmed death ligand-1 (PD-L1) are expressed in various immune cells including T cells,26 natural killer (NK) cells27 and macrophages.28 Tumor PD-L1 expression does not accurately predict clinical response to anti-PD-L1 therapy, and more recent studies indicate that PD-L1 expressed by immune cells may contribute to immune suppression.27–29 Macrophage PD-L1 is particularly abundant in the TME, but the role of PD-L1 signaling in macrophages and the direct impact of anti-PD-L1 blockade on macrophages remain controversial.28–30 Recent studies have shown that CAR T cells, especially in combination with other therapeutic agents, modulate myeloid cell phenotypes and alter the immune-suppressive TME.31–33 ICB has been utilized in combination with CAR T cell therapy, with the notion that induction of immune responses with CAR T cells may instigate checkpoint pathways in immunologically cold tumors as a compensatory resistance mechanism, providing rationale for the therapeutic combination. Despite a clinical need for overcoming immune suppression to improve CAR T cell therapies for solid tumors, preclinical models of this phenomenon are complicated and remain limited in their predictive capabilities.
In this study, we aimed to develop an in vitro model to recapitulate the suppression of CAR T cells in the TME with abundant immune-suppressive macrophages. In this model system, target tumor cells and CAR T cells were co-cultured in the presence of M1-polarized or M2-polarized macrophages to evaluate their respective roles in CAR T cell functionality. We showed that M1 macrophages promote, while M2 macrophages suppress, CAR T cell-mediated tumor cell killing and cytokine production. We also observed CAR T cell-regulated PD-L1 induction in both tumor cells and macrophages in vitro, with induction levels found to be most dramatic in M2 macrophages. We confirmed CAR T cell-regulated PD-L1 induction in TAMs using an in vivo humanized mouse model of prostate cancer. By blocking PD-L1 with atezolizumab or avelumab, we found that inhibiting macrophage PD-L1 was sufficient to restore CAR T cell-mediated tumor killing. However, this restoration of CAR T cell killing by blockade of PD-L1 appeared independent of canonical PD-1/PD-L1 signaling, as the phenomenon was not seen with blockade of PD-1 with nivolumab. Instead, PD-L1 inhibition specifically and potently depleted M2 macrophages in the presence of CAR T cells. These findings give mechanistic insights by which CAR T cell and ICB combination therapies enhance antitumor immunity in an immune-suppressive TME and is a useful model to study macrophage-mediated immune suppression.
Results
Human monocyte-derived M2 macrophages suppress CAR T cells in vitro
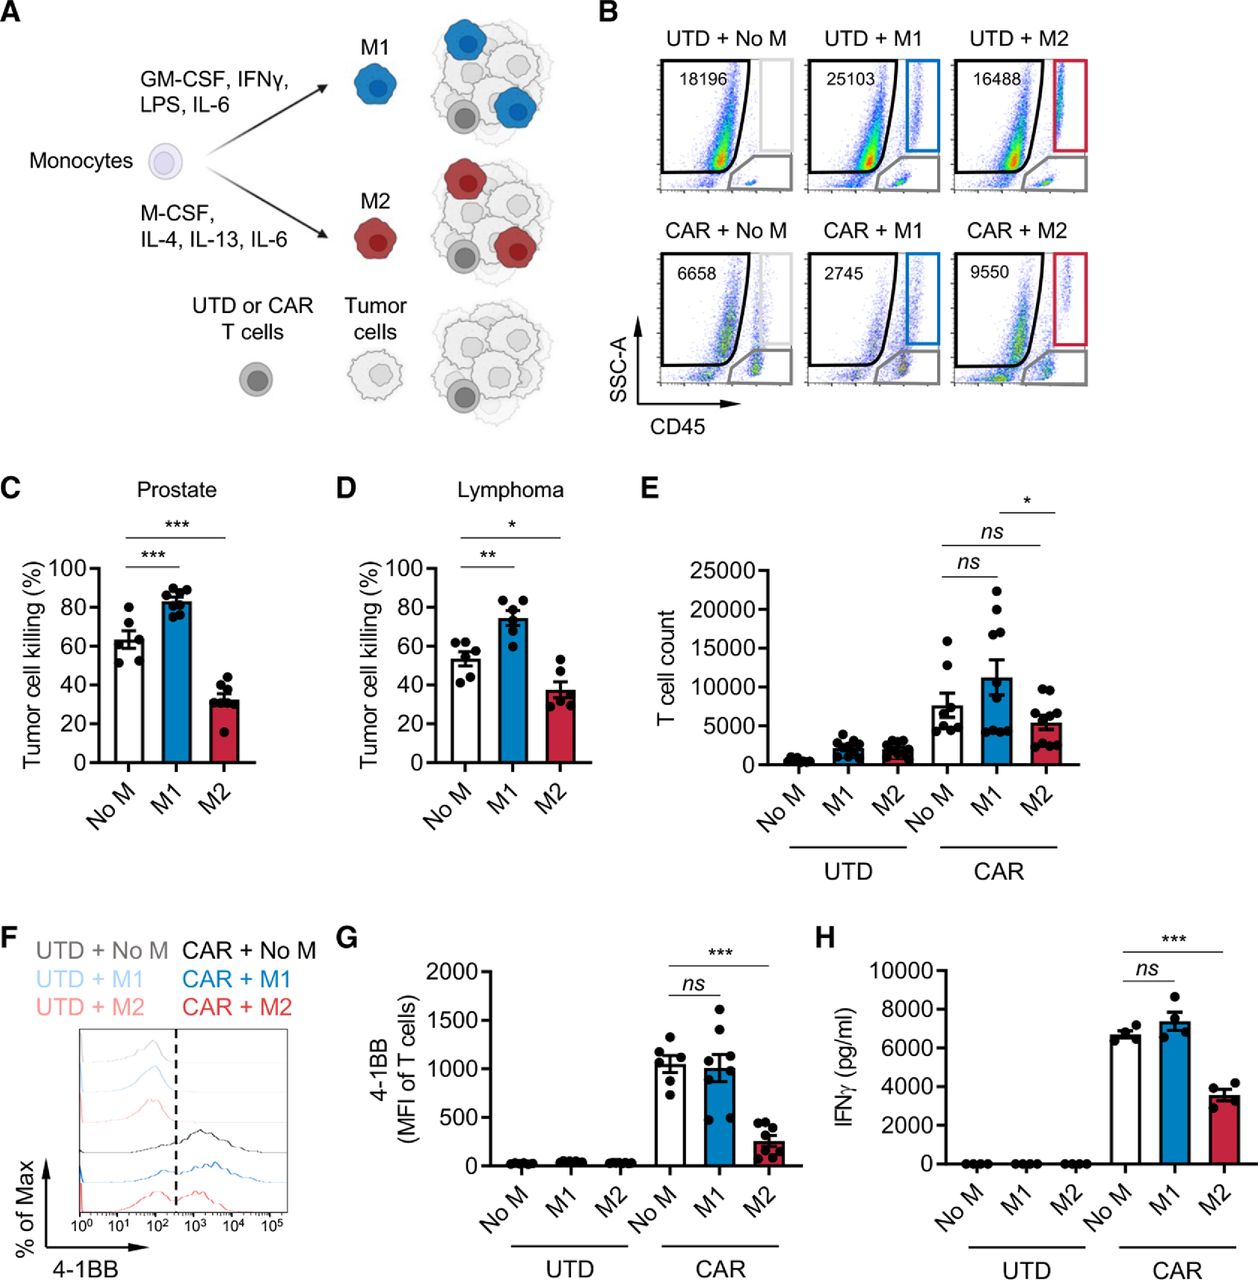
Macrophages are an abundant immune cell population in lymphoma11 and various solid tumors including prostate cancer,7 8 and their abundance correlates with metastasis and poor prognosis. To investigate the impact of macrophage-rich immunosuppressive solid TMEs on CAR T cells, we developed an in vitro immune-suppression assay by co-culturing CAR T cells, M1 or M2 macrophages and target tumor cells at an effector:macrophage:tumor ratio of 1:5:10 (figure 1A). Macrophages were differentiated from CD14+ cells enriched from healthy human donor peripheral blood mononuclear cells (PBMCs) and in vitro polarized as previously described34 into M1 (CD80high, CD163−, CD206low) or M2 (CD80low, CD163+, CD206high) macrophages (online supplemental figure S1A,B). Prostate stem cell antigen (PSCA)-targeting and CD19-targeting CAR T cells were generated as previously published,35 36 and CAR expression was confirmed (online supplemental figure S2A,B). To model the prostate TME, DU145 prostate tumor cells were engineered to express PSCA and co-cultured with untransduced (UTD) or PSCA-CAR T cells.35 CD19-CAR T cells and Daudi lymphoma cells were used to model the lymphoma TME. We evaluated antitumor activity, activation, and proliferation of CAR T cells using the gating strategy in online supplemental figure S3 and interferon-γ (IFN-γ) secretion by ELISA. CAR T cell antitumor activity was normalized to UTD T cells, and activation was measured by 4-1BB upregulation. In both prostate and lymphoma models, in vitro antitumor cytolytic activity of T cells was inhibited in the presence of M2 macrophages, while it was enhanced in the presence of M1 macrophages (figure 1B–D). T cell proliferation (figure 1E and online supplemental figure S4A), activation (figure 1F–G and online supplemental figure S4B), and IFN-γ secretion (figure 1H and online supplemental figure S4C) were also inhibited by M2 macrophages. Similar findings were observed with autologous macrophage and T cell co-cultures (online supplemental figure S5A–C). Collectively, these data show that our in vitro co-culture system effectively recapitulates the immunosuppressive effects of M2 macrophages on CAR T cells in the TME.
Supplemental material

M2 macrophages suppress CAR T cells. (A) Illustration of the immune-suppression assay. CD14+ peripheral blood mononuclear cells were differentiated and polarized to M1 or M2 macrophages in vitro, and macrophages, CAR T cells, and tumor cells were co-cultured and evaluated for functional activities by flow cytometry. (B) Flow cytometry plots indicating the number of viable DU145-PSCA tumor cells in each condition. (C, D) CAR T cell-mediated tumor cell killing of DU145-PSCA prostate cancer (C) and CD19+ Daudi lymphoma (D) cells in the presence or absence of M1 or M2 macrophages after 6 and 3 days, respectively. PSCA-CAR T cell-mediated tumor cell killing was normalized to untransduced (UTD) T cells. (E–H) Proliferation (10 days) (E), 4-1BB activation (6 days) (F, G), and IFN-γ secretion (3 days) (H) of T cells in the presence or absence of M1 or M2 macrophages in the prostate cancer model. Proliferation and activation of T cells was measured by flow cytometry. Secreted IFN-γ in supernatant was measured by ELISA. Data represent at least two independent experiments using at least two different donors, in duplicate. CAR, chimeric antigen receptor; IFN, interferon; IL, interleukin; PSCA, prostate stem cell antigen.

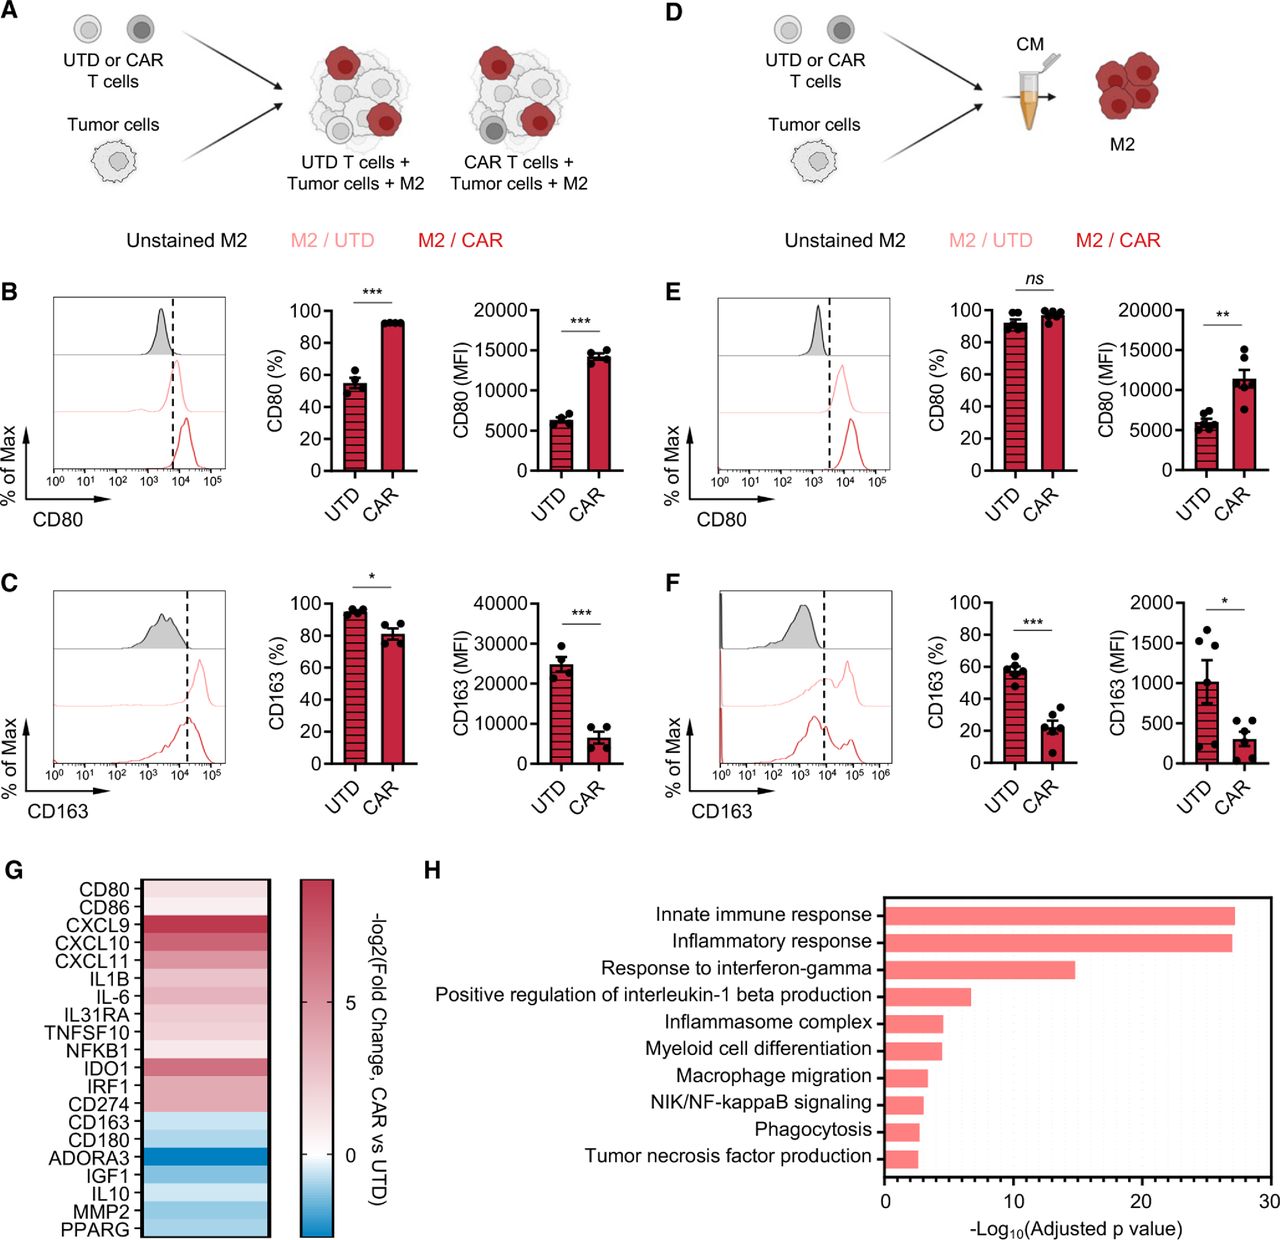
CAR T cells alter M2 macrophage phenotypes. (A) Illustration of the immune-suppression assay to evaluate M2 macrophage phenotype. (B, C) Cell surface expression of CD80 (B) and CD163 (C) in M2 macrophages in the prostate cancer immune-suppression assay evaluated by flow cytometry. Data represent two independent experiments using two different donors, in duplicate (D) Illustration of M2 macrophage stimulation with conditioned media (CM) derived from PSCA-CAR T cell:tumor cell co-cultures. (E, F) Cell surface expression of CD80 (E) and CD163 (F) in M2 macrophages evaluated by flow cytometry 48 hours after stimulating with CM collected from co-culture of DU145-PSCA tumor cells and PSCA-CAR T cells. Data represent three independent experiments using three different donors, in duplicate. (G) Transcriptional changes by bulk RNA sequencing induced in M2 macrophages on stimulation with PSCA-CAR T cell-derived CM. Expression of selected immune-related genes is shown relative to a control condition stimulated with UTD T cell-derived CM. (H) Gene ontology enrichment analysis highlighting activated immune-related biological pathways in M2 macrophages on stimulation with PSCA-CAR T cell-derived CM. CAR, chimeric antigen receptor; IL, interleukin; PSCA, prostate stem cell antigen; UTD, untransduced.
CAR T cells alter the phenotype of M2 macrophages in vitro
Next, we investigated the impact of CAR T cells on the TME by evaluating phenotypic changes that CAR T cells induce in macrophages. In the in vitro immune-suppression assay, we assessed expression of classical M1 (CD80) and M2 (CD163) markers on M2 macrophages in the presence or absence of CAR T cells by flow cytometry (figure 2A). We found in both prostate and lymphoma models that CAR T cells upregulated CD80 (figure 2B and online supplemental figure S6A) and downregulated CD163 (figure 2C and online supplemental figure S6B) surface expression on M2 macrophages. To evaluate whether such phenotypic changes are mediated by secreted factors, we collected conditioned media from tumor killing assay where tumor cells were co-cultured with CAR T cells (figure 2D). The conditioned media was applied onto M2 macrophages, and their phenotype was assessed after 48 hours. Phenotypic changes induced in M2 macrophages mirrored the observation in the immune-suppression assay (figure 2E,F and online supplemental figure S6C,D), suggesting that CAR T cells alter M2 macrophage phenotype via secreted factors. Furthermore, transcriptome analysis of M2 macrophages by bulk RNA sequencing (RNA-seq) revealed a global gene expression change on stimulating with the CAR T cell-derived conditioned media, and M1 signatures including CD80, CXCL9 and IL-1B increased while M2 signatures including CD163, ADORA3 and IL-10 decreased (figure 2G). We found by gene ontology analysis that inflammatory pathways were activated (figure 2H), further supporting changes that CAR T cells induce in M2 macrophages. CAR T cell-derived conditioned media did not induce phenotypic changes in M1 macrophages (online supplemental figure S7A,B). Taken together, these results indicate that CAR T cells alter the TME by repolarizing M2 macrophages to a less immune suppressive, M1-like macrophage state via paracrine signaling.
PD-L1 is upregulated in M2 macrophages in the presence of CAR T cells
IFN-γ is a well-known inducer of PD-L1 and one of the cytokines T cells secrete on activation and has been suggested to be a pathway of resistance to cellular immunotherapy.28 37 Therefore, we assessed PD-L1 expression changes in M2 macrophages and tumor cells in the immune-suppression assay. In the prostate model, both DU145-PSCA tumor cells and M2 macrophages induced PD-L1 surface expression in the presence of CAR T cells. Interestingly, M2 macrophages showed greater induction in frequency and abundance of PD-L1 expression compared with tumor cells and M1 macrophages (figure 3A–C). In the lymphoma model, PD-L1 was induced in M2 macrophages (online supplemental figure S8A) but not in Daudi tumor cells (online supplemental figure S8B). We hypothesized that PD-L1 was induced in a paracrine fashion, and to test this hypothesis, we treated M2 macrophages and various tumor cells with conditioned media obtained from tumor killing assays. PD-L1 induction was the greatest in M2 macrophages at the protein (online supplemental figure S9A,B,D and E) and messenger RNA (mRNA) levels (online supplemental figure S9C), recapitulating induction in the in vitro immune suppression assay.
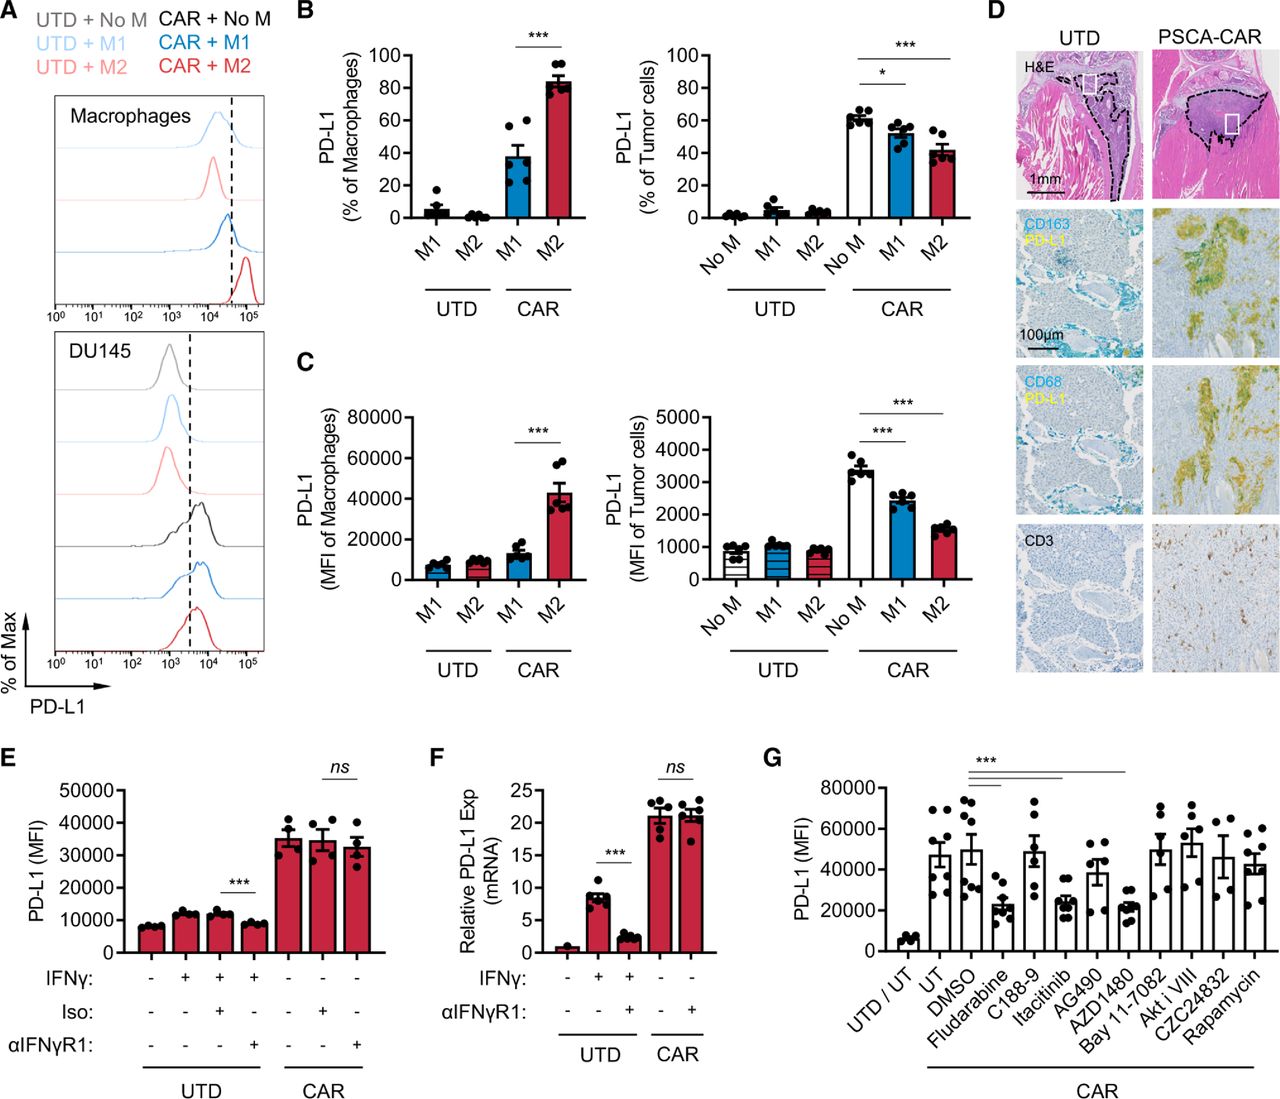
CAR T cells induce PD-L1 expression in M2 macrophages. (A–C) PD-L1 expression in macrophages and DU145-PSCA tumor cells in the immune-suppression assay. Data represent three independent experiments using three different donors, in duplicate. (D) Immunostaining of CD163, CD68, PD-L1 and CD3 in a humanized MISTRG mouse model following CAR T cell therapy against intratibial LAPC9 prostate xenografts. (E, F) PD-L1 induction at the protein (E) and messenger RNA (F) levels following inhibition of IFN-γ signaling. Anti-IFN-γR1 antibody was used to block IFN-γ signaling in the presence of recombinant IFN-γ or PSCA-CAR T cell-derived CM collected from the DU145-PSCA tumor cell killing assay. (G) PD-L1 induction following inhibition of various signaling pathways. PSCA-CAR T cell-derived CM was applied to M2 macrophages in the presence of various small molecule inhibitors: fludarabine (STAT1 i), C188-9 (STAT3 i), itacitinib (JAK1 i), AG490 (JAK2 i), AZD1480 (JAK1/2 i), Bay11-7082 (NFκB i), Akti VIII (AKT i), CZC24832 (PI3K i), rapamycin (mTOR i). PD-L1 induction was evaluated by flow cytometry 48 hours after CM stimulation. Data represent at least two independent experiments using at least two different donors, in duplicate. CAR, chimeric antigen receptor; CM, conditioned media; IFN, interferon; PD-L1, programmed death ligand-1; PSCA, prostate stem cell antigen; UTD, untransduced.
To evaluate whether CAR T cells induce PD-L1 expression in TAMs in vivo, we humanized immune-compromised MISTRG mice by engrafting human CD34+ hematopoietic stem cells.38 DU145-PSCA tumor cells were then injected subcutaneously, and LAPC9 cells, a patient-derived metastatic prostate cancer cell line with endogenous PSCA expression, were injected into the intratibial space to model bone metastatic disease.35 PSCA-CAR T cells were adoptively transferred via intravenous injection, as we have done previously in our preclinical therapeutic studies.35 CD3+ T cells were absent in xenografts of mice that received UTD T cells, suggesting T cells present in mice that received CAR T cells were likely CAR T cells (figure 3D). In humanized MISTRG mice, CD163 or CD68+ human macrophages efficiently infiltrated into human tumor xenografts, and immunostaining revealed colocalization of PD-L1 and CD163 or CD68 in DU145-PSCA and in LAPC9 xenografts of mice that received CAR T cells (figure 3D, online supplemental figure S10). These data, collectively, show that CAR T cells directly induce PD-L1 in both tumor cells and M2 macrophages in vitro and in vivo.
IFN-γ is not a dominant inducer of PD-L1 expression by CAR T cells
We next determined whether IFN-γ was the main driver of PD-L1. We therefore treated M1 macrophages, M2 macrophages, and DU145 tumor cells with conditioned media collected from the DU145-PSCA tumor cell killing assay in the presence of anti-IFN-γR1 antibody. Cells were collected after 48 hours to evaluate PD-L1 expression by flow cytometry (figure 3E and online supplemental figure S11A,B), and cell lysates were collected after 6 hours to measure mRNA expression by quantitative PCR (figure 3F and online supplemental figure S11C). Blocking IFN-γ signaling was not sufficient to inhibit PD-L1 expression in M1 macrophages, M2 macrophages, or DU145 tumor cells in the conditioned media. Similarly, blocking IFN-γ signaling did not inhibit PD-L1 induction in M2 macrophages stimulated with conditioned media collected from the Daudi tumor cell killing assay (online supplemental figure S11D). Further, recombinant IFN-γ only modestly induced PD-L1 expression when it was added at similar concentrations (~20 ng/mL) measured in CAR T cell-derived conditioned media (online supplemental figure S12A–C). Increasing the concentration of recombinant IFN-γ up to 200 ng/mL did not reach the level of PD-L1 induction in M2 macrophages observed with CAR T cell-conditioned media (online supplemental figure S12C). While PD-L1 induction in M1 macrophages by CAR T cell-conditioned media was minimal, it seemed to be largely driven by IFN-γ (online supplemental figure S12B). M1 and M2 macrophages cultured with varying concentrations of conditioned media showed that 5%–20% conditioned media was sufficient to induce maximal levels of PD-L1 (online supplemental figure S12D). Despite IFN-γ being a well-established PD-L1 inducer, these results indicate that IFN-γ is not a sole or dominant inducer of PD-L1 expression in tumor cells or M2 macrophages in this system. The data suggest that PD-L1 induction is regulated by the presence of other inducers in CAR T cell-derived soluble factors.
To identify signaling pathways that mediate PD-L1 induction, we treated M2 macrophages with small molecule inhibitors of various pathways. While inhibition of STAT3, NFκB, AKT, PI3K and mTOR signaling was not sufficient to block PD-L1 induction by CAR T cells in M2 macrophages, inhibition of STAT1 with the non-specific inhibitor, fludarabine, resulted in loss of PD-L1 induction in M2 macrophages (figure 3G). Loss of PD-L1 induction was also shown following JAK1/2 inhibition with AZD1480 as well as JAK1-selective inhibition with itacitinib, but not by JAK2 inhibition with AG490. These results indicate that PD-L1 expression induced by CAR T cells is mediated primarily by a JAK1/STAT1 pathway, independent of IFN-γ. Conditioned media collected from co-culture of DU145-PSCA and PSCA-CAR T cells contained other cytokines that may also activate JAK1 and/or STAT1 (online supplemental figure S13)39 40 to induce PD-L1 expression.
PD-L1 blockade inhibits M2 macrophage-mediated suppression of CAR T cells
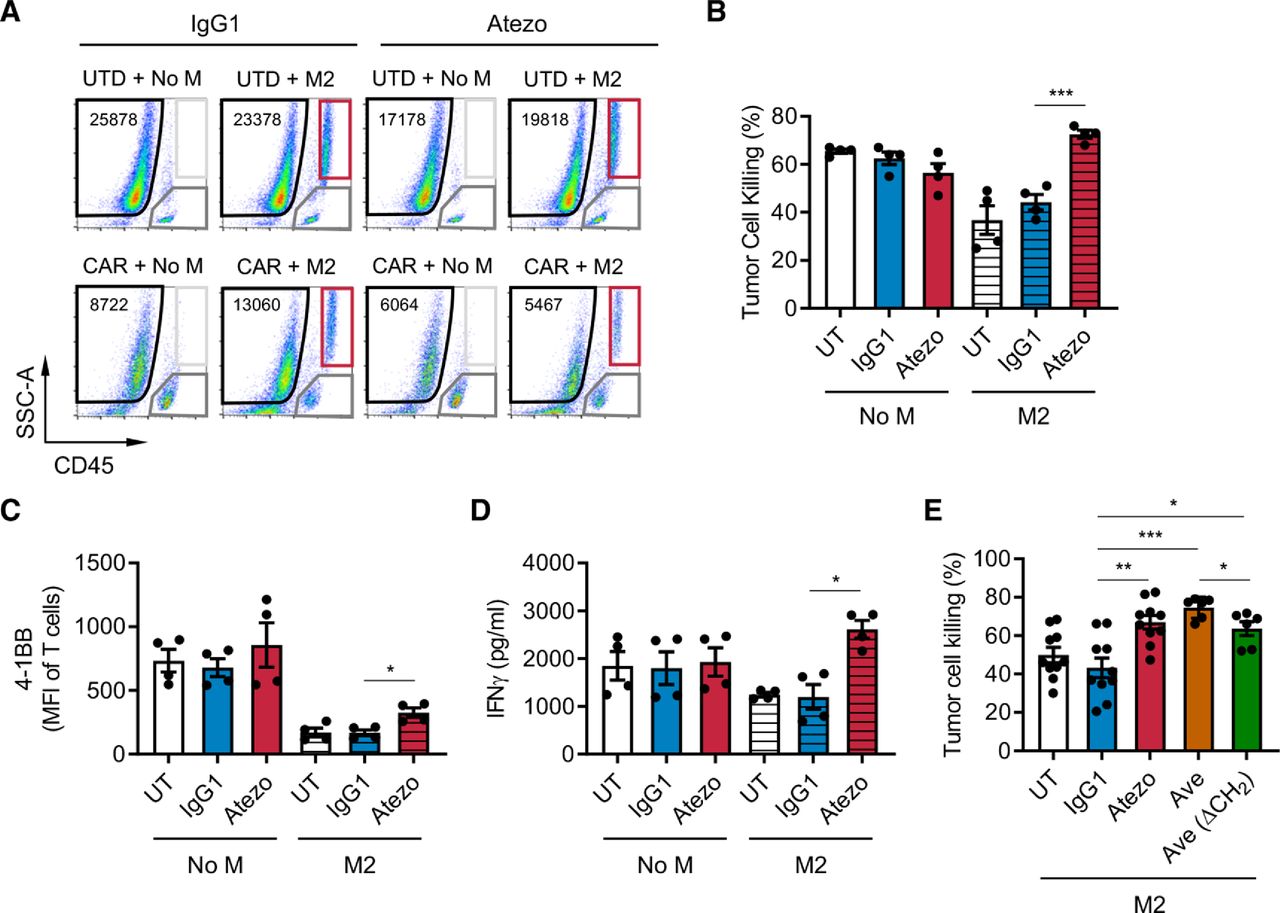
To test the functionality of PD-L1 in immune suppression by M2 macrophages, we blocked PD-L1 with atezolizumab, an anti-PD-L1 monoclonal antibody, in the prostate in vitro immune suppression assay with DU145-PSCA tumor cells. PD-L1 blockade restored CAR T cell-mediated tumor cell killing in the presence of M2 macrophages (figure 4A,B). PD-L1 blockade resulted in a modest but statistically significant increase in T cell activation (figure 4C) and restored IFN-γ secretion (figure 4D), supporting a role for PD-L1 in regulating M2 macrophage-mediated immune suppression. These findings were reproduced using avelumab, another anti-PD-L1 monoclonal antibody, with or without the CH2 domain important for FcR binding (figure 4E). In the lymphoma model where Daudi tumor cells lack PD-L1 expression, we also observed that PD-L1 blockade restored tumor cell killing (online supplemental figure S14A) with a modest increase in T cell activation (online supplemental figure S14B). These data indicate that macrophage PD-L1 is sufficient to drive immune suppression. However, blocking PD-1 using nivolumab, an anti-PD-1 monoclonal antibody, did not restore CAR T cell-mediated tumor cell killing in a similar fashion (online supplemental figure S15A). Consistent with our previous publication,35 PD-1 was not significantly induced in CAR T cells in the co-cultures (online supplemental figure S15B). Therefore, while M2 macrophage PD-L1 is necessary for immune suppression in this system, these results indicated that the classical PD-1/PD-L1 signaling axis is not a primary mechanism by which M2 macrophages suppress CAR T cells.

PD-L1 blockade restores CAR T cell function in the presence of suppressive M2 macrophages. CAR T cell function was evaluated in the prostate cancer immune-suppression assay in the presence of PD-L1 blockade. (A) Flow cytometry plots indicating the number of viable DU145-PSCA tumor cells in each condition in the presence or absence of anti-PD-L1 antibody, atezolizumab (Atezo). (B–D) Quantification of PSCA-CAR T cell-mediated killing of DU145-PSCA tumor cells (B), T cell activation (C), and IFN-γ secretion (D). (E) DU145-PSCA tumor cell killing of CAR T cells in the presence or absence of two clinically approved anti-PD-L1 antibodies, Atezo and avelumab (Ave), and Ave that lacks CH2 domain (Ave (ΔCH2)). Tumor killing and T cell activation were evaluated by flow cytometry, and IFN-γ secretion was evaluated by ELISA. Data represent at least two independent experiments using at least two different donors, in duplicate. CAR, chimeric antigen receptor; IFN, interferon; PD-L1, programmed death ligand-1; PSCA, prostate stem cell antigen; UTD, untransduced.
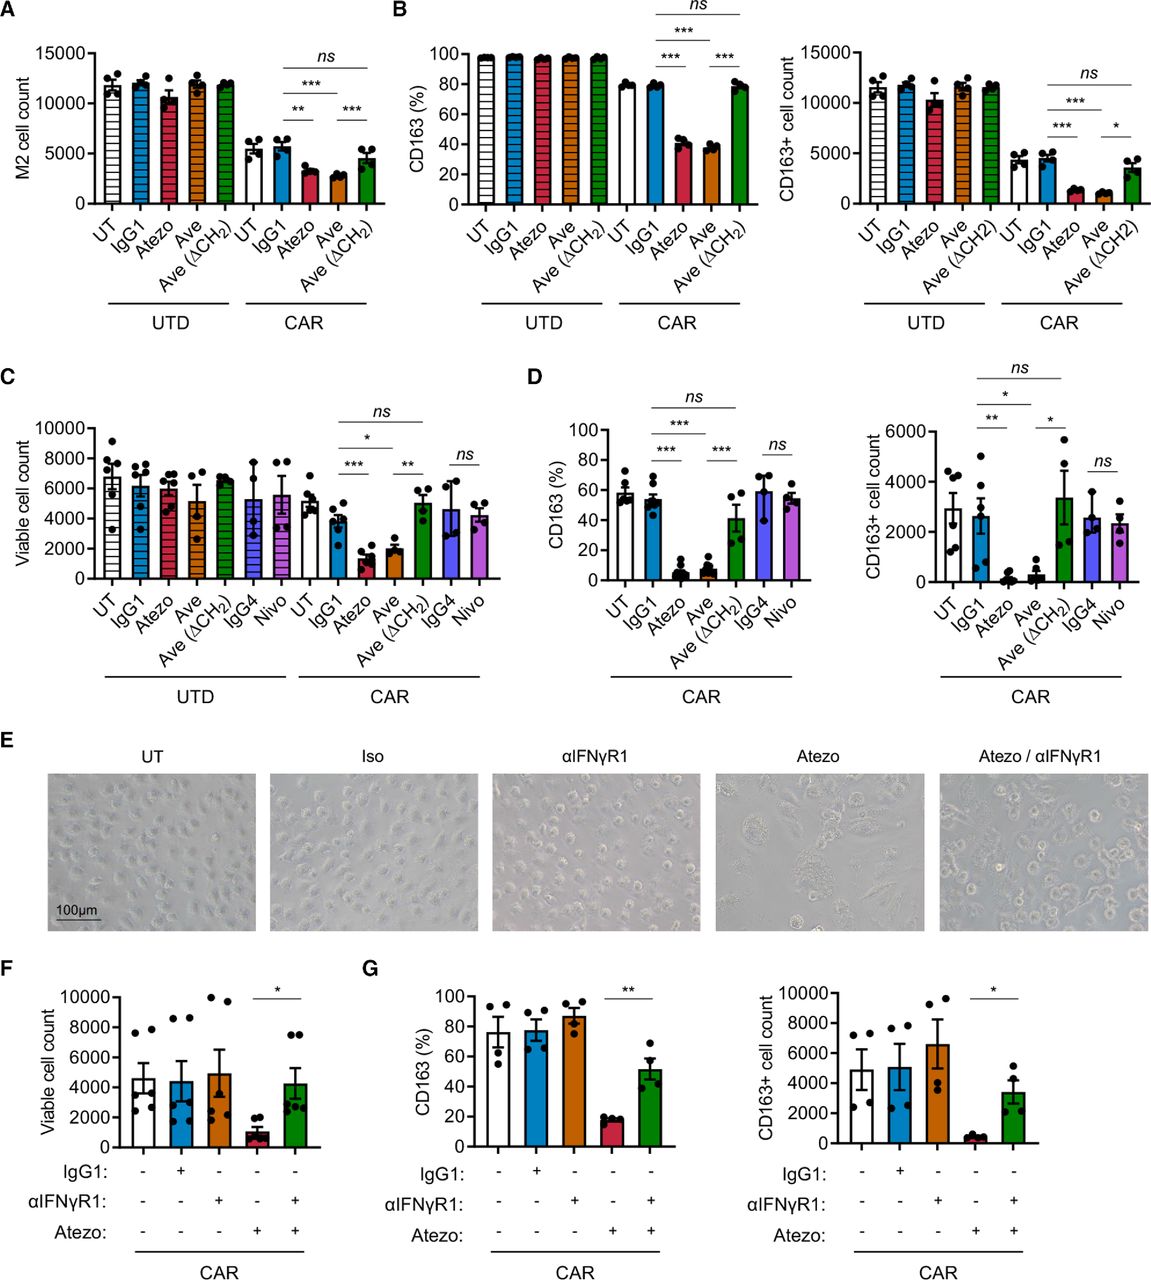
Combination of PD-L1 blockade and CAR T cell therapy depletes M2 macrophages via IFN-γ signaling. (A, B) Analysis of M2 macrophages in the prostate cancer immune-suppression assay in the presence or absence of PD-L1 blockade. (C, D) Analysis of M2 macrophages stimulated with PSCA-CAR T cell-derived CM in the presence or absence of PD-1 or PD-L1 blockade. (E–G) Representative brightfield images and analysis of M2 macrophage stimulated with PSCA-CAR T cell-derived CM in the presence or absence of PD-L1 and/or IFN-γR1 blockade. The number of total viable M2 macrophages (A, C, F) and the frequency and number of CD163+ M2 macrophages (B, D, G) were evaluated by flow cytometry. Data represent at least two independent experiments using at least two different donors, in duplicate. CAR, chimeric antigen receptor; CM, conditioned media; IFN, interferon; PD-L1, programmed death ligand-1; PD-1, programmed cell death protein-1; PSCA, prostate stem cell antigen; UTD, untransduced.
Combining CAR T cells and PD-L1 blockade alters phenotype and reduces survival of M2 macrophages
Macrophages express PD-1 and PD-L1 (online supplemental figure S1B), and increasing evidence supports that these cell surface receptors play a role in shaping intrinsic cellular properties of macrophages including their immune suppressive function.30 41 42 We hypothesized that blocking PD-L1 alters the ability of M2 macrophages to suppress CAR T cells. First, we assessed M2 macrophages in the prostate cancer immune-suppression assay in the presence of PD-L1 blockade. In the presence of PSCA-CAR T cells, addition of atezolizumab and avelumab resulted in a reduction in the number of M2 macrophages compared with respective controls with UTD T cells (figures 4A and 5A). However, blocking PD-L1 with avelumab lacking the CH2 domain did not impact the number of viable M2 macrophages (figure 5A). These data suggest that both PD-L1 blockade and FcR impact the survival of M2 macrophages in the context of CAR T cells. We also evaluated macrophage phenotype and found fewer CD163+ M2 macrophages in the combination of PSCA-CAR T cells and PD-L1 blockade (figure 5B). To further interrogate the mechanism underlying this phenomenon, we stimulated M2 macrophages with conditioned media collected from tumor:CAR T cell co-cultures. Consistent with the previous observation in the immune suppression assay, the combination of PSCA-CAR T cells and PD-L1 blockade resulted in reduction of total viable and CD163+ M2 macrophages (figure 5C,D). Given previous studies in the field suggesting the importance of PD-1 in immune suppression by macrophages,41 42 we also blocked PD-1 with nivolumab, but did not observe a similar impact on viability or changes in CD163 expression in M2 macrophage (figure 5C). We showed similar findings in the lymphoma model with Daudi tumor cells and CD19-CAR T cells (online supplemental figure S16A–D).
IFN-γ signaling mediates altered phenotype of M2 macrophages following PD-L1 inhibition
IFN-γ activates macrophages and plays important roles in promoting inflammation. Therefore, we hypothesized that IFN-γ regulates the loss of CD163+ M2 macrophages in the combination of CAR T cells and PD-L1 blockade. To test this, we treated M2 macrophages with anti-PD-L1 and anti-IFN-γR1 antibodies in the conditioned media collected from co-culture DU145-PSCA tumor cells and PSCA-CAR T cells. By microscopy, we not only visually confirmed the reduction in M2 macrophage cell numbers with PD-L1 blockade, but also observed M2 macrophages become enlarged and vacuolated (figure 5E). Blocking IFN-γ signaling prevented these morphological changes and the loss of CD163+ cells induced by PD-L1 blockade (figure 5E–G). Taken together, these data suggest that the combination of CAR T cells and PD-L1 blockade directly impacts M2 macrophages via IFN-γ signaling, reversing M2 macrophage-mediated immunosuppression of CAR T cells.
Discussion
In the current study, we investigated the impact of myeloid cells on CAR T cell activity using an in vitro model that we established to recapitulate the immune-suppressive TME. We found that M2 macrophages, but not M1 macrophages, suppressed the antitumor activity of CAR T cells using both PSCA+ prostate cancer and CD19+ lymphoma models. The presence of CAR T cells altered the phenotype of M2 macrophages towards a less immune-suppressive state with reduced M2-like CD163+ and greater M1-like CD80+ populations. We also observed induction of PD-L1 expression in tumor cells as well as M1 and M2 macrophages, but M2 macrophages had significantly higher cell-surface density of PD-L1 induction than in tumor cells or M1 macrophages. Inhibition of PD-L1 using antibody blockade restored CAR T cell function suppressed by M2 macrophages, but this restoration was not mediated by canonical PD-1/PD-L1 axis as CAR T cell function was not restored with PD-1 blockade. Instead, the combination of CAR T cells and PD-L1 blockade in an Fc-dependent manner resulted in fewer CD163+ M2 macrophages, suggesting a direct impact of PD-L1 and FcR signaling on these cells. Further, we showed that IFN-γ was required for this phenomenon, as inhibition of IFN-γR signaling potently reversed this PD-L1-regulated survival of M2 macrophage. These findings provide mechanistic insights into CAR T cell-mediated alterations in the TME and specifically on immune-suppressive myeloid cells. However, our studies suggest CAR T cells alone may not be sufficient to overcome immunosuppression in the TME and may require PD-L1 blockade to enable the full therapeutic potential of CAR T cells.
While recent evidence supports the notion that CAR T cells alone can enhance endogenous immunity, numerous studies have shown that CAR T cell therapy is not able to elicit adequate clinical response against solid tumors,43 44 justifying rationale for combining immunotherapies. Our in vitro model confirms the ability of CAR T cells to alter the myeloid cell subsets to a less suppressive state, but such immunomodulation was not sufficient for CAR T cells to evade immune suppression. Moreover, we observed this M2 macrophage shift to a more pro-inflammatory state in approximately 60% of tested healthy human donors, demonstrating apparent heterogeneity in CAR T cell-mediated immunomodulation and susceptibility of macrophages among individuals. Studies in mouse models might reproduce immunomodulation of macrophages in response to CAR T cells, but the use of inbred mice might not adequately uncover heterogenous responses that we observed in our in vitro model. We may be able to use this model in the future to better understand and develop therapies that enhance how CAR T cells function in the presence of TMEs with abundant M2 macrophage subsets as seen in prostate cancers and other solid tumors.
PD-1/PD-L1 blockade combined with CAR T cells is a current clinical strategy owing largely to the field’s collective evidence that immune checkpoint pathways are induced following activity of CAR T cells, which may ultimately lead to exhaustion of CAR T cells. The contribution of myeloid PD-L1 expression to immunosuppression within the TME has been reported in preclinical models and could be regulated by alternative mechanisms.28 30 In our study, the canonical PD-1/PD-L1 axis did not directly influence CAR T cell function, as PD-L1 blockade, but not PD-1 blockade, reversed macrophage-mediated immune suppression. Our data suggest that CAR T cell-mediated PD-L1 expression in macrophages may specifically and directly drive their survival and immune-suppressive phenotype. The change in CD163 expression of macrophages in response to CAR T cells was variable among individuals, however, combining CAR T cells with PD-L1 blockade induced a uniform response in all tested individuals. Loss of immune-suppressive macrophages with the combination of CAR T cells and PD-L1 blockade resembles observations with other myeloid-targeting therapies, including colony stimulating factor 1 (CSF1)/colony stimulating factor 1 receptor (CSF1R) blockade,14 36 C-C motif chemokine ligand 2 (CCL2)/C-C motif chemokine receptor 2 (CCR2) inhibition13 20 and novel anti-CD206 peptides.18 Due to this mechanism of action of TME remodeling, the efficacy of combining CAR T cells and PD-L1 blockade may be driven in part by tumor composition and density of macrophages. Our data suggest that this combination therapy may be more effective in immunologically ‘cold’ solid tumors with abundant CD163+ immune suppressive macrophages.
The requirement of IFN-γ in regulating the survival and function of M2 macrophage following PD-L1 blockade suggests that amplifying IFN-γ signaling may be an actionable target for improving the combination of CAR T cells and ICB. Recent studies have shown that IFN-γ production by CAR T cells is critical for tumor cell killing,45 and in remodeling the TME alone and in combination with ICB. Various engineering and manufacturing approaches can modify IFN-γ secretion by CAR T cells.35 36 46–48 Although we found that IFN-γ was critical for PD-L1 blockade-induced M2 macrophage depletion, mechanisms of how the combination impacts functions of immune suppressive macrophages remain unclear. Although increased apoptosis of CD163+ cells in the combination of CAR T cells and PD-L1 blockade was expected, we failed to demonstrate increased apoptosis in our studies. Using time-lapsed imaging, we revealed cells pursuing and catching adjacent cells before morphological changes occurred, indicating possible antibody-dependent cellular phagocytosis of M2 macrophages. Our finding that PD-L1 blockade-induced M2 macrophage depletion required Fc also supports the possibility of antibody-dependent cellular phagocytosis of these cells.49 Also, macrophages are known to enlarge and form vacuoles via fusion in chronic inflammation,50 and the morphological changes may be a manifestation of a highly inflammatory state. Further studies are warranted to elucidate mechanisms of immunomodulation that macrophages undergo following CAR T cell therapy and PD-L1 blockade.
We built the immune suppression assay under an assumption that TAMs are M2 like, immune suppressive macrophages. However, macrophage phenotypes and functions are not as binary as M1 or M2, but rather demonstrate plasticity along a spectrum of phenotypes and functions. In addition to macrophage cell plasticity, the disease context and clinical interventions likely contribute to shaping the phenotype of TAMs. It is difficult to predict this spectrum of macrophage phenotypes using our in vitro system. However, our study addresses potential mechanisms underlying CAR T cell and PD-L1 blockade alone and in combination. While our studies did not include validation of this combination therapy approach using in vivo models, our histological evaluation of tumors in humanized MISTRG mice does confirm increased PD-L1 expression in TAMs following CAR T cell therapy. We previously developed and published an immunocompetent mouse model where we assessed safety and efficacy of PSCA-CAR T cells in murine cancers.33 Future studies will evaluate the combination using this syngeneic mouse model. Additionally, future clinical trials to evaluate safety and efficacy of combining CAR T cell therapy and ICB in solid cancers and lymphoma may corroborate our findings.
To our knowledge, this is the first example of a mode of action of ICB by which myeloid cells are directly targeted and depleted specifically in the context of CAR T cell therapy, and this study gives new insights to a mechanism by which PD-L1-negative tumors may benefit from CAR T cell therapy in combination specifically with PD-L1 blockade. The altered phenotypes and depletion of immune-suppressive macrophages in tumors may require both CAR T cells and PD-L1 blockade and warrant further engineering of CAR T cells to secrete PD-L1 blockers and enhance IFN-γ signaling to improve antitumor responses in TAM-rich solid tumors.
Materials and methods
Cell lines
Human metastatic prostate cancer cell lines DU145 (ATCC HTB-81) and PC-3 (ATCC CRL-1435), and human lymphoma cell line Daudi (ATCC CCL-213) were cultured in RPMI-1640 (Lonza, 12–115F) containing 10% fetal bovine serum (FBS, Hyclone, SH30070.03) (RPMI + 10% FBS). DU145 and PC-3 tumor cells were engineered to express PSCA antigen as previously described.35 Human pancreatic cancer cell line HPAC (ATCC CRL-2119) and human breast cancer cell line MDA-MB-231 (ATCC CRM-HTB-26) were cultured in Dulbecco’s Modified Eagle Medium: Nutrient Mixture F-12 (DMEM/F12, Corning, 10–092-CV) containing 10% FBS. MCF-7 (ATCC HTB-22) breast cancer cells were cultured in DMEM (Gibco, 11 960–051) containing 10% FBS, 25 mM HEPES (Irvine Scientific, 9319), and 2 mM L-Glutamine (Lonza, 17-605E). Patient-derived metastatic prostate cancer LAPC-9 cells used in vivo were generously provided by the Reiter Lab at University of California Los Angeles (UCLA). LAPC9 cells were engineered to express enhanced green fluorescent protein (eGFP)/firefly luciferase (LAPC-9-eGFP-ffLuc) and maintained as described in previous literature.35
DNA construction and lentivirus production
PSCA-targeting and CD19-targeting CARs were designed as previously described.35 36 PSCA-CAR construct consisted of a humanized PSCA scFv derived from 1G8 (A11 clone), IgG4 (lacking CH2 domain) spacer, CD4 transmembrane, 4-1BB co-stimulatory and CD3ζ cytolytic domains.35 CD19-CAR construct consisted of a scFv derived from murine monoclonal antibody (FMC63 clone), modified IgG4 hinge-Fc spacer, CD28 transmembrane and co-stimulatory domains and CD3ζ cytolytic domain.36 PSCA-CAR and CD19-CAR constructs carried truncated CD19 and epidermal growth factor receptor (EGFR), respectively, as a marker of transduction. Lentivirus was manufactured following previously established methods.35 In short, lentivirus was generated using 293 T cells in T-225 flasks and cultured overnight prior to transfection with packaging plasmids and desired lentiviral backbone plasmid. Supernatant containing lentivirus was collected following 3–4 days, filtered, and centrifuged to remove residual cell debris. Lentivirus containing supernatant then underwent incubation with 2 mM magnesium and 25 U/mL Benzonase endonuclease. Suspended lentivirus was then concentrated by high-speed centrifugation (6080 × g) overnight at 4°C. Lentiviral pellets were resuspended in phosphate buffered saline (PBS)-lactose solution (4 g lactose per 100 mL PBS) then aliquoted and stored at −80°C until ready for use. Lentiviral titers were determined using Jurkat cells.
PBMC and monocyte isolation
Leukapheresis products were obtained from consented research participants (healthy donors) under protocols approved by the City of Hope Internal Review Board. On the day of leukapheresis, PBMC were isolated by density gradient centrifugation over Ficoll-Paque (GE Healthcare) followed by multiple washes in PBS containing 1 mM EDTA (PBS-EDTA, Cellgro).
Monocytes were isolated from freshly collected PBMCs using CD14 antibody-conjugated microbeads and magnetic columns (Miltenyi Biotec) according to the manufacturer’s protocol. CD14+ monocytes and CD14– fraction were frozen in CryoStor CS5 (StemCell Technologies) until processed further.
T cell lentiviral transduction and ex vivo expansion
T cell activation and transduction was performed as described previously.35 Briefly, freshly thawed CD14– or whole PBMCs were washed once and cultured in X-VIVO-15 (Lonza) with 10% FBS (complete X-VIVO) containing 100 U/mL recombinant human IL-2 (Novartis Oncology) and 0.5 ng/mL recombinant human IL-15 (CellGenix). For CAR lentiviral transduction, T cells were cultured with CD3/CD28 Dynabeads (Life Technologies), protamine sulfate (APP Pharmaceuticals), cytokine mixture (as stated above), and desired lentivirus at a 0.1–1 multiplicity of infection the day following stimulation. Cells were then cultured in and replenished with fresh complete X-VIVO containing cytokines every 2–3 days. After 7 days, beads were magnetically removed, and cells were further expanded in complete X-VIVO containing cytokines to achieve desired cell yield. CAR T cells were positively selected for truncated CD19 using the EasySep CD19 Positive Enrichment Kit I or II (StemCell Technologies) (for PSCA-CAR T cells) or positively selected for truncated EGFR using a custom EasySep EGFR Positive Enrichment Kit (for CD19-CAR T cells) according to the manufacturer’s protocol. Following further expansion, cells were frozen in CryoStor CS5 prior to in vitro and in vivo studies. Purity and phenotype of CAR T cells were verified by flow cytometry.
In vitro macrophage differentiation
Primary human M1 and M2 macrophages were differentiated and polarized as previously described.34 Briefly, frozen human monocytes were thawed and cultured in cytokine-containing RPMI + 10% FBS for 7–10 days. To differentiate M1 macrophages, cells were cultured with GM-CSF (BioLegend, 572903). The media was changed once after 3–5 days to media containing GM-CSF, IFN-γ (BioLegend, 570202), LPS (Sigma-Aldrich, L3012-5MG) and IL-6 (BioLegend, 570804). To differentiate M2 macrophages, cells were cultured with M-CSF (BioLegend, Cat: 574804). The media was changed once after 3–5 days to media containing M-CSF, IL-4 (BioLegend, 574004), IL-13 (BioLegend, 571102) and IL-6. All cytokines and LPS were used at 20 ng/mL. After differentiation, macrophages were lifted using PBS-EDTA, and phenotype was assessed by flow cytometry to confirm successful polarization. Cells were counted and used for further studies.
Flow cytometry
Cells were resuspended in fluorescence-activated cell sorting (FACS) buffer (Hank’s balanced salt solution without Ca2+, Mg2+, or phenol red (HBSS−/−, Life Technologies) containing 2% FBS. Cells were incubated with primary antibodies for 30 min at 4°C in the dark. Cell viability was determined using 4',6-diamidino-2-phenylindole (DAPI, Sigma). Flow cytometry was performed on a MACSQuant Analyzer 10 (Miltenyi Biotec), and the data were analyzed with FlowJo software (V.10, TreeStar). Antibodies targeting human CD3 (BD Biosciences, 563109), CD4 (Biosciences, 340443), CD8 (Biosciences, 347314), CD45 (BD Biosciences, 347464), CD137 (BD Biosciences, 555956), CD19 (BD Pharmingen, 557835), EGFR (BioLegend, 352906), CD80 (BD Biosciences, 340294), CD163 (eBioscience, 17-1639-42), CD206 (BioLegend, 321123), PD-L1 (BD Biosciences, 558065), PD-1 (eBioscience, 47-2799-42), CD33 (BD Biosciences, 340533), HLA-DR (eBioscience, 47-9956-42), and CSF1R (BioLegend 347305) were used for analysis.
ELISA
IFN-γ in supernatant was measured using Human IFN-γ ELISA Kit (Invitrogen, 88-7316-88) according to the manufacturer’s protocol. Plates were read at 450 nm using Cytation 5 (BioTek).
Multiplex cytokine analysis
30-plex human cytokine panel (Thermo Fisher Scientific, LHC6003M) was used on FLEXMAP 3D Luminex system (Luminex Corporation) to evaluate cytokines secreted in tumor:T cell co-cultures. Cytokine concentrations were calculated using Bio-Plex Manager V.6.2 software with a five parameter curve-fitting algorithm applied for standard curve calculations for duplicate samples. Cytokine concentrations across all samples were converted to log2 scale and represented with circles filled with color. Yellow corresponds to the highest log2 concentration measured across all samples for a given sample and blue corresponds to 0% of the log2 concentration. Analyte concentrations relative to the maximum concentration observed for a given sample and cytokine are represented by the size of the circles. The balloon plot was generated using R (V.3.4.3) with ggplot2 library (V.3.1.1).
In vitro immune-suppression assay
CAR T cells, macrophages, and target tumors were co-cultured in RPMI + 10% FBS in the absence of exogenous cytokines in 96-well plates. Cells were plated at an effector:macrophage:target ratio of 1:5:10 to model prostate cancer with DU145-PSCA cells and lymphoma with Daudi cells. For analysis of the prostate cancer model, supernatant was collected after 3 days for ELISA, and cells were trypsinized and collected for flow cytometry after 6 or 10 days. T cell proliferation was assessed after 10 days, and all other parameters including tumor cell killing, T cell activation and macrophage phenotype were evaluated after 6 days by flow cytometry. The lymphoma model was analyzed after 3 days of culture.
Generation of CAR T cell-derived conditioned media
PSCA-CAR T cells or UTD controls (5×10³) were co-cultured with DU145-PSCA cells (5×10⁴) for 72 hours, and supernatant was collected and centrifuged at 500 × g for 5 min. Cell-free conditioned media was collected and stored at −80°C. CAR T cell function was validated by flow cytometry, and when it is mentioned, ELISA was performed prior to using the supernatant to determine concentrations of IFN-γ.
Stimulation of macrophages with CAR T cell-derived conditioned media
Differentiated macrophages were plated in RPMI + 10% FBS and rested overnight, and CAR or UTD T cell-derived conditioned media collected from tumor cell:T cell co-cultures was applied to stimulate macrophages. Cells were analyzed by flow cytometry after 48 hours. Cell morphology was captured by using BZ-X810 Inverted Microscope (Keyence) or Axio Vert.A1 Inverted Microscope (Zeiss). Atezolizumab (anti-human PD-L1, Tecentriq, Genentech), avelumab (anti-human PD-L1, Bavencio, EMD Serono), nivolumab (anti-human PD-1, Opdivo, Bristol Meyers Squibb), and isotype control (bgal-mab12, InvivoGen) were added at the time of stimulation. Anti-IFN-γR1 (BioLegend, 308610) and isotype control (BioLegend, 400166) were added to culture 2 hours prior to stimulation with conditioned media. Similarly, cells were pre-incubated with small molecule inhibitors for 30 min prior to stimulation. Small molecule inhibitors included Fludarabine (STAT1 inhibitor, EnzoALX-480–100 M005), AZD1480 (JAK1 and JAK2 inhibitor, MilliporeSigma, SML1505-5MG), Itacitinib (JAK1 inhibitor, Cayman Chemicals, 27597), Rapamycin (mTOR inhibitor, Cayman Chemicals, 13346), C188-9 (STAT3 inhibitor, Cayman Chemicals, 30928), Akt Inhibitor VIII (AKT inhibitor, MilliporeSigma, 124,018–5 MG), BAY 11–7082 (NF-κB inhibitor, MilliporeSigma, B5556-10MG), AG490 (JAK2 inhibitor, MilliporeSigma, 658,401–5 MG), CZC24832 (PI3Kγ inhibitor, MilliporeSigma, SML1214-5MG).
RT-PCR
RNA was isolated using RNeasy mini kit (Qiagen) or Quick-RNA Microprep Kit (Zymo Research), and RNA concentration was measured using NanoDrop (Thermo Scientific). Complementary DNA was prepared from 0.4 to 1 µg of total RNA using SuperScript IV reverse transcriptase (Thermo Fisher Scientific). qPCR was performed using SsoAdvanced Universal SYBR Green Supermix (Bio-Rad) on CFX96 Real-Time PCR Detection System (Bio-Rad). The data were analyzed by the comparative threshold method, and gene expression was normalized to GAPDH. The following primers were used: CD274: forward, GCTGAACGCCCCATACAACA; reverse, TCCAGATGACTTCGGCCTTG and GAPDH: forward, TCGGAGTCAACGGATTTGGT; reverse, TTCCCGTTCTCAGCCTTGAC. These primer sets were validated to have a single melting curve and amplification efficiency of 2.
RNA sequencing
Macrophages were stimulated with CAR or UTD T cell-derived conditioned media collected from tumor cell:T cell co-cultures. After 8 hours, cells were lysed using RNA Lysis Buffer (Zymo Research, R1060-1-50), and RNA was isolated according to the manufacturer’s protocol. Libraries for stranded poly(A) RNA-seq were created using the KAPA mRNA HyperPrep kit (Roche). Sequencing of 51 bp single-end reads was performed using a HiSeq2500 regular run. Base calling (de-multiplexing samples between and within laboratories by 6 bp barcodes, from a 7 bp index read) was performed using bcl2fastq V.2.18. Reads were aligned against the human genome using TopHat2.51 Read counts were tabulated using htseq-count,52 with University of California Santa Cruz (UCSC) known gene annotations.53 Change values were calculated from fragments per kilobase per million (FPKM) reads normalized expression values, which were also used for visualization (following a log2 transformation).54 Aligned reads were counted using GenomicRanges.55 gene set enrichment analysis (GSEA) was run on log2 (FPKM +0.1) expression values, with upregulated enrichment results for GO Biological Process categories in MSigDB.56–58
Animal experiments
All animal experiments were performed under protocols approved by the City of Hope Animal Care and Use Committee. MISTRG mice were obtained through MTA from Regeneron Pharmaceuticals and housed and bred at City of Hope. 3–6 week old MISTRG mice were sublethally irradiated (100cGy, JL Shepherd Mark I Cs-137 irradiator) 6–12 hours prior to engraftment of human adult G-CSF mobilized CD34+ cells (2.5×10⁵) via intravenous injection. Human adult G-CSF mobilized CD34+ cells and autologous PBMCs were purchased from HemaCare, and autologous PBMCs were used to manufacture CAR and UTD T cells used for adoptive cell transfer (ACT). DU145-PSCA cells (2.5–5×10⁵) were engrafted subcutaneously (s.c.), and tumor growth was monitored by biweekly caliper measurement. For an orthotopic intratibial model, LAPC-9-eGFP-ffLuc cells (1.5×10⁵) were engrafted into the intratibial space (i.ti.), and tumor growth was monitored by biweekly non-invasive bioluminescence imaging (Lago-X, Accela). For non-invasive flux imaging, mice were injected intraperitonially with 150 mL D-luciferin potassium salt (Perkin Elmer) suspended in PBS at 4.29 mg/mouse. Flux signals were analyzed with Aura imaging software (Spectral Instruments Imaging). Mice received ACT of CAR or UTD T cells (1×10⁶) when DU145-PSCA s.c. reach ~150 mm3 or 14 days after LAPC-9-eGFP-ffLuc i.ti. engraftment. Tumors were harvested 7 days following ACT for histology.
Immunohistochemistry and immunofluorescent staining
Collected mouse tissue was fixed in 4% paraformaldehyde (Boston BioProducts) and stored in 70% ethanol until processed further. Tissue embedding, sectioning, H&E and immunohistochemistry (IHC) staining were performed by the Research Pathology Core at City of Hope.
Immunofluorescent staining of tissue was completed on paraffin embedded tissue. In brief, paraffin sections were deparaffinized and rehydrated, and antigens were retrieved in citrate-based antigen unmasking solution (Vector Laboratories, H-3300–250) for 10 min at 120°C using an autoclave. Samples were rehydrated, permeabilized with 0.1% Triton X-100 for 30 min at room temperature and blocked with 5% normal donkey serum for 45 min prior to immunostaining. Tissue was incubated with rabbit anti-human CD68 (1:200, Cell Signaling Technology, 76 437T) and goat anti-human PD-L1 (1:50, Leinco Technologies, B560) at 4°C overnight and washed in PBS containing 0.1% Tween 20 for 5 min three times. Tissue was incubated with secondary antibodies donkey anti-rabbit IgG, AlexaFluor 488 (1:1000, Invitrogen, A-21206) and donkey anti-goat IgG, AlexaFluor 546 (1:1000, Invitrogen, A-11056) for 1 hour at room temperature, washed in PBScontaining 0.1% Tween 20 for 5 min three times and mounted with mounting media containing DAPI (Vector Laboratories). Fluorescent images were captured using BZ-X810 Inverted Microscope (Keyence).
Double IHC was performed by the Research Pathology Core at City of Hope. Staining was performed on Ventana Discovery Ultra (Ventana Medical Systems, Roche Diagnostics, Indianapolis, USA) IHC Auto Stainer, and mouse anti-human CD68 (Dako, M087601-2) and rabbit anti-human PD-L1 (Ventana, 790–4905) were used at 1:100. Briefly, the slides were loaded on the machine, deparaffinization, rehydration, endogenous peroxidase activity inhibition and antigen retrieval were first performed. Two antigens were sequentially detected and heat inactivation was used between the two antigen detection steps to prevent any potential cross-reactivities. Following the first primary antibody (PD-L1) incubation, DISCOVERY anti-Rabbit NP and DISCOVERY anti-NP-AP were incubated, and stains were visualized with DISCOVERY Yellow Kit. Following the heat inactivation, the second primary antibody (CD68) was incubated, DISCOVERY anti-Rabbit HQ and DISCOVERY anti-HQ-HRP were added, and stains were visualized by DISCOVERY Teal Kit. The slides were then counterstained with hematoxylin (Ventana) and cover slipped. Slides were scanned by using NanoZoomer V.2.0HT (Hamamatsu).
Statistical analysis
Data are presented as mean±SEM unless otherwise stated. Statistical comparisons between groups were performed using the unpaired two-tailed Student’s t-test to calculate p values, unless otherwise stated. *p<0.05; **p<0.005; ***p<0.001; ns, not significant.
Data availability statement
Data are available upon reasonable request. All data relevant to the study are included in the article or uploaded as supplementary information.
Ethics statements
Patient consent for publication
Acknowledgments
We thank the staff members of the following cores at the Beckman Research Institute at City of Hope Comprehensive Cancer Center: Animal Facility, Pathology, Small Animal Imaging, and Light Microscopy for their excellent technical assistance. We thank Charles War-den and Dr Xiwei Wu of the Integrative Genomics Core for their technical assistance in RNAseq analysis. We would also like to thank Catalina Martinez at City of Hope for contributions to manuscript editing.
References
Supplementary materials
Supplementary Data
This web only file has been produced by the BMJ Publishing Group from an electronic file supplied by the author(s) and has not been edited for content.
Footnotes
Twitter @rachelhng, @Zarif_Lab, @SaulPriceman
Contributors SJP and YY provided conception and construction of the study. SJP, SJF, TBD, XW, JCZ, VDJ, NL, RHN, LSL, KO, JG, and YY provided design of experimental procedures, data analysis, and interpretation. YY, JG and KO, performed experiments. YY and SJP wrote the manuscript. CM and JG assisted in writing the manuscript. SJP supervised the study and is responsible for the overall content as the guarantor. All authors reviewed the manuscript.
Funding Research reported in this publication was supported by a Prostate Cancer Foundation Young Investigator Award (PI: YY), a TJ Martell Foundation Cancer Research Grant (PI: SJP), a Department of Defense Idea Development Award (SJP, W81XWH- 17-1-0208), and the Mike & Linda Fiterman Family Foundation (SJP). Work performed in the Pathology Core and Small Animal Imaging Core was supported by the National Cancer Institute of the National Institutes of Health under grant number P30CA033572. The content is solely the responsibility of the authors and does not necessarily represent the official views of the National Institutes of Health.
Competing interests SJP is a scientific advisor, consultant, and/or receives royalties from Imugene, Mustang Bio, Bayer, Celularity, and Adicet Bio. SJF is a scientific advisor to and receives royalties from Mustang Bio. All other authors declare that they have no competing interests.
Provenance and peer review Not commissioned; externally peer reviewed.
Supplemental material This content has been supplied by the author(s). It has not been vetted by BMJ Publishing Group Limited (BMJ) and may not have been peer-reviewed. Any opinions or recommendations discussed are solely those of the author(s) and are not endorsed by BMJ. BMJ disclaims all liability and responsibility arising from any reliance placed on the content. Where the content includes any translated material, BMJ does not warrant the accuracy and reliability of the translations (including but not limited to local regulations, clinical guidelines, terminology, drug names and drug dosages), and is not responsible for any error and/or omissions arising from translation and adaptation or otherwise.