Article Text

Abstract
Background Tumor infiltrating lymphocytes (TILs) reflect adaptive antitumor immune responses in cancer and are generally associated with favorable prognosis. However, the relationships between TILs subsets and their spatial arrangement with clinical benefit from immune checkpoint inhibitors (ICI) in non-small cell lung cancer (NSCLC) remains less explored.
Methods We used multiplexed quantitative immunofluorescence panels to determine the association of major TILs subpopulations, CD8+ cytotoxic T cells, CD4+ helper T cells and CD20+ B cells, and T cell exhaustion markers, programmed cell death protein-1 (PD-1),lymphocyte-activation gene 3 (LAG-3) and T cell immunoglobulin mucin-3 (TIM-3) with outcomes in a multi-institutional cohort of baseline tumor samples from 179 patients with NSCLC treated with ICI. The analysis of full-face tumor biopsies including numerous fields of view allowed a detailed spatial analysis and assessment of tumor immune heterogeneity using a multiparametric quadratic entropy metric (Rao’s Q Index (RQI)).
Results TILs were preferentially located in the stromal tissue areas surrounding tumor-cell nests and CD8+ T cells were the most abundant subset. Higher density of stromal CD8+ cytotoxic T cells was significantly associated with longer survival, and this effect was more prominent in programmed death ligand-1 (PD-L1) positive cases. The role of baseline T cell infiltration to stratify PD-L1 expressing cases was confirmed measuring the T cell receptor-burden in an independent NSCLC cohort studied with whole-exome DNA sequencing. High levels of LAG-3 on T cells or elevated RQI heterogeneity index were associated with worse survival in the cohort.
Conclusion Baseline T cell density and T cell exhaustion marker expression can stratify outcomes in PD-L1 positive patients with NSCLC treated with ICI. Spatial immune heterogeneity can be measured using the RQI and is associated with survival in NSCLC.
- immunotherapy
- lymphocytes, tumor-infiltrating
- lung neoplasms
- tumor biomarkers
- programmed cell death 1 receptor
Data availability statement
No data are available.
This is an open access article distributed in accordance with the Creative Commons Attribution Non Commercial (CC BY-NC 4.0) license, which permits others to distribute, remix, adapt, build upon this work non-commercially, and license their derivative works on different terms, provided the original work is properly cited, appropriate credit is given, any changes made indicated, and the use is non-commercial. See http://creativecommons.org/licenses/by-nc/4.0/.
Statistics from Altmetric.com
- immunotherapy
- lymphocytes, tumor-infiltrating
- lung neoplasms
- tumor biomarkers
- programmed cell death 1 receptor
WHAT IS ALREADY KNOWN ON THIS TOPIC
Predictive biomarkers for anticancer immunotherapy are limited. Tumor infiltrating lymphocytes (TILs) have been proposed as candidate biomarkers for immune checkpoint inhibitors (ICI) in patients with advanced non-small cell lung cancer (NSCLC).
WHAT DOES THIS STUDY ADD
Our study characterizes the composition and spatial distribution of major TIL subsets in NSCLC. We also demonstrate the outcome effect of CD8+ T cells or the T cell receptor (TCR) fraction in patients with programmed death ligand-1 (PD-L1) expressing tumors, the contribution of T cell dysfunction markers and the clinical significance of spatial immune heterogeneity. Our study also establishes a novel multidimensional metric to study spatial immune heterogeneity with strong biomarker potential.
HOW DOES THIS STUDY AFFECT RESEARCH, PRACTICE AND/OR POLICY
Our findings reveal that CD8+ TIL density and the TCR fraction measured by whole-exome DNA sequencing can stratify survival after ICI in patients with PD-L1 positive tumors and support their use as biomarkers. Our work also supports the incorporation of T cell LAG-3 and spatial immune heterogeneity as exploratory ICI biomarkers.
Background
The antitumor activity of immune checkpoint inhibitors (ICI) has transformed the therapeutic landscape of non-small cell lung cancer (NSCLC). However, only a fraction of patients derive durable clinical benefit.1 2 Despite the rapid expansion of these treatments, few biomarkers are able to accurately predict sensitivity to therapy.
The expression of programmed death ligand-1 (PD-L1) protein by immunohistochemistry (IHC) is the most common immunotherapy biomarker used clinically. Although some clinical trials reported that PD-L1 expression correlates with treatment response3 4 other studies did not find any effect.5 6 Additionally, it has been shown that approximately 15% of PD-L1 negative patients can respond to immunotherapy.7 8 Despite its widespread use, PD-L1 expression has many limitations; therefore, it is imperative to find new biomarkers or refine the use of PD-L1 to improve patient selection.
Multiple studies have supported a role of tumor mutational burden (TMB) as an independent predictor of clinical benefit to ICIs in patients with NSCLC.9–11 However, implementation of TMB as a biomarker for patient selection has been limited by numerous technical challenges and is not currently approved for front-line ICI treatment.12
Analysis of the tumor immune microenvironment has been proposed as a potential source of immunotherapy biomarkers. For instance, numerous studies have shown that elevated tumor infiltrating lymphocytes (TILs) are associated with a better prognosis in diverse tumor types.13–16 However, their association with benefit after immunostimulatory therapies in patients with NSCLC and independence from PD-L1 expression is less clear. Most available studies to date are limited by the use of subjective semi-quantitative methods to evaluate TILs and analysis of relatively small tumor tissue areas. In addition, preliminary studies have suggested that the functional profile of TILs and their location within the tumor microenvironment can provide additional predictive information.17–20 Thus, the potential of TILs as ICI biomarker has not been fully realized.
The complex interaction between tumor cells, immune cells and their longitudinal temporal evolution can give rise to spatial intratumor heterogeneity.21–23 However, measurement of immune heterogeneity and its impact on ICI-specific outcomes has been limited by the lack of standardized methods and suitable metrics to assess it.24 25 In addition, assessing spatial heterogeneity requires the use of assays that maintain the architectural integrity of samples such as in situ protein/cell analysis. This cannot be achieved with platforms requiring tissue disaggregation or sample grinding such as most sequencing-based strategies.
Here, we used multiplexed quantitative immunofluorescence (QIF) to determine the association of major TILs subsets with outcomes in a multi-institutional cohort of patients with NSCLC treated with programmed cell death protein-1 (PD-1) axis blockers that had extensive clinical annotation and follow-up. The analysis of full-face pretreatment tumor biopsies, including numerous fields of view (FOVs), allowed a detailed spatial analysis and assessment of tumor immune heterogeneity using a multiparametric and continuous scoring system.
Materials and methods
Stand up to cancer and Mark Foundation NSCLC cohort
Two hundred and fifty-eight pretreatment formalin-fixed paraffin-embedded (FFPE) whole-tissue sections of NSCLC samples from patientes treated with PD-1 axis blockers were retrospectively collected from Yale University (n=107), Cleveland Clinic (n=42), UC Davis (n=30), Memorial Sloan Kettering Cancer Center (n=38) and Massachusetts General Hospital (n=41). The final number of samples included in the analysis was lower (n=179) due to lack or loss of tumor tissue and exclusion of samples with limited quality or incomplete clinicopathologic/survival annotation. Information from the cases was collected from pathology reports and clinical records in each center. A detailed description of the cohort is provided in table 1.
Clinicopathological description of non-small cell lung cancer cohort
Multiplexed immunofluorescence staining
Multiplexed TILs immunofluorescence staining
Analytical validation and experimental details of the multiplexed immunofluorescence staining protocol used are shown in online supplemental figure S1 and in previous publications.13 26
Supplemental material
Supplemental material

TILs show variable distribution in NSCLC and they are located preferentially in the stromal compartment. (A) Representative multicolor images of TILs staining, tissue segmentation and cell phenotyping. Left panel: Representative image after scanning. Middle panel: Compartmentalization of tissue in stroma (red) and tumor (green). Right panel: Phenotyping of individual cells. (B) Mean density distribution for CD4+ (left panel), CD8+ (middle panel) and CD20+ cells (right panel) for each patient across the cohort (n=179). (C) Percentage of TILs represented by each lymphocyte subset in each patient across the cohort. (D) Correlation between CD8+ T cells and CD4+ and CD20+ cells. Results show Pearson’s correlation coefficient. (E) Bar plots for the mean density of TILs by tissue compartment. (F) Pie charts representing the percentage of cells in the stroma (top) and tumor (bottom). Inset shows percentage of TIL subsets. NSCLC, non-small cell lung cancer; TILs, tumor infiltrating lymphocytes.
Whole-tissue sections slides were deparaffinized and subjected to antigen retrieval using EDTA buffer (Sigma-Aldrich) pH=8.0 and boiled for 1 hour at 96°C in a pressure-boiling container (PT module, Lab Vision). Slides were then incubated with dual endogenous peroxidase block (#S2003: Dako) for 10 min at room temperature. Subsequent steps were carried out on the Lab Vision 360 Autostainer (Thermo Scientific). Non-specific antigens were blocked by a 30-min incubation in 0.3% BSA in TBST. The sequential multiplexed immunofluorescence protocol was performed using isotype-specific primary antibodies to detect epithelial tumor cells (Cytokeratin Alexa-488 conjugated, clone AE1/AE3, eBioscience), helper T cells (CD4 IgG, 1:100, clone SP35, SpringBio), cytotoxic T cells (CD8 IgG1k, 1:250, clone C8/144B, Dako), and B cells (CD20 IgG2a, 1:150, clone L26, Dako). Secondary antibodies and reagents used were anti-rabbit Envision (K4003, Dako), with biotinylated tyramide/Streptavidine-Alexa750 conjugate (PerkinElmer), anti-mouse IgG1k antibody (1:100, eBioscience) with Cy3-tyramide (PerkinElmer) and anti-mouse IgG2a antibody (1:200, Abcam) with Cy5-tyramide (PerkinElmer). Nuclei were highlighted using 4’,6-Diamidino-2-Phenylindole (DAPI). Residual horseradish peroxidase activity between incubations with secondary antibodies was eliminated by exposing the slides twice for 7 min to a solution containing benzoic hydrazide (0.136 mg) and hydrogen peroxide (50 µl). Finally, slides were mounted with Prolong Gold. A control tissue microarray containing positive and negative controls was included in each batch to assess reproducibility (online supplemental figure S1).
The primary antibodies for the immune inhibitory receptor panel included anti-CD3 (Clone SP7, Dako), anti-PD-1 (Clone EH33, Cell Signaling Technology), anti-lymphocyte-activation gene 3 (LAG-3) (Clone 17B4, Abcam) and anti-T cell immunoglobulin mucin-3 (TIM-3) (Clone D5D5R, Cell Signaling Technology). Secondary antibodies and fluorescent reagents were anti-rabbit Envision (K4003, Dako) with fluorescein-tyramide (PerkinElmer), anti-mouse IgG2a antibody (Abcam) with Cy3 plus (PerkinElmer), goat anti-rabbit (Abcam) with biotinylated tyramide/Streptavidine-Alexa 750 conjugate (PerkinElmer) and anti-mouse Envision (K4001) with Cy5-tyramide (PerkinElmer). Nuclei were highlighted using DAPI. Residual horseradish peroxidase activity between incubations with secondary antibodies was eliminated by exposing the slides twice for 7 min to a solution containing benzoic hydrazide (0.136 mg) and hydrogen peroxide (50 µl). Finally, slides were mounted with ProLong Gold. Antibodies to specifically detect the markers had been previously validated in our laboratory.13 20 Validation and details of both multiplexing protocols are shown in online supplemental figure S1.
Image acquisition and image analysis for TILs
The entire tumor and surrounding stromal areas of each case (n=179) were scanned using a Vectra Polaris microscope (PerkinElmer). Depending on the biopsy size, each patient’s sample was represented between 1 and 555 fields of view. Then, these images were analyzed using InForm (V.2.4.8, PerkinElmer), an automated image analysis software. For each case, a tissue/cell segmentation algorithm was created using 5–10 representative fields of view. These images were used to train the software to define background, tumor and stromal compartments based on the marker staining of these areas. Then, cell segmentation parameters were selected to identify and segment individual cells based on nuclear DAPI staining. The cell segmentation performance was controlled by direct visualization of samples by a trained observer and did not include membrane or cytoplasmic features that could affect the accuracy.27–29 Next, the software was trained to recognize cell subtypes based on marker expression (CD8 for effector T cells, CD4 for helper T cells, CD20 for B-lymphocytes, cytokeratin for tumor epithelial cells and absence of these markers for ‘other stromal cells’). Once the algorithm was created, it was applied to the rest of the images of each individual case. Finally, the images were reviewed using visual inspection to ascertain reproducibility and modify or exclude those with suboptimal phenotyping (figure 1A).
Once all the images were analyzed, the information was processed using Akoya’s R package PhenoReports(https://akoyabio.github.io/phenoptrReports/index.html). This tool merges the data from all the individual field of view images of a particular case and creates a data file containing information related to individual cell events, density in each tissue compartment (number of positive cells per mm2), marker-based phenotype and spatial location within the specimen (X and Y coordinates).
Whole-exome sequencing and T cell receptor burden
Genomic DNA (gDNA) was extracted from 192 pretreatment primary NSCLC FFPE samples treated with ICI to perform whole-exome DNA sequencing, using a protocol previously described.19 30 31 In brief, 150–500 ng of gDNA was extracted using Qiagen AllPrep DNA/RNA Mini kits. DNA was fragmented with acoustic shearing followed by size selection to obtain inserts in the range of 300–650 bp prior to library preparation using the Kapa HyperPrep kit and quantification and normalization using PicoGreen. The Illumina TruSeq DNA exome kit was used for adaptor ligation, followed by paired end sequencing on a HiSeq2500. Next, the MiXCR32 algorithm was used to identify reads from the tumor BAM files corresponding to rearranged T cell receptor (TCR) clonotypes. To determine the TCR fraction in each sample and given variation in read depth, total rearranged reads were normalized by total aligned reads per sample. Finally, the ratios were log2 transformed and z-scored prior to survival analysis. The clinicopathologic characteristics of the cases included in the NSCLC cohort analyzed using whole-exome DNA sequencing is provided in online supplemental table S2.
Image acquisition and analysis for T cell exhaustion markers
Quantitative measurement of the fluorescent signal was performed using the AQUA® (Navigate BioPharma) method that enables objective and sensitive measurement of targets within user-defined tissue compartments.13 33 Briefly, the QIF score of each marker in the CD3 T cell compartment from the whole-tissue section was calculated by dividing the target pixel intensities by the area of CD3 positivity. Scores were normalized to the exposure time at which the images were captured, allowing scores collected at different exposure times to be comparable. To account for batch effects, we further rescaled the scores, using the median of each batch as reference, allowing us to reliably compare samples stained at different time points. Finally, all the stained slides were examined and cases with staining artifacts were excluded.
Rao’s Quadratic Index on cell population
In order to obtain the Rao’s Q Index (RQI) for each sample, the Cartesian position of each cell was obtained and given as two coordinates, x (horizontal) and y (vertical), with reference to a zero position P (0,0) at the lower left corner of each sample. Five different matrices were generated for the five types of cells detected (CD4+, CD8+, CD20+, tumor and other stromal cells). For RQI to be calculated, each matrix is transformed into a raster layer. As being inherently an image spatial data representation, it is depicted in pixels. To compare across samples, an empty canvas is created of a raster layer with specific parameters (number of columns=100, number of rows=100, x, y, min and max=limits of the coordinates), with the same dimension across the samples. It rasterizes the initial matrix into a pixelated layer, similar to a heatmap, which from each pixel is indicative of quantity of cells (1 pixel size=(max x dimension)/100 by (max y dimension)/100). If a number of n cells with x, y coordinates fall within a pixel of specified size, then a value is generated (from 0 to 1), for which the highest pixel value is indicative of the maximum number of cells per sample to fall in a pixel space. RQI is calculated among all the combined cell types (RQI_A: CD4+, CD8+, CD20+, tumor and other stromal cells). Finally, in order to compare across samples, the final RQI value for each patient was selected as the mean of the top 10% of the values from each raster.
Statistical analysis
For the statistical analysis, comparisons were performed using Mann-Whitney test for two groups and Fisher’s exact test for contingency tables. The survival analysis was done using Kaplan-Meier analysis and the univariate Cox proportional hazards model. Statistical differences were assessed by log-rank test quadratic-chi, respectively. All p values were based on two-sided test, and all values <0.05 were considered statistically significant. Statistical analyses were performed using JMP Pro software (V.15.0.0, 2019, SAS Institute, Cary, North Carolina, USA), GraphPad Prism (V.9.0.0, 2020, GraphPad Software, San Diego, California, USA) and R Studio (V.1.3.1093).
Results
Quantitative analysis and spatial distribution of TILs in NSCLC
Our cohort was composed of pretreatment tumor biopsy specimens from 179 patients, the majority of which were 65 years of age or older (50.7%), smokers (81.0%), with adenocarcinoma histology (73.0%) and received nivolumab monotherapy as ICI treatment (83.5%) (table 1). Most patients received ICI as second-line treatment.
Whole-slide baseline NSCLC samples were first studied with a multiplexed QIF panel containing the markers DAPI for all cells, cytokeratin (CK) for tumor epithelial cells, CD4 for helper T cells, CD8 for cytotoxic T cells and CD20 to highlight B-lymphocytes (figure 1A). To mimic a clinical-like scenario where full slides are evaluated and to avoid spatial selection bias, the sample acquisition included the complete tumor areas. The median number of individual 20× magnification fields of view analyzed per case was 132 (range 1–555). Individual cell subpopulations were identified and segmented based on lineage marker expression and selectively counted in the total tissue area, in the CK-positive tumor-cell area or in the CK-negative stromal compartment. The mean number of individual cells obtained per case was 486,538 (range 1782–2,736,560). To make the cell numbers comparable across tissue compartments of different size and between cases, results were expressed as cell densities (cells/mm2).
As expected, the TIL markers displayed a membranous-like staining pattern and identified distinct cell populations in the tumor microenvironment. CD8+ and CD4+ T cells showed a scattered distribution and CD20+ B cells were predominantly forming focal, nodular peritumoral aggregates consistent with tertiary lymphoid structures (TLS), found in 45.2% of cases (figure 1A). The presence of TLS was not prominently associated with survival and it was significantly more common in cases including a high number of FOVs analyzed (online supplemental figure S3), supporting that their identification is dependent on the sample size. There was a wide range of TIL scores across the cohort with a fraction of cases displaying a virtual lack of lymphocyte infiltration, and cases with prominent TIL levels. In the total tissue area (eg, tumor-cell nests and non-tumor stromal area), CD8+ T cells were the most abundant subtype with a mean of 462.2 cells/mm2 followed by CD4+ cells with 446.7 cells/mm2 and CD20+ cells with 223.4 cells/mm2 (figure 1B). Regarding the percentage of total cells corresponding to each of the TILs subtypes across the cohort, CD8+ cells represented a relatively large fraction with an average of 46.3%, CD4+ showed a comparable proportion of 43.5% and CD20+ comprised for a prominently smaller fraction with 10.3% (figure 1C). We also explored the relationship between the density of CD8+, CD4+ and CD20+ cells and found modest but statistically significant positive correlations, (Pearson’s r: 0.42 and r: 0.31, respectively, figure 1D).
Supplemental material
We then studied the distribution of TILs within specific tissue compartments. All TIL subsets were significantly more abundant in the stromal than in the tumor-cell area (figure 1E). Overall, TILs represented 30% of cells in the stromal compartment, with a comparable proportion of CD8+ and CD4+ T cells (39.2% and 38.9%, respectively) and a lower fraction of CD20+ B cells (21.9%). In contrast, TILs accounted for only 3.05% of cells within the tumor-cell nests, with CD8+ cells representing the vast majority with 62.7%, followed by 30.3% CD4+ cells and 7% CD20+ B-lymphocytes (figure 1F). Together, these results reveal that TILs show an uneven distribution in NSCLC tissues with overall increased presence in peritumoral stroma and marked predominance of effector CD8+ cells relative to other TIL subsets within the epithelial tumor-cell nests.
Clinical significance of TILs in NSCLC
To explore associations between TIL subsets and clinicopathologic variables, we stratified the cases using the median marker scores. We found significantly higher levels of CD4+ T cells in woman than in men and higher levels of T cells in PD-L1 positive cases (eg, PD-L1 TPS ≥1% using 22c3 assay). However, no additional associations between the levels of TILs and age, histologic type, smoking status, or clinical stage were identified (online supplemental table S1).
As expected, the density of all stromal TIL subsets was higher in PD-L1 positive cases than in PD-L1 negative tumors (TPS <1%). However, this association was statistically significant only for T cell and not for B cells (figure 2A). We then studied the association of TILs with survival after treatment with PD-1 axis blockers in the cohort. To avoid the limitations of selecting a single stratification cut-point and be able to determine the effect of continuous TIL levels, we used univariate Cox proportional hazard models. As expected, the density of TIL subpopulations across compartments was generally associated with better survival, but none of the markers showed a statistically significant difference for both progression-free survival (PFS) or overall survival (OS) (online supplemental figure S2A,B). The strongest association was for stromal CD8+ TILs that was significant for PFS but not for OS. Because of the prominent association between TILs and PD-L1, and the clinical differences between patients with PD-L1 expressing and non-expressing tumors, we decided to focus our analysis in these two patient subgroups. As shown in figure 2B,C, the density of stromal CD8+ T cells was consistently and significantly associated with improved PFS and OS (HR=0.228 (95% CI: 0.039 to 0.910) and HR=0.138 (95% CI: 0.0117 to 0.850), respectively) in PD-L1 positive cases, but not in cases with PD-L1 negative tumors (figure 2D,E). No consistent association with PFS and OS was seen with the other TIL subsets regardless of the PD-L1 status. These results indicate that the density of baseline stromal CD8+ TILs can stratify outcomes in patients with PD-L1 positive NSCLC treated with ICI. Similar results were seen after stratifying cases using 50% TPS PD-L1 IHC scores, but there were fewer cases in this category limiting the statistical analysis.
Supplemental material

Stromal CD8+ effector T cells are associated with better outcome after ICI in NSCLC cases with PD-L1 expressing tumors. (A) TILs density by compartment based on PD-L1 status. (B–E) Forest plots showing the PFS and OS Hazard ratios calculated for the continuous levels of each TIL marker using a Cox univariate model in PD-L1 positive (B and C) and negative cases (D and E). (F–I) Kaplan-Meier graphical analysis of the PFS and OS of cases in the cohort stratified by high (top 15% of scores) and low (bottom 85% of scores) density of stromal CD8+ T cells in the PD-L1 positive and negative group. ICI, immune checkpoint blockers; NSCLC, non-small cell lung cancer; OS, overall survival; PD-L1, programmed death ligand-1; PFS, progression-free survival; TIL, tumor infiltrating lymphocyte.
To visualize the survival effect of stromal CD8+ TILs using a binary class stratification, we conducted exploratory Kaplan-Meier graphical analysis using the top 15% density as stratification cut-point. As shown in figure 2F,G, elevated density of stromal CD8+ T cells was associated with longer PFS and OS in patients with PD-L1 positive tumors and this effect was not seen in the PD-L1 negative setting using the same marker cut-point (figure 2H,I). Additional cut-points tested provided similar results, which is consistent with the survival effect seen using the continuous scores across the entire marker range (figure 2B–E).
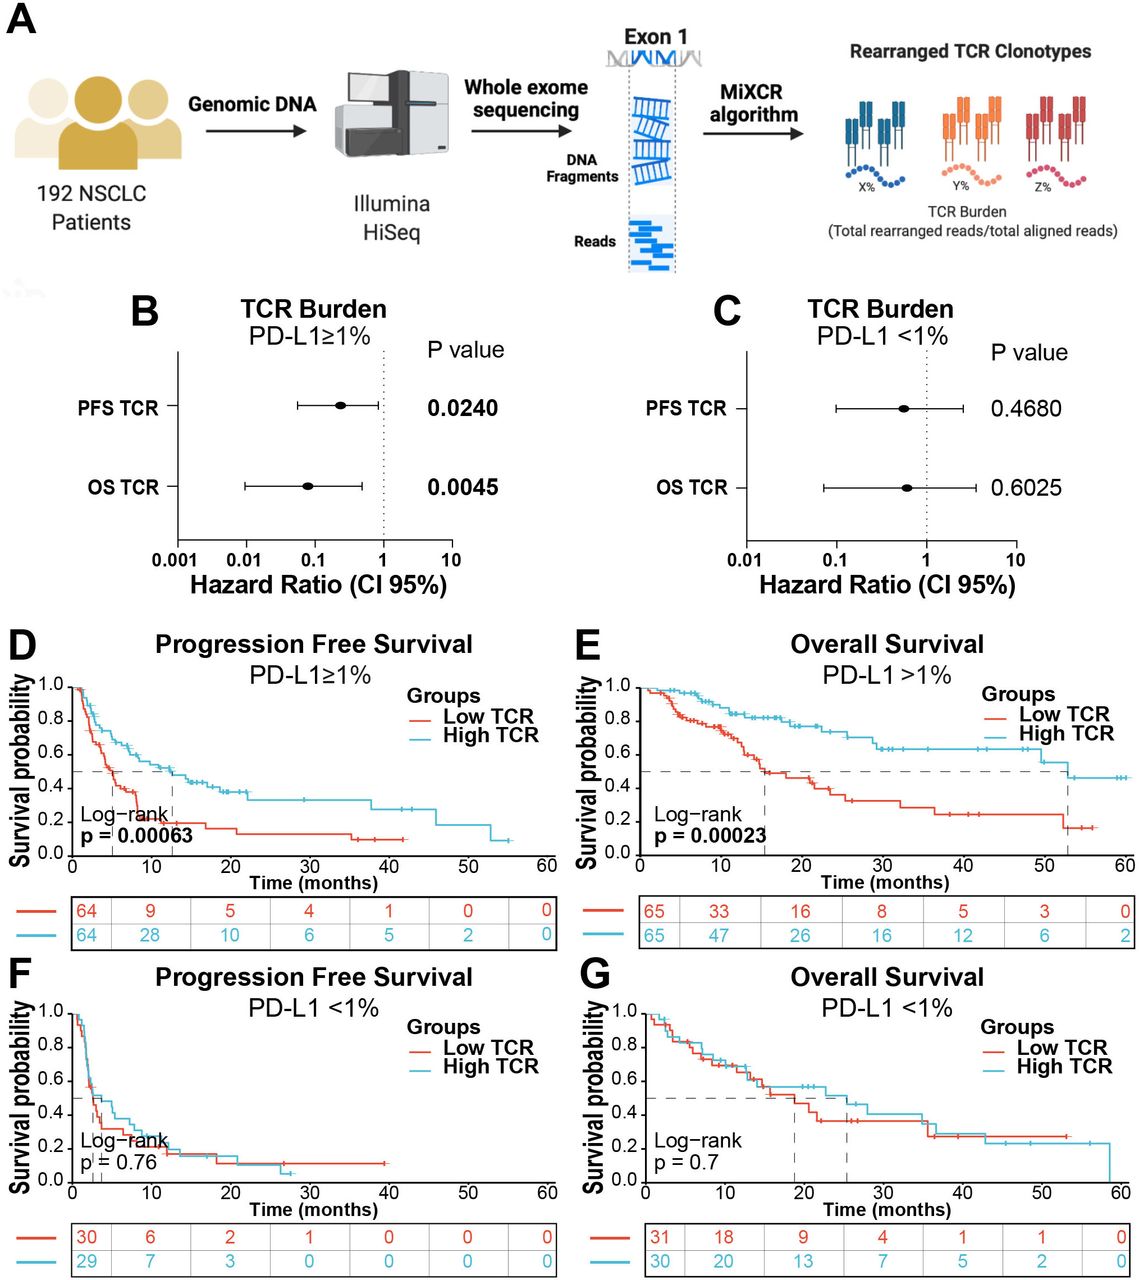
To validate the capacity of TILs to stratify outcomes in PD-L1 positive cases treated with ICI using an orthogonal approach and an independent cohort, we analyzed the TCR burden in a collection of 192 baseline primary NSCLCs using whole-exome DNA sequencing. The T cell fraction was calculated by dividing the total number of reads across all TCR clonotypes in a sample by the read depth for that sample using MiXCR algorithm (figure 3A), as previously reported.34 As shown in figure 3B,C, the T cell fraction was significantly associated with better PFS and OS only in PD-L1 positive cases, but not in those lacking PD-L1 expression. Stratification of cases using the median score showed a prominent survival advantage of an elevated T cell fraction in PD-L1 expressing tumors (figure 3D,E), whereas there was no effect on survival in PD-L1 negative patients (figure 3F,G).

The TCR fraction is associated with better outcome after ICI in PD-L1 positive NSCLC cases. (A) Overview of the TCR burden analysis protocol. (B) Forest plots showing the PFS and OS Hazard ratios of cases in the NSCLC cohort using a Cox univariate model. Cases were stratified by PD-L1 expression into positive (B) and negative (C) by immunohistochemistry. (D). Kaplan-Meier graphical analysis of PFS (D) and OS (E) of NSCLC cases stratified by the median TCR fraction and by PD-L1 status (F and G). ICI, Immune checkpoint inhibitors; NSCLC, non-small cell lung cancer; OS, overall survival; PD-L1, programmed death ligand-1; PFS, progression-free survival; TCR, T cell receptor.
T cell exhaustion/dysfunction markers are associated with worse outcome in ICI treated patients with NSCLC
Activated effector and tumor-antigen specific T cells in the tumor microenvironment of human NSCLC can undergo functional alterations known as T cell exhaustion, characterized by upregulation of multiple immune inhibitory receptors such as PD-1, LAG-3, and TIM-3.17 18 20 35 To determine the presence and impact of dysfunctional T cells on outcomes following treatment with ICI in NSCLC, we analyzed the cohort cases using a QIF panel containing the markers DAPI, CD3 (for all T cells), PD-1, LAG-3, and TIM-3. Cases were analyzed using the AQUA® QIF platform based on fluorescence co-localization and selective target measurement in marker-derived tissue compartments (eg, CD3+ T cells), as previously reported.20 This strategy was selected over single-cell phenotype analysis used for TIL subsets to capture both the density and continuous protein expression levels of the dysfunction markers within CD3+ T cells.
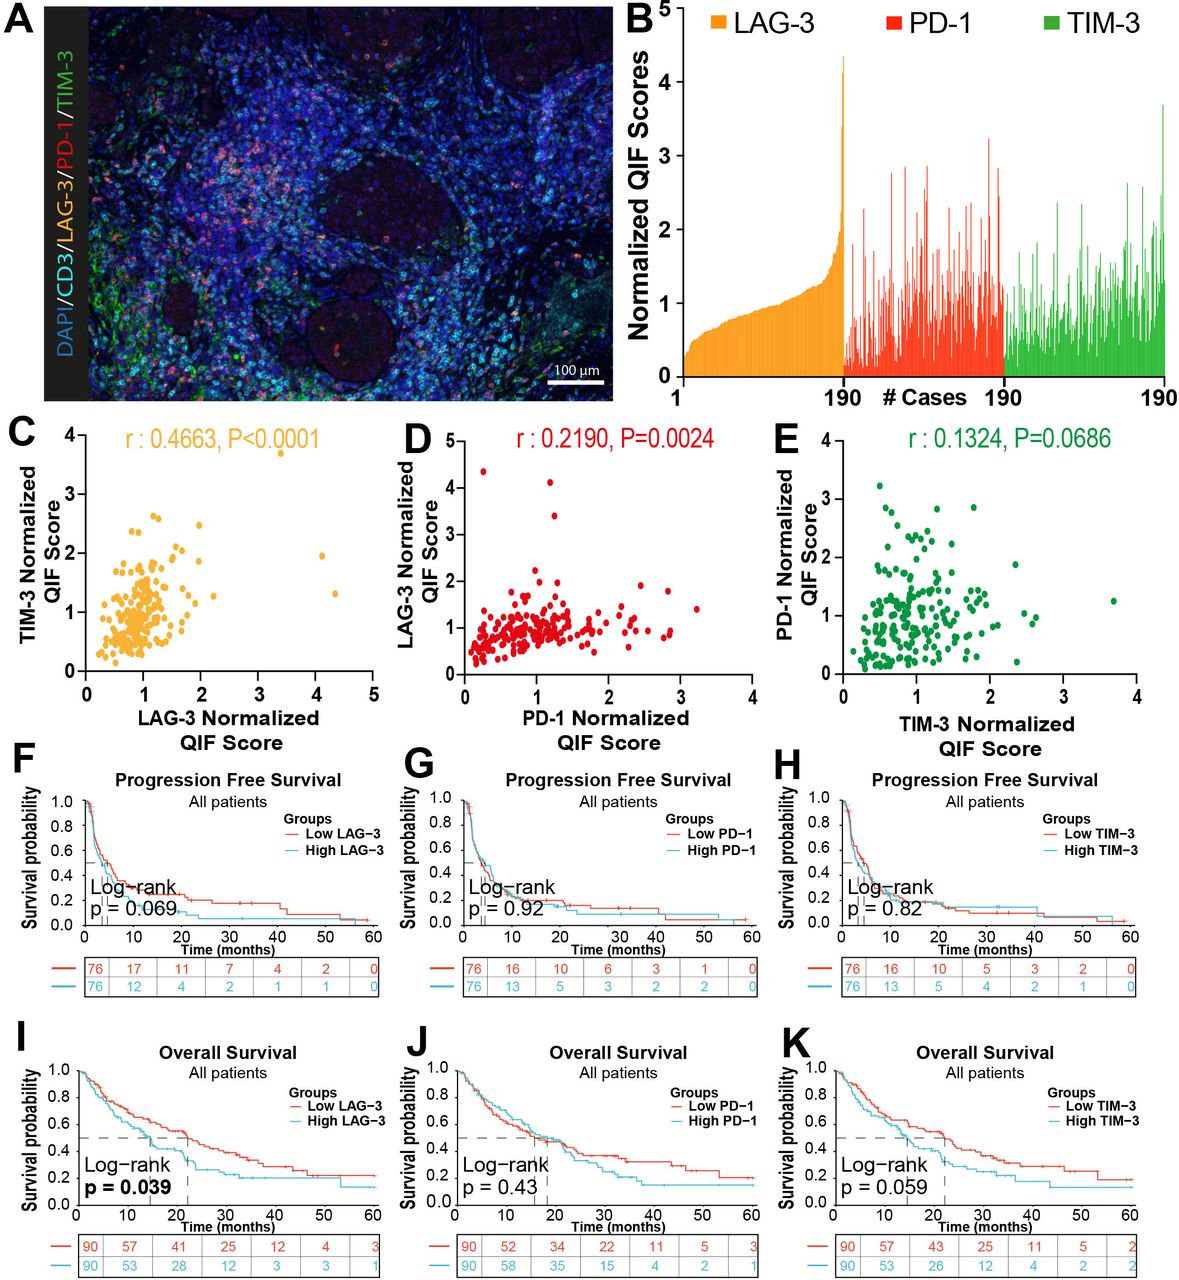
PD-1 and LAG-3 were predominantly detected and frequently co-localized in CD3+ T cells with a membranous-like staining pattern (figure 4A). TIM-3 signal was detected in both CD3+ T cells and in CD3– populations with morphology consistent with tumor-associated macrophages. The levels of T cell PD-1, LAG-3 and TIM-3 showed a continuous distribution across cases and there was a positive association between them, supporting their concurrent upregulation in the context of T cell exhaustion/dysfunction (figure 4B–E).

Elevated T cell exhaustion/dysfuntion markers are associated with worse outcomes after ICI in NSCLC. (A) Representative multicolor immunofluorescence captions showing DAPI (dark blue), CD3 (cyan), LAG-3 (orange), PD-1 (red) and TIM-3 (green) staining in NSCLC cases. (B) Bar plot for the distribution of the normalized expression of exhaustion markers in the CD3 compartment across the cohort. (C–E) Correlation between expression of TIM-3 and LAG-3 (C), LAG-3 and PD-1 (D), PD-1 and TIM-3 (E). Results show Pearson’s r correlation coefficient. (F–K) Kaplan-Meier graphical analysis of the progression-free survival and overall survival for the normalized QIF scores for LAG-3, PD-1 and TIM-3 measured selectively in CD3+ T cells. DAPI, 4’,6-Diamidino-2-Phenylindole; NSCLC, non-small cell lung cancer; TIM-3, T cell immunoglobulin mucin-3; LAG-3, lymphocyte-activation gene 3 (LAG-3); PD-1, programmed cell death protein-1; QIF, quantitative immunofluorescence.
The levels of TIM-3 were significantly higher in PD-L1 positive cases. No other associations were found between T cell exhaustion markers and clinicopathologic variables (online supplemental table S3). Elevated levels of T cell LAG-3 or TIM-3 using continuous scores were associated with lower PFS and OS, with variable statistical significance across endpoints (online supplemental figure S2C,D) and this effect was not seen for T cell PD-1 signal. A comparable result was visualized using Kaplan-Meier graphical analysis of cases stratified using the median marker scores (figure 4F–K). The survival effect of elevated T cell LAG-3 and TIM-3 was similar across PD-L1 positive and negative cases (online supplemental figure S2E–H). Together, these results support that elevated T cell exhaustion markers are associated with reduced survival benefit after ICI, and are consistent with previous studies20 36
Spatial immune heterogeneity and survival effect in ICI treated patients with NSCLC
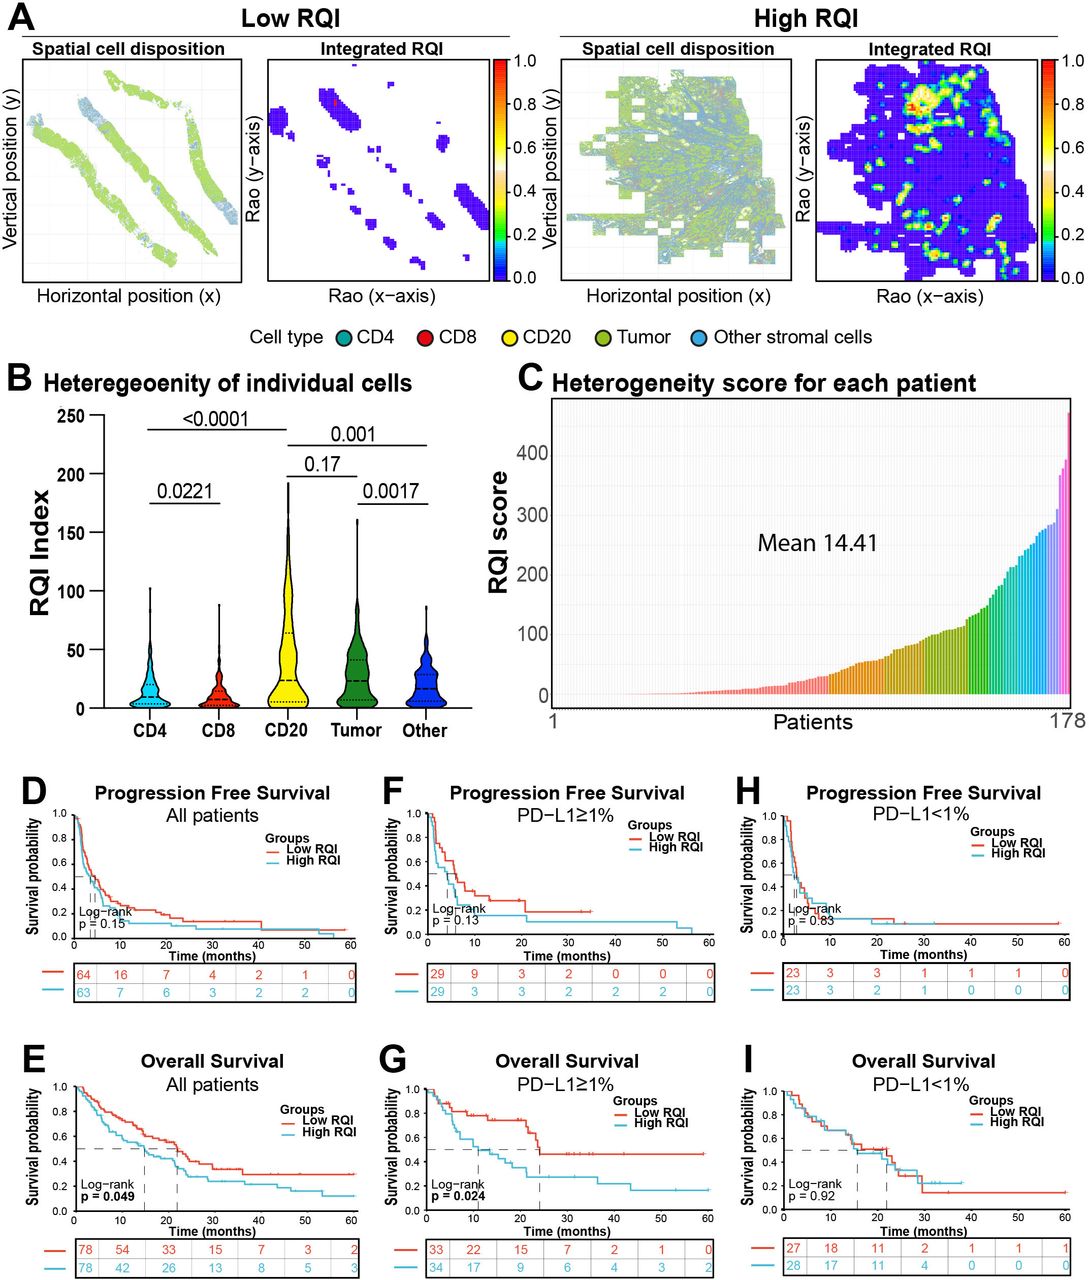
Tumor genomic and spatial heterogeneity have been recognized as prominent factors involved in cancer progression and therapeutic resistance.37 38 However, the possible role of spatial immune heterogeneity remains largely unexplored,25 at least in part, due to the lack of standardized and well accepted metrics able to fully capture the complexity and multidimensional nature of this feature. To overcome these limitations we measured spatial immune heterogeneity in the cohort using a multiparametric quadratic entropy metric termed RQI previously used to measure biodiversity on remotely sensed data.39 To measure RQI, the pairwise distance between all the cells (eg, tumor, CD4+, CD8+, CD20+ and stromal cells) was calculated using continuous scores and then multiplied by the relative abundance of each pair of cells in the images analyzed. Finally, the values were added to produce a final integrated score. This approach allowed us to convert and integrate the density and positional information of multiple TIL subsets using continuous values within each tumor sample. In this context, high immune heterogeneity refers to tumors in which there is a high diversity of cell types and uneven relative distribution of them. Graphical representations of the RQI in NSCLCs with low or high immune heterogeneity are shown in figure 5A. To understand the contribution of each TIL subset to spatial immune heterogeneity in NSCLC samples, we first calculated the RQI for each cell population (online supplemental figure S4A). As shown in figure 5B, B cells were the most heterogeneous lymphoid population followed by CD4+ helper and CD8+ cytotoxic T cells. These results were consistent with the visual spatial patterns of TILs and their calculated spatial coefficient of variation across fields of view (not shown). After calculating the integrated RQI of all cells including tumor cells, TILs and non-immune populations, we found a continuous distribution and a wide range across the cohort cases with a mean value of 14.41 (figure 5C). This indicated the possibility of using the RQI as a continuous metric of spatial immune heterogeneity and study its association with clinical parameters. No clinicopathological variables were associated with heterogeneity (online supplemental table S4). Interestingly, cases with higher spatial immune heterogeneity stratified by the median cohort score showed numerically shorter PFS and a statistically significantly shorter OS (figure 5D and E). These results were not seen for RQI of individual T cell and B cell subsets (online supplemental figure S5A–L), which reflects that spatial immune heterogeneity is a multidimensional property of broader immune infiltration rather than specific of a particular cell population. Additional survival analysis using the median RQI as stratification cut-point showed that elevated spatial immune heterogeneity was prominently associated with worse survival in PD-L1 positive cases (figure 5F,G) but this effect was not seen in PD-L1 negative patients (figure 5H,I). Notably, there was limited association between the densities of different cell populations and the RQI (online supplemental figure S4B–G), supporting the independent effect of spatial heterogeneity. These results identify a continuous integrated metric of spatial immune heterogeneity associated with outcomes in patients with NSCLC treated with ICI.
Supplemental material
Supplemental material

High spatial immune heterogeneity is associated with worse survival after ICI in NSCLC. (A) Graphical representation of cases with low RQI (left) and high RQI (right) immune heterogeneity scores. (B) Violin plot showing the RQI in individual cell subsets obtained from NSCLCs in the cohort. (C) Bar Plot showing the distribution of the for the integrated RQI scores calculated from all cell subsets in the cohort cases. (D–E) Survival analysis of progression-free survival and overall survival of NSCLC cases stratified by the mean integrated RQI of the cohort. (F–G) Survival analysis of cases stratified by the mean integrated RQI based on the PD-L1 status. NSCLC, non-small lung cancer; PD-L1, programmed death ligand-1; RQI, Rao’s Q Index.
Discussion
Using quantitative and spatially resolved analysis of pretreatment whole slide tumor specimens, we have addressed the association of major TIL subsets, T cell exhaustion markers and spatial immune heterogeneity with outcomes after ICI treatment in patients with NSCLC. Our results establish a prominent association of TIL metrics with survival and highlight the biological and clinical relevance of adaptive antitumor immune responses in NSCLC.
Work by our group and others have previously established a prognostic role of TILs in NSCLC.13 40 41 However, many of these studies have been conducted using semi-quantitative TILs scoring methods or including only partial representation of tumor samples. In addition, only few studies have addressed the outcome effect of specific TIL subsets in patients with NSCLC treated with ICI.41 42 Our results reveal prominent differences in the immune composition across NSCLCs and an uneven/irregular distribution of TIL across tumor tissue compartments. Careful measurement of TIL densities uncovered a consistent role of stromal CD8+ TILs to stratify PFS and OS in PD-L1 expressing cases, and a similar finding was obtained by analyzing the total T cell burden (eg, TCR fraction) by DNA whole-exome sequencing in patients from an independent NSCLC cohort. Notably, a significant and consistent survival effect was not seen in cases lacking PD-L1 protein expression. Previous studies have shown a positive association between high levels of CD4 and prognosis in immunotherapy-treated patients with melanoma43; however, in our cohort we found that the density of CD4+ T cells in the stromal compartment was only significantly associated with PFS but not with OS, which shows that the strength of this association could be tumor type dependent. Our findings support the hypothesis that patients with tumors containing both PD-L1 expression and high baseline effector TILs have better outcome after ICI and this information could be used to decide optimal treatment options and/or avoid overtreatment using potentially toxic combinatorial regimens.
Our results are consistent with a previous study by Fumet et al using RNA sequencing and showing that a combination of CD8A and CD274 messenger RNA transcripts was associated with longer PFS in patients with advanced NSCLC treated with PD-1 axis blockers.41 Together, these results support the notion that to be clinically effective, PD-1 axis blockers require both PD-L1 expression as well as a critical mass of pre-existing cytotoxic T cells in the tumor microenvironment.
Consistent with previous reports, the amount of CD20+ B cells within tumor-cell nests was significantly associated with favorable OS in PD-L1-expressing cases, supporting a role of this population in ICI outcomes.16 44 45 B cells can produce immunoglobulins, present HLA class-II antigens and are commonly identified in tumors forming nodular aggregates known as TLS displaying a patchy/heterogeneous tissue distribution.46 We identified focal peritumoral B cell aggregates morphologically compatible with TLS in 45.2% of cases in the cohort. However, the presence of TLS was associated with the area of tumor tissue analyzed suggesting its dependency on the sample size. In addition, CD20+ B cells showed the highest RQI spatial heterogeneity score among all the studied cell populations. The prominent spatial heterogeneity and relatively low occurrence of TLS in tumor tissue slides could limit the association of CD20+ B-lymphocytes with survival. Since the multiplexed QIF panels used to measure TILs have been standardized to study conventional FFPE tumor specimens, incorporation of such tests into clinical pathology laboratory workflow is not expected to represent a major challenge.
In the tumor microenvironment, T cells undergo an antigen-mediated dysfunctional program referred to as ‘T cell exhaustion’ characterized by altered differentiation and cytolytic properties, de-regulated proliferation/death programs and increased expression of multiple immune inhibitory signals such as PD-1, LAG-3, TIM-3, TIGIT and CD39.17 20 35 47 While the presence of exhausted effector T cells has been extensively described in chronic viral infections and cancer, the biological properties and clinical significance remain incompletely understood. Our studies selectively measuring PD-1, LAG-3 and TIM-3 protein levels on TILs show variable levels of T cell exhaustion across NSCLCs and support concurrent upregulation of these immune inhibitory receptors. Consistent with a previous study by our group using a different patient cohort of patients treated with ICI,20 elevated levels of T cell LAG-3 were associated with shorter survival, but this was not seen with PD-1. Recent preliminary studies using single cell RNA-sequencing analysis of TILs have also supported a role of T cell exhaustion in resistance to ICI in NSCLC and melanoma.18 36 It is tempting to speculate that patients with tumors containing abundant exhausted T cells could benefit more from therapies targeting alternative immune inhibitory receptors upregulated in this setting. The recent regulatory approval of the combinatorial treatment using the anti LAG-3 antibody relatlimab-rmbw with the anti PD-1 monoclonal antibody nivolumab in patients with advanced melanoma further supports this notion.
It has been proposed that the spatial tumor architecture and intratumor heterogeneity could play a role in tumor development and response to treatment.48 However, efforts to systematically measure spatial features have been limited by the lack of standardized metrics able to capture multidimensional and continuous spatial parameters.49 To address this, and for the first time to our knowledge, we measured the spatial immune heterogeneity of NSCLCs using the quadratic entropy RQI. This metric takes into account not only the richness (continuous number of cell types) and evenness (relative abundance of different cell types), as other classic metrics, but also the pairwise distance between all the cells included in the model. Additionally, it is considered a multilayered approach that incorporates individual cell types and integrates them into a single heterogeneity raster. Therefore, the RQI is a continuous score that can be used to measure the level of spatial immune heterogeneity allowing comparisons across cases or between tumor types, and also potentially longitudinally after treatments.
We show that the spatial heterogeneity of TILs expressed as RQI is highly variable across NSCLCs and high levels are associated with poor survival after ICI. Although the biological determinants for this association are currently uncertain, it is possible that complex tumors displaying higher immune or antigenic heterogeneity are equipped with prominent and/or more effective immune evasion mechanisms supporting their adaptation to immune pressure. Future studies will be required to explore whether highly heterogenous areas within the tumor microenvironment are enriched in immunotherapy resistant tumor subclones. It would also be important to address the relationship between spatial and genetic heterogeneity, and develop candidate therapeutic options.
Our work has numerous limitations. First, we studied a multi-institutional cohort of cases collected retrospectively and treated using standard of care ICI. Cases in this cohort received different therapies and they were administered in a non-controlled fashion. In addition, some cases included samples collected long before initiation of treatment and received intervening therapies that could affect the immune contexture. Today’s treatment paradigm of most patients with advanced NSCLC consists in the combination of ICIs with chemotherapy as first-line treatment, which could confound the role of biomarkers and the relative contribution of each treatment. This potentially negative effect was minimized in our cohorts since most patients received ICI monotherapy as the second-line treatment, with platinum doublets as the first-line treatment. Validation of findings and cut-points in an independent cohort will be required to address the generalizable nature of our findings and leverage their translational potential.
In summary, we have quantitatively measured the density, functional properties, and spatial distribution of major TIL subsets in a large immunotherapy treated NSCLC cohort. Our study supports that: (1) stromal CD8+ effector T cells are the most abundant TIL subpopulation and are associated with better outcome after immunostimulatory therapies in PD-L1 positive cases; (2) TLS are heterogeneously distributed in NSCLC, have limited association with outcomes and their detection depends on the size of the tissue area analyzed; (3) the TCR-fraction calculated from whole-exome DNA sequencing data is associated with better survival only in PD-L1 positive cases; (4) elevated T cell exhaustion markers selectively measured on TILs are associated with reduced sensitivity to ICI; and (5) we established a novel metric based on multiparametric quadratic entropy to systematically measure an compare spatial immune heterogeneity, and evidenced its association with worse survival after ICI in patients with NSCLC.
Data availability statement
No data are available.
Ethics statements
Patient consent for publication
Ethics approval
This study was conducted in accordance with the principles of the Declaration of Helsinki and all tissue and clinical information were used in a de-identified fashion after approval from the Yale Internal Review Board (Yale Human Investigation Committee) protocols #9505008219 and #1608018220 or local institutional protocols, which approved the patient consent forms or waiver of consent.
References
Supplementary materials
Supplementary Data
This web only file has been produced by the BMJ Publishing Group from an electronic file supplied by the author(s) and has not been edited for content.
Footnotes
Twitter @MLopezdeRodas
MDH, JG and KAS contributed equally.
Contributors Study concept and design MDH, JG and KAS. Resources and samples DLR, RSH, AM, JWR, VV, MDH and JG. Data acquisition and analysis MLdR, VN, AR, IJD, MM-K, GC, CB and LB. Manuscript drafting and approval MLdR, AR, CB, DLR, RSH, AM, JWR, VV, MDH, JG and KAS. Study supervision MDH, JG and KAS. Guarantor: KAS.
Funding Funded by Stand Up To Cancer – American Cancer Society Lung Cancer Dream Team Translational Research Grant SU2C-AACR-DT1715, Mark Foundation EXTOL project 19-029-MIA, NIH grants R03CA219603 (KAS), R37CA245154 (KAS), and R01CA262377 (KAS).
Competing interests JG has served as a compensated consultant or received honoraria from Bristol Myers Squibb, Takeda, Loxo/Lilly, Blueprint, Oncorus, Regeneron, Gilead, Moderna, AstraZeneca, EMD Serono, Pfizer, Novartis, Merck, and GlydeBio; research support from Novartis; institutional research support from Bristol Myers Squibb, Tesaro, Moderna, Blueprint, Jounce, Array Biopharma, Merck, Adaptimmune, Novartis, and Alexo; and has an immediate family member who is an employee with equity at Ironwood Pharmaceuticals. AR has served as a consultant for Halo and Tyra. AM is an equity holder in Elucid Bioimaging and in Inspirata. In addition, he has served as a scientific advisory board member for Inspirata, AstraZeneca, Bristol Meyers Squibb and Merck. Currently he serves on the advisory board of Aiforia and currently consults for Caris, Roche, Cernostics and Aiforia. He also has sponsored research agreements with Philips, AstraZeneca, Boehringer-Ingelheim and Bristol Meyers Squibb. His technology has been licensed to Elucid Bioimaging. He is also involved in three different R01 grants with Inspirata. MM-K has served as a compensated consultant for H3 Biomedicine and AstraZeneca and has received research (institutional) funding from Novartis and royalty from Elsevier, all of which are not related to this work. JWR reports institutional research support from Spectrum, AstraZeneca, Novartis, Merck, Revolution Medicines. JWR has received honoraria for consultant/advisory roles from EMD Serono, Daiichi Sankyo, BMS, Beigene, Turning Point, Janssen, Novartis, Boehringer Ingelheim, Blueprint, Regeneron. KAS reports research funding from Navigate Biopharma, Tesaro/GlaxoSmithKline, Moderna, Takeda, Surface Oncology, Pierre-Fabre Research Institute, Merck Sharp & Dohme, Bristol Myers Squibb, AstraZeneca, Ribon Therapeutics, Eli Lilly, Boehringer Ingelheim and Akoya Biosciences. KAS has received honoraria for consultant/advisory/speaker roles from Moderna, Shattuck Labs, Pierre-Fabre, AstraZeneca, EMD Serono, Ono Pharmaceuticals, Clinica Alemana de Santiago, Dynamo Therapeutics, PeerView, AbbVie, Fluidigm, Takeda/Millenium Pharmaceuticals, Merck Sharp & Dohme, Bristol Myers Squibb, Agenus, Torque Therapeutics, Genmab, Parthenon Therapeutics and OnCusp. AM’s research efforts are supported by grants from the National Cancer Institute under award numbers R01CA249992-01A1, R01CA202752-01A1, R01CA208236-01A1, R01CA216579-01A1, R01CA220581-01A1, R01CA257612-01A1, 1U01CA239055-01, 1U01CA248226-01, 1U54CA254566-01, National Heart, Lung and Blood Institute 1R01HL15127701A1, R01HL15807101A1, National Institute of Biomedical Imaging and Bioengineering 1R43EB028736-01, National Center for Research Resources under award number 1 C06 RR12463-01, VA Merit Review Award IBX004121A from the US Department of Veterans Affairs Biomedical Laboratory Research and Development Service the Office of the Assistant Secretary of Defense for Health Affairs, through the Breast Cancer Research Program (W81XWH-19-1-0668), the Prostate Cancer Research Program (W81XWH-15-1-0558, W81XWH-20-1-0851), the Lung Cancer Research Program (W81XWH-18-1-0440, W81XWH-20-1-0595), the Peer Reviewed Cancer Research Program (W81XWH-18-1-0404, W81XWH-21-1-0345), the Kidney Precision Medicine Project (KPMP) Glue Grant and sponsored research agreements from Bristol Myers Squibb, Boehringer-Ingelheim, and AstraZeneca.
Provenance and peer review Not commissioned; externally peer reviewed.
Supplemental material This content has been supplied by the author(s). It has not been vetted by BMJ Publishing Group Limited (BMJ) and may not have been peer-reviewed. Any opinions or recommendations discussed are solely those of the author(s) and are not endorsed by BMJ. BMJ disclaims all liability and responsibility arising from any reliance placed on the content. Where the content includes any translated material, BMJ does not warrant the accuracy and reliability of the translations (including but not limited to local regulations, clinical guidelines, terminology, drug names and drug dosages), and is not responsible for any error and/or omissions arising from translation and adaptation or otherwise.