Article Text

Abstract
Background The early diagnosis of hepatocellular carcinoma (HCC) can greatly improve patients’ 5-year survival rate, and the early efficacy assessment is important for oncologists to harness the anti-programmed cell death protein 1 (PD-1) immunotherapy in patients with advanced HCC. The lack of effective predicting biomarkers not only leads to delayed detection of the disease but also results in ineffective immunotherapy and limited clinical survival benefit.
Methods We exploited the single-cell approach (cytometry by time of flight (CyTOF)) to analyze peripheral blood mononuclear cells from multicohorts of human samples. Immune signatures for different stages of patients with HCC were systematically profiled and statistically compared. Furthermore, the dynamic changes of peripheral immune compositions for both first-line and second-line patients with HCC after anti-PD-1 monotherapy were also evaluated and systematically compared.
Results We identified stage-specific immune signatures for HCC and constructed a logistic AdaBoost-SVM classifier based on these signatures. The classifier provided superior performance in predicting early-stage HCC over the commonly used serum alpha-fetoprotein level. We also revealed the treatment stage-specific immune signatures from peripheral blood and their dynamical changing patterns, all of which were integrated to achieve early discrimination of patients with non-durable benefit for both first-line and second-line anti-PD-1 monotherapies.
Conclusions Our newly identified single-cell peripheral immune signatures provide promising non-invasive biomarkers for early detection of HCC and early assessment for anti-PD-1 immunotherapy efficacy in patients with advanced HCC. These new findings can potentially facilitate early diagnosis and novel immunotherapy for patients with HCC in future practice and further guide the utility of CyTOF in clinical translation of cancer research.
Trial registration numbers NCT02576509 and NCT02989922.
- biomarkers
- tumor
- immunotherapy
- liver neoplasms
Data availability statement
Data are available in a public, open access repository. Data supporting this publication are available at ImmPort (https://www.immport.org) under study accession SDY1733.
This is an open access article distributed in accordance with the Creative Commons Attribution Non Commercial (CC BY-NC 4.0) license, which permits others to distribute, remix, adapt, build upon this work non-commercially, and license their derivative works on different terms, provided the original work is properly cited, appropriate credit is given, any changes made indicated, and the use is non-commercial. See http://creativecommons.org/licenses/by-nc/4.0/.
Statistics from Altmetric.com
Background
Hepatocellular carcinoma (HCC) is the most common pathological type of primary liver cancer, accounting for 75%–85% of cases.1 Liver resection is the most effective treatment for early-stage HCC with a 5-year survival rate at approximately 70%.2–4 However, due to the inconspicuous clinical symptoms in early stage and the lack of accurate early diagnostic biomarkers, most patients with HCC are often diagnosed at advanced stage with a 1-year survival rate of less than 50% and a 5-year survival rate only of 10% even in high-income countries.5 Alpha-fetoprotein (AFP), the most widely used liquid biomarker in clinics, has a rather low sensitivity and accuracy when used to screen patients with HCC, resulting in 30%~40% of patients with undetectable HCC due to their normal AFP levels.6 7 Recently, multiple non-invasive biomarkers, including circulating tumor cells (CTCs), circulating tumor DNA and their methylation, extracellular vesicles (EVs), and gut microbiome,8–10 have been explored for early-stage HCC detection, aiming to complement the traditional screening methods, for example, liver ultrasonography, MRI, and AFP levels.11 12 However, these methodologies lack either specificity or feasibility due to different technical barriers, such as the selection of appropriate molecular biomarkers, inconsistent testing results with high variance, etc.4–13 Thus, these detection tools have not been fully optimized for clinical application. A non-invasive early detection method that is easily populated and also provides quantitative biomarkers with high sensitivity and stability is urgently needed.
For patients with advanced HCC, immunotherapy via the programmed cell death protein 1 (PD-1)/programmed cell death ligand 1 (PD-L1) axis has emerged as a promising therapeutic approach. The objective response rates (ORRs, an indicator for evaluating therapy efficacy) of anti-PD-1 blockade immunotherapy, including camrelizumab, nivolumab, and pembrolizumab for sorafenib-pretreated patients with HCC, have been increased to 15%~20%, which is three times greater than that of the sorafenib-only treatment.14–17 The efficacy of lenvatinib, as another targeted therapy, is also non-inferior to that of sorafenib, considering their overall survival rate.18 Despite the remarkable improvement in clinical benefit, PD-1 or PD-L1 blockades so far still benefit only a minority of patients with HCC. One possible reason for such low ORRs may be the intrinsically high heterogeneity in systemic immunity, pathogenesis, histopathology, and molecular basis of HCC.19 20 Previous studies have shown that biomarkers such as PD-L1 expression or tumor mutational burden (TMB) are related but not efficient enough to accurately evaluate the responsiveness of PD-1/PD-L1 blockade therapy in patients with advanced HCC.16 17 Therefore, predictive biomarkers or constructed methodology that can help to discriminate the final responsiveness of patients with HCC to PD-1/PD-L1 blockade therapy in advance are also urgently needed.
Recently, several studies have further revealed immunophenotypical compositions in HCC tumor microenvironment (TME) using high-dimensional single-cell analyses.21–26 These findings are significant in understanding the roles of specific cell subsets such as PD-1+ T cells in the progression of HCC as well as their responsiveness to blockade treatment. However, the tumor tissues are often unavailable for patients with advanced HCC, and liver biopsies are still with risks and may potentially bring severe complications including bleeding in patients with HCC who are usually accompanied by varying degrees of cirrhosis.27 28 Even if the biopsies are available, they do not well represent local TME due to intratumor heterogeneity. Instead, the blood-based method, as a feasible and sensitive alternative, is more appropriate for studying and dynamically monitoring the disease progression, treatment, and prognosis. Single-cell-based immune biomarkers from circulating blood have been used for tumor-related research29 and have also been proposed in predicting PD-1/PD-L1 blockade therapy efficacy in advanced melanoma.22
Hence, we applied mass cytometry (cytometry by time of flight (CyTOF)) to deeply profile the circulating immune system of patients diagnosed at different stages of liver tumor, including benign liver tumor (hepatic hemangioma (HH)) and malignant liver tumor at both early and advanced stages. The identified immune atlas reflects the great impact of tumor progression on the peripheral immune compositions, resulting in a few significant changes of some immune subsets in a stage-specific manner. These differences can further be used to construct a predictive classifier for early-stage HCC detection. We also explored the longitudinal changes of circulating immune compositions in patients with advanced HCC for the first 3 months during first-line and second-line anti-PD-1 monotherapies and disclosed the dynamic features of peripheral immune compositions that could be used to assess the patients’ final responsiveness 1 year later. This provides a creative single cell-based immune signature that can potentially be used for early effective response assessment of PD-1/PD-L1 immunotherapy for patients with HCC.
Methods
Patient samples
The patients enrolled in this study consisted of six groups: one group included 5 healthy donors (HDs); one group included 5 patients with histologically diagnosed early-stage colorectal cancer (CRC); one group included 14 patients with histologically diagnosed HH; and the other three groups included 38 patients histologically diagnosed with HCC who were further classified based on the Barcelona Clinic Liver Cancer (BCLC) criterion. Twenty-eight patients with HCC were classified as Barcelona Clinic Liver Cancer Stage A (or BCLC-A); 5 patients with HCC were classified as Barcelona Clinic Liver Cancer Stage C (BCLC-C) and had not received prior systemic therapy (BCLC-C HCCun); and 5 patients were classified as BCLC stage C and had experienced disease progression after first-line chemotherapy or targeted therapies (BCLC-C HCCtr).
Ten patients with HCC classified as BCLC-C underwent anti-PD-1 monotherapies. Five patients in the BCLC-C HCCun group received intravenous administration of nivolumab (BMS-936558; Bristol-Myers Squibb, Princeton, New Jersey, USA), an anti-PD-1 antibody, at a dose of 240 mg every 2 weeks until disease progression or unacceptable toxicity (Clinicaltrials.gov ID: NCT02576509). Five patients in the BCLC-C HCCtr group received intravenous administration of camrelizumab (SHR-1210; HengRui Medicine Co., Jiangsu, China), another anti-PD-1 antibody, at a dose of 3 mg/kg every 3 weeks until disease progression or unacceptable toxicity (Clinicaltrials.gov ID: NCT02989922).
Peripheral blood mononuclear cell (PBMC) samples from patient groups were collected either at the time of liver resection (HH, CRC, and BCLC-A HCC groups) or at the consecutive time during anti-PD-1 monotherapies (BCLC-C HCCun and BCLC-C HCCtr groups). The radiological evaluation was performed at 2-month intervals according to Response Evaluation Criteria in Solid Tumors (RECIST V.1.1) to evaluate the clinical benefits for the patients who had anti-PD-1 monotherapies. Detailed demographic and clinical information of individuals enrolled in this study are listed in online supplemental table 1.
Supplemental material
Processing of blood samples
Fresh blood samples in CRC, HH, and BCLC-A HCC groups were cryopreserved in cryotubes with serum and dimethyl sulfoxide (DMSO). After resuscitation, whole blood samples were lysed using ammonium-chloride-potassium (ACK) buffer at room temperature for 1~2 min to acquire single cells and then resuspended in flow cytometry staining (FACS) buffer. For blood samples from five patients with BCLC-C HCCtr (five patients×6~7 time points, n=31), EDTA-treated whole blood samples were lysed using ACK as described previously. For blood samples from five patients with BCLC-C HCCun (five patients×5~7 time points, n=29), EDTA-treated whole blood samples were separated by Ficoll density gradient centrifugation to the acquisition of PBMCs, and single cells were washed, centrifuged, and resuspended in FACS buffer. For 10 blood samples from five HDs (five HDs with two samples from the same donor), five samples were EDTA-treated and lysed using ACK as described earlier. Moreover, five samples were EDTA-treated and separated by Ficoll density gradient centrifugation to the acquisition of PBMCs.
Mass cytometry profiling
For blood samples processed with prior procedures, the single-cell suspensions were barcoded using 194Pt for 5 min for distinguishing live/dead cells, then treated with block mix for 20 min and stained with surface marker staining mix for 30 min on ice. After washing, resuspension, and centrifugation, these samples were incubated with DNA Intercalator 191Ir and 193Ir overnight at 4°C. Before running on mass cytometry (CyTOF), unique sample barcoding was performed on individual samples for 30 min. Finally, single cells were resuspended into deionized (DI) water, after the tuning and quality control (QC) procedures, the calibration beads were mixed with barcoded samples and collected with CyTOF with 500 events per second.
Clustering with self-organizing maps (SOMs)
Flow cytometry standard (FCS) files were debarcoded and transformed using the arcsinh function with a cofactor of 10. In total, nearly 20 million immune cells were collected after preprocessing for downstream analyses. We applied SOMs, an unsupervised artificial neural network, to initially cluster the pooled cells from target samples into the predefined 10×10 net. We randomly subsampled up to 4000 cells from each sample file to train the SOM network. Then, all the cells were clustered through the trained SOM network to profile the detailed immune compositions for individual samples. After that, the SOM clusters were further meta-clustered to achieve biologically meaningful subsets based on their similarity using hierarchical clustering and expert experiences.
We have applied the aforementioned clustering procedure separately twice. The first clustering targeted to analyze the samples consisting of HDs, different stages of liver tumor (early-stage HCC and advanced HCC at the time point before anti-PD-1 monotherapy (circle 0)), and the other cancer types (early-stage CRC), and involved a total of 14,324,743 immune cells. The second clustering specifically focused on the samples with anti-PD-1 monotherapy and involved a total of 8,194,113 immune cells. The SOM-based clustering procedure was implemented in MATLAB V.2019b (Deep Learning Toolbox).
Adaboost-SVM classifier
We implemented AdaBoost-SVM to establish a binary classifier to predict blood samples as early-stage HCC or not. We used RBFSVM (Support Vector Machine with the RBF kernel) as basic classifiers in AdaBoost; randomly selected 60% of all samples as prepared for the training dataset, including 3 HD samples, 9 HH samples, and 19 BCLC-A HCC samples from the original cohort (5 HD-ACK, 14 HH and 28 BCLC-A HCC samples); and labeled both HD and HH samples as class 0 and BCLC-A HCC as class 1. To balance the sample size for each category, we used Synthetic Minority Oversampling Technique (SMOTE)30 to extend each category to 19 samples and used it as the training dataset in practice. The left two HD-ACK, five HH, and nine BCLC-A HCC samples were used for validation. We standardized the balanced training dataset and the testing dataset by using the sklearn.preprocessing package31 with default settings. We then performed a grid search to obtain the optimal fixed parameters (C=2, γ=0.095) for basic RBFSVM classifiers and used it as the base estimator in AdaBoost training (main parameter setting: n_estimators=50, learning_rate=0.3). Finally, we evaluated the prediction performance of the AdaBoost-SVM classifier using the original cohort (5 HD-ACK samples, 14 HH samples, and 28 BCLC-A HCC samples). Both AdaBoost-SVM and SMOTE were implemented in Python V.3.7.6.
Statistical analysis
The data are presented in boxplots with the central mark indicating the median, and the bottom and top edges of the box indicating the 25th and 75th percentiles, respectively. We choose the default value for the whiskers of boxes corresponding to 99.3% coverage as the data are approximately normally distributed. Comparisons were performed with unpaired Student t-test (two-sided). Asterisks (*, **, and ***) represent p<0.05, p<0.01, and p<0.001, respectively. Comparisons in contingency tables were performed with Fisher’s exact test. Moreover, the p values reported in this study were not corrected for multiple hypothesis testing. Linear regression and Pearson coefficient were used to characterize the correlations between immune phenotypes. Spearman coefficients were used to characterize the correlations between cell clusters and treatment cycles of anti-PD-1 monotherapy.
Results
Major peripheral immune compositions are distinct among HDs, patients with HH, and patients with HCC
To reveal the changes of immune compositions along with the development of HCC in peripheral blood, we performed the single-cell mass cytometry (CyTOF) analyses to 57 PBMC samples from a prospectively designated cohort (figure 1A, online supplemental figure 1, and online supplemental table 1) which included 5 HDs, 14 patients with HH, 28 patients with HCC classified as BCLC-A HCC, and 10 patients with HCC classified as BCLC-C HCC who had previously been treated with (BCLC-C HCCtr0, n=5) or without (BCLC-C HCCun0, n=5) systemic therapies (including chemotherapy and sorafenib in this study). The predefined marker panel was specifically designed to mainly characterize the composition and function of leukocytes (online supplemental table 2). We obtained over 10 million cells in total to ensure accurate characterization. After data preprocessing (see the Methods section), we clustered CD45+ immune cells without granulocytes using the SOM algorithm32 33 and meta-clustering strategy (see the Methods section; online supplemental figure 2A). We further annotated these cell clusters into five major immune subsets (T cells, B cells, natural killer (NK) cells, monocytes, and dendritic cells (DCs)) based on the expressions of typical lineage markers, as displayed by two-dimensional t-distributed stochastic neighbor embedding (t-SNE) plots (figure 1B and online supplemental figure 2B). For each group, cells were consistently distributed across all major immune subsets, indicating rare batch effects in our data (figure 1C,D, and online supplemental figure 2C,D). We further compared the clustering results from two different processing methods to acquire PBMCs (five HDs with two samples from each HD, and separately processed with ACK buffer and Ficoll density gradient centrifugation). The correlation analysis showed a significantly high positive correlation between identified immune subsets (R=0.93, p value <2.2×10⁻¹⁶; online supplemental figure 2E), demonstrating the consistent results of two sample processing methods. We identified immune cell subsets that were different across five groups in both t-SNE projections and density maps (figure 1B–D). The percentage of T cells in PBMCs is significantly decreased in the BCLC-A HCC group, accompanied by a significant increase of monocytes (figure 1E). However, we did not find these changes in the BCLC-C HCC groups, indicating that they are transient and stage-specific immune features, particularly to patients with early-stage HCC. In contrast, the BCLC-C HCCtr0 group presents more similar phenotypes as the BCLC-A HCC group with both decreased T cells and increased monocytes (figure 1E), suggesting that systemic therapies may alter the immune compositions of patients with advanced HCC towards those of patients with early-stage HCC. Besides, we also identified the increased B cells and decreased DCs only in the BCLC-C HCCun0 group, again suggesting the existence of stage-specific immune signatures that dynamically change along with the development of HCC.
Supplemental material
Supplemental material
Supplemental material
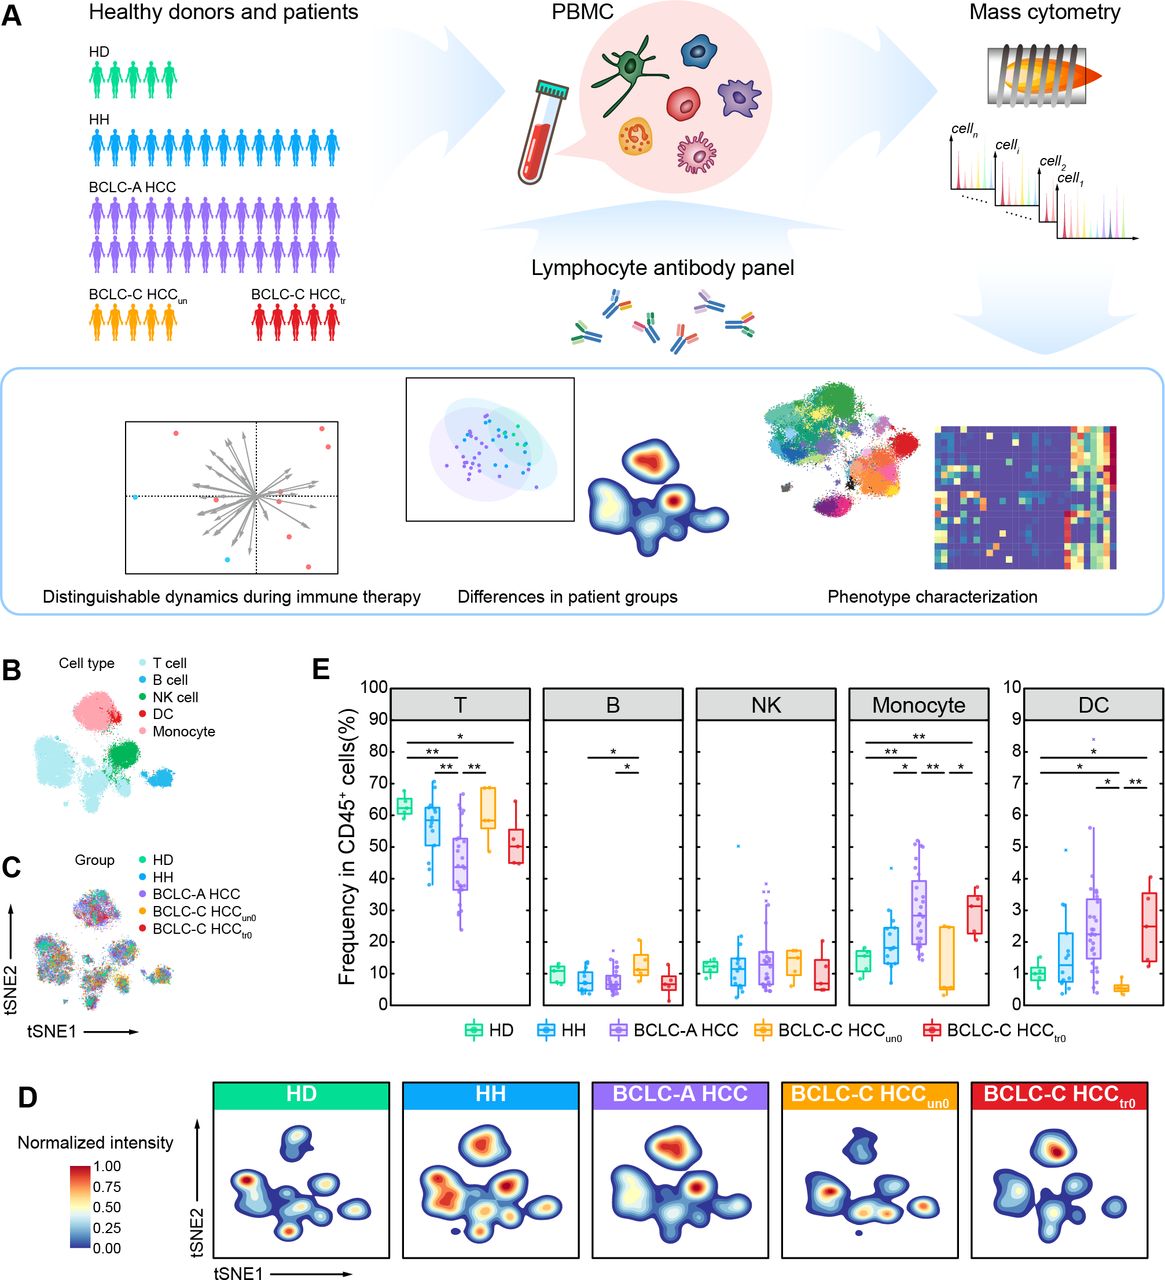
Single-cell CyTOF analysis reveals major peripheral immune compositions of HDs, patients with HH, and patients with HCC. (A) Experimental design and analysis flow for single-cell CyTOF. (B) The t-SNE plots of 25,000 immune cells randomly sampled from the HD, HH, and HCC groups, colored by major immune cell subsets. (C) The t-SNE plots of 25,000 immune cells randomly sampled from the HD, HH, and HCC groups, colored by patient groups. (D) Contours of cell density distributions in each group. (E) Comparisons of the percentages of major immune cell subsets across groups. Unpaired Student t-test is used for statistical analysis. (E) *p<0.05, **p<0.01. BCLC-A, Barcelona Clinic Liver Cancer Stage A; BCLC-C, Barcelona Clinic Liver Cancer Stage C; CyTOF, cytometry by time of flight; DC, dendritic cell; HCC, hepatocellular carcinoma; HD, healthy donor; HH, hepatic hemangioma; NK, natural killer; PBMC, peripheral blood mononuclear cell; t-SNE, t-distributed stochastic neighbor embedding.
Characterization of peripheral lymphocytes in HDs, patients with HH, and patients with HCC
To further characterize the peripheral lymphocyte phenotypes in different HCC stages as well as their differences from HD and HH groups, we examined previously identified immune cell subsets in detail. Among the four identified B-cell subsets, B2 cluster, as the most abundant subset that accounts for over 60% of B cells, expresses high levels of IgD and HLA-DR and an intermediate level of CD38, suggesting that they are naive B cells (figure 2A). This subset significantly increases in the BCLC-C-HCCun0 group (figure 2B). B3 (IgD−CD27lowCD24+) and B4 (IgD−CD27lowCD24−) clusters are memory B cells with minor quantity. The former significantly decreases in HH, BCLC-A HCC, and BCLC-C-HCCun0 groups as compared with the HD group, and the latter only significantly decreases in the BCLC-C-HCCun0 group when compared to the BCLC-A HCC group (figure 2B), implying there are different changing patterns within memory B cells as the disease develops. B1 cluster, annotated as plasma cells, show no differences among the five groups. We also observed that a subset of patients with BCLC-A HCC presented a markedly high frequency of B1 cluster. So, we performed Lilliefors test34 to firstly verify that the frequency of the B1 subset in the BCLC-A HCC group was not normally distributed. Then we classified the patients with BCLC-A HCC into two subgroups (namely, B1high and B1low subgroups) based on the frequency level of the B1 subset (online supplemental figure 3A). Compared with the B1low subgroup, the frequency of the T04 subset was significantly higher and the frequencies of B2 and B4 subsets were significantly lower in the B1high group (online supplemental figure 3B), suggesting there exist two patients with BCLC-A HCC subsets with distinct immune features. We next analyzed the related clinical features between the two subgroups but found no distinguishable differences (online supplemental figure 3C and online supplemental table 3) in the current cohort. Furthermore, we did not observe any significant differences in B-cell subsets between treated or untreated BCLC-C HCC groups, indicating systemic therapy may not target to alter B-cell compositions in these patients.
Supplemental material
Supplemental material

Characterization of peripheral lymphocytes in HDs, patients with HH, and patients with HCC. (A) Heatmaps of the normalized median expressions of four identified B-cell clusters (top) and two identified NK-cell clusters (bottom). The barplot of the relative frequencies for B-cell clusters and NK-cell clusters is displayed by gray bars on the right. (B) Comparisons of the percentages of identified B-cell clusters (left) and NK-cell clusters (right) across groups. (C) Heatmap of the normalized median expressions of 22 identified T-cell clusters. The barplot of the relative frequencies of T-cell clusters is displayed by gray bars on the right. The annotated lineage and functional cell types are color-labeled on the right. (D) The t-SNE plot of T cells for the HD, HH, and HCC groups, colored by the identified T-cell clusters. (E) Comparisons of the percentages of identified CD4+ T-cell and CD8+ T-cell functional subsets across groups. (F) Comparisons of the log2 (fold change) of the percentages of CD8+ effector T-cell cluster (top) and NK2 cluster (bottom) versus regulatory T-cell cluster across groups. (G) Comparisons of the percentages of identified CD8+ and CD4+ EM T-cell clusters across groups. (H) Histograms of the expressions of selected functional markers on identified CD4+ and CD8+ T-cell clusters. Unpaired Student t-test is used for statistical analysis. (B,E,F,G) *p<0.05, **p<0.01, ***p<0.001. BCLC-A, Barcelona Clinic Liver Cancer Stage A; BCLC-C, Barcelona Clinic Liver Cancer Stage C; DN, double negative; FC, fold change; HCC, hepatocellular carcinoma; HD, healthy donor; HH, hepatic hemangioma; IL, interleukin; NK, natural killer; Treg, regulatory T cell; t-SNE, t-distributed stochastic neighbor embedding.
We next compared two identified NK-cell subsets. The NK1 cluster (CD56+CD16−), as the dominant NK subset that accounts for over 60% of NK cells, significantly increases in HH, BCLC-A HCC, and BCLC-C HCCtr0 groups compared with the HD and BCLC-C HCCun0 groups (figure 2B). The NK2 cluster expresses high levels of CD16, CD38, and CD11c and is annotated as cytotoxic NK cells.35 Its specific increase in the BCLC-C-HCCun0 group suggests there may exist enhanced NK-mediated antibody-dependent cellular cytotoxicity via CD16 ligation in untreated patients with advanced HCC. In contrast, the frequencies of these two NK subsets in treated patients with advanced HCC (BCLC-C HCCtr0) restore to similar levels as in early-stage HCC and HH groups. This hints us that systemic therapy may impact NK-cell compositions to reduce their cytotoxicity, or systemic therapy may facilitate cytotoxic NK-cell transfer to TME and induce NK cell-mediated response to tumors.36–38 In addition, we also observed that the proportions of two NK clusters in the BCLC-C HCCun0 group were similar to the HD group. The possible reason is currently elusive and may need more functional markers to further analyze NK cells.
As for T cells, we identified their stage-dependent changes in different HCC groups. Through SOM-based clustering (see the Methods section), we identified 10 CD4+, 7 CD8+, 2 CD4−CD8− double-negative, and 2 γδ T-cell clusters (figure 2C,D). Based on lineage marker expression, we annotated these subsets and found that both CD8+ (T15) and CD4+ (T01) naïve T cells (CCR7+CD45RA+) decreased along with the progression of HCC and became the lowest in the BCLC-C HCCun0 group (figure 2E). We observed that a subset of patients with BCLC-A HCC present higher frequencies of naïve CD4 T cells. So, we performed Lilliefors test34 to verify that the frequencies of naïve CD4 T cells in the BCLC-A HCC group were not normally distributed. Then we classified the patients with BCLC-A HCC into two subgroups (namely, naïve CD4high and naïve CD4low subgroups) based on the frequency level of naïve CD4 T cells (online supplemental figure 4A). Compared with the naïve CD4low subgroup, the frequencies of both total EM CD8 T cells and T21 subset significantly decreased (online supplemental figure 4B), and the frequency of the B2 subset significantly increases in the naïve CD4high subgroup (online supplemental figure 4B). We next compared the clinical features between the two subgroups and found that the proportion of patients infected with HBV in the naïve CD4low group was larger than that in the naïve CD4high group (online supplemental figure 4C and online supplemental table 4). In the BCLC-A HCC group, the frequencies of both CD4+ central memory (CM) and regulatory T cells are significantly higher than those in the other four groups, while in the BCLC-C HCCun0 group, the frequencies of CD8+ effector and CD4+ EM T cells are much higher than those in the HD, HH, and BCLC-A HCC groups. The ratios of CD8+ effector T cells and cytotoxic NK cells (NK2) to regulatory T cells are also significantly higher in the BCLC-C HCCun0 group than in the other three patient groups (figure 2F), indicating that a more cytotoxic peripheral immune signature existed in patients with BCLC-C HCCun0. In contrast, we observed that the ratio of NK2 to regulatory T cells significantly decreased in the BCLC-C HCCtr0 group compared with the HD group (figure 2H). These results together suggest that tumorigenesis can gradually alter peripheral T-cell compositions.
Supplemental material
Supplemental material
We next examined individual T-cell clusters and found changes in CD8+ and CD4+ EM T cells (figure 2G,H). Among them, T18, T04, and T05 clusters with high expression of PD-1 are all enriched in the BCLC-A HCC group. In contrast, none of these PD-1+ T cells are abundant in the BCLC-C HCC groups (online supplemental figure 5A). One possible reason for the distinct distributions of PD-1+ T cells in different stages of HCC is that the PD-1+ T cells actively transit between the tumor tissue and peripheral blood in early-stage HCC, but along with the development of the disease, these PD-1+ T cells may be trapped in the tumor tissue and may be much less likely migrate to the peripheral blood. The specific abundance of PD-1+ T cells in the patients with BCLC-A HCC also suggests it can serve as an immune signature for detecting early-stage HCC.
Supplemental material
We also observed stage-specific alternation of EM T-cell subsets. EM CD8+ T-cell subsets expressing interleukin (IL)-R7α with costimulatory molecules CD27 and CD28 (including T19, T20, and T21 subsets) significantly decrease in patients with advanced HCC (figure 2G and online supplemental figure 5B). In contrast, two EM T-cell subsets with low IL-R7α expression (T08 for CD4+ and T22 for CD8+ T subsets, respectively) significantly and consistently increase in both advanced HCC groups regardless of systemic therapies or not (figure 2G,H). These results suggest that these EM T-cell changing patterns are specific to advanced HCC and may be resistant to systemic therapies.
To further explore whether these identified immune compositions are related to clinical features, such as serum AFP levels, we examined the correlations between different immune cell subsets and the serum AFP levels in the target cohort. We observed the AFP levels significantly and negatively correlated with several EM T-cell subsets (T07 and T09 for EM CD4+, and T19, T20, and T21 for EM CD8+ T) and one B-cell subset (B3) (online supplemental figure 6A). Among them, the percentages of T9, T20, T21, and B3 showed significant differences between HD/HH and early-stage HCC groups (figure 2G). Further correlation analyses for individual groups revealed that T19 (effector memory (EM) CD8+) was significantly and negatively correlated with the AFP levels in the BCLC-C HCCtr0 group, and T21 (EM CD8+) was significantly and negatively correlated with the AFP levels in the BCLC-A HCC group. The overall correlation patterns for the HD, HH, BCLC-A, and BCLC-C HCC groups were stage-specific (online supplemental figure 6B), and the correlation between the AFP levels and DC increased from slightly negative to strongly positive as the group changed from HD gradually to BCLC-C HCC (online supplemental figure 6B). Previous studies have stated the essential roles of AFP in regulating metastasis, apoptosis, and the antitumor response of lymphocytes, and in suppressing the maturation of DCs leading to immune escape in HCC.39–41 Our correlation analyses thus provide a potential way that relates the function of serum AFP to the alteration of peripheral immune composition during the development of HCC.
Supplemental material
Immune interactions altered in different stages of HCC
We performed comprehensive correlation analyses to delineate the immune interactions in peripheral blood and revealed distinct correlation patterns in five groups (figure 3A). Specifically, DCs positively correlate with monocytes in the HD, HH, BCLC-A HCC, and BCLC-C HCCtr0 groups but not in the BCLC-C HCCun0 group (figure 3A,B). A similar pattern was identified in the correlations between CD8+ effector and NK T cells, and between CD4+ CM and regulatory T cells (figure 3A,B). On the contrary, the relationship between CD8+ EM cells and CD4+ naïve T cells and the relationship between NK1 and CD8+ naive T cells are both negatively correlated in HD, HH, BCLC-A HCC, and BCLC-C HCCtr0 groups but not in the BCLC-C HCCun0 group.
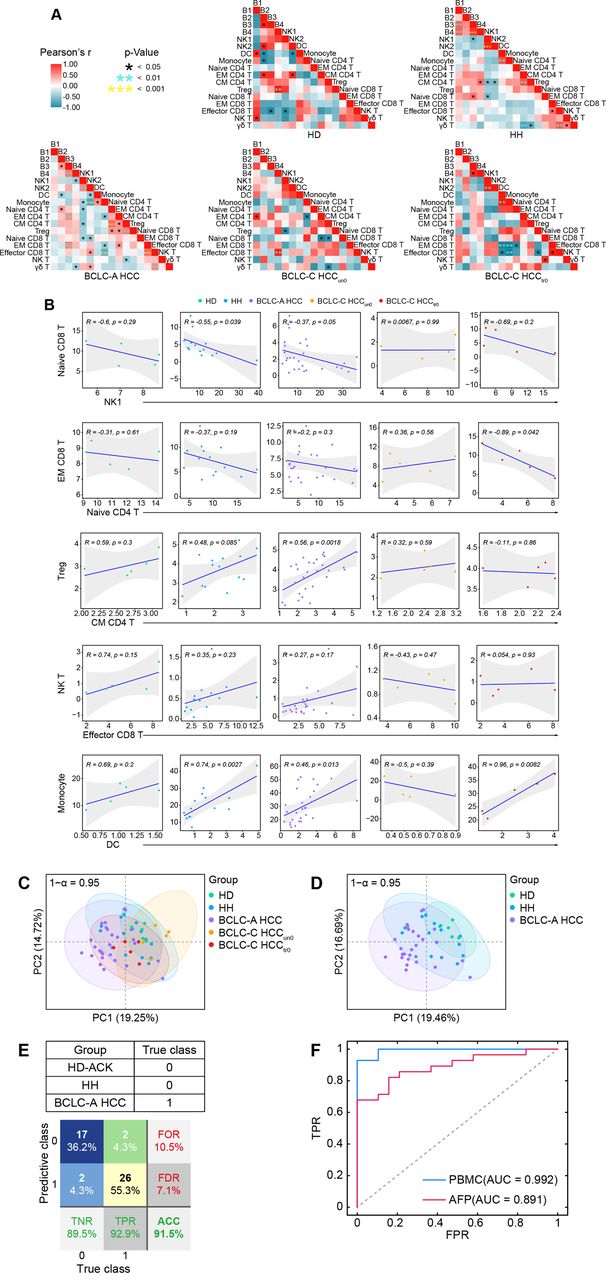
Altered immune interactions in different stages of HCC and integrated immune features for HCC early detection. (A) Heatmaps of the Pearson correlation coefficients between immune cell subsets across groups. (B) Correlations of the percentages of selected immune cell subsets across groups and the regression line with 95% CI. (C) The PCA projection of total PBMC samples, colored by groups, and each ellipse plot represents the CI of 95% confidence coefficient for individual groups. (D) The PCA projection of HD, Hh, and BCLC-A HCC samples, colored by groups, and each ellipse plot represents the CI of 95% confidence coefficient for individual groups. (E) Confusion matrix of classification result of 47 samples (F) The ROC curves and AUC values of trained AdaBoost-SVM classifier or classified by using AFP levels with a cut-off of 20 ng/mL. ACC, accuracy; AUC, area under the curve; AFP, alpha-fetoprotein; BCLC-A, Barcelona Clinic Liver Cancer Stage A; HCC, hepatocellular carcinoma; HD, healthy donor; HH, hepatic hemangioma; NK, natural killer; PBMC, peripheral blood mononuclear cell; PCA, principal component analysis; FOR, false omission rate; FDR, false discovery rate; FPR, false positive rate; ROC, receiver operating characteristic; TNR, true negative rate; TPR, true positive rate.
Integrated immune features predict HCC in early stage
We performed principal component analysis (PCA) to identify overall variances of systemic immune features. We found that the overlapped areas of the 95% confidence interval (CI) ellipses greatly varied across the five groups (figure 3C) and that the ellipse representing the BCLC-C HCCun0 group stretched out in a completely different direction and shared the least overlapped areas. Comparing three highly overlapped ellipses that respectively represented the HH, BCLC-A HCC, and BCLC-C HCCtr0 groups, we found that the 95% CI ellipse of the HD group was the most distinct from the one of HCC, followed by the HH group, suggesting there exist peripheral immune features able to effectively distinguish early-stage HCC from HD/HH samples (figure 3D). The ellipse of HD group was completely covered by the one of HH group, but much smaller and more concentrated compared with the HH group (figure 3D), possibly due to the limited sample size of the HD group (figure 3D).
We next aimed to use the identified peripheral immune features to design a classifier that is able to predict patients with early-stage HCC (labeled as class 1). We constructed a logistic AdaBoost-SVM classifier (see the Methods section); used 3 HD-ACK, 9 HH, and 19 BCLC-A HCC samples as the training dataset (sample size was further boosted using the SMOTE technique; see details in the Method section); and used the remaining 2 HD-ACK, 5 HH, and 9 BCLC-A HCC samples for validation. We tested the proposed classifier using all samples in the HD-ACK, HH, and BCLC-A HCC groups, and obtained the prediction accuracy at 91.5% (figure 3E). Next, we compared the predictive performance of the trained classifier with the one using the AFP level with a cut-off of 20 ng/mL7 as the diagnosis indicator. Although the AFP level in HCC was significantly higher than in HD/HH on the group level (online supplemental figure 7A-C), using only the AFP level to predict individual’s tag showed inferior performance compared with the trained classifier (area under the curve (AUC) for AFP=0.891, AUC for the trained classifier=0.992; figure 3F), suggesting integrated peripheral immune features may serve as a potentially feasible indicator to predict early-stage HCC. To further test the effectiveness of our classifier, we used five additional CRC samples and five HD-Ficoll samples that were processed by the aforementioned experimental and clustering procedures. Using the trained classifier, we found that the identified immune signatures could clearly label five HD-Ficoll samples and four out of five CRC samples with class 0 (online supplemental figure 8A,B), demonstrating the ability of our classifier to effectively distinguish patients with early-stage HCC from the ones with non-early HCC.
Supplemental material
Supplemental material
Personalized peripheral immune changes in patients with HCC after immune checkpoint blockade (ICB) monotherapy
Having revealed that peripheral immune signatures could serve as a sensitive indicator to assess stage-specific changes of HCC, we next intended to explore how these peripheral immune signatures dynamically changed in patients with advanced HCC after anti-PD-1 ICB treatment.
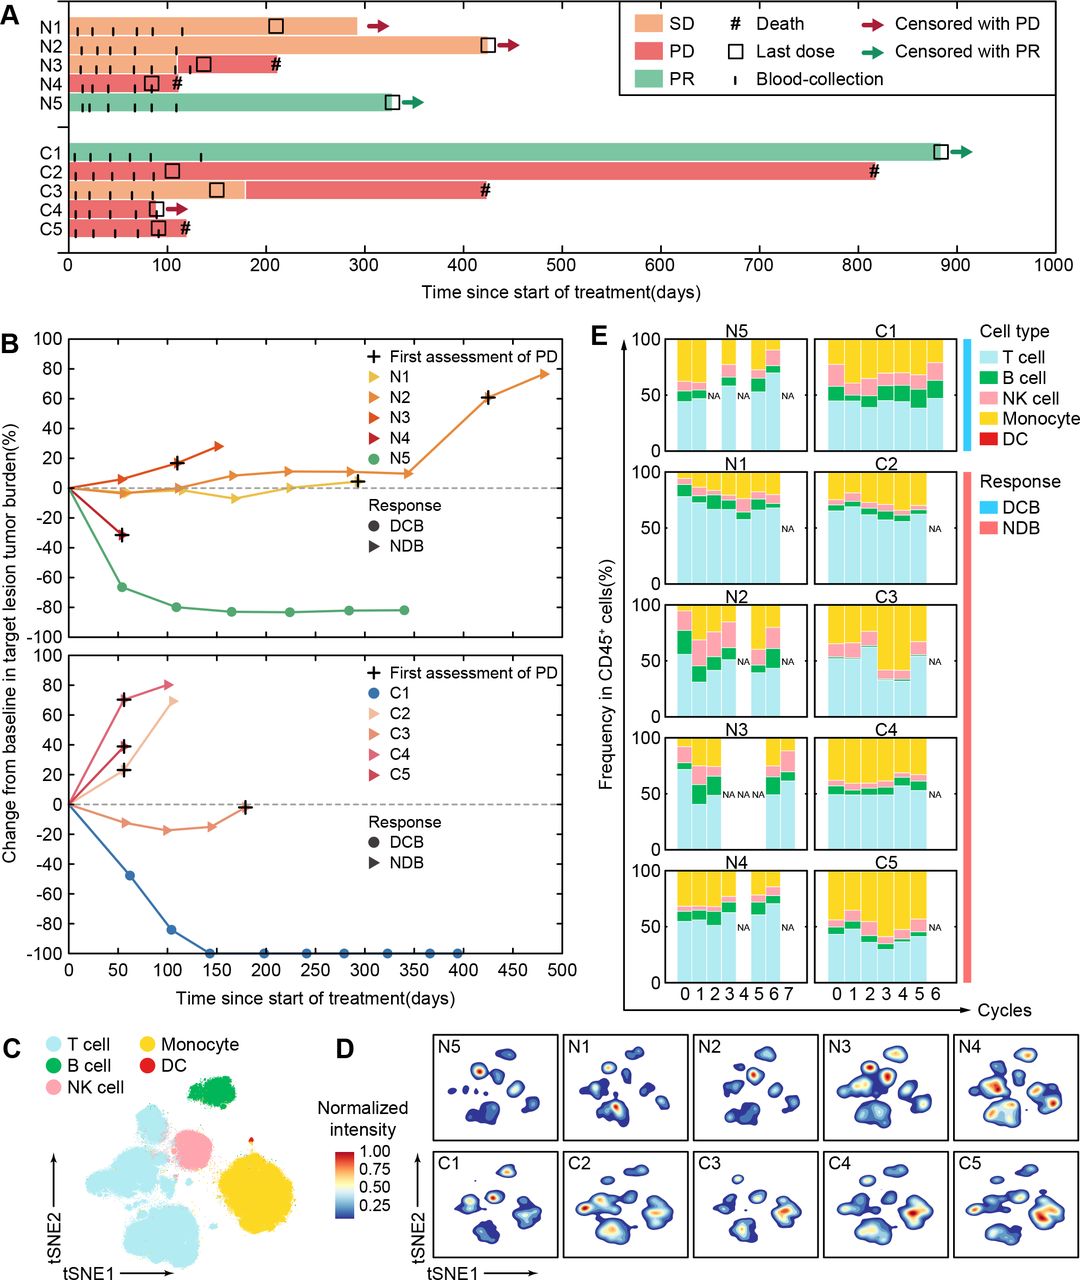
We performed single-cell CyTOF analysis to a series of sequential PBMCs samples from 10 patients with BCLC-C HCC who received anti-PD-1 monotherapy for 12~18 weeks. These patients were classified into two independent groups. Five patients (N1~N5) who had not received any systemic therapies were enrolled as the first-line patient group (BCLC-C HCCun) and then received nivolumab at a dose of 240 mg every 2 weeks. The other five patients (C1~C5) who had taken systemic therapies (online supplemental table 1) were enrolled as the second-line patient group (BCLC-C HCCtr) and then received camrelizumab at a dose of 3 mg/kg every 3 weeks (see the Methods section). Their objective responses were defined according to RECIST V.1.1. We observed that patients N5 and C1 kept partial responses until data cut-off (figure 4A). The target lesions in both N5 and C1 patients significantly and continuously reduced as compared with the baseline during the regimen of anti-PD-1 monotherapy (figure 4B and online supplemental figure 9). We thus defined these two patients as patients with durable clinical benefit (DCB). The other eight patients who achieved stable disease or progressive disease within 6 months (figure 4A,B and online supplemental figure 9) were labeled as patients with non-durable benefit (NDB).
Supplemental material

Personalized peripheral immune changes in patients with HCC after ICB monotherapy. (A) The clinical event lines for 10 patients with BCLC-C HCC treated with anti-PD-1 monotherapy in two groups, colored by distinct clinical responses. (B) Percentage changes in tumor burden from baseline for 10 patients with BCLC-C HCC treated by anti-PD-1 monotherapy over time in two groups. (C) The t-SNE plot of 300,000 immune cells from the 10 patients with BCLC-C HCC, colored by major immune cell subsets. (D) Contours of cell density distributions of each patient based on the t-SNE plot (C). (E) The percentages of major immune cell subsets in durable treatment cycles for each patient in two groups. BCLC-A, Barcelona Clinic Liver Cancer Stage A; DC, dendritic cell; DCB, durable clinical benefit; HCC, hepatocellular carcinoma; ICB, immune checkpoint blockade; NDB, non-durable benefit; NK, natural killer; PD-1, programmed cell death protein 1; PD, progressive disease; PR, partial response; SD, stable disease; t-SNE, t-distributed stochastic neighbor embedding.
PBMC samples from the aforementioned 10 patients were collected at the baseline and the indicated periodical time points in up to 3 months during anti-PD-1 monotherapy (figure 4A), and in total, we collected 60 samples (online supplemental table 1). After data preprocessing (see the Methods section), 4.7 million CD45+ immune cells without granulocytes were obtained and automatically clustered using the SOM algorithm and metaclustering strategy (see the Methods section) with 41 designated markers (online supplemental table 2). We further partitioned these clusters (online supplemental figure 10A,B) into five major immune subsets (figure 4C). With the density plots of individual patients, we revealed diverse immune compositions across different patients (figure 4D). Longitudinal frequency comparisons of the major immune subsets for each patient further demonstrate the heterogeneous dynamic changes after receiving anti-PD-1 monotherapy (figure 4E). Both patients with DCB and NDB show inconsistent changing patterns in absolute frequencies of the major immune subsets, indicating that the absolute frequencies of these immune subsets are likely to be personalized features and not sensitive enough to capture the responsive patterns of immune systems during anti-PD-1 monotherapy. This prompted us to further explore the detailed longitudinal changes of the peripheral immune cells in response to anti-PD-1 monotherapy.
Supplemental material
Detailed longitudinal analysis revealed distinct responsive patterns for patients with DCB and NDB
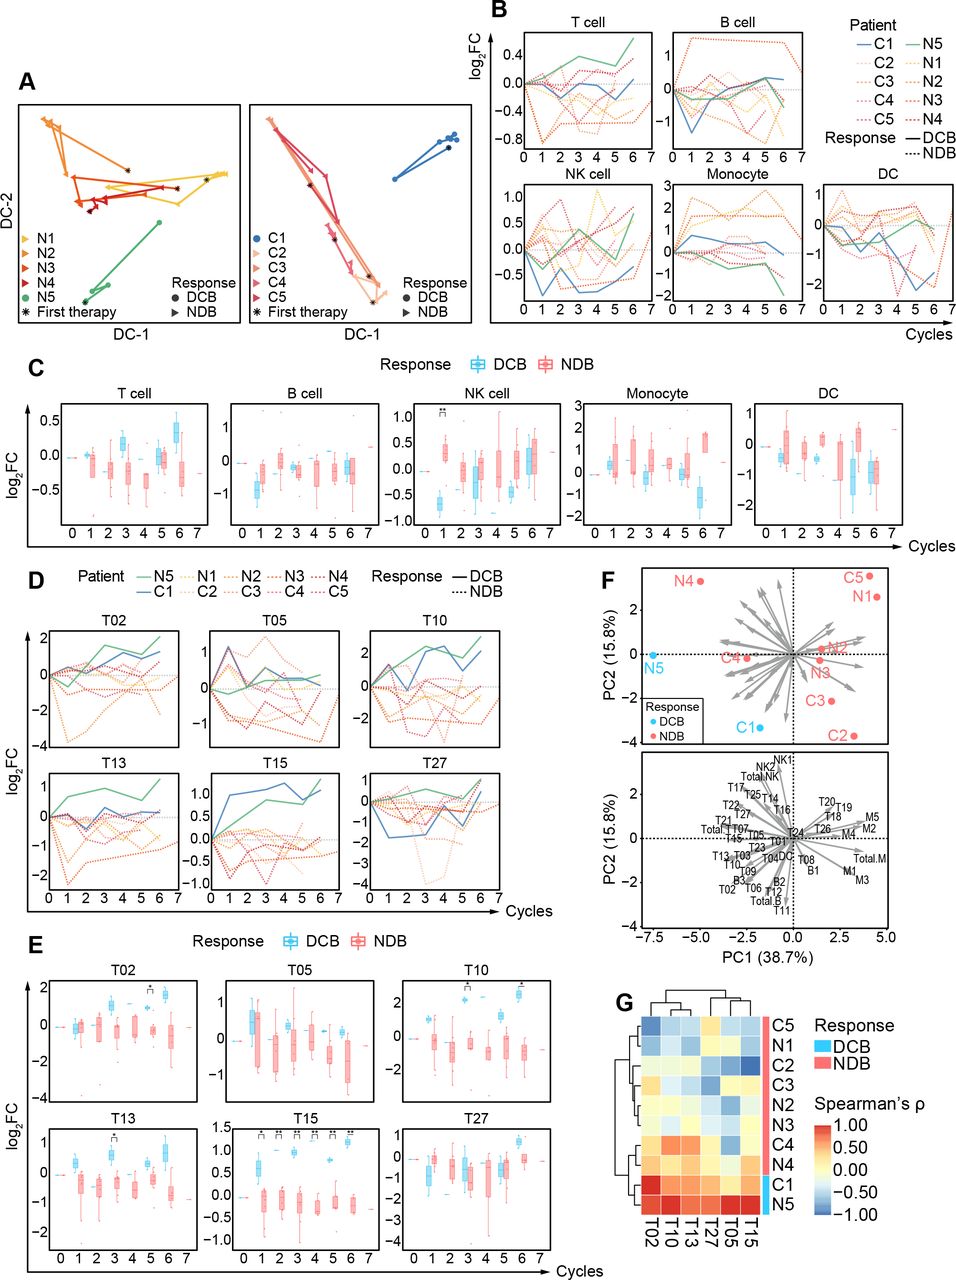
To investigate the responsive patterns of peripheral immune features in patients with DCB and NDB for both groups, we examined all identified immune clusters (online supplemental figure 10B) and conducted dimensional reduction analysis using diffusion maps42 to systematically trace the dynamic trajectory of peripheral immune systems for individual patients (figure 5A). Interestingly, we observed that patients with DCB in both groups displayed distinguishable dynamic trajectories from patients with NDB after receiving anti-PD-1 monotherapy, suggesting that distinct responsive patterns exist between patients with DCB and NDB and that these patterns can be potentially exploited to monitor the efficacy of anti-PD-1 monotherapy.
Detailed longitudinal changes of peripheral immune compositions for patients with DCB and NDB. (A) Diffusion maps based on the frequencies of circulating immune components for 10 patients with BCLC-C HCC treated with immunotherapy, colored by patients, and shaped by clinical responses. (B) The relative changes in the percentages of major immune cell subsets versus baselines of 10 BCLC-C patients during the treatment cycles. The lines are colored by patients and shaped by clinical responses. (C) Comparisons of the log2 (fold change) of the percentages of major immune cell subsets versus baseline between patients with DCB and NDB during the treatment cycles. (D) The relative changes in the percentages of the identified immune cell subsets versus baselines of 10 patients with BCLC-C during the treatment cycles. The lines are colored by patients and shaped by clinical responses. (E) Comparisons of the log2 (fold change) of the percentages of the identified immune cell subsets versus baseline between patients with DCB and NDB during the treatment cycles. (F) The PCA projection of the Spearman correlation coefficients between the relative changes of identified cell clusters and the treatment cycles. Point plots are labeled by patients and colored with DCB and NDB groups (top). The arrow length and direction represent the dominant cell clusters to the directions of PCs (bottom). (G) Heatmap of the Spearman correlation coefficients between the relative changes of identified cell clusters and the treatment cycles, colored by clinical responses on the right. Unpaired Student t-test is used for statistical analysis. (C,E) *p<0.05, **p<0.01. BCLC-C, Barcelona Clinic Liver Cancer Stage C; CDC, dendritic cell; DCB, durable clinical benefit; NDB, non-durable benefit; NK, natural killer; PCA, principal component analysis; PC, principle components.
To quantitatively compare these different immune responses, we used the relative fold changes of the frequencies for identified immune clusters (the sample collected before the initiation of immunotherapy was considered as the baseline) and found the distinguishable longitudinal patterns in the major immune subsets between patients with DCB and NDB for both groups. Patients with DCB have gradual increases and significant enrichment in total T cells (figure 5B,C).
We further focused on the relative fold changes of detailed T-cell subsets and revealed longitudinal changes including significant increases of T02 (CD4+CD27+ EM T), T10 (CD4+CD49a+IL-R7α+ EM T), T13 (CD4+IL-R7α+ EM T), T15 (CD8+ IL-R7α+ EM T), and T27 in patients with DCB compared with patients with NDB (figure 5D,E). Multiple EM T cells expressing high levels of IL-R7α (T10, T13, and T15) have been identified to significantly increase in patients with DCB. It has been reported that PD-1 pathway blockade or the combination treatment of α-PD-1 and α-CTLA-4 could improve the IL-R7α expression on tumor-infiltrating T cells.43 44 Our analyses show that even in peripheral blood, we could identify the increase of IL-R7α+ EM T cells in patients with DCB.
We next explored whether there existed longitudinal patterns of the relative fold changes of peripheral immune subsets particularly for patients with DCB. So, we performed Spearman correlation analyses between the relative frequency fold changes of individual subsets and the sequential treatment time points and found several T-cell subsets (T02, T05, T10, T13, T15, and T27) exhibited significantly high Spearman correlation coefficients in patients with DCB compared with patients with NCB (online supplemental figure 11). Further PCA analysis revealed that two patients with DCB were oriented in a similar direction that was completely different from the other eight patients with NCB (figure 5F), indicating using these features might be able to separate patients with DCB from patients with NCB. Therefore, we performed hierarchical classification using the identified Spearman correlation coefficients markedly high in patients with DCB in both first-line and second-line patient groups. The generated heatmap displays a clear separation of N5 and C1 (patients with DCB) from the other patients with NCB (figure 5G), indicating that the dynamic changes of identified immune subsets (T02, T05, T10, T13, T15, and T27) can be a potential indicator for assessing the effectiveness of anti-PD-1 monotherapy of patients with advanced HCC.
Supplemental material
Discussion
In this study, we applied single-cell CyTOF analyses to depict not only the static peripheral immune atlas in different stages of HCC but also the dynamical changes of the immune atlas in patients with advanced HCC with anti-PD-1 monotherapy.
With detailed analyses of peripheral immune subsets, particularly in lymphocytes, we first identified noticeable immune differences between the HD/benign liver tumor (HH) group and the early-stage HCC (BCLC-A HCC) group. The integrated immune signatures can potentially provide a more effective and minimally invasive predictive biomarker to help diagnose early-stage HCC than ‘the gold standard’ AFP level, which is currently the only recommended blood-based test in clinical practice for detecting and monitoring HCC. Although this comparison was conducted on a small cohort, it has shown the feasibility of using integrated peripheral immune signatures as a potentially sensitive and novel liquid indicator for early-stage HCC screening to complement traditional screening methods and enhance their predictive performances. Compared with other newly developed non-invasive biomarkers, this methodology has high efficiency in identifying different immune cell subtypes and properly avoids high system error rate caused by the tumor heterogeneity, which commonly occurs in detecting of CTCs or circulating tumor nucleic acid. Furthermore, the proposed method is involved in the blood-based test, which can be easily obtained, repeatable, and with clear clinical significance, unlike EVs or other undefined molecular markers. Nevertheless, due to the limited sample size, a large cohort with blinded clinical status would be definitely needed to further validate the proposed classifier. Considering the availability of CyTOF equipment and relatively high cost per test,45 this approach might be difficult to be used as routine examination currently. However, patients who do not fulfill the diagnostic criteria but have a predisposition to HCC (such as chronically infected with hepatitis virus, with non-alcoholic fatty liver disease, elevated AFP level while without typical imaging findings, with liver cirrhosis, etc) would be recommended to get this kind of test as a complementary method to their routine examination. Another factor that can possibly affect the large-scale application of the proposed method is standardization issue in both the CyTOF experimental process and data analysis pipeline, which might introduce bias in batches from different laboratories or instruments.46–48 Further investigation needs to consider proper standardized protocols for sample collection and data quality control, such as using standard test samples to reduce batch effects and ensure consistent test results.
Moreover, other than accurately discriminating early-stage HCC, the dynamic immune atlas also provides sensitive immune signatures to early assess the final responsiveness of both first-line and second-line anti-PD-1 monotherapy in patients with advanced HCC. To date, many clinical trials have indicated that PD-L1 expression in TME is the most commonly adopted predictor of anti-PD-1 efficacy in several cancer types, such as melanoma, non-small cell lung cancer (NSCLC), etc.49 Nevertheless, retrospective research demonstrated that baseline PD-L1 expression on tumor cells of patients with advanced HCC exhibited no significant association with the ORRs to the immunotherapy of anti-PD-1 antibodies, such as nivolumab and pembrolizumab.16 17 Similarly, TMB, an alternative predictor of immunotherapy response across several types of malignancies, also showed poor performance in HCC.50 51 Due to the limited application in HCC and the shortcomings of tissue biopsy as previously mentioned, a non-invasive and homogeneous predictor derived from liquid biopsies is preferable. Peripheral immune cells reflecting the adaptive immune system to some extent rationalize that immune signatures derived from PBMCs can be a potential predictor of response to immunotherapy. Monitoring the dynamic changes of peripheral immune system of patients with HCC for the first 3 months of anti-PD-1 treatment, we not only consistently revealed the patients with DCB for both first-line and second-line immunotherapy, but also clearly discriminated the patients with NCB. Particularly for patients with NCB who showed no evidence of disease progression based on the imaging results (figure 4B and online supplemental figure 9) and continued anti-PD-1 monotherapy until the treatment failed 1 year later, our method could directly predict their final non-responsiveness to anti-PD-1 monotherapy, which could greatly help the patients to reduce the treatment period of ‘trial and error’, and meanwhile gain the extra time to switch to combination or other assisted therapy in advance before conventional clinical decisions, and thus help the patients with NCB receive more clinical benefit. Thus, we rationalize that immune contexture may tailor the ICB application to specific patients with HCC who will be likely to derive durable benefit from anti-PD-1 monotherapy, similarly to what has been described and proposed in metastatic melanoma.22 52
Of note, the significant differences of several EM T-cell subsets (CD4+CD27+, CD4+IL-R7α+, and CD8+IL-R7α+) identified between patients with DCB and NDB suggest that a higher migratory capacity of EM T cells may serve as predictive clues to generate beneficial immune responses to anti-PD-1 monotherapy. Higher percentages of CD4+IL-R7α+ and CD8+IL-R7α+ T cells in patients with DCB suggest their potential antitumor roles, consistent with previous reports in patients with liver cancer who were treated with radiotherapy53 and a preclinical study in which pancreatic tumor size was negatively associated with numbers of these infiltrating EM T cells.54
Other than the identification of these clinically useful immune signatures, we also revealed remodeling of the immune atlas in response to systemic therapy (eg, chemotherapy or sorafenib). The peripheral immune compositions of patients with advanced HCC who had systemic therapy before the immunotherapy are more like the ones in early-stage HCC or even the benign liver tumor (HH) group, suggesting the effects of systemic treatment on patients with advanced HCC are detectable and traceable in the peripheral blood and can benefit patients with advanced HCC by partially altering their immune compositions. These results corroborate the previous notion that systemic treatment may normalize the tumor vasculature, improve immune–vascular crosstalk, and present a positive feedback loop to immune reprogramming.55 Furthermore, the restoring immune contexture after antiangiogenic multikinase inhibitor treatment has been found to synergize with ICB immunotherapy in patients with advanced HCC in several latest trials.56–59 The peripheral immune remodeling discovered in our study may provide a novel sight to explore the mechanism of this synergy.
As ICB immunotherapy-based combinations have become a promising approach in clinical trials for advanced HCC but still with ambiguous efficacy,60 whether and why the ICB immune-monotherapy is effective or not in HCC are urgently needed to be dissected. Single-cell proteomic CyTOF analysis can be useful to search for liquid biomarkers or immune signatures to predict the durable efficacy of ICB-based combinations with other drugs (eg, antiangiogenic multikinase inhibitors). These new peripheral immune signature-based biomarkers should be powerful to assist oncologists in timely clinical decision-making. Single-cell proteomic CyTOF analysis can also provide useful molecular and cellular clues for researchers to further figure out innovative immune therapy strategies to enhance the efficacy of ICB monotherapy.
Data availability statement
Data are available in a public, open access repository. Data supporting this publication are available at ImmPort (https://www.immport.org) under study accession SDY1733.
Ethics statements
Patient consent for publication
Ethics approval
This study was approved by the ethics committee of the First Affiliated Hospital of Zhejiang University. Informed consent was obtained from each subject.
Acknowledgments
We greatly appreciate the donations of blood samples of enrolled patients and the help for sample collection by clinical staff at FAHZU. We thank the mass cytometry facility (PLT Tech) for single-cell sample preparation and cytometry by time of flight experiments. We thank T Wang for the sample preparation. We thank H Shi for technical support.
References
Supplementary materials
Supplementary Data
This web only file has been produced by the BMJ Publishing Group from an electronic file supplied by the author(s) and has not been edited for content.
Footnotes
Contributors WY and WF conceived the project and designed the experiments. XT and TW performed the experiments. JS and JL analyzed cytometry by time of flight data. WF, XT, BL, ZT, YZ, and HS were involved in patient inclusion and sample acquisition. WF, WY, WC, XZ, JS, JL, XT, and BL wrote the manuscript with advice and feedback from all authors. WF is responsible for the overall content as guarantor.
Funding Natural Science Foundation of Zhejiang Province (LY21H160029 to YZ), Natural Basic Research Program of China (2017ZX10203205 to WC), and National Major Scientific and Technological Special Project for Significant New Drugs Development during the Thirteenth Five-year Plan Period (2020ZX 09201-003 to YZ) provided funding for the study.
Competing interests HS and WY are both cofounders of, WC and XZ are the scientific consultants of, HS is the CEO of, and TW is employed by Zhejiang Puluoting Health Technology Co., Ltd. The authors declare the following competing financial interests: Zhejiang University and Zhejiang Puluoting Health Technology Co., Ltd. are jointly filing Chinese invention patents for the Anti-PD-1 Monotherapy Effectiveness Evaluation System Based on Peripheral Blood Immune Cell Atlas (202111513101.5) and An Early Screening System for Hepatocellular Carcinoma Based on Peripheral Blood Immune Cell Atlas (202111513095.3).
Provenance and peer review Not commissioned; externally peer reviewed.
Supplemental material This content has been supplied by the author(s). It has not been vetted by BMJ Publishing Group Limited (BMJ) and may not have been peer-reviewed. Any opinions or recommendations discussed are solely those of the author(s) and are not endorsed by BMJ. BMJ disclaims all liability and responsibility arising from any reliance placed on the content. Where the content includes any translated material, BMJ does not warrant the accuracy and reliability of the translations (including but not limited to local regulations, clinical guidelines, terminology, drug names and drug dosages), and is not responsible for any error and/or omissions arising from translation and adaptation or otherwise.