Article Text

Abstract
Background T cell immunoglobulin and mucin domain containing−3 (TIM-3) blocking antibodies are currently being evaluated in clinical trials for solid and hematological malignancies. Despite its identification on T cells, TIM-3 is predominantly expressed by myeloid cells, including XCR1+ type I conventional dendritic cells (cDC1s). We have recently shown that TIM-3 blockade promotes expression of CXCR3 chemokine ligands by tumor cDCs, but how this drives a CD8+ T cell-dependent response to therapy is unclear.
Methods T cell infiltration, effector function, and spatial localization in relation to XCR1+ cDC1s were evaluated in a murine orthotopic mammary carcinoma model during response to TIM-3 blockade and paclitaxel chemotherapy. Mixed bone marrow chimeras and diphtheria toxin depletion were used to determine the role of specific genes in cDC1s during therapeutic responses.
Results TIM-3 blockade increased interferon-γ expression by CD8+ T cells without altering immune infiltration. cDC1 expression of CXCL9, but not CXCL10, was required for response to TIM-3 blockade. CXCL9 was also necessary for the increased proximity observed between CD8+ T cells and XCR1+ cDC1s during therapy. Tumor responses were dependent on cDC1 expression of interleukin-12, but not MHCI.
Conclusions TIM-3 blockade increases exposure of intratumoral CD8+ T cells to cDC1-derived cytokines, with implications for the design of therapeutic strategies using antibodies against TIM-3.
- dendritic cells
- breast neoplasms
- CD8-positive T-lymphocytes
- costimulatory and inhibitory T-cell receptors
- tumor microenvironment
Data availability statement
Data sharing not applicable as no data sets generated and/or analysed for this study.
This is an open access article distributed in accordance with the Creative Commons Attribution Non Commercial (CC BY-NC 4.0) license, which permits others to distribute, remix, adapt, build upon this work non-commercially, and license their derivative works on different terms, provided the original work is properly cited, appropriate credit is given, any changes made indicated, and the use is non-commercial. See http://creativecommons.org/licenses/by-nc/4.0/.
Statistics from Altmetric.com
- dendritic cells
- breast neoplasms
- CD8-positive T-lymphocytes
- costimulatory and inhibitory T-cell receptors
- tumor microenvironment
Introduction
Despite the promise of immune checkpoint blockade (ICB) therapy as a treatment for cancer, response rates remain low, particularly for certain types of malignancies. For example, triple-negative breast cancer exhibits an objective response rate to anti-programmed death ligand-1 (αPD-L1) therapy of less than 10%.1 Response to αPD-1 or αPD-L1 is usually linked to the presence of PD-L1-expressing tumor cells; however, the approval of atezolizumab and nab-paclitaxel is predicated on >1% PD-L1 expression in tumor-infiltrating immune cells.2 This is consistent with emerging clinical data suggesting that systemic immune effects, rather than simple reactivation of exhausted tumor-infiltrating T cells, is a major factor driving therapeutic responses.3 Specifically, several murine studies have demonstrated that PD-L1 expression by conventional dendritic cells (cDCs) is the major pathway driving PD-1-dependent exhaustion in T cells.4 5 These studies highlight that understanding the cellular and molecular mechanisms underpinning response to ICB is important for optimized selection of patients and therapeutic combinations.
The next generation of ICB targets includes T cell immunoglobulin and mucin domain containing (TIM)−3. TIM-3 is coexpressed on exhausted T cells along with PD-1, and dual blockade of PD-1 and TIM-3 demonstrates efficacy in preclinical models and early phase clinical trials.6 However, TIM-3 is also widely expressed by innate immune populations, including constitutive expression by human and mouse cDC. We have recently shown that TIM-3 blockade promotes the uptake of extracellular DNA by XCR1+ type I cDCs (cDC1), leading to activation of the cGAS-STING pathway.7 TIM-3 blockade is thus able to promote CD8+ T cell-dependent responses to paclitaxel (PTX) chemotherapy in models of mammary carcinoma, despite the lack of TIM-3 expression by CD8+ T cells in these models.8 Similarly, genetic loss of TIM-3 in cDCs promotes antitumor immunity in immunogenic tumor models, whereas loss of TIM-3 in T cells does not alter tumor growth.9
The data support TIM-3 expression by intratumoral cDCs as the primary target of therapeutic antibodies, but it remains unclear how TIM-3 blockade indirectly promotes CD8+ T cell effector function within tumors. We previously showed that intratumoral cDCs increase expression of Cxcl9 and Cxcl10, and that the CXCR3 receptor is required for response to TIM-3 blockade.8 Here we show that increased CXCL9 expression by XCR1+ cDC1s does not increase T cell recruitment in mammary carcinomas, but rather promotes the spatial localization of cDC1 and CD8+ T cells, thereby driving an interleukin (IL)−12-dependent therapeutic response. These studies highlight that spatial organization of cDCs and T cells plays a critical role in the antitumor response and delineate a pathway by which this can be targeted to improve T cell function.
Methods
Animal studies
Animals were maintained in the University of South Florida Department of Comparative Medicine barrier facility, and the respective Institutional Animal Care and Use Committee approved all experiments. All mice were obtained from The Jackson laboratory, with the exception of the Xcr1tm2(HBEGF/Venus)Ksho mice10 which were obtained directly from Matthew Krummel at UCSF. In order to generate bone marrow (BM) chimeric mice, recipient mice were irradiated with two doses of 5 Gy, 24 hours apart, followed by an intravenous BM transfer from donor animals. Tumors were implanted after 6 weeks of reconstitution, with implantation performed in female mice aged 2–4 months. Single-cell suspensions isolated from mammary tumors of MMTV-PyMT transgenic mice were mixed in a 1:1 ratio with Matrigel (Corning), and 5×10⁵ cells per 100 µL were injected into the right 2/3 mammary gland. Treatment was initiated in a non-blinded fashion when tumors reached an approximate average volume of 100 mm3. Mice were dosed with antibody αTIM-3 (clone RMT3-23), αCXCR3 (clone CXCR3-173), αIFNγ (clone XMG1.2), αCD8β (clone 53–5.8) or IgG2a (clone 2A3); BioXCell) alone or in combination with clinical grade paclitaxel (PTX; Alvogen) as indicated in the respective figures. Briefly, antibodies were administered by intraperitoneal injection at 1.0 mg/mouse, with follow-up doses of 0.5 mg per mouse every 5 days, concurrently with retro-orbital administration of 8–10 mg/kg PTX. For diptheria toxin (DT) depletion models, DT was dosed beginning 2 days prior to the start of antibody treatment at a concentration of 20 ng/g for the first dose, with follow-up doses of 4 ng/g administered every other day. Some experiments were conducted using the B6-PyMT cell line modified to express mCherry-OVA (a kind gift from David G. DeNardo) or ZsGreen.7 11
Flow cytometry
Mice were cardiac perfused with phosphate buffered saline (PBS) containing 10 U/mL heparin to remove peripheral blood. Single-cell suspensions were generated from minced tumors by digestion with 50 U/mL deoxyribonuclease I (DNAse I) and 1 µg/mL Collagenase A (Roche) at 35 °C with agitation. Collagenase was omitted for flow panels which included CXCR3 staining. Following digestion, cells were used immediately or stored in 10% dimethylsulfoxide (DMSO) at −80 °C. Cells were plated at a density of 2×10⁶ /mL in PBS in a 96 well plate for staining. Dead cells were stained by incubating a 1:1000 dilution of Zombie NIR (Biolegend #423107), Live/Dead Aqua (Fisher Scientific, #L34965), or Zombie UV (Biolegend #423107) fixable viability dyes in PBS for 30 min at 4 °C. To minimize non-specific staining, the cells were then incubated with TruStain FcX Plus (anti-mouse CD16/32, Biolegend #156604) at a concentration of 0.25 ug/mL diluted in FACS buffer (PBS+1 mM EDTA +1 mg/mL bovine serum albumin). Immune populations were identified using a previously described gating strategy12 and the following antibodies: CD45 (clone 30-F11, BD #564225), CD11c (clone N418, Biolegend #117334), F4/80 (clone BM8, Biolegend #123116), MHCII (clone M5/114.15.2, BD #562564), CD11b (clone M1/70, BD #563168), CD103 (clone 2E7, Biolegend #121426), Ly6G (clone 1A8, BD #563978), Ly6C (clone HK1.4, Biolegend #128026), CD19 (clone 1D3, BD #564296), CD3ε (clone 17A2, BD #560527), CD8α (clone 53.6–7, BD #564920), CD69 (clone H1.2F3, Biolegend #740220 or #104506), CD44 (clone IM7, BD #563970), CD4 (clone RM4-5, BD #563747), NK1.1 (clone PK136, Biolegend #108747), CXCR3 (clone CXCR3-173, Biolegend #126506), Ki67 (clone B56, BD #564071), FoxP3 (clone MF-14, Biolegend #126403), IFNγ (clone XMG1.2, Biolegend #505826), and TNFα (clone MP6-XT22, Biolegend #506306). Extracellular staining was performed by diluting antibodies 1:400 in FACS buffer and incubating cells for 30 min at 4 °C. Cells were then fixed by incubation in BD Cytofix for 30 min at 4 °C. To perform intracellular staining, cells were permeabilized using the BD Transcription Factor Buffer Kit (for panels that included Ki67 staining) or BD Cytoperm (all other applications), both according to manufacturer’s directions. Data were collected with either an LSRII or a FACSymphony flow cytometer, and all analysis was performed using FlowJo V.9 or V.10 (FlowJo).
Immunofluorescent staining
Following cardiac perfusion with PBS+10 U/mL heparin, tissues were resected and placed in 4% paraformaldehyde for 4–6 hours at 4 °C. Tissues were then transferred to 30% sucrose and incubated on a shaker overnight at 4 °C. The tissue was then rinsed briefly in PBS and embedded in O.C.T compound (Fisher Scientific), which was frozen on dry ice. 4 µm sections on charged slides were prepared by the Tissue Core Shared Resource at Moffitt Cancer Center. Prepared slides were dried for 10 min at 50 °C, and excess O.C.T. compound was removed. Slides were incubated in PBS+0.3% Triton X 100 (Fisher Scientific) for 10 min at room temperature (RT) to permeabilize tissue. Following 1 hour in horse serum blocking buffer containing 0.3% Triton X 100, primary antibodies were diluted in the same, and applied for 3 hours at RT or overnight at 4 °C. Primary antibodies included chicken anti-GFP Tag (Thermo Fisher Scientific, polyclonal, 1:1000 dilution), Alexa Fluor 647 conjugated anti-CD8a (BD Biosciences, clone 53–6.7, 1:250 dilution), anti-Ki67 (Cell Signaling Technology, clone D3B5, 1:400 dilution), and anti-CXCL9 (Biolegend, clone MIG-2F5.5, 1:100 dilution). Following primary antibody incubation, slides were reblocked for 10 min at RT with horse serum blocking buffer +0.3% Triton X 100. Secondary antibodies were diluted in blocking buffer +0.3% Triton X 100 and applied for 1 hour at RT. Secondary antibodies included Alexa 555 conjugated Goat anti-Chicken IgY (Fisher Scientific, 1:500 dilution) and Alexa 488 conjugated Donkey anti-Rabbit IgG (Fisher Scientific, 1:500 dilution). For nuclear visualization, slides were incubated with 0.5 µg/mL Hoechst 33342 for 15 min at RT. Slides were washed with PBS and mounted using ProLong Gold anti-fade mounting media (Invitrogen). Slides were scanned on a Zeiss Axio Imager Z1 at 20× magnification using the tiled image option in Zen Pro (Zeiss).
Image analysis
Tiled images were stitched using the stitching algorithm in Zen Pro, with shading adjusted according to a reference image. Stitched CZI files were loaded into TissueStudio (Definiens). Cells were identified by detection of Hoechst staining to determine the nuclear structure, with subsequent identification of cytoplasmic staining. The area of each cell, mean intensity of each channel within the cell, and location of the cell on the slide were reported. Cells with an area less than 30 µm2 or greater than 200 µm2 were excluded from further analysis. Threshold intensity levels were set to exclude background fluorescence, and to determine mean intensity levels sufficient to determine cDC1 (based on GFP expression) or CD8+ T cells (based on expression of CD8). Using the (x,y) coordinates of each cell, the distance from each T cell to its nearest cDC1 was determined using in house MATLAB routines (Mathworks). The Kolmogorov-Smirnov test in Prism GraphPad V.9 software was used to compare the distribution of distances from T cells to the nearest cDC1. The data were plotted using the ggplot function in R, which plots the kernel density estimation of distributions such that when integrating over the curve the total probability density sums to 1.
Statistical analyses
Analysis of published single-cell RNA sequencing (scRNAseq) data were performed using the pan-myeloid platform created by Cheng et al. (http://panmyeloid.cancer-pku.cn/). For growth curves significance was determined via two-way analysis of variance (ANOVA) with Tukey’s multiple comparisons test, with significance shown for the final data point. A two-way unpaired t-test or two-way unpaired t-test with Welch’s correction was used for comparison between groups with equal or unequal variance, respectively. Comparisons between multiple groups were performed via one-way ANOVA. Graphs display mean±SEM unless otherwise indicated. Analyses were performed using Prism V.9 (GraphPad). Significance is shown as *p<0.05, **p<0.01, ***p<0.001 as described in each figure legend.
Results
CXCL9 expression by cDC1 is required for response to αTIM-3/PTX
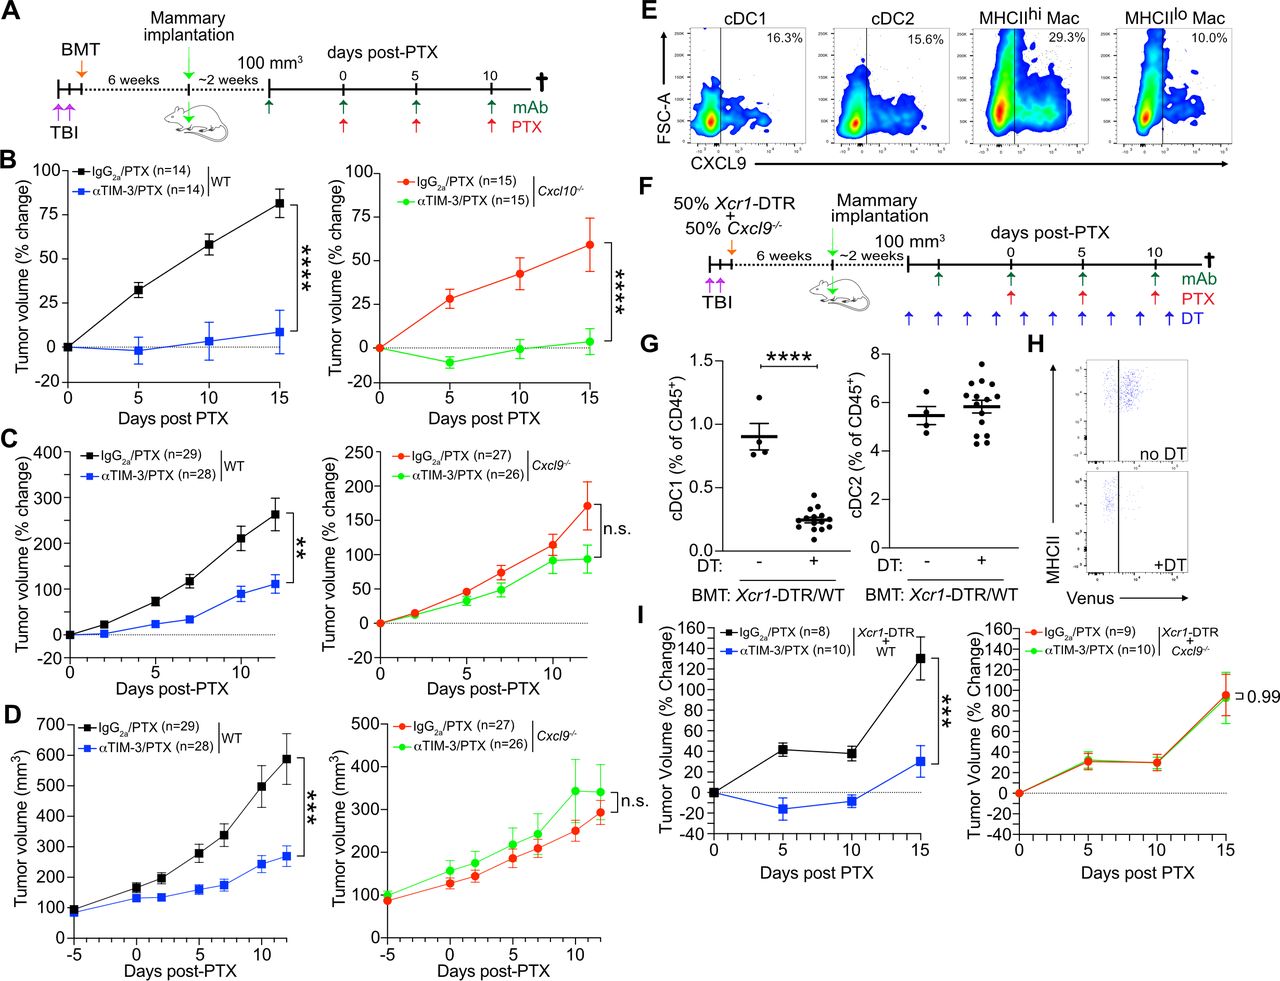
Given that CXCR3 has three known ligands (CXCL9, CXCL10, and CXCL11), we first sought to determine whether a single ligand might be responsible for the CXCR3-dependent response to αTIM-3/PTX. C57BL6/J mice harbor a frameshift mutation in Cxcl11 that leads to a premature stop codon and non-functional CXCL1113; therefore, we focused on the role of CXCL9 and CXCL10 in driving response to αTIM-3/PTX. To generate a sufficient number of age-matched mice for the studies, we irradiated 6-week-old mice and transplanted them with either wild type C57BL6/J (WT), Cxcl9−/−, or Cxcl10−/− BM. PyMT mammary tumors were then implanted after 6 weeks to allow time for immune reconstitution (figure 1A). Mice reconstituted with Cxcl10−/− BM responded similarly to treatment with αTIM-3/PTX as those reconstituted WT BM, indicating that CXCL10 was dispensable for efficacy (figure 1B). In contrast, mice reconstituted with Cxcl9−/− BM failed to respond to αTIM-3/PTX, demonstrating that CXCL9 expression by the hematopoietic compartment was required (figure 1C–D, online supplemental figure S1A).
Supplemental material

CXCL9 expression drives response to TIM-3 blockade. (A) Diagram outlining the experimental approach for the in vivo experiments in (B) and (C). Mice underwent total body irradiation (TBI), followed by reconstitution with the indicated BM. Six weeks following reconstitution, PyMT tumors were implanted orthotopically. Antibody (Ab) treatment was initiated when tumors reached 100 mm3, with paclitaxel (PTX) administered 5 days later, and repeated every 5 days, concurrent with Ab administration. (B) Percent change in tumor volume from the start of PTX administration in mice reconstituted with wild type (WT) (left) or Cxcl10−/− BM (right). Merged data from two independent experiments; n≥14 mice per group. (C) Percent change in tumor volume from the start of PTX administration in mice reconstituted with (WT, left) or Cxcl9−/− BM (right). Merged data from three independent experiments; n≥26 mice per group. (D) Same as (C), but showing tumor volume. (E) CXCL9 expression by myeloid populations within untreated tumors. Representative data from one of two independent experiments. (F) Diagram outlining the experimental approach for the in vivo experiments in (E–G). Diphtheria toxin (DT) was administered every 2 days, starting 2 days prior to the first Ab dose, in order to deplete Xcr1-DTR+cDC1. (G) Quantitation of flow cytometry data showing the specific depletion of cDC1 following administration of DT. (H) Representative flow plot showing DT-mediated depletion of Xcr1-DTR+cDC1. Top panel, representative no DT control mouse; bottom panel, representative DT-treated mouse. (I) Percent change in tumor volume from the start of PTX administration in mice reconstituted with 50% Xcr1-DTR and 50% WT (left) or Cxcl9−/− BM (right). Data from one of two independent experiments; n≥8 mice per group. Significance for B, C, D, and I determined by two-way analysis of variance. Significance for G determined by unpaired t-test. Significance shown as **p≤0.01, ***p≤0.001. cDC, conventional dendritic cells; BM, bone marrow; BMT, bone marrow transplant; DTR, diphtheria toxin receptor; ns, not significant; TIM-3, T cell immunoglobulin and mucin domain containing-3.
As we have previously described, TIM-3 is primarily expressed on cDC1 in MMTV-PyMT orthotopically implanted tumors (online supplemental figure S1B,C), and as such these cells are directly affected by TIM-3 blockade.7 8 However, cDC1s in tumors are relatively infrequent, representing <1% of CD45+ cells, and are not increased by TIM-3 blockade (online supplemental figure S1D). CXCL9 expression is also not limited to cDC1s, with expression by macrophages and the cDC2 subset observed within the tumors (figure 1E). Therefore, to specifically investigate the importance of cDC1-produced CXCL9, we generated mixed BM chimeric mice reconstituted with a 50% mixture of Xcr1-DTR (diphtheria toxin receptor) BM combined with a 50% mixture of either WT or Cxcl9−/− BM (figure 1F). As XCR1 is expressed exclusively by cDC1s, treatment with DT allowed us to selectively deplete this subset, leaving only the WT or Cxcl9−/− cDC1s during administration of therapy (figure 1G–H). This allowed us to interrogate the role of CXCL9 specifically in cDC1s, in addition to allowing tumors to develop in the presence of Cxcl9-proficient Xcr1-DTR+cDC1. As shown in figure 1I, while control mice showed reduced tumor growth during treatment with αTIM-3/PTX, mice receiving 50% Cxcl9−/− BM showed equivalent tumor growth whether treated with αTIM-3/PTX or IgG2a/PTX. Taken together, these data demonstrate that cDC1 expression of CXCL9, but not CXCL10, is critical for the control of mammary tumor growth during αTIM-3/PTX therapy.
CXCR3 regulates T cell effector function but not recruitment during response to αTIM-3/PTX
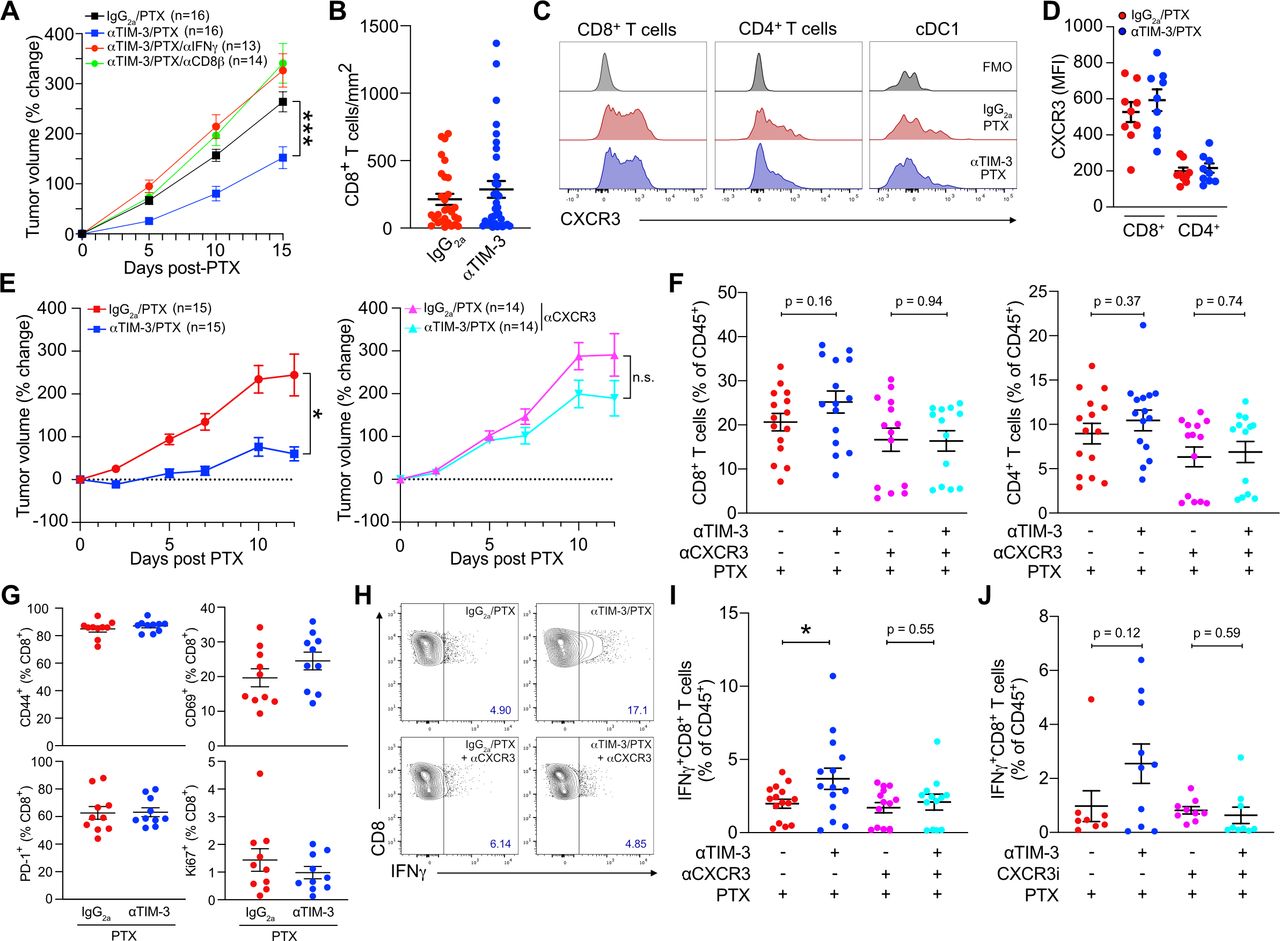
Although response to TIM-3 blockade was CD8+ T cell-dependent (figure 2A), we observed no increase in T cell infiltration by flow cytometry (online supplemental figure S1D) or by quantification of whole tissue sections by immunofluorescent microscopy (figure 2B). This was despite surface expression of CXCR3 by over 60% of tumor-infiltrating CD8+ T cells (figure 2C–D, online supplemental figure S2A). CXCR3 was also found at lower levels on CD4+ T cells and a small population of cDC1s, with no change in expression observed following treatment with αTIM-3/PTX (online supplemental figure S2A). We next sought to determine if the CXCR3-chemokine axis was regulating CD8+ T cell activation or effector function, using an αCXCR3 blocking antibody that prevented response to αTIM-3/PTX (figure 2E) to evaluate the role of this specific pathway in any observed changes. As in previous experiments we found no significant changes in CD8+ or CD4+ T cell infiltration as a result of TIM-3 blockade (figure 2F). Surprisingly though, blocking CXCR3 did not reduce T cell infiltration in any of the groups, suggesting that this pathway is not critical for T cell recruitment into PyMT mammary tumors. No change in infiltration was observed for either CD69+CD103+ tissue-resident memory CD8+ T cells or CD4+FoxP3+ regulatory T cells (online supplemental figure S2B,C).

The CXCR3 axis promotes T cell effector function during TIM-3 blockade. (A) Percent change in tumor volume from the start of PTX administration in mice treated with αTIM-3, αIFNγ and/or αCD8β as indicated. Merged data from two independent experiments; n=13–16 mice per group. (B) CD8+ T cells per mm2 of tumor, quantified from whole tumor immunofluorescent images. Merged data from four independent experiments, n≥28 mice per group. (C) Representative histograms showing CXCR3 expression by tumor CD4+ and CD8+ T cells, as well as cDC1. (D) Mean fluorescence intensity (MFI) of surface CXCR3 on tumor T cells. Representative data from one of three independent experiments, n=9 mice. (E) Mice bearing PyMT tumors were treated with PTX and either αTIM-3 or the IgG2a control, without (left) or with (right) αCXCR3. Merged data from two independent replicates; n≥14 mice per group. (F) Infiltration of CD8+ T cells (left) and CD4+ T cells (right) in the tumors from (E). Shown as a percent of CD45+ cells. (G) Percentage of CD8+ T cells expressing CD69, CD44, Ki67, or PD-1 after isolation from tumors treated with αTIM-3/PTX vs IgG2a/PTX. Representative data from one of two independent experiments, n=10 mice per group. (G) Representative flow plots showing IFNγ expression by CD8+ T cells from PyMT tumors following ex vivo stimulation with PMA and ionomycin, isolated 12 days post PTX. (I) Quantitation of IFNγ expression by CD8+ T cells from (G). (J) Quantitation of IFNγ expression by restimulated CD8+ T cells isolated from mice treated with αTIM-3/PTX or IgG2a/PTX,±AMG487. Merged data from two independent experiments; n≥8 mice per group. Significance in A and E determined by two-way analysis of variance. Significance in F, I, J determined by unpaired t-test. Shown as *p≤0.05, **p≤0.01. cDC1, type 1 conventional dendritic cell; IFNγ, interferon γ; ns, no significance; PD-1, programmed death-1; PMA, phorbol 12-myristate 13-acetate; PTX, paclitaxel; TIM-3, T cell immunoglobulin and mucin domain containing-3.
We therefore focused on expression of activation and effector molecules by CD8+ T cells. There were no changes in the expression of CD69, CD44, PD-1, or Ki67 on either CD8+ T cells (figure 2G) or CD4+ T cells (online supplemental figure S2D) within tumors following TIM-3 blockade. In contrast, following ex vivo stimulation we observed a significant increase in the percentage of IFNγ+CD8+ T cells in mice treated with αTIM-3/PTX (figure 2H). This increase was not observed when CXCR3 was inhibited, either with αCXCR3 (figure 2I) or the small molecule CXCR3 antagonist (±)AMG-487 (figure 2J). Small increases in the percentage of IFNγ+CD4+ T cells in mice treated with αTIM-3/PTX were also observed, but these were not significant (online supplemental figure S2E). Together, these results demonstrate that CXCL9 and CXCR3 play a critical role in the ability of cDC1s to promote the effector function of CD8+ T cells, but suggest that this occurs through a mechanism other than T cell recruitment into tumors.
TIM-3 blockade does not promote antigen presentation in the draining lymph nodes
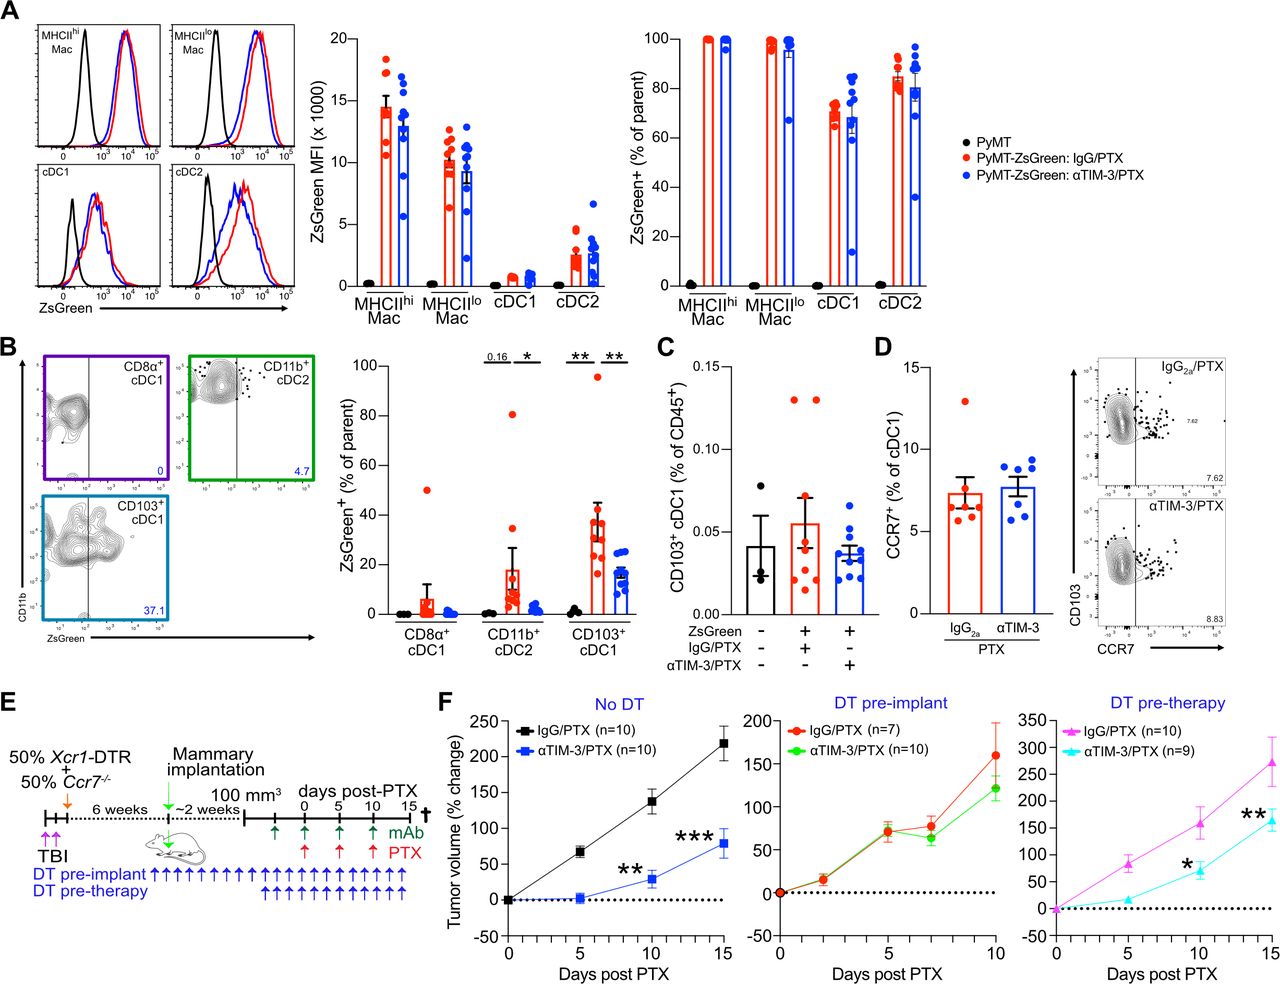
One possible explanation for our results would be enhanced migration of antigen-loaded CD103+ cDC1s into the draining lymph nodes, potentially resulting in expansion of the antigen-specific TCF1+ stem-like population of CD8+ T cells that are necessary to maintain an immune response within tumors.14 15 This could also be CXCR3 dependent, as CXCL9 expression by myeloid cells within the lymph nodes is important for memory responses to viral infections.16 To evaluate this, we made use of a PyMT tumor cell line expressing the pH-insensitive fluorophore ZsGreen (PyMT-ZsGreen). Following treatment with αTIM-3/PTX or IgG2a/PTX, tumors and draining lymph nodes were harvested and the immune cells from each tissue were examined for ZsGreen positivity. ZsGreen positivity was high in macrophages and both cDC subsets within the tumor (figure 3A), although macrophages exhibited higher levels of ZsGreen fluorescence, consistent with the dominant role of macrophages in phagocytosing dead cell antigens.17 However, no differences in ZsGreen uptake by tumor myeloid cells were observed between treatment groups, suggesting that αTIM-3/PTX does not affect uptake of tumor-derived antigens.

TIM-3 blockade does not promote antigen presentation in the draining lymph nodes. Mice bearing orthotopic PyMT-ZsGreen or PyMT (no fluorescence control) tumors were treated with αTIM-3/PTX or IgG2a/PTX. Two days after the second dose of chemotherapy, mice were euthanized and tumors and draining lymph nodes were collected for analysis. (A) Representative ZsGreen within the major tumor-associated APC subsets, mean fluorescence intensity, and percent positivity are shown. Representative data from one of three independent experiments, n=9–10 mice per treatment group. (B) Representative ZsGreen within lymph node cDC populations, along with percent positivity are shown. Representative data from one of three independent experiments, n=9–10 mice per treatment group. Significance determined by one-way analysis of variance and shown as *p≤0.05, **p≤0.01. (C) The total CD103+ migratory cDC1 population within the draining lymph nodes, shown as a percentage of CD45+ cells. (D) Percent of tumor CD103+ cDC1 staining positive for CCR7 in the treatment groups. Representative staining is shown to the right. One of two representative experiments shown, n=7 mice per group. (E) Diagram outlining the experimental approach for the in vivo experiments in (F). Diphtheria toxin (DT) was administered every 2 days, starting 2 days prior to tumor implantation or 2 days prior to the first antibody dose, to deplete Ccr7-proficient Xcr1-DTR+cDC1. (F) Percent change in tumor volume from the start of PTX administration in mice reconstituted with 50% Xcr1-DTR and 50% Ccr7−/− BM. Data merged from two independent experiments, n=7–10 mice per group. Significance determined by two-way analysis of variance and shown as *p≤0.05, **p≤0.01, ***p≤0.001. APC, antigen-presenting cells; BM, bone marrow; cDC1, type 1 conventional dendritic cell; DT, diphtheria toxin; DTR, diphtheria toxin receptor; PTX, paclitaxel; TBI, total body irradiation; TIM-3, T cell immunoglobulin and mucin domain containing-3.
In the lymph nodes, however, treatment with αTIM-3/PTX did affect levels of antigen positivity within cDC subsets, with CD103+ migratory cDC1 from αTIM-3/PTX treated mice exhibiting lower levels of ZsGreen positivity compared with those from IgG2a/PTX treated mice (figure 3B, online supplemental figure S3A). This was true without significant changes in the total percentage of CD103+ migratory cDC1 in the lymph node (figure 3C). Reduced ZsGreen delivery to the draining lymph nodes was presumably responsible for reduced transfer to CD11b+ cDC2, resulting in lower ZsGreen positivity within this population as well.18 The reason for this reduced antigen delivery was unclear as cDCs in the tumor did not display altered levels of CCR7 following αTIM-3/PTX therapy (figure 3D). It is also unclear if this reduced delivery has a functional relevance as we did not observe any changes in the intensity of TCF1 staining within tumor CD8+ T cells (online supplemental figure S3B). Indeed, when we depleted Ccr7-proficient XCR1+ cDC1s from mice using the mixed BM chimeric approach, we found these mice retained the early response to αTIM-3/PTX (figure 3E–F). Only when the depletion of Ccr7-proficient XCR1+ cDC1s was performed prior to tumor implantation was therapeutic efficacy completely blocked, as expected due to the role of these cells in establishing the initial antitumor CD8+ T cell response in the draining lymph nodes.18 That said, the durability of the response to αTIM-3/PTX appeared reduced in the absence of Ccr7-proficient XCR1+ cDC1s (online supplemental figure S3C), suggesting a role for lymph node migration in sustaining the full CD8+ T cell response. Overall, these data support TIM-3 blockade enhancing the ability of cDC1s to promote CD8+ T cell effector function within tumors, while also highlighting the critical role of lymph node migration for inducing and sustaining a T cell response against tumors.
αTIM-3/PTX alters the spatial localization of CD8+ T cells and cDC1 within tumors
cDCs are relatively infrequent within PyMT tumors, and injecting bone marrow-derived cDCs into tumors can delay growth, even when these cells lack Ccr7 (online supplemental figure S3D,E). We therefore hypothesized that CXCL9 expression by cDC1s was important for promoting an interaction with CD8+ T cells, thereby allowing cDC1s to enhance T cell effector function. To evaluate this, we took advantage of specific Venus expression by the cDC1 subset in the Xcr1-DTR mouse model (figure 4A), permitting us to detect the cDC1 population by immunofluorescence using an anti-GFP antibody (figure 4B). After staining for both Venus+ cDC1 and CD8+ T cell populations we set up a workflow to scan whole tumor sections and determine the (x,y) coordinates of each cell (figure 4C). Cells were mapped in two-dimensions, and the distance between each CD8+ T cell and the nearest cDC1 was calculated, allowing the plotting of the cumulative distribution of distances between treatment groups. As shown in figure 4D, adding αTIM-3 to PTX chemotherapy induced a significant shift in the distribution of CD8+ T cells towards cDC1s (Kolmogorov-Smirnov (K-S) D statistic=0.153). This required CXCL9, as increased proximity of CD8+ T cells to cDC1s was not observed after crossing Xcr1-DTR with Cxcl9-deficient mice (figure 4E–F, online supplemental figure S4A). Changes in cell distribution were not due to alterations in the density of T cells or cDC1s within tumors (figure 4B, online supplemental figure S4B). To determine if this change was specific to cDC1s or represented a shift in CD8+ T cells towards stromal regions of the tumor, we also assessed potential changes in the distribution of CD8+ T cells near CD68+ macrophages (online supplemental figure S4C-F). No apparent difference was observed between the IgG2a/PTX and αTIM-3/PTX groups, with the caveat that the density of macrophages was much greater than that of cDC1 and almost all CD8+ T cells were within 100 µm.

TIM-3 blockade promotes colocalization of cDC1 and CD8+ T cells. (A) Representative histograms showing Venus expression by XCR1+ cDC1 in the spleen (left) and tumor (right) of Xcr1-DTR mice. (B) Representative immunofluorescent microscopy (IF) images showing XCR1+ cDC1 detected in the spleen (left) and tumor (right) of Xcr1-DTR mice, using a polyclonal anti-GFP antibody to detect Venus expression. Scale bars: large image, 100 µm; inset, 50 µm. (C) Flow chart showing the procedure for determining the distance between CD8+ T cells and the nearest cDC1. Following immunofluorescent staining for CD8 and GFP/Venus tumors are scanned and the (x,y) coordinates of each cell is acquired using Definiens TissueStudio analysis software. The (x,y) coordinates are then plotted in MATLAB and used to calculate the distance between each CD8+ T cell and the nearest cDC1. Tumors for each treatment group are then merged, and distances are plotted as a histogram. (D) Kernel density estimate of the distribution of the total T cell population with respect to the distance between a CD8+ T cell and its nearest cDC1. IgG2a/PTX treated tumors shown in red, αTIM-3/PTX treated tumors in blue. Representative image showing nucleus (blue), CD8+ T cells (green), and cDC1s (red) is shown to the right. Scale bar, 100 µm. (E) Quantification of CXCL9 expression by MHCII+CD11c+ splenic cDCs in Xcr1-DTR and Xcr1-DTR/Cxcl9−/− mice. (F) Kernel density estimate of the distribution of CD8+ T cells in Xcr1-DTR/Cxcl9−/− mice. (G) Representative IF stained tumor, showing Hoechst (blue), CD8α (green), XCR1 (red), Ki67 (magenta). Arrow indicates a Ki67+CD8+ T cell. Scale bars: 100 µm, large image; 50 µm, inset. (H) Kernel density estimate of the distribution of Ki67- (green) and Ki67+ (blue) CD8+ T cells in IgG2a/PTX (left, n=28) or αTIM-3/PTX (right, n=34) treated tumors. (I) Kernel density estimate of the distribution of the Ki67+CD8+ T cell population within IgG2a/PTX treated tumors (red) vs αTIM-3/PTX treated tumors (blue). Statistical differences between T cell localization distributions determined by non-parametric Kolmogorov-Smirnov test, with the Kolmogorov-Smirnov D statistic shown. cDC, conventional dendritic cell; DTR, diphtheria toxin receptor; GFP, green fluorescent protein; PTX, paclitaxel; TIM-3, T cell immunoglobulin and mucin domain containing-3.
Expression of the proliferation marker Ki67 identifies effector CD8+ T cells during response to PD-1/L1 blockade19 20 and works robustly for immunofluorescent staining (figure 4G). We therefore sought to use this marker to characterize the distribution of CD8+Ki67+ T cells and determine if it was altered during αTIM-3/PTX treatment. In IgG2a/PTX treated tumors, CD8+Ki67+ and CD8+Ki67− T cells were equally distributed in relation to the nearest tumor cDC1 (figure 4H). However, in αTIM-3/PTX treated tumors we observed that CD8+Ki67+ T cells were shifted towards cDC1 compared with CD8+Ki67− T cells (K-S D statistic=0.124). Combined with the overall shift in T cell distribution following TIM-3 blockade (figure 4D), CD8+Ki67+ T cells were substantially closer to the nearest cDC1 (K-S D statistic=0.239) in tumors treated with combination therapy (figure 4I). This shift in the spatial localization of cells was not driven by changes in the density of the CD8+Ki67+ T cells or the percentage of CD8+ T cells staining positive for Ki67 (online supplemental figure S4G,H). There was also no difference in CXCR3 expression between CD8+Ki67− or CD8+Ki67+ cells (online supplemental figure S4I). Regardless, TIM-3 blockade reduced the distance between XCR1+ cDC1 and CD8+ T cells, in particular the Ki67+ population.
cDC1 production of IL-12 is critical for response to αTIM-3/PTX
We next sought to determine how cDC1 and CD8+ T cell interactions were driving response to αTIM-3 and PTX combination therapy. CXCR3 ligands are not known to regulate T cell activation, suggesting either increased antigen presentation or exposure to stimulatory cytokines. To interrogate the relevance of these functions, we again made use of the mixed BM chimera model system to allow for a normal immune response to develop following tumor implantation, as well as selective depletion of cDC1 expressing the gene of interest (figure 5A). As shown in figure 5B, B2m expression by cDC1s was dispensable for response to αTIM-3/PTX, indicating that direct antigen presentation via MHCI was not required for therapy, despite the importance of cDC1s for the initiation of a de novo CD8+ T cell activation in the draining lymph nodes.18 21 22 This is perhaps not surprising given the limited amount of tumor-derived antigen displayed on the surface of cDC1s, as compared with macrophages (online supplemental figure S5A), and the critical role of intratumoral CD8+ T cells for response to TIM-3 blockade.
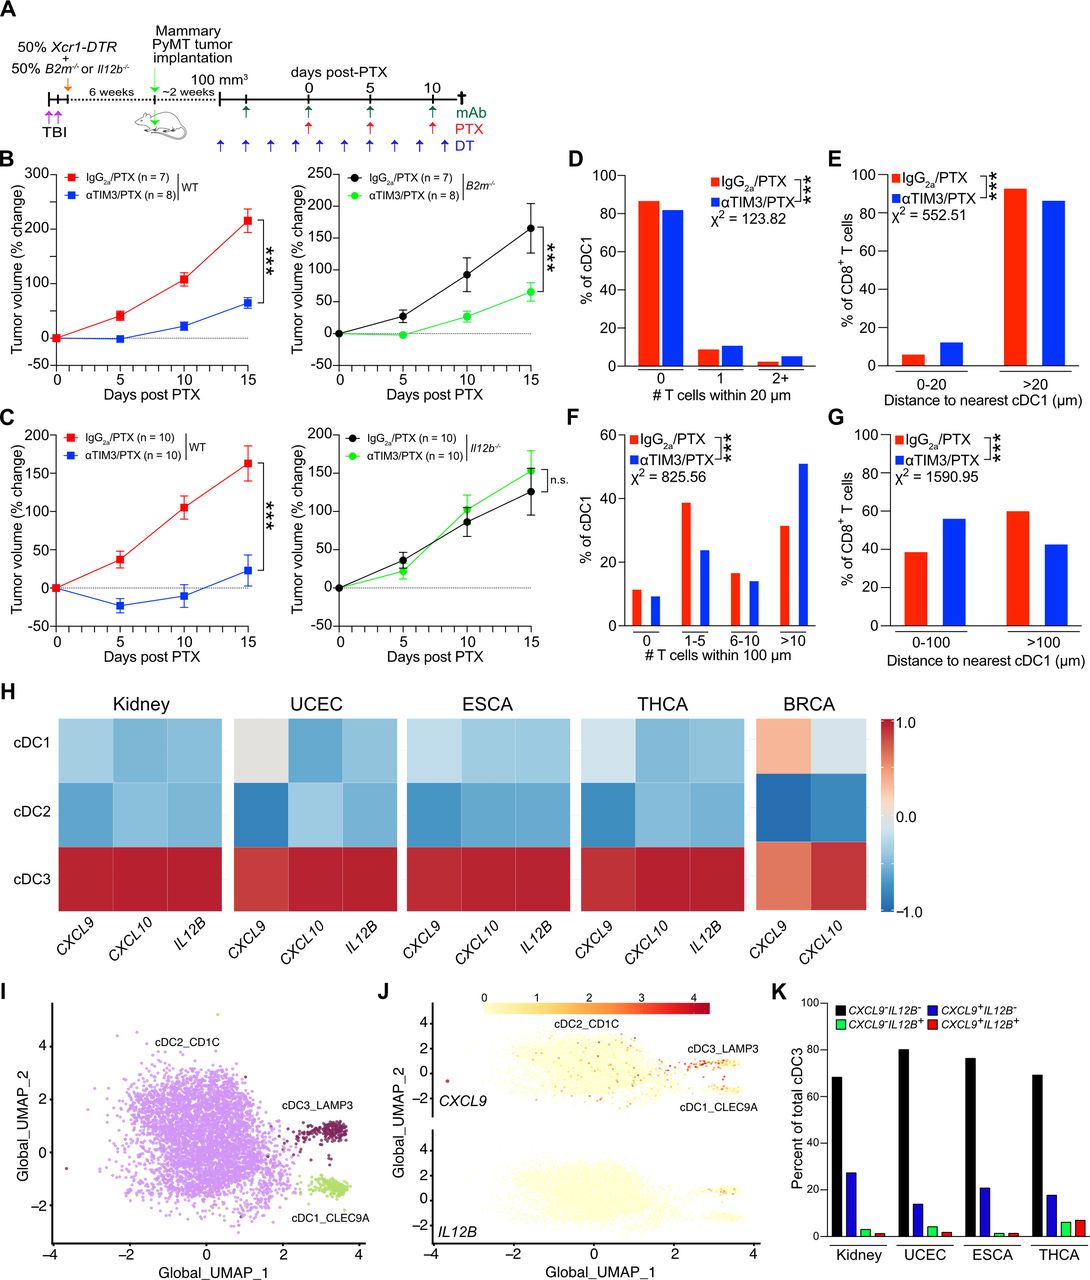
cDC1 production of IL12 is required for response to PTX/αTIM-3. (A) Diagram outlining the experimental approach for the in vivo experiments in (B) and (C). (B) Percent change in tumor volume as compared with the start of PTX administration in mice reconstituted with 50% Xcr1-DTR and 50% WT bone marrow (left) or B2m−/− bone marrow (right). n=7–8 mice per group, representative data from two independent experiments is shown. (C) Percent change in tumor volume in mice reconstituted with 50% Xcr1-DTR and 50% WT (left) or Il12b−/− (right) bone marrow. n=10 mice per group, representative data from two independent experiments is shown. For (B–C), *** indicates p≤0.001 by two-way analysis of variance. (D) The number of T cells within 20 µm of a given cDC1. (E) The percentage of T cells within 20 µm of a given cDC1. (F) The number of T cells within 100 µm of a given cDC1. (G) The percentage of T cells within 100 µm of a given cDC1. Data in (D–G) quantified from the images in figure 3. Statistical difference between T cell localization distributions determined by χ2 test, with the χ2 value shown and *** indicating p≤0.001. (H) Expression of CXCL9, CXCL10, and IL12B in cDC1, cDC2, and cDC3 subsets by single-cell RNA sequencing in human kidney, uterine, esophageal, thyroid, and breast cancers. (I–J) UMAP plot showing the cDC subsets from human kidney carcinomas and expression of CXCL9 and IL12B. (K) Coexpression of CXCL9 and IL12B by individual cells in human kidney, uterine, esophageal, and thyroid cancers. BRCA, breast carcinoma; cDC1, type 1 conventional dendritic cell; DT, diphtheria toxin; DTR, diphtheria toxin receptor; ESCA, esophageal carcinoma; IL, interleukin; PTX, paclitaxel; TBI, total body irradiation; THCA, thyroid carcinoma; TIM-3, T cell immunoglobulin and mucin domain containing-3; UCEC, uterine corpus endometrial carcinoma; UMAP, uniform manifold approximation and projection; WT, wild type.
cDC1s are a critical source of IL-12 within tumors and IL-12 is necessary for CD8+ T cell-dependent responses in tumors.12 23 IL-12 also drives IFNγ expression by activated CD8+ T cells (online supplemental figure S5B) and is required for response to TIM-3 blockade (online supplemental figure S5C). Thus, we repeated the mixed BM chimera experiments, this time reconstituting irradiated mice with 50% Il12b−/− BM (figure 5C). In this case, administration of DT to induce depletion of the Il12-proficient Xcr1-DTR+ cells completely abrogated response to αTIM-3/PTX, without having an impact on tumor growth in the presence of chemotherapy alone. The critical role of cDC1s in producing IL-12, as opposed to presenting tumor antigen, was consistent with the minimal increase in the percentage of CD8+ T cells within physical proximity to each cDC1 (<20 µm), as well as the limited number of CD8+ T cells around a given cDC1 (figure 5D–E). In contrast, there was a substantial increase in the percentage of CD8+ T cells within the range of peak cytokine exposure (<100 µm)24 as a result of αTIM-3/PTX, with a greater percentage of cDC1s having more than 10 CD8+ T cells within this radius (figure 5F–G).
Using scRNAseq, IL12B expression has been isolated to a specific population of activated/mature CD83+LAMP3+CCR7+ cDCs.25 26 In most human tumors, developmental trajectory analysis indicates that this mature LAMP3+ population largely derives from the cDC1 lineage.27 Using these data, we sought to evaluate the extent to which CXCL9 and IL12B were coexpressed within cDC populations. As shown in figure 5H, expression of CXCL9, CXCL10, and IL12B were enriched in the LAMP3+ cDC3 subset in carcinomas of the kidney, uterus, esophagus, and thyroid, as compared with the cDC1 or cDC2 population. CXCL9 and CXCL10 expression was also observed in the LAMP3+ cDC3 population in breast cancer, but no transcripts for IL12B were detected in this dataset. Despite expression of CXCL9 and IL12B within the same population of cells, we observed limited overlap between gene expression within individual cells (figure 5I–J). Instead, IL12B expressing cells were evenly distributed across CXCL9+ and CXCL9− cDC3s in all four types of carcinomas (figure 5K). This could suggest that CXCL9 production by cDCs may be insufficient to drive cDC and T cell interactions in the absence of therapy.
Discussion
Although the localization of cDC1s near CD8+ T cells is known to affect immune responses in non-tumor immune contexts,28–32 the critical role of cDC1s in transporting tumor antigen into draining lymph nodes and cross-presenting peptide-MHCI complexes to CD8+ T cells has been the primary focus of therapies targeting these cells in cancer.18 21 33 While it has been speculated that cDC1s may be important for presenting antigen to tumor infiltrating T cells, our data suggest this is not the case in the context of PTX chemotherapy and TIM-3 blockade. Whether the reduced delivery of antigens to the draining lymph nodes limits the durability of the response to TIM-3 blockade, and how this might impact the efficacy of αPD-1, remains to be determined. Regardless, combined with the recent description of CXCL16 production by cDCs leading to enhanced CD8+ T cell survival through IL-15 trans-presentation,34 these findings underscore an important role for tumor cDCs in regulating the spatial distribution of CD8+ T cells and promoting their effector function via cytokines.
Using mixed BM chimeras, we found that expression of both Cxcl9 and Il12b by cDC1s were critical for response to therapy. This is consistent with neutralization of IL-12 or inhibition of CXCR3 preventing response to αTIM-3/PTX8 and limiting T cell effector function. However, it was previously unclear how IL-12 and CXCR3 chemokines were cooperating to regulate response to TIM-3 blockade, as Il12b expression by myeloid cells was not impacted by therapy, while increased expression of Cxcl9 and Cxcl10 by cDC1s did not alter T cell infiltration into tumors. We describe here that TIM-3 blockade reduces the distance between CD8+ T cells and XCR1+ cDC1s, and that this shift is dependent on Cxcl9. Notably, TIM-3 blockade had less impact on the density of CD8+ T cells within the range of cell-to-cell contact with cDC1s, with the greater difference noted in the density of cells within an area amenable to cytokine exposure. This suggests that CXCL9 expression increases the proximity of CD8+ T cells to cDC1s producing IL-12, thereby enhancing cytokine exposure and promoting effector function.35 36 This also offers a potential explanation for our observation that Ki67+CD8+ T cells are located closer to cDC1s than Ki67−CD8+ T cells during αTIM-3/PTX therapy, since IL-12 can promote T cell proliferation.37 However, since we saw no increase in the density or frequency of Ki67+CD8+ T cells, we cannot rule out other explanations such as preferential response to chemokines or increased migratory capacity.
CXCL9 and IL-12 expression by cDC1s are also necessary for response to αPD-1 immunotherapy, with increased IFNγ production by T cells able to enhance chemokine and cytokine expression by tumor cDCs.19 23 It seems likely that CXCL9 will play a similar role in promoting localization of CD8+ T cells and cDC1s during αPD-1 treatment, but this remains to be evaluated. Although we observed higher IFNγ expression by CD8+ T cells during response to αTIM-3/PTX, and this was reversed by inhibition of CXCR3 signaling, we find no change in Il12b expression following αTIM-3 blockade in vivo.8 It is unclear how CXCL9 can promote CD8+ T cell exposure to IL-12 and increase expression of IFNγ by these cells, without a corresponding response to IFNγ by cDC1s. Potentially this is due to broad expression of the IFNγ receptor, with a higher number of cytokine consumers causing a reduction in the effective diffusion distance of IFNγ.24 In contrast, PyMT tumor cells do not express either subunit of the IL-12 receptor, and high expression of Il12rb1 is restricted to T cells in this model.12 These diffusion-consumption mechanics could result in cDC1 unidirectionally regulating T cell effector function in tumor environments with poor IFNγ expression.
The critical role for CXCR3 in driving T cell infiltration into tumors has been extensively described,38 with CXCR3 chemokine expression by tumor cells, macrophages, and cDC1s important in different systems.39–41 Given this, it is surprizing that CXCR3 inhibition did not impact T cell infiltration in PyMT tumors. This could reflect relatively poor T cell infiltration overall in this tumor model, or alternative chemokines being important. Regardless, the data indicates that boosting expression of CXCL9 and CXCL10 can prove efficacious across cancer types. Beyond ICB with αTIM-3 or αPD-1, this includes therapies that target epigenetic regulators.39 42 It will be interesting to determine if improving chemokine expression by cDC1s can prove synergistic with approaches that augment IL-12 expression, such as neutralizing IL-4 and blocking the IL-10 receptor.12 26 It will also be interesting to see if therapeutic efficacy will depend on the temporal and spatial dynamics of T cell and cDC1 interactions in the tumors, for example, by bringing CD8+ T cells into proximity with cDC1 prior to administering stimulatory therapies. It is therefore notable that the spatial localization of CD8+ T cells with other immune populations, including CLEC9A+ cDC1s, is associated with response to single agent αPD-1 in triple negative breast cancer.43
Supplemental material
Data availability statement
Data sharing not applicable as no data sets generated and/or analysed for this study.
Ethics statements
Patient consent for publication
Ethics approval
This study does not involve human participants.
References
Supplementary materials
Supplementary Data
This web only file has been produced by the BMJ Publishing Group from an electronic file supplied by the author(s) and has not been edited for content.
Footnotes
Contributors Conceptualization: BR. Methodology: AG. Formal analysis: KAR. Investigation: AG, AdMP, KH, SB, AO, AK. Writing—Original draft: AG and BR. Writing—review and editing: AG, JRC-G, KAR and BR. Supervision: BR. Funding acquisition: BR. Overall content guarantor: BR.
Funding This work was supported by the Moffitt Cancer Center Flow Cytometry, Analytic Microscopy and Tissue Core Facilities, all comprehensive cancer center facilities designated by the National Cancer Institute (P30-CA076292). The authors would like to thank Vivian Lee, Leenil Noel and Aysenur Keske for technical assistance. AG was supported by a NIH NRSA Predoctoral Fellowship (F31CA224963) and a NIH/NCI Predoctoral to Postdoctoral Fellow Transition Award (F99CA245807). KH was supported by a Postdoctoral Fellowship from the Swiss National Science Foundation. Research reported herein was supported by the Florida Breast Cancer Foundation, the Shula Fund at Moffitt Cancer Center, the Florida Department of Health Bankhead-Coley Cancer Research Program (8BC02), the Department of Defense Breast Cancer Research Program (W81XWH-20-1-0012) and the NIH/NCI (R00CA185325, R01CA230610), all to BR.
Competing interests BR has received payments from Merck & Co and Roche Farma SA for consulting. BR has previously had a sponsored research agreement with Tesaro: A GSK Company. JRC-G, KAR and BR have courtesy faculty appointment at the University of South Florida, Tampa, Florida.
Provenance and peer review Not commissioned; externally peer reviewed.
Supplemental material This content has been supplied by the author(s). It has not been vetted by BMJ Publishing Group Limited (BMJ) and may not have been peer-reviewed. Any opinions or recommendations discussed are solely those of the author(s) and are not endorsed by BMJ. BMJ disclaims all liability and responsibility arising from any reliance placed on the content. Where the content includes any translated material, BMJ does not warrant the accuracy and reliability of the translations (including but not limited to local regulations, clinical guidelines, terminology, drug names and drug dosages), and is not responsible for any error and/or omissions arising from translation and adaptation or otherwise.