Article Text

Abstract
Background Immune checkpoint blockade (ICB) response in recurrent/metastatic head and neck squamous cell carcinoma (HNSCC) is limited to 15%–20% of patients and underpinnings of resistance remain undefined.
Methods Starting with an anti-PD1 sensitive murine HNSCC cell line, we generated an isogenic anti-PD1 resistant model. Mass cytometry was used to delineate tumor microenvironments of both sensitive parental murine oral carcinoma (MOC1) and resistant MOC1esc1 tumors. To examine heterogeneity and clonal dynamics of tumor infiltrating lymphocytes (TILs), we applied paired single-cell RNA and TCR sequencing in three HNSCC models.
Results Anti-PD1 resistant MOC1esc1 line displayed a conserved cell intrinsic immune evasion signature. Immunoprofiling showed distinct baseline tumor microenvironments of MOC1 and MOC1esc1, as well as the remodeling of immune compartments on ICB in MOC1esc1 tumors. Single cell sequencing analysis identified several CD8 +TIL subsets including Tcf7 +Pd1− (naïve/memory-like), Tcf7 +Pd1+ (progenitor), and Tcf7-Pd1+ (differentiated effector). Mapping TCR shared fractions identified that successful anti-PD1 or anti-CTLA4 therapy-induced higher post-treatment T cell lineage transitions.
Conclusions These data highlight critical aspects of CD8 +TIL heterogeneity and differentiation and suggest facilitation of CD8 +TIL differentiation as a strategy to improve HNSCC ICB response.
- head and neck neoplasms
- tumor microenvironment
- lymphocytes
- tumor-infiltrating
Data availability statement
Data are available in a public, open access repository. Data are available on reasonable request. The datasets from this study are in NCBI GEO [GSE153383] and include bulk RNA-seq, WES, scRNA-seq, and scTCR-seq and are available to the scientific community. CyTOF data and custom code used in this work are available on reasonable request. MOC cell lines have been deposited with Kerafast.
This is an open access article distributed in accordance with the Creative Commons Attribution Non Commercial (CC BY-NC 4.0) license, which permits others to distribute, remix, adapt, build upon this work non-commercially, and license their derivative works on different terms, provided the original work is properly cited, appropriate credit is given, any changes made indicated, and the use is non-commercial. See http://creativecommons.org/licenses/by-nc/4.0/.
Statistics from Altmetric.com
Introduction
PD1 blockade with nivolumab or pembrolizumab has shown durable antitumor efficacy in recurrent/metastatic head and neck squamous cell carcinoma (HNSCC) patients although only 15%–20% of patients respond to the therapy.1 2 Immune checkpoint blockade (ICB) therapies aim to target the interaction between coinhibitory ligands and receptors, such as between PD-L1 and PD1, to reinvigorate dysfunctional tumor infiltrating T cells. Various factors have been reported to impact the efficacy of ICB therapy, including tumor mutation or neoantigen burden,3–5 cancer cell intrinsic factors,6 7 T cell infiltration,8 PD-L1 expression,9 IFNγ signaling pathway activity, antigen presentation,10–12 an immunosuppressive tumor microenvironment (TME),13 14 and gut microbiome composition.15–17 However, important details about the cellular mechanism of ICB-induced tumor rejection are still lacking. In both chronic infection and various cancers, T cell exhaustion induced by chronic TCR signaling, as opposed to acute antigen clearance, represents a distinct transcriptional and epigenetic state in T cell differentiation.18–20
Recent studies have begun to investigate the heterogeneity of antigen specific CD8 +tumor infiltrating lymphocytes (TILs) and how subpopulations contribute to ICB treatment and tumor response. Mouse models of chronic lymphocytic choriomeningitis virus (LCMV) and B16 melanoma expressing SIINFEKL identified a unique subset of Tcf7 +Pd1+ ‘progenitor’ cells as a major CD8 +T cell subpopulation responsive to anti-PD1 therapy.21 22 As these findings were all discovered from high affinity model antigens, the implications for total CD8 +TIL heterogeneity, T cell lineage dynamics, and the differential response of T cell subsets to anti-PD1 or anti-CTLA4 treatment are unclear. These investigations are important to our understanding of ICB mediated responses in human tumors where a wide range of natural antigens is present.
We previously developed novel syngeneic murine oral carcinoma (MOC) models that recapitulate cardinal features of human HNSCC.23 24 In this study, using three murine HNSCC models that display distinct sensitivity or resistance phenotypes to anti-PD1 or anti-CTLA4 therapy, we comprehensively characterized the TME, as well as the T cell transcriptomic profile and lineage dynamics using single-cell mass cytometry (CyTOF), RNA-seq (scRNA-seq), and T cell receptor sequencing (scTCR-seq). Together this study highlights that, globally, T cells are distributed in distinct differentiation states in the HNSCC TME, and a successful anti-PD1 or anti-CTLA4 treatment induces an enhanced differentiation of T cells to more activated/differentiated states.
Methods
Cell lines and mice
Mouse oral squamous cell carcinoma models, MOC1, MOC1esc1, and MOC22 were maintained as previously described23 24 in IMDM/Hams-F12 (2:1) supplemented with 5% heat inactivated FBS, 100 U/mL penicillin streptomycin, 5 ng/mL EGF (Millipore), 400 ng/mL hydrocortisone (Sigma Aldrich), and 5 µg/mL insulin (Sigma Aldrich). Cell lines were routinely tested for mycoplasma every 6 months. Female wild type C57BL/6 mice (Taconic Biosciences, 7–10 weeks age, acclimatized for 48 hours) and NSG (NOD.Cg-PrkdcscidIl2rgtm1Wjl/SzJ) were housed in a pathogen-free animal facility. All experiments performed were approved by the Dana-Farber Cancer Institute IACUC.
Tumor implantation and in vivo antibody treatment
For tumor implantation, MOC cells were harvested and washed extensively with cold endotoxin free PBS. For scRNA-seq and mass cytometry experiments, 5*106 MOC1, MOC1esc1, or MOC22 cells were injected for each tumor in a volume of 150 µL. Tumor cells were injected subcutaneously into the flank of each mouse (sample size based on historical data). For tumor growth monitoring, 106 cells were injected for each tumor. ICB therapy was performed by IP injections of anti-PD1 (250 µg per mouse for each injection), and isotype control (250 µg per mouse for each injection), or anti-CTLA4 (200 µg per mouse for the first injection, and 100 µg per mouse for the second and third injections) on days 3, 6, 9 post-tumor implantations. For Treg depletion study, mice were IP injected with 200 µg of anti-CD25 antibody every 7 days beginning 1 day before tumor implantation. For tumor-associated macrophages (TAM) depletion study, mice were IP injected with 1 mg of anti-CSF1R antibody every 3 days beginning 1 day before tumor implantation. Additional information is in online supplemental methods.
Supplemental material
Mass cytometry
CyTOF staining was performed as previously described.25 Cells were analyzed on a Helios mass cytometer (Fluidigm). Normalization and deconvolution of the single pooled sample was conducted with the normalizer and the single-cell-debarcoder software developed in the Nolan Lab (Stanford). Data analysis was conducted using Cytobank (Cytobank).
ScRNA-seq and TCR-seq
Note, details on additional genomic analysis are in online supplemental methods. ScRNA-seq and TCR-seq processing was completed using the 10× Chromium instrument (10× Genomics). The single-cell RNA-seq libraries were processed using Chromium single-cell 5’ library and gel bead kit and coupled TCR-seq libraries were obtained using Chromium single-cell V(D)J enrichment kit (10× Genomics). Quality control for amplified cDNA libraries and final sequencing libraries were performed using Bioanalyzer High Sensitivity DNA Kit (Agilent). Both scRNA-seq and TCR-seq libraries were normalized to 4 nM concentration and pooled in a volume ratio of 4:1. The pooled mouse libraries were sequenced on an Illumina NovaSeq S4 platform.
ScRNA-seq data were aligned to the MM10 reference genome. The raw sequencing data were processed with Cell Ranger V.3.0.2 software (https://www.10xgenomics.com/) for initial quality control. Filtered gene-barcode matrix files were further parsed with Seurat V.3.0.01 for fine-grain quality control and downstream analyses.
Diffusion map and pseudotime analysis
Single-cell pseudotime trajectories were constructed by diffusion maps using R package destiny.26 Naïve/memory and exhaustion gene sets from the GSEA/mSigDB hallmark gene set collection38 (http://software.broadinstitute.org/gsea/msigdb/collections.jsp%23H: M5834 and M3012) were used as input gene matrix for the diffusion map analysis. To visualize the T cell differentiation trajectory, we extracted the first component from the diffusion map results, and the coefficients in this component were presented.
Data processing of scTCR-seq libraries
TCR sequencing data were aligned to the MM10 reference genome and RefSeq gene models using cellranger vdj (https://www.10xgenomics.com/). TCR alpha and beta chain sequences from individual cell were used to infer clonotypes. The clonotype comparison feature in Loupe Cell Browser (10× Genomics) was then used to pool TCR clonotypes across groups by matching CDR3 amino acids of both TCR alpha and beta chains . Clonotypes were assigned a clonal expansion pattern based on their clone sizes shared between cells in individual samples.
Statistical analysis
For in vitro and in vivo mouse model studies, data are plotted as the mean±SD or mean±SEM. Statistical significance was determined by student’s t-test, one-way analysis of variance (ANOVA) and two-way ANOVA (GraphPad Prism). Significance differences p<0.05, 0.01, 0.001 were symbolized as *, **, and ***, respectively. The statistical methods used for bulk RNA-seq and single cell analysis are described within the figure legend.
Availability of data and materials
The processed data from this study are at NCBI GEO (GSE153383), which include bulk RNA-seq, WES, scRNA-seq, and scTCR-seq, The raw sequencing data are at https://www.ncbi.nlm.nih.gov/bioproject/?term=PRJNA641208. Both are available to the scientific community. CyTOF data and custom code used in this work are available on reasonable request. MOC cell lines have been deposited with Kerafast.
Results
MOC1 tumors display treatment-induced resistance to anti-PD1 therapy
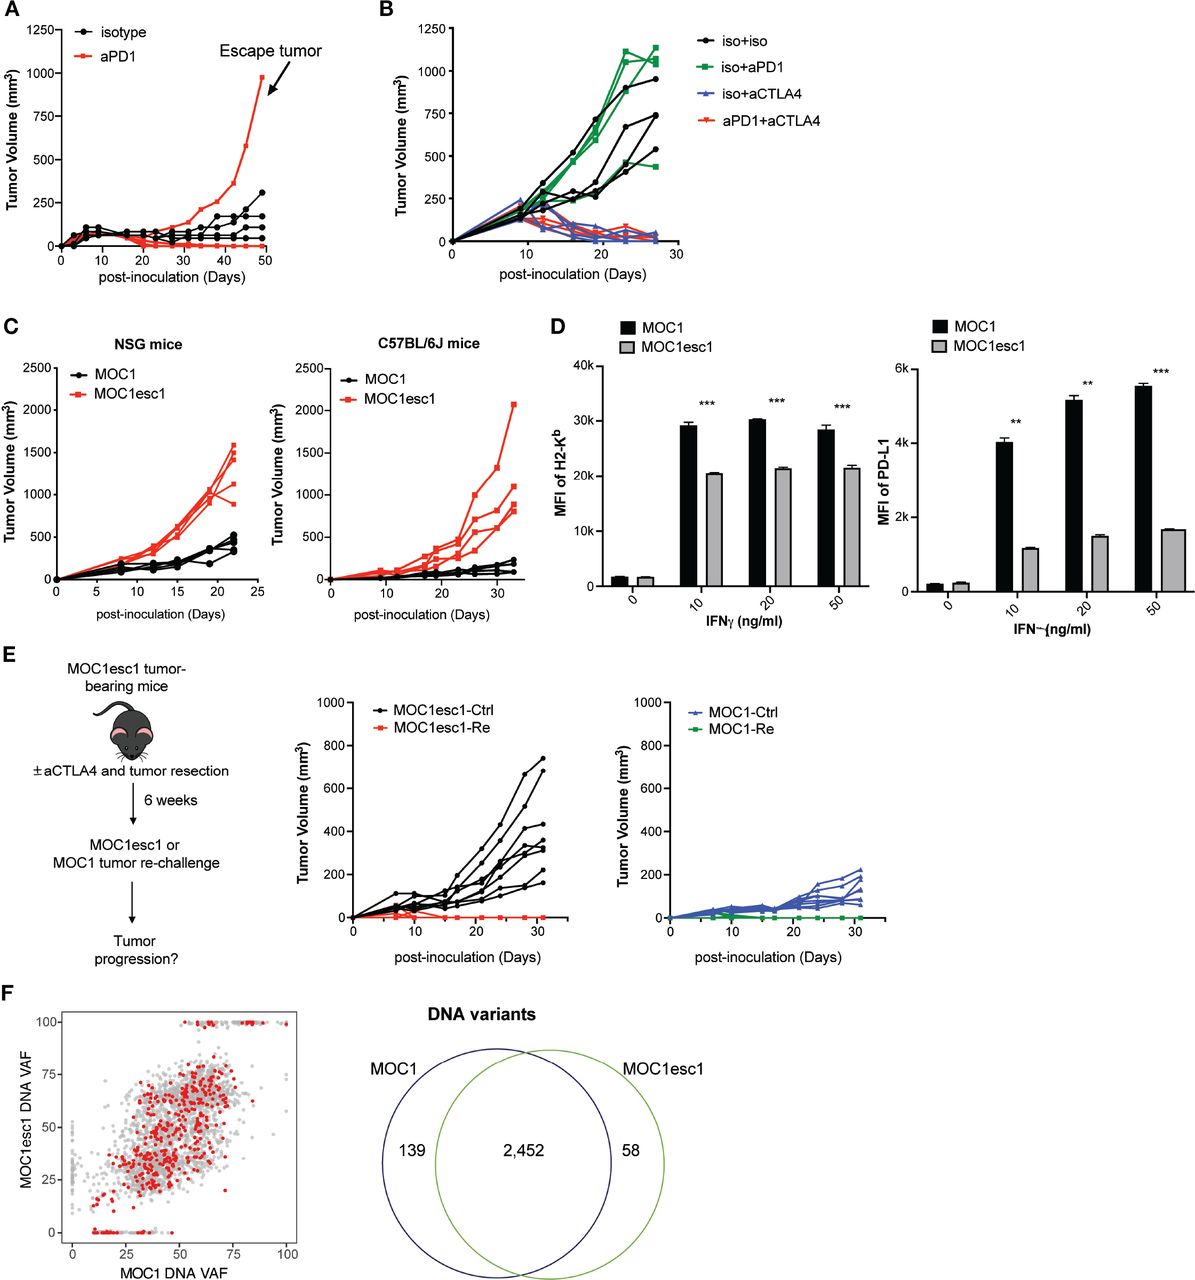
MOC1 is a syngeneic C57BL/6 background cell line model which was derived from a carcinogen-induced oral cavity squamous cell carcinoma. A majority of MOC1 tumors show complete response to anti-PD1 treatment, although 20% of mice reproducibly display an escape phenotype (n=4–5 mice, from two independent experiments, figure 1A, online supplemental data 1A). In addition, MOC1 tumors are sensitive to anti-CTLA4 treatment with no evident escape phenotype (online supplemental data 1B). To dissect the mechanisms of MOC1 resistance to anti-PD1, we generated a cell line (MOC1esc1) from a single escape tumor. When MOC1esc1 cells were retransplanted into naïve wild-type mice and treated with anti-PD1, these tumors displayed complete resistance (figure 1B). Thus, MOC1 and MOC1esc1 represent an isogenic model pair with parental sensitive and anti-PD1 resistant phenotypes, respectively (figure 1B). Interestingly, MOC1esc1 tumors remained sensitive to anti-CTLA4 treatment (online supplemental data 1B, figure 1B).
Supplemental material

A carcinogen-induced HNSCC model, MOC1, displays adaptive resistance to anti-PD1. (A) MOC1 anti-PD1 sensitivity and escape tumor growth. MOC1 bearing C57BL/6 mice were treated with anti-PD1 or isotype control on days 3, 6 and 9 (n=4–5 each group). This experiment was repeated two times. The indicated escape tumor was harvested and cultured to generate polyclonal MOC1esc1. (B) C57BL/6 mice bearing MOC1esc1 tumors were resistant to anti-PD1, but sensitive to anti-CTLA4 therapy (n=4 per group). (C) Growth curves of MOC1 and MOC1esc1 tumors in immunodeficient NSG or immunocompetent C57BL/6 mice (n=4 per group). (D) Cell surface protein levels of H2-Kb and PD-L1 on MOC1 and MOC1esc1 treated with indicated IFNγ concentrations for 48 hours were measured by flow cytometry (**p<0.01, ***p<0.001). Significance was calculated by unpaired Student’s t-test. Data are shown as Mean±SD, n=3 per group. (E) Tumor rechallenge studies. C57BL/6 mice implanted with MOC1esc1 tumors were cured of tumor with anti-CTLA4 (50%) and surgical resection as needed (50%) of any residual or growing tumors. After 6 weeks of rest, tumor free mice were rechallenged with parental MOC1 or MOC1esc1 lines and monitored for tumor growth. Age-matched naive C57BL/6 mice were implanted with MOC1 or MOC1esc1 as control groups. n=6–8 per group. (F) Clonality plots comparing variant allele frequency (VAF) of single nucleotide variants (SNVs) in MOC1 and MOC1esc1 lines, with red dots representing predicted neoantigens. Venn diagram showing the numbers of SNVs in MOC1 and MOC1esc1 lines. HNSCC, head and neck squamous cell carcinoma; MOC1, murine oral carcinoma.
The tumor growth rate of MOC1esc1 was faster than MOC1 in both immunocompromised NOD.Cg-PrkdcscidIl2rgtm1Wjl/SzJ (NSG) mice and immunocompetent C57BL/6 mice, consistent with an overall more aggressive phenotype (figure 1C). As immune editing induced by anti-PD1 treatment might result in attenuation of antigen presentation or antigen-loss,27 we asked whether MOC1esc1 represented such a variant of MOC1. We evaluated basal and IFNγ stimulated cell surface Class I H2-Kb and PD-L1 levels of MOC1 and MOC1esc1 cells. While MOC1 and MOC1esc1 cells had similar basal levels of H2-Kb and PD-L1, MOC1esc1 showed significantly lower cell surface expression levels of both H2-Kb and PD-L1 in response to IFNγ stimulation (figure 1D, online supplemental data 1C), indicating a reduced IFNγ response in MOC1esc1 cells.
We next asked whether MOC1esc1 shared the same major antigens as MOC1. We performed MOC1 tumor rechallenge experiments in mice cured of MOC1esc1 via anti-CTLA4 and surgical resection of any residual tumors (figure 1E). MOC1esc1-experienced mice uniformly rejected MOC1 tumor re-challenge, further indicating that the major antigens of MOC1 were still maintained in MOC1esc1 (figure 1E). In addition, whole exome sequencing of the two cell lines identified 2452 overlapping variants out of 2649 total variants detected from either cell line (figure 1F). Via NetMHC pan V.4.0 prediction coupled with RNA-seq data, out of 371 expressed neoantigens in MOC1, only seven were predicted as MOC1-specific (online supplemental data 1D,E), and only one was in a gene (E130112L23Rik) with higher expression in MOC1 than MOC1esc1 (online supplemental data 1D,E).28 These data, together with the tumor re-challenge experiments, suggest that MOC1 and MOC1esc1 still share the vast majority of their neoantigens. Therefore, the MOC1/MOC1esc1 pair represents a novel isogenic model, ideal for investigating HNSCC responsiveness and resistance to anti-PD1 and anti-CTLA4.
High infiltration of regulatory T cells and M2-like macrophages and MOC1esc1 anti-PD1 resistance
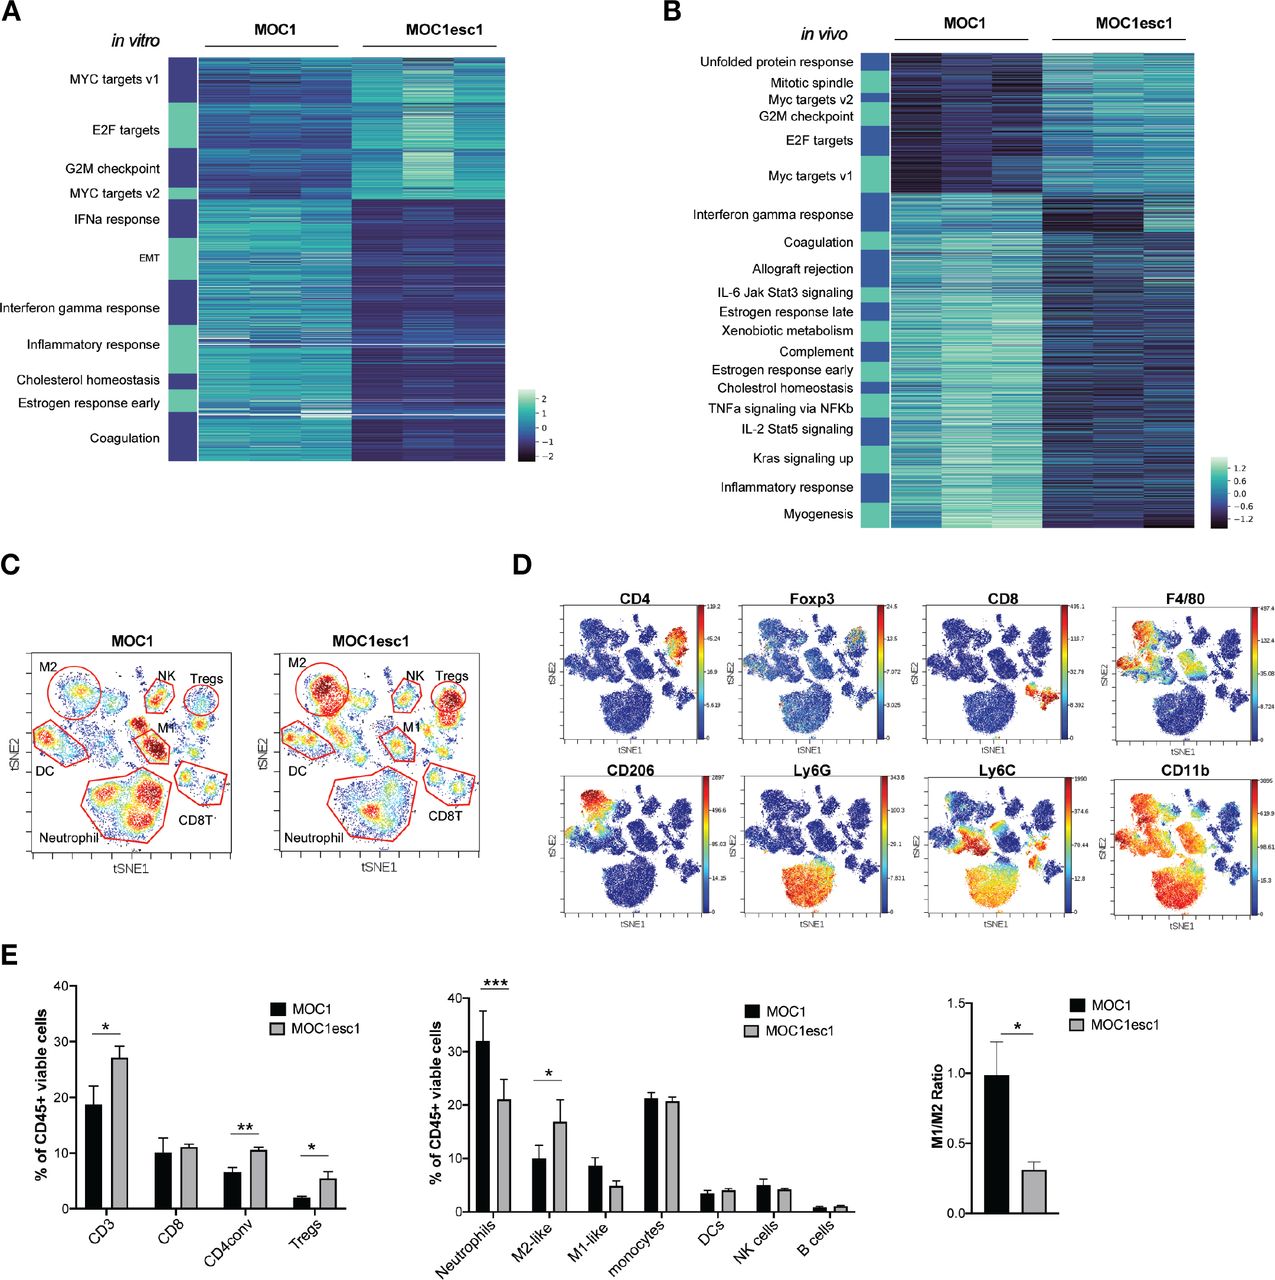
To understand the mechanisms underlying the MOC1esc1 resistance phenotype, we performed bulk RNA-seq analysis using both in vitro cultured cell lines and from tumors grown in vivo. At the transcriptomic level, in vitro cultured MOC1esc1 exhibited significant upregulated expression of Myc and E2f target genes (figure 2A), which have been described as part of an immune resistance program in human melanoma and pancreatic adenocarcinoma.6 7 In addition, MOC1esc1 had decreased interferon-alpha (IFNα), interferon-gamma (IFNγ), and inflammatory response gene signatures (figure 2A), in line with the reduced IFNγ-induced cell surface expression of Class I and PD-L1 on MOC1esc1 compared with MOC1 (figure 1E). Congruent with in vitro RNA-seq, analysis of in vivo bulk tumors revealed that the expression of Myc and E2f target genes were higher in MOC1esc1 than MOC1 tumors (figure 2B). The in vitro and in vivo RNA-seq data suggest that a cancer cell-intrinsic immune resistance program, including Myc and E2f targets and several downregulated immune-related gene sets, including inflammatory responses, allograft rejection, and IFNγ response acquired by MOC1esc1 might facilitate tumor immune evasion (figure 2B).

MOC1esc1 tumors are highly infiltrated by Tregs and M2-like TAMs. (A) In vitro RNA-seq analysis revealed distinct transcriptomic changes between MOC1 and MOC1esc1 lines. Enriched hallmark gene sets are shown by heatmap of gene mRNA expression levels. All gene sets were enriched with FDR<0.001. (B) RNA-seq analysis of MOC1 and MOC1esc1 bulk tumor samples from day 14 after implantation (N=3 per group). Hallmark gene sets enriched for upregulated and downregulated mRNAs were visualized using mRNA expression value heatmaps. All gene sets were enriched with FDR<0.001 between MOC1 and MOC1esc1 tumors ranked by normalized enrichment score. (C) Immune profiling of MOC1 and MOC1esc1 TME in treatment naïve tumors using mass cytometry. Tumors were harvested on day 14 after implantation and stained with a 37-marker antibody panel. Density viSNE plots were used to visualize an even number of CD45 +cells from MOC1 or MOC1esc1 tumors. (D) ViSNE plots of tumor infiltrating CD45 +cells overlaid with the expression of selected markers. (E) Frequency within CD45 +cells of major immune cell compartments in treatment naïve MOC1 and MOC1esc1 TME. The percentage of CD45 +live cells in each condition is: MOC1:88.3±5.8%, MOC1esc1: 77±5.8%. (*P<0.05, **p<0.01, ***p<0.001. Significance was calculated by unpaired Student’s t-test. Data are shown as mean±SEM, N=4 per group). DC, dendritic cell; FDR, false discovery rates; MOC1, murine oral carcinoma; ViSNE: visual stochastic network embedding; TAMs, tumor-associated macrophage.
To further investigate the MOC1esc1 cell-intrinsic effect on the immune TME, we employed CyTOF to comprehensively profile TME in untreated MOC1 and MOC1esc1 tumors (n=4 in each group, figure 2C–E, online supplemental data 2). Single cell suspension samples of individual MOC1 or MOC1esc1 tumors were barcoded then pooled together for antibody panel staining. Gating on CD45 +cells, we observed that while CD8 +T cell levels were similar between the two models (figure 2C–E), MOC1esc1 tumors had significantly higher infiltration of regulatory T cells (Tregs) and conventional CD4 +T cells compared with MOC1 tumors. MOC1esc1 tumors were also highly infiltrated by CD206 +M2 like TAMs. The percentages of tumor-associated neutrophils in MOC1esc1 tumors were lower than MOC1. The correlation between high tumor infiltration levels of Tegs and TAM and HNSCC progression has been reported previously,29–31 consistent with an immunosuppressive role of Tregs and TAMs in endogenous anticancer immunity of HNSCC patients. Similarly, the high infiltration levels of Tregs and TAMs may also contribute to an immunosuppressive TME of MOC1esc1. Together, these data suggest that, compared with MOC1, MOC1esc1 tumors have higher levels of immunosuppressive M2-like TAMs and Tregs in the TME.
We next examined the TME of MOC1esc1 tumors on anti-PD1 or anti-CTLA4 treatment to identify the suppressive immune components involved in anti-PD1 resistance (figure 3A–C, online supplemental data 3). As expected, anti-CTLA4 (clone 9D9) selectively reduced the frequency of Tregs. Although both anti-PD1 and anti-CTLA4 significantly increased total CD8 +T cells and granzyme B producing CD8 +T cells compared with control treatment (figure 3B–D), anti-CTLA4 treatment resulted in a larger increase of CD8 +T cells in the tumor than anti-PD1 (figure 3B–D). In the anti-PD1 treated resistant tumors, the M1/M2 ratio was significantly lower than in control or anti-CTLA4 treated responding tumors, indicating an immunosuppressive TAM phenotype in the resistant tumors (figure 3B–D). To examine the contribution of TAMs, we used anti-CSF1R to manipulate myeloid cells. In the MOC1esc1 tumor-bearing mice, the combination of anti-PD1 and anti-CSF1R therapy suppressed tumor progression (online supplemental data 4A,B). However, specific conclusions on myeloid cell contribution are limited as anti-CSF1R may have a wider impact. We, therefore, focused on the Treg contribution and found that treatment with anti-CD25 plus anti-PD1 resulted in complete rejection of MOC1esc1 tumors and these mice were protected from rechallenge with MOC1esc1 (online supplemental data 4C). Therefore, Tregs contributed to MOC1esc1 anti-PD1 resistance.
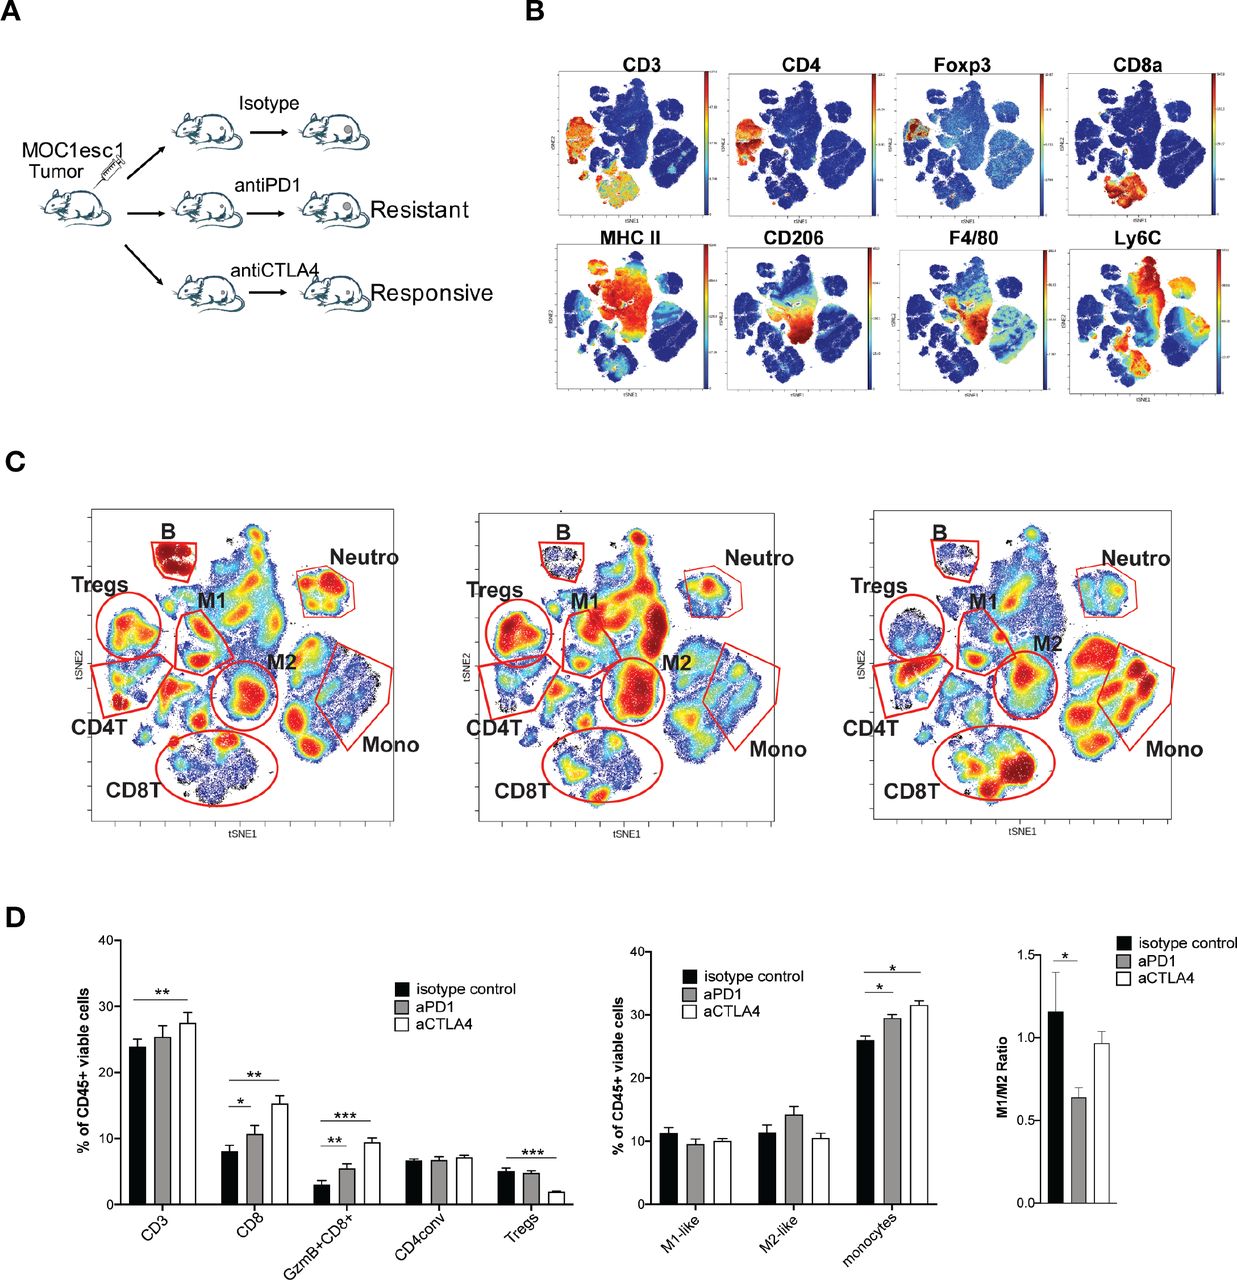
Tregs and M2-like TAMs contribute to MOC1esc1 anti-PD1 resistance. (A) Schematic of MOC1esc1 tumor bearing mice treatment and analysis. MOC1esc1-bearing mice were treated with isotype control, anti-PD1, or anti-CTLA4 monoclonal antibodies on days 3, 6, 9 after tumor implantation. Tumors were harvested on day 12 and subsequently analyzed by a 37-marker panel using CyTOF. (B) ViSNE plots of tumor infiltrating CD45 +cells overlaid with the expression of selected markers. T cells: CD3+, CD8 +T cells: CD3 +CD8+, GzmB +CD8+T cells: CD3 +CD8+GzmB+, Tregs: CD3 +CD4+Foxp3+, CD4conv: CD3 +CD4+Foxp3-, B cells: CD19+, NK cells: NK1.1+, M2-like macrophage: CD11b+F4/80+Ly6C-Ly6G-CD206+, M1-like macrophage: CD11b+F4/80+Ly6C-Ly6G-CD206-, Neutrophils: CD11c-CD11b+Ly6G+, Monocytes: CD11c-CD11b+Ly6G-Ly6C+. (C) Profiling of MOC1esc1 TME under indicated treatments gated on CD45 +cells. Density viSNE plots were used to visualize an even number of CD45 +cells from three indicated treatment groups. Selected major immune populations were labeled. (D) Frequency of major immune compartments in MOC1esc1 tumors under different treatment conditions. The percentage of CD45 +live cells in each condition is: isotype control: 88.2±3.1%, anti-PD1:87.4±1.3%, anti-CTLA4:89.9±2%. (*P<0.05, **p<0.01, ***p<0.001. Significance was calculated by one-way ANOVA. Data are shown as mean±SEM, n=5 mice per group). ANOVA, analysis of variance; MOC1, murine oral carcinoma; TAMs, tumor-associated macrophages; TME, tumor microenvironment.
Single-cell RNA-seq analysis defines distinct subsets of CD8 TILs
We next applied single-cell RNA sequencing (scRNA-seq) coupled with single-cell TCR sequencing (TCR-seq) to further investigate MOC1esc1 intrinsic resistance. MOC1esc1 tumors treated with isotype control, anti-PD1, or anti-CTLA4 were harvested and viable CD45 +cells were isolated and analyzed by scRNA-seq and TCR-seq (figure 4A, online supplemental data 5A and 6A). Unsupervised clustering identified 16 unique clusters, which were annotated by known marker genes of specific immune cell populations (figure 4A, online supplemental data 5B,C).
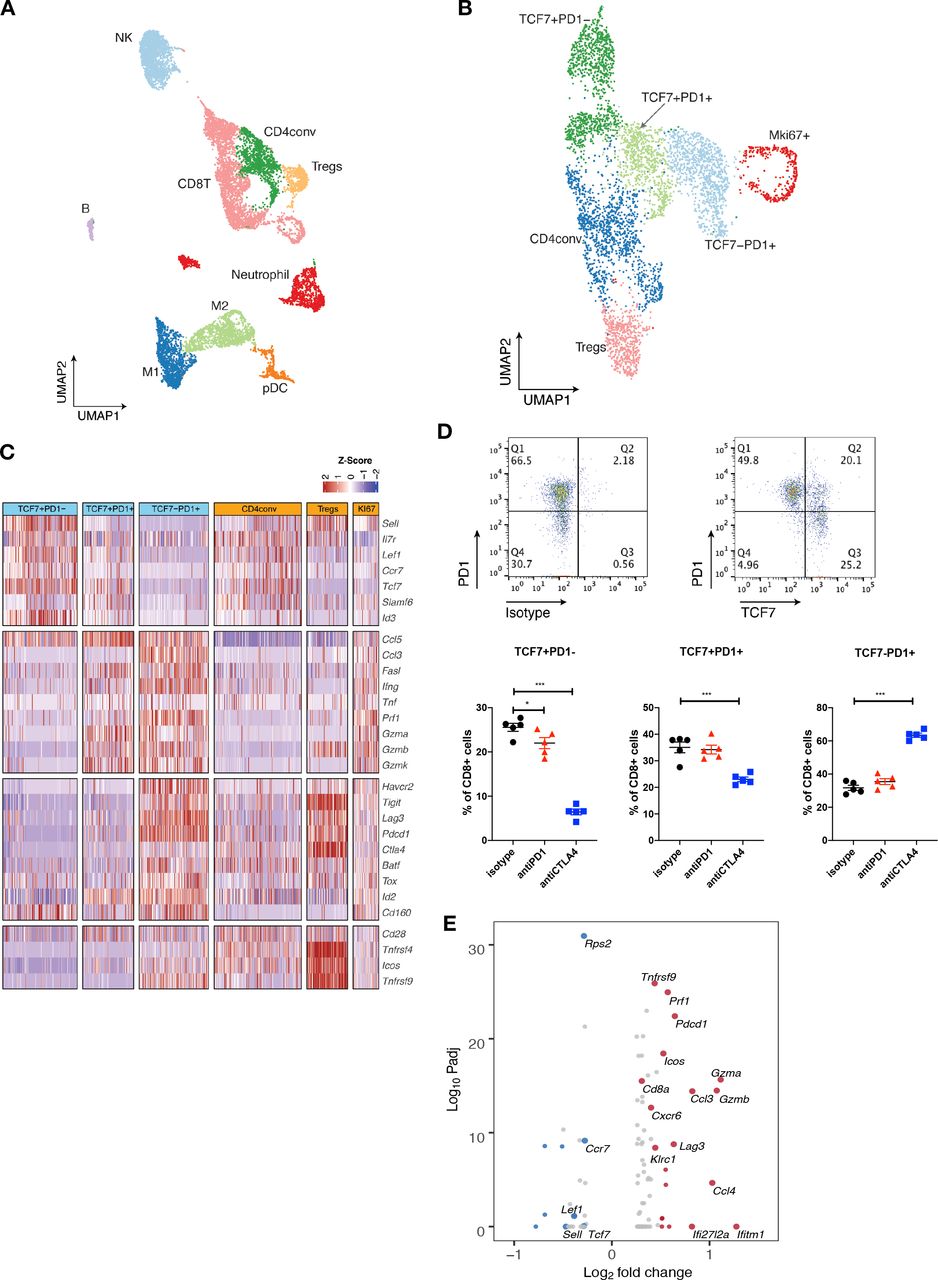
Single-cell RNA-seq analysis defines distinct subsets of CD8 TILs. (A) UMAP of scRNA-seq results of total tumor infiltrating CD45 +cells pooled from different treatment groups. Tumor infiltrating CD45 +cells from 5 mice in the same treatment group were pooled and subjected to single cell sequencing. (B) UMAP of total T cells in MOC1esc1 tumors colored by indicated major subsets. T cells from all three conditions were pooled for clustering analysis. (C) Heatmap illustrating the relative gene expression levels of genes in major T cell subsets in MOC1esc1 tumors. (D) Tcf7 +Pd1−, Tcf7 +Pd1+, and Tcf7-Pd1+CD8+T cells in MOC1esc1 tumors were detected by flow cytometry. Dot plot was pre-gated on live CD8 +T cells. Percentages of CD8 +subsets in MOC1esc1 tumors at indicated treatment condition are shown. MOC1esc1 tumors treated with isotype control, anti-PD1, or anti-CTLA4 were harvested at day 12 postinoculation and analyzed by flow cytometry for CD8 +T cell subset distribution (*p<0.05, ***p<0.001). Significance was calculated by one-way ANOVA. Data are shown as mean±SEM, n=5 mice per group.) (E) Pseudo-bulk differential expression analysis was performed in total CD8 +T cells between responder (anti-CTLA4) and control MOC1esc1 tumors. Colors of dots represent the anti-CTLA4 treated MOC1esc1 infiltrating CD8 +T cell upregulated genes (red) and downregulated genes (blue) compared with control. The statistical significance (log10 FDR) was plotted against the log2 fold-change of gene expression levels. ANOVA, analysis of variance; FDR, false discovery rates; MOC1, murine oral carcinoma; TILs, tumor infiltrating lymphocytes; UMAP, uniform manifold approximation and projection.
Focusing on single-cell transcriptomic profiles of T cells in the MOC1esc1 tumors, we identified several subsets of CD3 +T cells. We annotated two CD4 +T cell subsets including Tregs (Foxp3+) and conventional CD4 +T cells (CD4conv, Foxp3-) (figure 4B). Next, we annotated four major CD8 +T cell subsets as Tcf7 +Pd1−, Tcf7 +Pd1+, Tcf7-Pd1+, and proliferative Mki67 +using specific marker genes of T cell naïve/memory, activation, effector, and proliferation. The Tcf7 +Pd1− subset showed the highest expression of naïve/memory genes (such as Tcf7, Il7r, and Sell), with very low expression of activation/effector marker genes (figure 4C). The Tcf7-Pd1+subset coexpressed high levels of inhibitory receptors, as well as high effector molecule levels, indicating a differentiated effector T cell phenotype (Teff) (figure 4C). The Tcf7 +Pd1+subset showed intermediate levels of naïve/memory, effector, and coinhibitory molecules in between Tnaïve/memory and Teff, indicating a progenitor/precursor T cell phenotype (Tprogenitor)21 32 33 (figure 4C). These major subsets of CD8 +T cells exhibited a clear spectrum ranging from naive/memory-like to differentiated effector phenotypes. Using flow cytometry, we further confirmed the presence of these CD8 +TIL subsets in MOC1esc1 tumors (figure 4D, online supplemental data 5D). We then assayed tumor infiltrating CD8 +T cells for the proportions of the TCF7 +PD-1-/TCF7 +PD-1+/TCF7-PD-1+CD8 T cells in the MOC1esc1 tumor under different treatment conditions (figure 4D). The results showed that anti-CTLA4 dramatically decreased the percentage of TCF7 +PD-1- subset and increased the percentage of TCF7-PD-1+subset in CD8 +T cells. In addition, anti-CTLA4 also slightly lowered the proportion of TCF7 +PD-1+CD8+T cells compared with control and anti-PD1 treatment. These data suggested that anti-CTLA4 treatment promoted the expansion of effector CD8 +T cells in MOC1esc1 model.
To investigate the overall impact of successful anti-CTLA4 treatment on CD8 +TILs, we performed a pseudobulk differential expression analysis of CD8 +T cells from anti-CTLA4 and isotype control treated tumors. We found that a significant decrease of naïve/memory genes (Tcf7, Ccr7, and Lef1) and an increase of T cell activation genes (Gzmb, Gzma, and Lag3) were associated with a productive anti-tumor T cell response (figure 4E).
Subsets of CD8+ TILs differentially respond to ICB
Having identified of CD8 +TIL subset changes with ICB, we next performed pseudotime analysis to place cells along the expected differentiation trajectories in order to start understanding the transcriptomic profiles of individual T cell subsets under different response/resistant conditions. Cells in different conditions were assumed to be from a diffusion process and could be inferred from the data-related diffusion operator.34 All CD8 +T cells in distinct subsets of individual conditions were ordered along the differentiation trajectory based on changes in their transcriptomes. Within the Tcf7 +Pd1 cell subset, anti-CTLA4 treatment induced a significantly more differentiated T cell state than control or anti-PD1 treatment (figure 5A). To definitively establish the clonal trajectory of the tumor infiltrating T cells, we integrated TCR-seq with scRNA-seq data (figure 5B,C, online supplemental data 6A–C). Both anti-CTLA4 and anti-PD1 treated tumors had more clonal T cells, which was defined by more than two T cells sharing the same TCRα and βchain, than control tumors (online supplemental data 6B). A TCR clone size heatmap was projected onto the UMAP plots of T cells to delineate the distribution of clonally expanded T cells within the major T cell subsets (figure 5B). In control tumors, Tprogenitor (Tcf7 +Pd1+) and Teff (Tcf7-Pd1+) had comparable numbers of clonal expanded T cells. In anti-PD1 treated resistant tumors, Teff were preferentially expanded, while Tprogenitor did not show higher clonal expansion compared with control (figure 5B). In anti-CTLA4 treated responding tumors, both Teff and Tprogenitor showed dramatic clonal expansion (figure 5B). These data are consistent with several reports identifying Tcf7 +Pd1+Tprogenitor as a critical T cell subset in anti-PD1 response with self-renewal capacity to differentiate to Teff.21 35–37 Moreover, in resistant and control tumors, clonal CD8 +T cells were primarily distributed in the Pd1 +subsets but not the Tcf7 +Pd1− subset. In contrast, clonal T cells were distributed in all 4 subsets of CD8 +T cells, even in the Tcf7 +Pd1− population, in the anti-CTLA4 condition (figure 5B, online supplemental data 6B). We also observed individual T cell clonotypes spanning Tcf7 +Pd1−, Tcf7 +Pd1+, and Tcf7-Pd1+subsets only in anti-CTLA4 treated responding tumors (online supplemental data 6C), indicating higher T cell clonal dynamics in responding tumors. Together, in addition to the clonal expansion of Tprogenitor in responding tumors, we identified distinct clonal dynamics of naïve/memory-like Tcf7 +Pd1− subset in anti PD-1 resistant vs anti-CTLA4 responding MOC1esc1 tumors. Our data illustrate the interplay of global CD8 +TIL population architecture and clonal dynamics in anti-PD1 resistant and anti-CTLA4 responses in this HNSCC model.
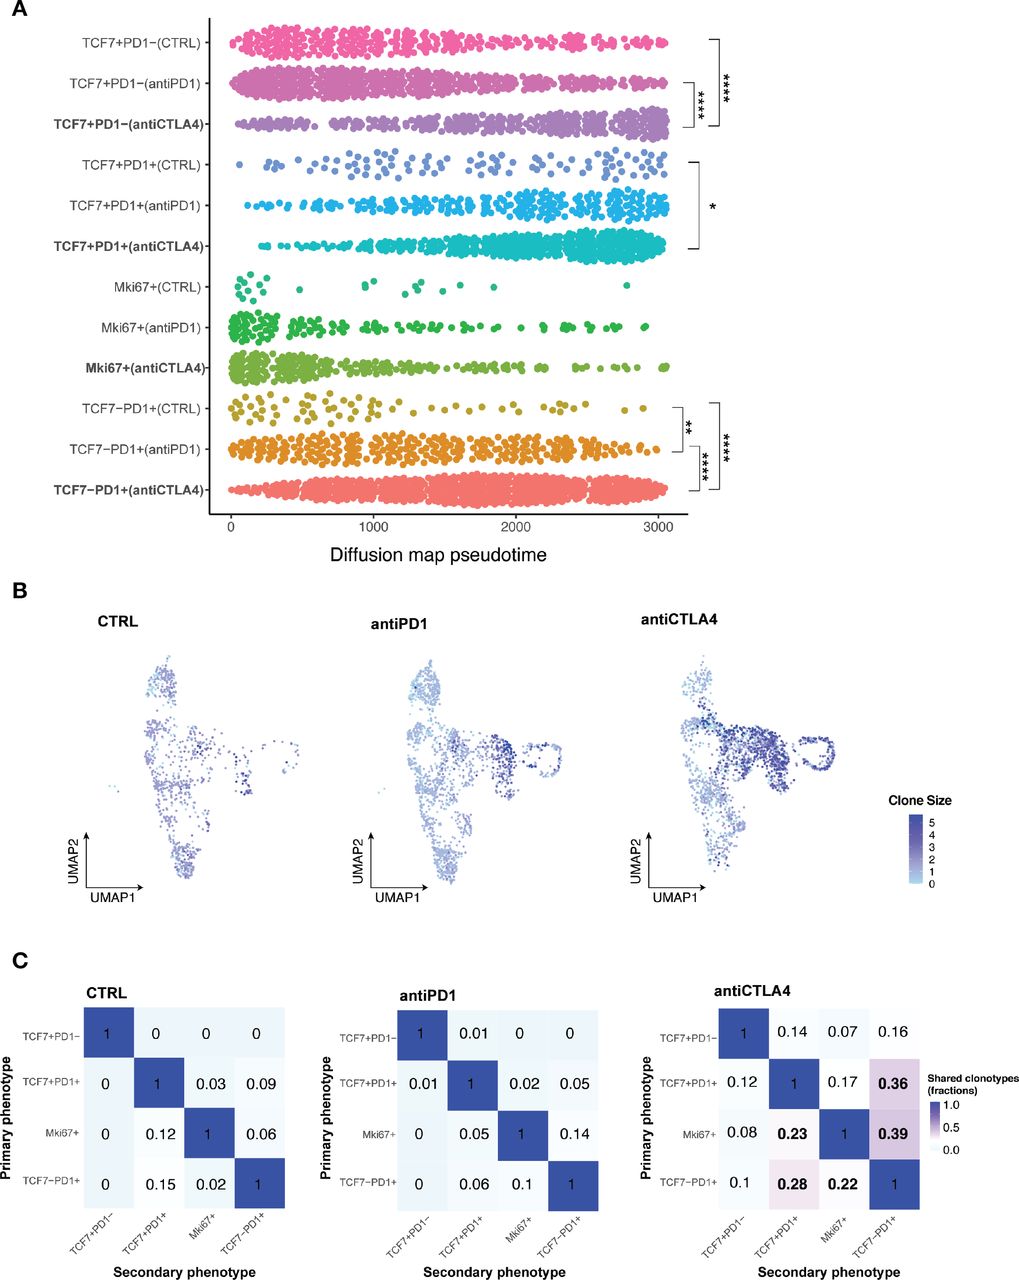
Subsets of CD8 +TILs differentially respond to ICB. (A) Diffusion pseudotime of indicated CD8 +T cell major subsets in distinct treatment conditions. (*P<0.05, **p<0.01, ***p<0.001, ****p<0.0001). Significance was calculated by one-way ANOVA.) (B) Heatmap of TCR clone size. Cells were colored by TCR clone size on a log2 scale in the UMAP of T cells in indicated conditions of MOC1esc1 tumors. (C) Shared fraction analysis heatmaps of TCR clonotypes between primary and secondary phenotypes in indicated conditions of MOC1esc1 tumors. ANOVA, analysis of variance; ICB, immune checkpoint blockade; MOC1, murine oral carcinoma; TILs, tumor infiltrating lymphocytes; UMAP, uniform manifold approximation and projection.
Lineage transitions between CD8+ TIL subsets on ICB treatment
To investigate whether T cell dynamics on anti-CTLA4 treatment were related to lineage transitions between individual CD8 +T cell major subsets, we evaluated shared TCR clones with identical TCR CDR3 amino acid sequences from the MOC1esc1 model. We assessed the shared TCR fractions between every pair of CD8 T cell subsets, where 0 indicates no overlap/transition and one indicates identical match of all clonotypes (figure 5C). These analyses showed that in the control and resistant conditions, the Tcf7 +Pd1− subset have negligible levels of overlapping TCR clonotype fractions with Pd1 +subsets. However, in anti-CTLA4 responding tumors, the Tcf7 +Pd1− subset shared TCR clonotypes with all the other subsets (Tcf7 +Pd1+, Mki67+, and Tcf7-Pd1+) totaling 37% (14%+7%+16%) clonotype overlap (figure 5C, first row). In addition, the transitions between Tcf7 +Pd1+or Mki67 +and Tcf7-Pd1+were also dramatically increased to 75% (36%+39%), compared with 15% (9%+6%) in control and 19% (5%+14%) in anti-PD1 resistant conditions (figure 5C, last column). These analyses suggest that an enhanced lineage transition between naïve/memory-like Tcf7 +Pd1−, progenitor Tcf7 +Pd1+, and differentiated effector Tcf7-Pd1+subsets might be involved in a productive T cell antitumor response in MOC1esc1. Therefore, an anti-PD1 or anti-CTLA-4-induced antitumor T cell response might involve the differentiation process of naïve/memory-like Tcf7 +Pd1 to Pd1 +subsets and progenitor Tcf7 +Pd1+to the differentiated effector Tcf7-Pd1+subset.
To further explore the role of tumor infiltrating Tregs in CD8 +T cell-mediated antitumor response, we tested the effect of Treg depletion on the distribution of tumor infiltrating CD8 +T cell subsets using flow cytometry (online supplemental data 7). Tumor-bearing mice received isotype control, anti-PD1 single therapy, anti-CD25 single therapy, or the combination of anti-PD1 and anti-CD25. FACS analysis of CD8 +T cell subsets showed that the combination of the anti-PD1 and anti-CD25 resulted in a dramatic decrease of PD1−TCF7+naïve/memory like subset proportion in total CD8 +T cells compared with isotype control or either single treatment groups. The proportion of PD1 +TCF7+progenitor CD8+T cells subset was not significantly affected by these treatments. Treatment with anti-PD1 plus anti-CD25 also dramatically increased the PD1 +TCF7- differentiated effector subset proportion compared with isotype control or either single treatment groups (online supplemental data 7B). In addition, the combination of anti-CD25 and anti-PD1 elevated the total immune infiltration and CD8 +T cell infiltration levels in MOC1esc1 tumors (online supplemental data 7C). Anti-CD25 single treatment did not significantly change CD8 +T cell subset distribution. Therefore, the combination of anti-PD1 and anti-CD25 antibody resulted in altered distribution of individual CD8 +T cell subsets, where the naïve/memory like T cells were reduced and differentiated effector cells were increased. Together, these data suggested a critical role of Tregs in modulating CD8 +T cell subset distribution.
We next extended this scRNA-seq analysis to the MOC1 parental line (online supplemental data 8A). Similar to MOC1esc1, we observed the same major T cell subpopulations, including Foxp3 +Tregs, CD4conv, Mki67 +and CD8+T cells. Within the CD8 +T cells, we identified the same spectrum of CD8 +TIL major subsets in the parental MOC1 model: naive/memory-like TCF7 +PD1−, Tprogenitor TCF7 +PD1+, Teff TCF7-PD1+and MKi67+ (online supplemental data 8B–D). MOC1 tumors are responsive to both anti-PD1 and anti-CTLA4 consistent with either treatment condition demonstrating a productive T cell antitumor response. TCR clone size heatmaps showed that clonal CD8 +T cells distributed mainly in the Tprogenitor and Teff subsets in the control condition. Anti-PD1 or anti-CTLA4 treatment dramatically increased the frequencies of clonal expanded T cells compared with control, which were also mainly in Tprogenitor and Teff subpopulations (online supplemental data 8E) and consistent with the potential killing function of terminally differentiated T cells.
Distinct from MOC1esc1 results, the naïve/memory-like TCF7 +PD1 cells did not show significant clonal expansion in either anti-PD1 or anti-CTLA4 responding condition (online supplemental data 8E). Shared TCR fractions between naïve/memory-like TCF7 +PD1 and other CD8 +subsets were very low (less than 5%) still indicating the differentiation and expansion of more clonotypes in naïve/memory-like cluster to activated/exhausted PD1 +phenotypes (online supplemental data 8F). In addition, we observed a dramatic increase of shared TCR fractions between TCF7 +PD1+Tprogenitor and MKi67 +with Teff in anti-PD1 and anti-CTLA4 treated tumors compared with control condition, respectively (5% in control vs 32% in anti-PD1, 37% in anti-CTLA4) (online supplemental data 8F). In summary, these results are consistent with the differentiation of both TCF7 +PD1 and TCF7 +PD1+to more activated/exhausted phenotypes being involved in a productive T cell antitumor response induced by ICB treatment.
Transcriptomic and clonal dynamics of major TIL subsets in MOC22 tumors with anti-PD1 treatment
To generalize the observation of T cell differentiation in immunotherapy responses in an additional HNSCC model, we analyzed MOC22, a distinct carcinogen-induced murine HNSCC model with complete response to anti-PD1 treatment.23 38 We conducted scRNA-seq and TCR-seq on the MOC22 tumor from the control and anti-PD1 group, respectively (online supplemental data 9A,B). Similarly, unsupervised clustering identified four major subsets of CD8 +T cells with distinct phenotypes: Tcf7 +Pd1−, Tcf7 +Pd1+, Tcf7-Pd1+, and Mki67+ (figure 6A–D). The Tcf7-Pd1+subset also coexpressed effector/coinhibitory genes, such as Ifnγ, Tim3, and Lag3 (figure 6C,D). We were surprised to see a large number of CD8 +T cells showing a naïve/memory-like Tcf7 +Pd1− phenotype with control treatment (figure 6E). Interestingly, on anti-PD1 treatment, CD8 +T cells dramatically shifted toward the Tcf7-Pd1+phenotype (figure 6E). Consistent with the results of MOC1esc1 anti-CTLA4 responsive condition (figure 4E), differential expression analysis of total CD8 +T cells revealed that anti-PD1 treatment also increased the expression levels of genes associated with T cell activation (Lag3, Pdcd1, Gzmb) and decreased the expression levels of genes in T cell naïve/memory phenotype (Tcf7, Ccr7, Lef1) in MOC22 tumors (figure 6F).
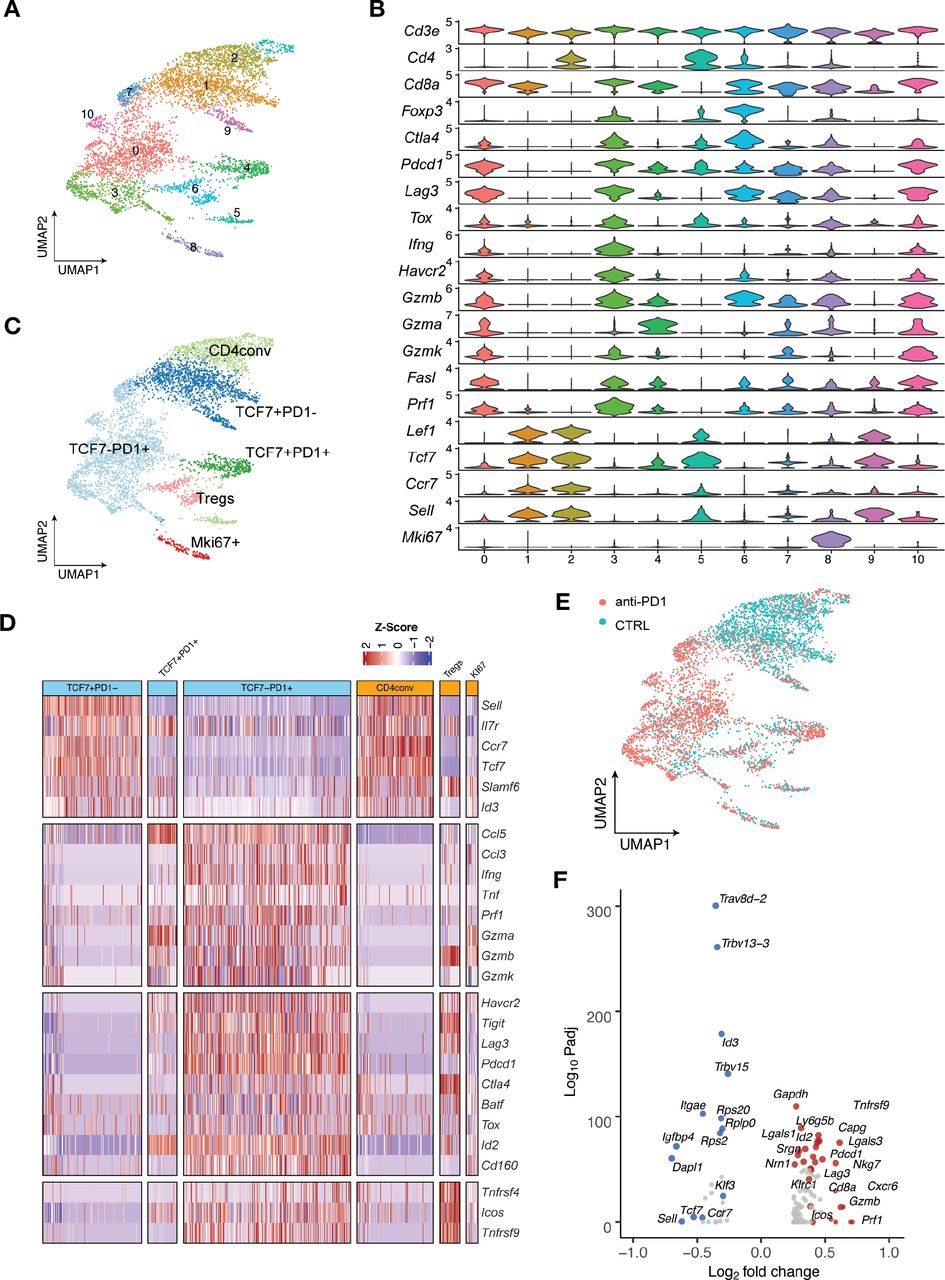
Major TIL subsets and the transcriptomic dynamics in MOC22 tumors with anti-PD1 treatment. A total of 5, 548 T cells were sequenced in MOC22 tumors treated with isotype control or anti-PD1. T cells from five mice in each treatment group were pooled and subjected to single cell sequencing. (A) UMAP of T cells in MOC22 tumors colored by individual clusters. (B) Violin plots showing expression of selected immune cell marker genes across clusters. The y axis represents the normalized gene expression levels. (C) UMAP of total T cells in MOC22 tumors colored by indicated major subsets. T cells from both conditions were pooled for clustering analysis. (D) Heatmap illustrating the relative gene expression levels of genes in major T cell subsets in MOC22 tumors. (E) UMAP of T cells in MOC22 tumors colored by treatment conditions. (F) Pseudobulk differential expression analysis was performed in total CD8 +T cells between anti-PD1 and isotype control treated MOC22 tumors. The results were presented by a color-coded volcano plot. The statistical significance (log10 FDR) was plotted against the log2 fold-change of gene expression levels. Each dot represents one gene, which is color coded by the most highly enriched genes. FDR, false discovery rates; MOC, murine oral carcinoma; TIL, tumor infiltrating lymphocytes.
Pseudotime analysis revealed that Tcf7 +Pd1 cells in anti-PD1 treated tumors were at a significantly more differentiated state towards the activated/effector phenotype compared with control tumors (figure 7A). By projecting a TCR heatmap onto the UMAP plots of T cells in MOC22 tumors, we found that in both control and anti-PD1 groups, T cells with the highest clone numbers were largely within Tcf7-Pd1+subset, while Tcf7 +Pd1 cells were in smaller clones overall (figure 7B). T cell lineage transition analysis showed that the shared fractions of clonotypes between Tcf7 +Pd1 and Tcf7-Pd1+or Mki67 +was remarkably increased from 0 in control to 30% in anti-PD1 treated responding tumors (figure 7C). These data confirmed that a productive antitumor response involves a CD8 +T cell lineage transition/differentiation from Tnaïve/memory Tcf7 +Pd1 to Teff Tcf7-Pd1+subset in the MOC22 model.

TCR-based lineage tracing showing CD8 +TILs differentiation in MOC22 tumors with anti-PD1 treatment. (A) Diffusion pseudotime of indicated CD8 +T cell subsets in different treatment conditions. ****p<0.0001. Significance was calculated by two-tailed Student’s t-test.) (B) Heatmap of TCR clone size in MOC22 tumors. Cells were colored by TCR clone size on a log2 scale in the UMAP of T cells in indicated conditions. (C) Shared fraction analysis heatmaps of TCR clonotypes between primary and secondary phenotypes in indicated conditions of MOC22. MOC, murine oral carcinoma; TILs, tumor infiltrating lymphocytes.
Discussion
Overcoming ICB resistance to benefit a greater proportion of patients is dependent on a better understanding of the cellular mechanisms in the TME on ICB treatment in both sensitive and resistant conditions. In this study, we generated a novel isogenic paired anti-PD1 parental sensitive/resistant model system, MOC1/MOC1esc1, that showed surprizing retention of anti-CTLA4 response . Transcriptomic analysis of MOC1esc1 identified components of conserved ICB resistance pathways previously defined in human melanoma and murine pancreatic cancer models.6 7 Mass cytometry-based characterization of MOC1 and MOC1esc1 TME highlighted a role for Tregs and M2-like TAM in anti-PD1 resistance of MOC1esc1. ScRNA-seq and coupled TCR-seq analysis of TILs in independent HNSCC murine models identified a spectrum of CD8 +TILs major subsets. We demonstrated that a successful anti-PD1 or anti-CTLA4 therapy induced the differentiation of TILs from Tcf7 +Pd1− naïve/memory-like to Pd1 +activated/differentiated states in these murine HNSCC models. To our knowledge, our work is the first to highlight these dynamics for anti-CTLA4 therapy. Importantly, by defining critical T cell states induced by ICB in these models, this work sets the stage for ongoing and future mechanistic studies to delineate influence of T cell state on immunological outcomes.
The establishment of MOC1esc1 line is likely the result of clonal selection from a polyclonal MOC1 parental line due to the immune selection pressure induced by anti-PD1 treatment. Compared with the acquired resistance to targeted therapies, the MOC1 tumor developed resistance within a relatively short period of time (about 1 month). Importantly, as retransplantation of the escape line resulted in complete resistance to anti-PD1 therapy, the resistance is a ‘fixed’ phenotype and consistent with a cancer cell intrinsic mechanism. Although speculative, we think that this is likely due to a global, potentially epigenetically regulated program. Consistent with this, we have previously identified Ezh2 as a regulator of cancer cell antigen presentation machinery in MOC models by modulating H3K27me3 modification on the beta-2-microglobulin promotor.39 In line with this, EZH2 inhibition with anti-PD1 was able to attenuate MOC1esc1 growth demonstrating that epigenetic modulators might contribute to the anti-PD1 resistance in MOC1esc1.
Progenitor CD8 +T cells (Tcf7 +Pd1+) have been defined using high affinity antigens with cognate transgenic CD8 +T cells to either SIINFEKL in B16-OVA, MC38-OVA or gp33 +in chronic LCMV, respectively.21 22 40 These antigens represent high affinity model systems that allowed definition of T cell subsets but may not capture the natural anti-tumor antigen specific responses. In this study, we aimed to define the transcriptomic landscape of total TILs at the single-cell level with a particular attention to CD8 +T cells, which not only confirmed the presence of Tprogenitor (Tcf7 +Pd1+) and Teff (Tcf7-Pd1+) populations, but also highlighted a naïve/memory-like Tcf7 +Pd1− subset with a potential to differentiate into Pd1 +phenotype on ICB treatment. The distribution of CD8 +T cell subsets varies in different models, as the Tcf7 +Pd1− subset was not identified in CD8 +T cells specific to SIINFEKL in B16-OVA or gp33 +in chronic LCMV.21 22 40 Although speculative, one potential explanation could be that low affinity T cells may exhibit distinct phenotypes compared with high affinity T cells. Previous studies have identified an important contribution of low affinity T cells in the immune response.41 42 As key contributors in antitumor immunity, neoantigen-specific T cells with different affinities to antigen expressing tumor cells are enriched in the TME.43 44 Such low affinity tumor specific T cells express lower levels of inhibitory receptors, indicating that distinct TCR affinities may lead to diverse TIL phenotypes.45 A testable hypothesis would be that the TCR signaling pathway has a regulatory function in the expression of stemness or effector markers in T cells.
One main limitation of the current study is that the analysis of anti-PD1 resistant tumors was focused on only the MOC1esc1 transplantable model that was derived from an anti-PD1 treatment-induced resistant tumor. We identified similar immune cell dynamics of effective ICB therapy responses in independent HNSCC preclinical models, but there are clearly additional mechanisms of ICB resistance beyond what we observed in MOC1esc1. The RNAseq analysis identified differential expression levels of several distinct pathways between MOC1 and MOC1esc1 that when integrated, contribute to the MOC1esc1 immunosuppressive state. When broken down, this composite immunosuppressive signature includes the Myc and E2F target pathways in MOC1esc1 that are consistent with other studies showing immune exclusion, but also includes decreased epithelial-mesenchymal transition (EMT). As EMT has been associated with tumor immunosuppression and immune escape, how this relative difference in EMT between MOC1 and MOC1esc1 impacts on the overall immunosuppressive state is unclear. Ock et al reported the association between PD-L1 expression and EMT features in HNSCC cohorts as well as the poor prognosis of EMT high patients but these findings were in the absence immunotherapy treatment.46 In non-small-cell lung cancer (NSCLC), an EMT score has been proposed as a predictive biomarker for ICB therapy based on an strong association between EMT status and immune checkpoint molecules.47 Thus, the relative contribution of the EMT signature to the MOC1esc1 immunosuppression is unclear with the ultimate tumor immune microenvironment impact resulting from an integration of all its distinct associated pathways.
A second limitation is that we were not able to fully interrogate the contribution of M2 macrophages to anti-PD1 resistance. Our use of anti-CSF1R is not M2-like macrophage specific, as CSF1R is expressed by multiple immune cell populations in the TME including dendritic cells, neutrophils, and MDSCs. Therefore, the effect of anti-CSF1R may be due to depletion of a broad population of myeloid cells. Indeed, the therapeutic effect of the combination of anti-CSF1R and anti-PD1 is modest in the MOC1esc1 model. Also given the fact that we only observed the significant effect of anti-CSF1R at a high treatment dose, targeting TAM using anti-CSF1R in MOC1esc1 tumors may not be an effective therapeutic approach.
This study focused on demonstrating the cellular mechanism of anti-PD1 and anti-CTLA4 treatment sensitivity and resistance in HPV-HNSCC, which has suboptimal outcomes in the locally advanced or recurrent/metastatic setting. As the differentiation from Tprogenitor to Teff has been shown in SIINFEKL expressing B16 melanoma and chronic LCMV,21 48 it is possible that the ICB-induced differentiation of Tnaïve/memory Tcf7 +Pd1 to Pd1 +subsets in CD8 +T cells may also be identified as a common feature in other cancer types. Tcf7 +Pd1+cells have been shown to mediate a proliferative response and generate differentiated effector T cells on immunotherapy treatment.21 49 The dynamic and expansion of Pd1− CD8 +TILs induced by ICB treatment has also been demonstrated using the MC38-OVA model by Kurtulus et al.40 A very recent study of human HPV +HNSCC showed that HPV antigen-specific PD1 +CD8 TILs comprised three distinct subsets demonstrated by scRNAseq analysis.50 Moreover, HPV-specific stem-like PD1 +TCF7+TILs were able to proliferate and differentiate to more effector-like cells on HPV peptide in vitro stimulation.50 All these studies together have highlighted a newer understanding on the mechanism of action of ICB therapy beyond ‘conventional’ thinking about reversing T cell exhaustion. Our data serves as additional validation of the concept that ICB treatment induces the differentiation and lineage transition of tumor infiltrating CD8 +T cells, and coupled with emerging single-cell sequencing data from preclinical studies, will further define the cellular impact of ICB in the TME.
In summary, our study defined the transcriptomic profiles and TCR-based lineage dynamics of TILs at single-cell resolution in both ICB sensitive and resistant murine HNSCC models. TCR-seq analysis revealed the lineage connections and transitions between the major CD8 +TIL subsets, suggesting distinct differentiation dynamics of TILs in responding and resistant tumors. Future studies focusing on identification of critical transcription factors and/or epigenetic modulators involved in the differentiation process of TILs can potentially guide the discovery and development of new therapeutics to facilitate the differentiation of TILs in combination with ICB.
Data availability statement
Data are available in a public, open access repository. Data are available on reasonable request. The datasets from this study are in NCBI GEO [GSE153383] and include bulk RNA-seq, WES, scRNA-seq, and scTCR-seq and are available to the scientific community. CyTOF data and custom code used in this work are available on reasonable request. MOC cell lines have been deposited with Kerafast.
Ethics statements
Patient consent for publication
Acknowledgments
We thank the DFCI Translational Immunogenomics Lab (TIGL) for assistance in single cell genomics sample processing. We thank all members of the Uppaluri lab and Dr. Gavin Dunn for discussions.
References
Supplementary materials
Supplementary Data
This web only file has been produced by the BMJ Publishing Group from an electronic file supplied by the author(s) and has not been edited for content.
Footnotes
Twitter @campkatiee, @DrUppaluri
LZ and ZZ contributed equally.
Contributors LZ and ZZ conception and design, provision of study material, collection and assembly of data, data analysis and interpretation, paper writing, and final approval of the paper; AME, FZ, FG, PZ, XM, RR, YN, JS, JK and JAL: collection and assembly of data, data analysis and interpretation, and final approval of the paper; KMC, PD, JF, ZZh, YZ, XW, SG, OG and RTM: data analysis and interpretation, and final approval of the paper; RU and XSL: conception and design, provision of study material, data analysis and interpretation, paper writing/editing, and final approval of the paper. RU accepts full responsibility for the finished work and the conduct of the study, had access to the data, and controlled the decision to publish.
Funding OG is supported by the National Cancer Institute (NIH NCI K22CA188163 and NIH NCI U01CA209936) and a Cancer Research Foundation Young Investigator Award. RU is funded by NIH/NIDCR R01DE024403, R01DE027736 and NIH/NCI/NIDCR U01DE029188. SL is funded by the National Institute of Health (R01CA234018) and Partnership for Accelerating Cancer Therapies from the Foundation for the National Institute of Health. JAL is funded by NIH NIAID 5U01 AI107360.
Competing interests RU serves on a Merck head and neck cancer advisory board. The MOC models developed by RU have been filed with the Washington University Office of Technology Management and are licensed for distribution by Kerafast. XSL is a cofounder, board member and Scientific Advisor of GV20 Oncotherapy, and on the Scientific Advisory Board of 3DMed Care. JS receives research support from Merck, BMS, Regeneron, Debiopharm, consulting/Scientific Advisory Board/travel fees from Genentech, Immunitas, Debiopharm, BMS, Nanobiotix, Tilos, AstraZeneca, LEK, Catenion, ACI Clinical, Astellas, Stimit., has stock options in Immunitas and equity in Doximity. RH consults for BMS, Merck, AstraZeneca, Pfizer, GSK, Genentech, Celgene, and Bayer, and received esearch Support from GSK, Merck, BMS, Pfizer, AstraZeneca, Genentech, and Kura.
Provenance and peer review Not commissioned; externally peer reviewed.
Supplemental material This content has been supplied by the author(s). It has not been vetted by BMJ Publishing Group Limited (BMJ) and may not have been peer-reviewed. Any opinions or recommendations discussed are solely those of the author(s) and are not endorsed by BMJ. BMJ disclaims all liability and responsibility arising from any reliance placed on the content. Where the content includes any translated material, BMJ does not warrant the accuracy and reliability of the translations (including but not limited to local regulations, clinical guidelines, terminology, drug names and drug dosages), and is not responsible for any error and/or omissions arising from translation and adaptation or otherwise.