Article Text

Abstract
Background Hormones are identified as key biological variables in tumor immunity. However, previous researches mainly focused on the immune effect of steroid hormones, while the roles that thyroid-stimulating hormone (TSH) played in the antitumor response were far from clear.
Methods The source of TSH was determined using single-cell transcriptomic, histologic, quantitative PCR, and ELISA analysis. The influence of TSH on tumor proliferation, invasion, and immune evasion was evaluated in multiple cell lines of thyroid cancer, glioma, and breast cancer. Then transcriptomic sequencing and cellular experiments were used to identify signaling pathways. TSH receptor (TSHR) inhibitor was injected into homograft mouse tumor models with or without anti-programmed cell death protein-1 antibody.
Results Monocyte-derived dendritic cells (moDCs) highly expressed TSHα and TSHβ2 and were the primary source of TSH in the tumor microenvironment. TSH released by moDCs promoted proliferation and invasion of tumors with high TSHR expressions, such as thyroid cancers and glioma. TSH also induced tumor programmed death-ligand 1 (PD-L1) expression through the TSHR-AC-PKA-JNK-c-JUN pathway. TSHR inhibitors reversed tumor immune evasion by inhibiting PD-L1 expression in tumor and myeloid cells and enhancing Teff activation.
Conclusions TSH–TSHR axis promotes tumor evasion in thyroid cancers and glioma. TSH suppression therapy is an effective therapeutic strategy for combination in immune checkpoint blockades.
- immunotherapy
- immune evation
- brain neoplasms
- tumor microenvironment
Data availability statement
Data are available upon reasonable request.
This is an open access article distributed in accordance with the Creative Commons Attribution Non Commercial (CC BY-NC 4.0) license, which permits others to distribute, remix, adapt, build upon this work non-commercially, and license their derivative works on different terms, provided the original work is properly cited, appropriate credit is given, any changes made indicated, and the use is non-commercial. See http://creativecommons.org/licenses/by-nc/4.0/.
Statistics from Altmetric.com
Introduction
In the past few years, a remarkable achievement in oncology was the recognition of the immune system in cancer development and the introduction of immunotherapy for various cancer types.1 Failed immune surveillance promotes cancer progression through several mechanisms, such as loss of immune activation in the first place.2 Among all biological variables, hormones were confirmed to affect innate and adaptive immune responses to tumor-associated antigens.2 However, previous research mainly focused on steroid hormones’ immune effect, including estrogen, progesterone, and testosterone, while glycoprotein hormones are insufficiently studied.3
Thyroid-stimulating hormone (TSH) is a pituitary hormone that stimulates the thyroid gland to produce thyroid hormones.4 TSH is primarily synthesized in thyrotrophs of the pars distalis and pars tuberalis of the pituitary gland.5 Bone marrow hematopoietic cells, in particular monocyte/macrophage precursors, were also shown to be a source of TSH.6 TSH is a non-covalently linked heterodimeric glycoprotein consisting of α and β subunits. The α subunit is common to other glycoprotein hormones, such as luteinizing hormone and follicle-stimulating hormone, whereas the β subunit is unique to each hormone. Different splice variants of TSHβ have various sources. The full-length native form of TSHβ (TSHβ1) is mostly produced by cells of the pituitary gland. In contrast, TSHβ2, which consists of a truncated but biologically functional portion, was shown to be released by bone marrow and peripheral blood, particularly cells of the myeloid/monocyte lineage.7 Liu et al reported that TSHβ2 was predominately expressed by plasma cells but not T cells, B cells, macrophages, and follicular dendritic cells in the thyroid of patients with Hashimoto’s thyroiditis.8
TSH binds to the TSH receptor (TSHR) in the thyroid gland and stimulates the production and release of thyroid hormones. In addition to the thyroid, TSHR expression was demonstrated in various tissues such as the brain, bone marrow, peripheral blood, and bone.9 Tumor-promoting effects of TSH are confirmed in thyroid cancer and suspected in extrathyroidal cancer. Several studies indicated that TSH promoted tumorigenesis and the progression of thyroid cancer.9 TSH signaling can stimulate the secretion of vascular endothelial growth factor to induce neoangiogenesis10 and accelerated genomic instability in thyroid cancer.11 As for extrathyroidal cancer, increased incidence of prostate, lung, and colorectal cancer was associated with low TSH levels.12 On the other hand, TSH suppression treatment reduced the risk for colorectal cancer in two other studies.13 14
Here, we explored the source and function of TSH in the tumor microenvironment and then investigated its therapeutic potential when combined with immune checkpoint blockades (ICBs).
Method
Animals
C57BL/6 mice (HFK Bioscience, Beijing, China) were bred in a specific pathogen-free facility, and female mice were utilized at 6–8 weeks of age. All animal studies were performed under Institutional Animal Care and Use Committee-approved protocols at Tongji Medical College of Huazhong University of Science and Technology.
Cell culture
All cells were grown in a 37℃ incubator with 5% CO2. Thyroid cancer (KTC1, BCPAP), glioma (U87, U251), breast cancer (MCF7), melanoma (B16-F10) cell lines were cultured in RPMI 1640 or DMEM medium (Gibco) containing 10% fetal bovine serum. TSH (T9265, Sigma-Aldrich) and TSHR inhibitor (TSHRi) (ML224, MedChemExpress) were supplemented into the culture medium in the following experiments.
Granulocytes and peripheral blood mononuclear cells (PBMCs) were isolated from whole blood by density gradient centrifugation. Then, CD14 MicroBeads (Miltenyi Biotec) separated PBMCs into CD14+ monocytes and CD14− lymphoid cells. Next, monocytes were cultured in 1640 medium supplemented with granulocyte-macrophage colony-stimulating factor (GM-CSF; 800 U/mL; R&D) and interleukin-4 (IL4; 400 U/mL; R&D) for 7 days to generate monocyte-derived dendritic cells (moDCs). The purity of the obtained monocytes and moDCs was assessed by flow cytometry.
Quantitative RT-PCR
Total RNA was extracted using TriZol Reagent (Invitrogen), and complementary DNA (cDNA) was generated using a HiFiScript cDNA Synthesis kit (CW Biotech, Beijing, China). Quantitative (q)RT-PCR analyses were carried out using an SYBR Green Real-time PCR kit (Toyobo, Osaka, Japan) in a LightCycler (Bio-Rad Laboratories, Hercules, California, USA). The expression of individual genes was calculated by a standard curve method and normalized to the expression of GAPDH. Fold changes were analyzed using the formula: 2−ΔΔCt. Gene expression was detected using the following primers: hTSHA-F: ATGGATTACTACAGAAAATATGC; hTSHA-R: AGATTTGTGATAATAACAAGTACT; hTSHB1-F: AGCATGACTGCTCTCTTTCT; hTSHB2-F: ATTATGCTCTCTTTTCTGTTCTTT;hTSHB-R: AACCAAATTGCAAATTATATCACTA.
Immunoblot
Whole-cell lysates were prepared as previously described.6 7 Equal amounts of protein (10–50 µg) were resolved by 12% SDS-PAGE. After electrophoresis, separated proteins were transferred onto the nitrocellulose membrane. The membrane was blocked in 5% non-fat milk, followed by overnight incubation with primary antibodies. After incubation with horseradish peroxidase (HRP)-conjugated secondary antibody, the positive immune reactive signal was detected by enhanced chemiluminescence (ECL; Fude Biotech, Hangzhou, China). Antibodies specific for TSHβ (D-6, 1:500), TSHR (C-10, 1:500), and β-actin (sc-47778, 1:1000) were purchased from Santa Cruz Biotechnology (Santa Cruz, California, USA). Antibodies specific for PD-L1 (EPR19759, 1:250) and total p65 (E379, 1:1000) were obtained from Abcam (Cambridge, UK). Antibodies specific for total c-JUN (9165, 1:1000), phosphorylated c-JUN (3270, 1:1000), total AKT (4685, 1:1000), phosphorylated AKT (4060, 1:1000), phosphorylated ERK (4370, 1:1000), phosphorylated JNK (4668, 1:1000), phosphorylated p38 (4511, 1:1000) and phosphorylated p65 (3033, 1:1000) were obtained from Cell Signaling Technology (Danvers, Massachusetts, USA). Antibodies specific for TSHα (25014–1-AP, 1:1000), total ERK (16443–1-AP, 1:1000), total JNK (24164–1-AP, 1:1000), total p38 (14064–1-AP, 1:1000) and HIF1α (66730–1-Ig, 1:1000) were purchased from Proteintech.
TSH ELISA assay
Monocytes were extracted from healthy donors or patients with differentiated thyroid cancers (DTC) and were induced to be moDCs. Cells were washed with phosphate buffered saline (PBS) three times, evenly distributed into individual microtiter wells, and then cultured in a serum-free medium for 24 hours. Then we collected the conditioned medium and filtered it with a 0.22 µm filter. Then TSH concentration in the cell-free supernatants was measured through Human Thyroid Stimulating Hormone ELISA Kit (Abcam) following the kit protocol.
moDC-conditioned medium transfer
moDCs were selected and cultured with cytokines as described above. After induction, the growth medium was removed, and the cells were washed with PBS three times and cultured in a serum-free medium. Twenty-four hours after the medium change, the conditioned medium was collected and filtered with a 0.22 µm filter and then stored at −80°C until use. For in vitro treatment, tumor cells were plated on six-well plates and treated with 1.5 mL of moDC-conditioned/serum-free medium plus 0.5 mL of complete medium (ratio 3:1) for 6–12 hours.
Lentiviral production and infection
To produce lentiviral particles, we transfected HEK293T with the TSHR(NM_000369)-Puro vector and plasmid vectors encoding the Gag-Pol (pCMV DR8.91) and V-SVG (pMD.G VSVG) viral proteins. Lentiviral particles were harvested from cell culture supernatant and were used to infect MCF7 and B16-F10 cells by double spinoculation on consecutive days.
Cell proliferation assays
For Cell Counting Kit-8 (CCK-8) assays, KTC1, BCPAP, U87, U251, and MCF7 cells were seeded into a 96-well plate at 3000 cells/well with 100 µl of complete medium. After overnight incubation, the complete medium containing different concentrations of TSH (0.1, 0.2, 0.5, 0.8, 1, 2, 5 mU/mL) replaced the original medium of each group for 4 days. According to the protocol of CCK-8 solution (Dojindo, Kumamoto, Japan), 10 µl of CCK-8 solution diluted in 100 µl of complete medium replaced the original medium of each group at different times points (24, 48, 72, and 96 hours). After the cells were incubated in the dark at 37°C for an additional 2 hours, we detected viable cells by absorbance at a 450 nm wavelength.
Wound healing assays
Cell lines were seeded in a 6-well plate. When the cells formed a tight cell monolayer, a 200 µl plastic pipette tip was used to make a scratch. We washed the cells in PBS three times to remove the cell debris and then added serum-free medium into each well. Wound photographs were recorded at the indicated times by an IX71 inverted microscope (Olympus Corporation) and analyzed by ImageJ software. All assays were conducted three times in this study.
Transwell cell invasion assays
Transwell assays were conducted in 24-well transwell plates (pore size: 8 µm; Corning, New York, USA). We precoated the chamber inserts with 50 µl of 1:6 mixture of Matrigel (BD Biosciences) and DMEM for about 2 hours in a 37°C incubator. Then we seeded 105 cells in the upper chamber. The lower chamber also had 500 µl of DMEM containing 30% fetal bovine serum (FBS). After the cells were incubated for 48 hours, we used 4% paraformaldehyde to fix the cells that had migrated or invaded the lower surface of the membrane. Then crystal violet was applied for staining the fixed cells for 15 min. Five random 100× microscopic fields were selected to count the stained cells by using an IX71 inverted microscope (Olympus Corporation). All assays were conducted three times in this study.
Flow cytometry
KTC1 and U87 cells were treated as indicated at 37℃. The following fluorophore-conjugated antibodies were used: CD31 (BD; WM59), PD-L1 (BD; MI5), PD-L2 (BD; MI18), and VISTA (R&D; 730804). Anti-mouse CD16/CD32 (BD; mouse Fc blocker, clone 2.4G2) were used as the blocking reagent to reduce the non-specific binding of the antibodies. For flow cytometry analysis of in vivo tumor experiments, samples were stained with Fixable Viability Stain 510 or 780 (BD Horizon) and fluorescent dye-conjugated antibodies anti-mouse CD45 (HI30), CD3 (BD; SK7), CD4 (Biolegend; RPA-T4), CD8 (Biolegend; 53–6.7), CD11B (BD; M1/70), CD11C (BD; B-Iy6), CD19 (BD; 1D3), CD68 (BD; FA/11), Gr1 (BD; RB6-8C5), IFNγ (Biolegend; XMG1.2), and PD-L1 (BD; MI5). For FoxP3 detection, cells were stained using Transcription Factor Staining Set (BD) and anti-human FoxP3 antibody (236A/E7). For intracellular staining of interferon (IFN)γ, Cytofix/Cytoperm solution (BD) was added before fixation and permeabilization. We performed the acquisition with FACS LSRII (BD Biosciences) and data analysis in FlowJo software (FlowJo LLC, Ashland, Oregon, USA). Flow cytometry graphs shown in the results section were representative data from at least three independent experiments.
Immunofluorescence
Immunofluorescence staining was performed on formalin fixed paraffin embedded (FFPE) tumor tissue sections and adherent cells. The tumor tissues were fixed in 10% formalin, embedded in paraffin, and serially sectioned for 3 µm thick. The following primary antibodies were used: CD11c (Proteintech, 17342–1-AP, 1:100), TSHα (Proteintech, 25014–1-AP, 1:100), TSHβ (SantaCruz, D-6, 1:50), TSHR (SantaCruz, C-10, 1:50), PD-L1 (Abcam, EPR19759, 1:250), total c-JUN (CST, 9165, 1:400), phosphorylated c-JUN (CST, 3270, 1:100). Double stainings of TSHR with PD-L1 were performed manually. Primary antibodies were detected with whole IgG or IgG F(Ab’)2 fragments conjugated to Alexa Flour 488 (711-546-152, Jackson Immuno Research) or streptavidin-conjugated Cy3 (016-160-084, Jackson Immuno Research). 4′,6-diamidino-2-phenylindole (DAPI) was used for visualization of cell nuclei. Sigma-Aldrich). For immunofluorescence multiplex staining, we followed the staining method for the following markers: CD11c with fluorescein isothiocyanate FITC (1:50); TSHα with fluorescein Cy3 (1:50); TSHβ with fluorescein Cy5 (1:50) and nuclei visualized with DAPI (1:2,000). A Nikon Ti-E microscope was used for all imaging. Image analysis was performed using NIS software modules (Nikon, V.4).
Tumor killing assays
This assay was performed to determine the sensitivity of tumor cells to T cell-mediated killing. Flat bottom non-tissue culture-treated plates were coated with 5 mg/mL anti-CD28 and kept at 4°C overnight prior to co-culture. Plates were washed two times with PBS, and tumor cells were seeded in triplicate and cultured for 1 day. At the start of co-culture, cells were counted to allow co-culture of tumor, moDCs, and T at a 2:1:1 effector: target ratio. After 3 days of co-culture, cells were washed in flow cytometry (FACS) buffer and stained with propidium iodide (PI) and anti-CD45 (Biolegend) for 30 min at 4°C . Cells were washed two times and detected by flow cytometry.
Single-cell RNA sequencing data analysis
Analysis of single-cell RNA sequencing (scRNA-seq) data were performed in the R statistical computing framework, V.4.0. scRNA-seq data sets of thyroid tissues from GSE148673 (five patients with anaplastic thyroid cancer) and Human Cell Landscape (two health person)15 are integrated and analyzed. The Seurat package was used to filter out bad quality cells and normalize counts.16 Count data in the downstream analysis were already normalized and log2 transformed. For all cells in scRNA-seq profiles, clusters were annotated based on the expression of known marker genes (online supplemental table 1). These annotations were also confirmed by identifying differential expressed marker genes for each cluster and comparing them to known cell-type-specific marker genes. After cell cluster annotation above, single cells from tumors were projected to two-dimensional space using the UMAP with the color indication for cell types and TSHα expression.
Supplemental material
Computational deconvolution of infiltrating dendritic cells
To evaluate the correlation of the infiltrating dendritic cells (DCs) with the expression of immune checkpoints genes, we performed the deconvolution analysis through a web-based tool, TIMER (http://timer.cistrome.org/), to infer the presence in the cancer genome atlas (TCGA) data sets. TIMER could estimate the correlation between gene expression and abundances of six immune cell types via ‘Gene’ modules.
Whole transcriptome data analysis
Whole transcriptome RNA-seq was performed with the TruSeq Stranded messenger RNA Preparation Kit. RNA-seq was performed on KTC1 treated with culture supernatant of moDCs; Libraries were pooled, and sequencing runs were performed in paired-end mode using the Illumina HiSeq 4000 platform. Initial RNA-seq quality control (QC) checks included an evaluation of GC and per-base sequence content using FastQC (V.11.5). All samples that passed initial QC were aligned to the human genome assembly (build hg19) using the STAR (V.2.5) two-pass method with quantMode parameters set to TranscriptomeSAM for alignments translated into transcript coordinates. Alignments were sorted with SAMTools (V.1.3.1), duplicates were marked with Picard Tools (V.2.4.1), reads were split and trimmed, and mapping qualities were reassigned with the Genome Analysis Toolkit (V.3.6) using the methods SplitNCigarReads and ReassignOneMappingQuality, respectively. Post-alignment QC required at least 70% of reads to be uniquely aligned, assessed using STAR alignment statistics (100% of samples passed). All RNA-seq expression values were represented as transcripts per kilobase million.
Differential expression analyses were performed through the ‘edgeR’ package. For transcript factors (TF) analysis, ChIP-X enrichment analysis 3 (ChEA3) (https://amp.pharm.mssm.edu/ChEA3) was an online enrichment analysis tool that ranked the TFs associated with genes.17 We used ChEA3 to find enriched transcript factors in KTC1 treated with culture supernatant of moDCs.
In vivo tumor experiments
Wild type and TSHR-overexpressed (TSHR-OE) B16-F10 tumor cells (5×10⁵ cells) were trypsinized, washed, and resuspended in PBS and injected subcutaneously in the flank of C57BL6 mice. TSHRi (ML224, MedChemExpress) and anti-mouse PD1 (BioXCell BE0146) were injected intraperitoneally at the time points described in figure legends. For tumor growth and control experiments, tumors were measured two times weekly and volumes calculated as the product of three orthogonal diameters. Mice were sacrificed when any diameter reached 15 mm. For functional experiments, tumors were collected and processed at the time points indicated in figure legends. Mouse tumors were mechanically disrupted using scissors, digested with a mixture of 0.5 mg/mL DNA sequencing (Sigma-Aldrich) and 1 mg/mL Collagenase IV (Sigma-Aldrich) in serum-free RPMI for 30 min. The single-cell suspension of tumors was dispersed through a 70 µm filter. Erythrolysis of whole blood and spleen samples were performed using the BD Pharm Lyse buffer (BD).
Statistical methods
Unless otherwise stated, the Mann-Whitney U test was used to assess for a difference in distributions between two population groups. Overall survival analysis was conducted using a Cox proportional hazards model. Statistical analysis was carried out using R V.4.0.1 (http://www.r-project.org/) or greater. We considered a p value of 0.05 as being statistically significant.
Result
Expression and release of TSH in moDCs
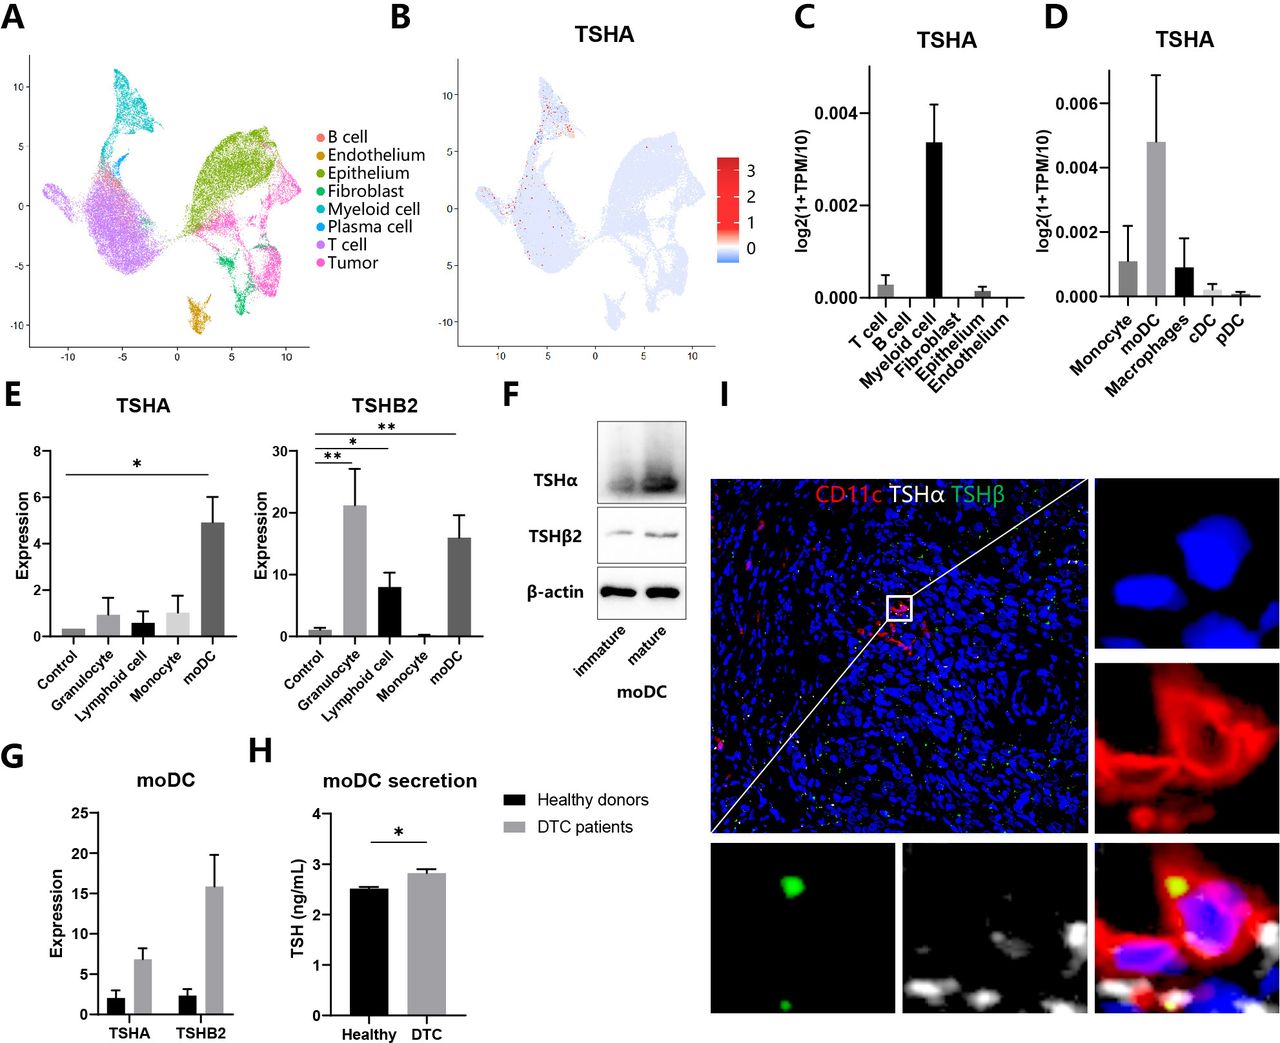
To gain insight into the potential functional role of different kinds of cells in the TSH–TSHR axis, we analyzed two scRNA-seq profiles from thyroid tissues of patients with anaplastic thyroid cancer (ATC) (GSE148673) and healthy donors (Human Cell Landscape). Based on the standard analysis workflow, we identified eight distinct major cell clusters representing different populations. Next, we annotated these clusters into different cell types by lineage-specific markers listed in online supplemental table 1 (figure 1A). As a constituent gene of TSH, TSHα/’chorionic gonadotrophin subunit alpha (CGA) was expressed mainly in myeloid cells and minorly in T cells and thyroid epithelial cells (figure 1B,C). Then, myeloid cells were divided into several subpopulations, among which moDCs were the primary source of TSHα (figure 1D). In contrast, TSHβ1 expression was not detected in any cells, consistent with the former report that TSHβ1 was minimally produced by immune cells.7 To validate the result of bioinformatic analysis, we separated cells from the peripheral blood of healthy donors, induced moDCs with the cytokine cocktail, and detected the expression of TSHα, TSHβ1 and TSHβ2 through qRT-PCR assays. Consistently, moDCs expressed highly TSHA and TSHβ2 compared with monocytes, suggesting differentiation from monocytes to moDCs promoted activation of the TSH axis (figure 1E). TSHβ1 expression was not detected in any cells. Then we evaluated protein levels of TSHα and TSHβ through specific antibodies. Anti-TSHβ antibody (clone D-6) was only used to assess the expression of TSHβ2 because only messenger RNA of TSHβ2 but not TSHB1 was detected in the samples.8 Both TSHα and TSHβ2 expressions increased in mature moDCs compared with immature moDCs (figure 1F). Comparing patients with DTC with healthy donors, mature moDCs expressed highly TSHα and TSHβ2 and secreted more TSH to its culture medium (figure 1G,H). Therefore, we speculated that moDCs express and release TSH in the tumor microenvironment of thyroid cancers (THCA). Immunofluorescence staining of thyroid tissue sections showed that both TSHα and TSHβ2 colocalized with CD11c+myeloid cells in the DTC (figure 1I). Klein also reported that CD11b+intrathyroidal DCs were the predominant TSHβ-producing cell.6 In conclusion, moDCs are the primary source of TSH in the tumor microenvironment.

Expression and release of TSH in moDCs (A–D) Analysis of single-cell RNA sequencing data of thyroid tissues integrated from five patients with anaplastic thyroid cancer and two healthy persons. (A–B) UMAP plot of all cells from thyroid tissues, which visualize cell expression profiles in a two-dimensional independent space. Cells are colored based on clusters defined by cell type (A) and TSHα expression (B). (C–D) TSHα expression in different cell populations (C) and myeloid cells subpopulations (D). (E) Expression of TSHα and TSHβ2 in different immune cells through qRT-PCR assay. (F) Whole-cell lysates from immature and mature moDCs were subjected to immunoblot analysis of TSHα and TSHβ2. (G) Expression of TSHα and TSHβ2 in moDCs from healthy donors and patients with DTC through quantitative RT-PCR assay. (H) Secretion of TSH in moDCs from healthy donors and patients with DTC through ELISA assay. (I) Immunofluorescence staining of myeloid cells for CD11c (red), TSHα (white), and TSHβ (green). Representative images of three independent experiments with similar results are shown. *P<0.05, **p<0.01, ***p<0.001. DTC, differentiated thyroid cancer; moDCs, monocyte-derived dendritic cells; cDC, classic DC; pDC, plasmacytoid DC; TSH, thyroid-stimulating hormone; TPM, transcript per million.
TSH released by moDCs promotes tumor proliferation and invasion
It’s well known that thyroid cell proliferation is dependent on TSH. TSH-suppression treatment benefits patients with high-risk thyroid cancer by decreasing progression rates, recurrence rates, and cancer-related mortality.18 Therefore, we speculated that TSH played a pro-tumor role in TSHR-expressing cancers. To evaluate the expression of TSHR in different cancer types, we searched the GEPIA2 database, which integrates the RNA-seq data from the TCGA and the GTEx projects.19 Among 33 cancer types, TSHR was highly expressed in THCA and thymoma, moderately expressed in glioma (lower grade glioma, glioblastoma multiforme), and rarely expressed in other types such as breast cancer (figure 2A). Then we validated TSHR expression in multiple cell lines. Consistently, THCA (KTC1, BCPAP) expressed more TSHR than glioma (U87, U251), as breast cancer (MCF7) did not express TSHR (figure 2B). Expression of TSHR in MCF7 was also restored through lentivirus transfection (figure 2B).
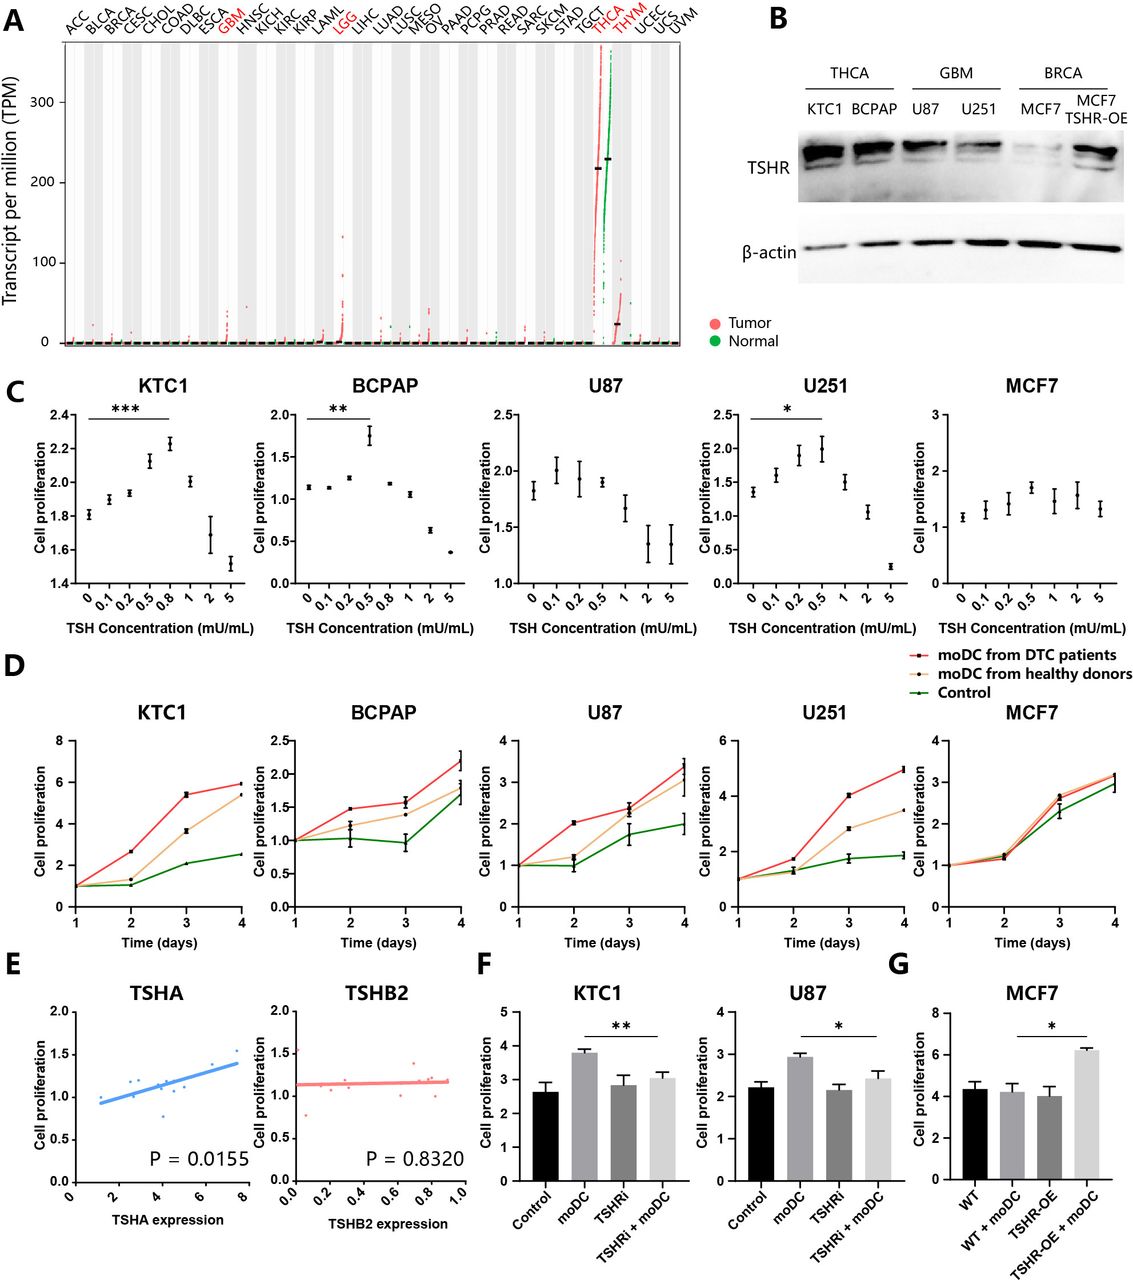
TSH released by moDCs promotes tumor proliferation (A) Expression of TSHR in different cancer types of TCGA cohorts. Tumors (red) and paired normal samples (green) are shown for each type. GBM, glioblastoma multiforme; LGG, lower grade glioma; THCA, thyroid carcinoma; THYM, thymoma. (B) Thyroid cancers (KTC1, BCPAP), glioma (U87, U251), and breast cancer (MCF7; wild type (WT) and TSHR-overexpressed (TSHR-OE)) were subjected for immunoblot analysis of TSHR and β-actin. (C–G) Evaluation of tumor proliferation through CCK-8 assay. KTC1, BCPAP, U87, U251, and MCF7 were treated with different concentrations of TSH (C) or culture supernatant of moDCs from patients with DTC and healthy donors (D). (E) BCPAP were treated with culture supernatant of moDCs from several patients with DTC. The correlation of BCPAP proliferation and TSHA(left)/TSHβ2(right) expression in moDCs. (F) KTC1 and U87 were treated with a culture supernatant of moDCs from patients with DTC and/or TSHR inhibitor (ML224). (G) WT and TSHR-OE MCF7 were treated with a culture supernatant of moDCs from patients with DTC. DTC, differentiated thyroid cancers; moDC, monocyte-derived dendritic cells; TCGA, the cancer genome atlas; TSH, thyroid-stimulating hormone; TSHR, TSH receptor.
To explore the potential function of TSH in cancer cells, we conducted a series of in vitro assays. These TSHR-expressing cell lines proliferated at the appropriate TSH concentration treatment but died when treated with a high concentration of TSH, suggesting a complicated effect of TSH in tumor viability (figure 2C). The peak concentration of TSH in promoting proliferation was between 0.5~0.8 mU/mL, closed to TSH concentration secreted by moDCs (figures 1H and 2C). Therefore, we deduced that moDC-secreting TSH could promote the proliferation of THCA and glioma. The culture supernatant of moDCs from patients with DTC and healthy donors were collected to treat different cell lines. moDC-secreting supernatant promoted the proliferation of KTC1, U87, and U251 (figure 2D). KTC1, BCPAP, and U251 grew faster when treated with culture mediums of moDCs from patients with DTC than healthy donors (figure 2D). In contrast, MCF7 did not react with moDCs treatment. To validate the role of TSH in tumor proliferation, we measured the TSHα and TSHβ2 expression of moDCs after collecting its culture supernatant to treat BCPAP. Notably, TSHα expression but not TSHβ2 significantly correlated with BCPAP growth, suggesting TSHA is the rate-limiting gene in the TSH synthesis from moDC (figure 2E). In addition, (TSHRi: ML224) reversed the pro-proliferation effect of moDCs on KTC1 and U87 (figure 2F). TSHR-OE also restored the sensitivity of MCF7 to moDC-secreted molecules. Therefore, TSH released by moDCs promotes the proliferation of tumor cells.
Wound healing assays showed that supernatant secreted by moDCs promoted migratory abilities of KTC1 and U87 cells, whereas TSHRi inhibited its pro-migration effects (figure 3A). In addition, results from transwell assays indicated that the invasive capacities were greatly promoted by the culture supernatant of moDCs and hindered by TSHRi in KTC1 and U87 cells (figure 3B). TSHR-OE in MCF7 cells notably enhanced the migratory and invasion potentials in response to moDCs compared with the corresponding control cells (figure 3C,D). In conclusion, TSH released by moDCs promotes proliferation and invasion of TSHR-expressing tumor cells.

TSH released by moDCs promotes tumor migration and invasion. (A) Effects of culture supernatant of moDCs and TSHRi on cell migratory abilities by wound healing assays in KTC1 and U87 cells. (B) Effects of culture supernatant of moDCs and TSHRi on cell invasive capacities by transwell assays in KTC1 and U87 cells. (C) Effects of culture supernatant of moDCs and TSHR-OE on cell migratory abilities by wound healing assays in MCF7 cells. (D) Effects of culture supernatant of moDCs and TSHR-OE on invasive capacities by transwell assays in MCF7 cells. Representative images of three independent experiments with similar results are shown. *P<0.05, **p<0.01, ***p<0.001. moDCs, monocyte-derived dendritic cells; TSHR, thyroid-stimulating hormone receptor; TSHRi, TSHR inhibitor; TSHR-OE, TSHR-overexpressed; WT, wild type.
TSH released by moDCs promotes immunosuppressive phenotype of tumor
To compare the transcriptome profile of tumor cells in response to moDC-secreting molecules, we extracted RNAs from KTC1 and performed quantitative RNA-seq in each sample. We detected 13,108 highly expressed genes in total. Among these, 418 and 798 genes were significantly upregulated or downregulated (p<0.05) in moDC-treated KTC1 (figure 4A). The upregulated genes in moDC-treated KTC1 include many chemokines (CCL3, CCL20, CXCL2, CXCL3, CXCL5, CXCL8, CXCL16) and immune checkpoints genes (PD-L1, PD-L2, VISTA) (figure 4B). Consistent with these findings, flow cytometry revealed that culture supernatant of moDCs promoted expression of immune checkpoints genes in KTC1 (PD-L1, VISTA) and U87 (PD-L1, PD-L2, CD31) but not MCF7 (figure 4C). To evaluate whether moDCs assisted immune evasion in human cancer samples, we analyzed TCGA data sets of three kinds of high TSHR-expression cancers, with DC abundance estimated through the ‘TIMER’ tool. The analysis showed that infiltration levels of DCs positively correlated with immune checkpoints genes expression (PD-1, PD-L1, PD-L2, VISTA, IDO1) in both THCA and glioma (figure 4D). In summary, moDCs activated the immunosuppressive phenotype of the TSHR-expression tumor cells. Nevertheless, the concrete role of the TSH–TSHR axis in moDC-assisted immunoregulation remained unclear. Cell lines were co-cultured with moDCs through transwell with 0.4 µm pore size, which prevented cell migration but permitted molecules diffusion. TSHRi inhibited moDC-induced PD-L1 expression of KTC1 and U87 (figure 4E). TSHR-OE MCF7 expressed higher PD-L1 than control when co-culture with moDCs (figure 4F). These results suggested that TSHR was required for moDC-induced PD-L1 expression in cancer. Notably, PD-L1 was also upregulated in TSHR-OE MCF7 without TSH source, suggesting TSHR independently induced PD-L1 expression (figure 4F). Consistently, immunofluorescence showed that TSHR+ tumor cells in DTC also expressed highly PD-L1 (figure 4G). Because of higher PD-L1 expression, TSHR-OE MCF7 was less inclined to be killed by T cells than control MCF7 in co-incubation with moDCs (figure 4H). In conclusion, moDCs promote immunosuppression of thyroid cancer and glioma through the TSH–TSHR axis.

TSH released by moDCs promotes tumor immunosuppression (A) Volcano plot showing genes changed in KTC1 treated with culture supernatant of moDCs compared with control, as determined by RNA sequencing n=3 per group. Genes were upregulated (red; p<0.05, FC >2) or downregulated (green; p<0.05, FC<-2). (B) Heatmaps of the RNA sequencing data of KTC1 treated with the culture supernatant of moDCs. Representative genes from each category are shown. (C) KTC1, U87, and MCF7 were treated with the culture supernatant of moDCs (blue) or control medium (red) for 24 hours. Expression of CD31, PD-L1, PD-L2, and VISTA was assessed by flow cytometry. (D) Correlation of gene expression (PD-1, PD-L1, PD-L2, VISTA, IDO1) with infiltration level of dendritic cells by ‘TIMER’ tool in TCGA THCA, GBM, and LGG. (E, F) Tumor cells were co-cultured with moDCs through transwell with 0.4 µm pore size, which permitted molecules diffusion but not cell migration. KTC1 and U87 were treated with TSHR inhibitor (F). PD-L1 expression was assessed by flow cytometry. Representative histograms (left), PD-L1 MFI (median fluorescence intensity) (middle), and experiment schematics (right) were shown. (G) Immunofluorescence staining of differentiated thyroid cancers for PD-L1 (red) and TSHR (green). PD-L1+TSHR+ tumor cells were indicated in white rectangles. (H) Control and TSHR-overexpressed MCF7 were co-cultured with moDCs and T cells at a 2:1:1 ratio for 3 days and stained with PI and anti-CD45 antibodies. Representative PI +CD45- tumor cells (left), tumor death ratios calculated as PI+/CD45- (right, up), and experiment schematics (right, down) were shown. FSC, forward scatter; GBM, glioblastoma multiforme; LGG, lower grade glioma; moDc, monocyte-derived dendritic cells; PD-1, programmed cell death protein-1; PD-L1, programmed death-ligand 1; TCGA, the cancer genome atlas; THCA, thyroid carcinoma; TSH, thyroid-stimulating hormone; TSHR, TSH receptor; TSHR-OE, TSHR-overexpressed; WT, wild type.
TSH induces tumor PD-L1 expression through the AC-PKA-JNK-c-JUN pathway
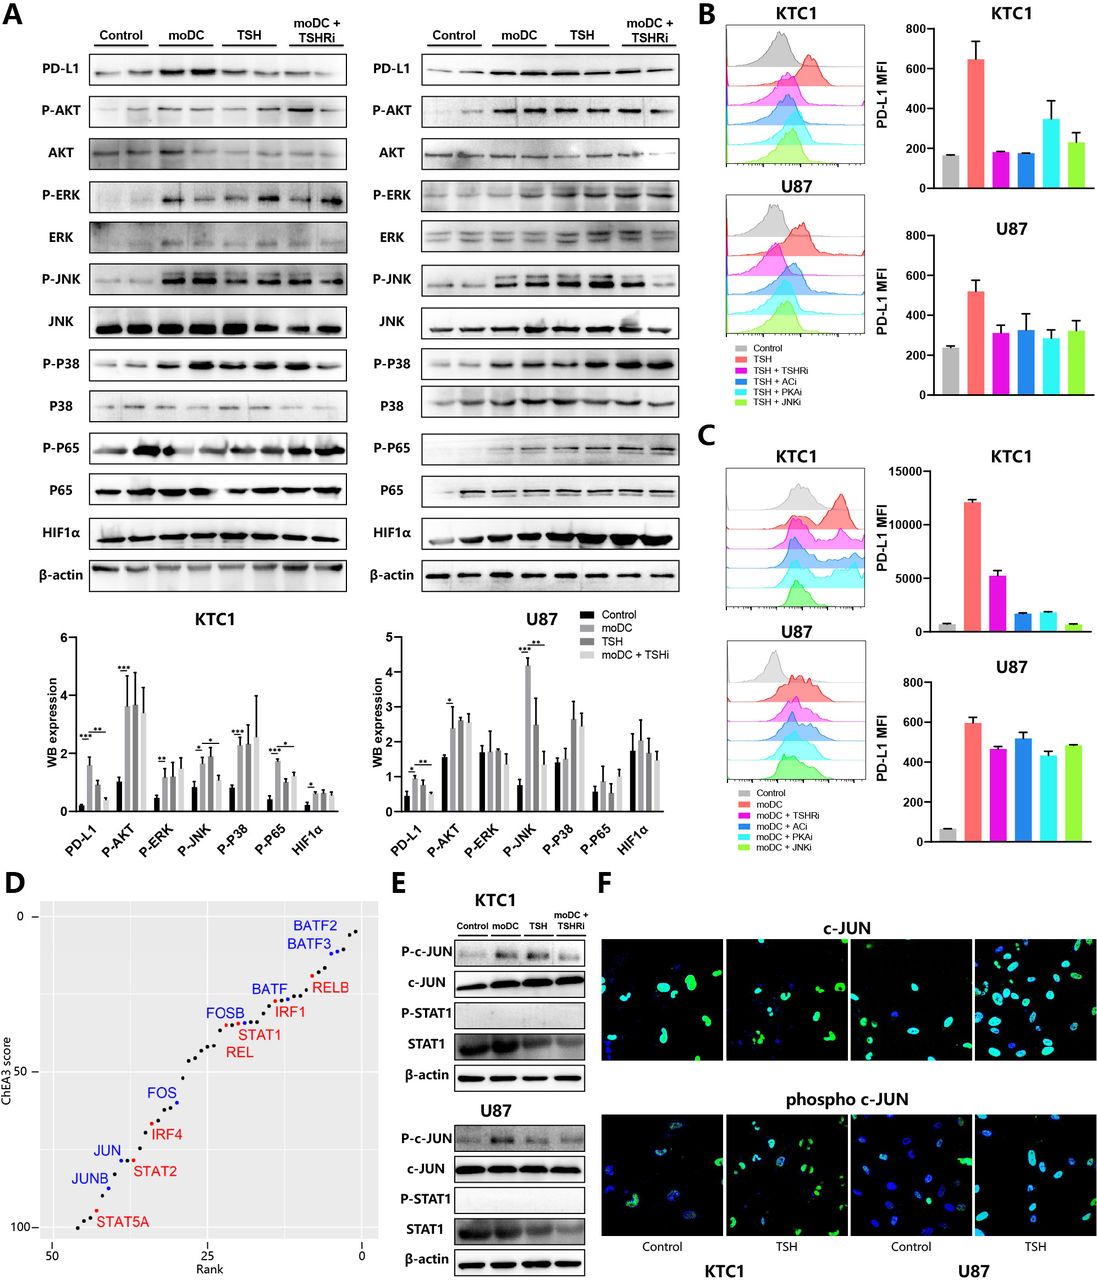
Expression of the PD-L1 gene was shown to be regulated by multiple signaling pathways, including PI3K-AKT, NF-κB (p65), JAK-STAT, and MAPK (p38, ERK, JNK).20 To explore the mechanism of TSHR-induced PD-L1 expression, we immunoblotted several kinases phosphorylation to detect the activation of the signaling pathways above. Consistent with flow cytometry’s result, PD-L1 expression of KTC1 and U87 was induced by both moDCs and TSH, inhibited by TSHRi (figure 5A). moDC-secretion supernatant contained many signaling molecules, which simultaneously activated several kinases in the KTC1 (AKT, ERK, JNK, P38, P65) and U87 (AKT, JNK). Although the high concentration of TSH also significantly activated most signaling molecules, TSHRi inhibited only JNK phosphorylation in tumor cells treated with the moDC-conditioned medium. Therefore, JNK might play a significant role in tumor phenotype change through the moDC-TSH axis (figure 5A).

Mechanism of TSH-induced tumor PD-L1 expression (A) KTC1 (left) and U87 (right) were treated with the culture supernatant of moDCs from patients with DTC and/or TSHR inhibitor (ML224). Whole-cell lysates were subjected for immunoblot analysis of PD-L1, HIF1α, β-actin, phosphorylated, and total AKT, ERK, JNK, P38, P65. Representative immunoblot picture (up) and quantitative histogram (down) are shown. Expression of PD-L1 and HIF1α was calculated as the ratio between band intensity of these genes and β-actin. Phosphorylation of five kinases was calculated as the ratio between band intensity of phosphorylated protein and total protein. (B–C) KTC1 (up) and U87 (down) were treated with TSH (B) or culture supernatant of moDCs (C) and four inhibitors. Representative histograms (left) and PD-L1 MFI (right) were shown. (D) Transcription factors (TF) enrichment in KTC1 treated with culture supernatant of moDCs based on RNA sequencing data sets. The scatter plot ranked TF from first with increasing enrichment and decreasing ChIP-X enrichment analysis 3 scores. TF from the AP-1 family (blue) and other PD-L1-related TF (red) were colored. (E) KTC1 (up) and U87 (down) were treated with the culture supernatant of moDCs from patients with DTC and/or TSHR inhibitor (ML224). Whole-cell lysates were subjected for immunoblot analysis of β-actin, phosphorylated and total c-JUN, and STAT1. (F) Immunofluorescence staining of KTC1 (left) and U87 (right) for phosphorylated (down) and total (up) c-JUN. DTC, differentiated thyroid cancers; MFI, median fluorescence intensity; moDC, monocyte-derived dendritic cells; PD-L1, programmed death-ligand 1; TSH, thyroid-stimulating hormone; TSHR, TSH receptor.
Typically, TSHR, a member of the G protein-coupling receptor (GPCR) family, activates the adenyl cyclase (AC)-cAMP-dependent protein kinase (PKA) cascade pathway through Gs-subunits (Gsa). All TSHR, PKA, AC, and JNK antagonists inhibited TSH or moDC-induced PD-L1 expression in KTC1 and U87 (figure 5B,C). Therefore, moDC released TSH to induce tumor PD-L1 expression through the AC-PKA-JNK pathway. Notably, TSH-dependent PD-L1 expression was completely inhibited by TSHRi and ACi, and only partially inhibited by PKAi and JNKi. Thus TSH contributed to PD-L1 expression with TSHR-Gs-AC activation required but downstream PKA-JNK pathway dispensable (figure 5B).
Then we analyzed RNA-seq data sets of moDC-treated KTC1 through ChEA3 tools to evaluate TF that mediated TSH-induced PD-L1 expression. Most of the enriched TF belonged to AP-1 (FOS, JUN, BATF), NF-κB (REL, RELB), and STAT family, all of which were reported to trigger PD-L1 transcription intensely (figure 5D). After a moDC-conditioned medium or TSH treatment, both c-JUN and NF-κB P65 were activated, although only the former can be inhibited by TSHRi (figure 5A,E). As for other PD-L1 related TF, HIF1α expression and STAT1 phosphorylation were not influenced by both moDCs and TSHRi (figure 5A,E). Consistently, TSH induced the location and phosphorylation of c-JUN in the nucleus (figure 5F). Given that c-JUN is the downstream phosphorylation target of JNK, we concluded that moDCs released TSH to induce PD-L1 expression in thyroid cancer and glioma through the AC-PKA-JNK-c-JUN pathway.
TSHRi boost antitumor immunity in vivo
Allograft mouse models were built to evaluate the effect of the TSH–TSHR axis in vivo. Mice were challenged with B16-F10 tumors, treated every two days from day 14 to day 22, and sacrificed on day 24 for analysis (figure 6A). Dynamic tumor volume measurement showed that tumor proliferation was significantly inhibited by TSHRi in tumors (figure 6A). Naturally, TSHRi had a stronger antitumor effect in TSHR-OE compared with wild type (WT) tumors(figure 6A). Then we evaluated the influence of TSHR signaling on tumor microenvironments throughflow cytometry. TSHR-OE in cancer cells tremendously decreased CD4 + T cell activation levels marked by IFNγ expression (figure 6B). Relevantly, Granzyme B expression in CD8 + T cells was also moderately inhibited in TSHR-OE tumors (figure 6C). Consistently, TSHRi ablated the negative impact of TSHR-OE on CD4 + and CD8+ T cells activation (figure 6B,C). In addition, TSHRi significantly decreased PD-L1 expressions in tumor cells and tumor-associated myeloid cells, such as macrophage, moDCs, and neutrophils (figure 6D). Notably, tumor-infiltration moDCs also expressed lower PD-L1 in response to TSHRi, implying that moDCs functioned simultaneously as the primary source and target of TSH (figure 6D). TSHRi also induced intratumoral Foxp3+CD25+ Treg depletion in both WT and TSHR-OE tumors (figure 6E). TSHRi had a more significant impact on the tumor microenvironment in TSHR-OE than WT B16-F10 tumors (figure 6B–E), suggesting that TSHRi reversed immune evasion mainly through the TSH–TSHR axis. Due to low TSHR expression in B16-F10 cells, we next sought to identify the activity of TSHRi in tumor models with high TSHR-expressed cell lines, such as GL261 glioma. Multiple doses of TSHRi promoted complete tumor rejection and long-term survival, with 9 of 10 mice remaining survival up to 40 days, comparing only 3 of 10 mice in the control group (figure 6F). Therefore, TSHRi played a significant antitumor activity in tumors with high TSHR expression. Combined with TSHRi, anti-PD1 antibodies inhibited tumor growth more in the GL261 tumor allograft mouse model (figure 6G). In conclusion, these preclinical data highlight the regulatory role of the TSHR pathway in modulating the tumor microenvironment and promoting the antitumor efficacy of ICBs.

TSHR inhibitors boost antitumor immunity in vivo (A–E) C57BL6 mice were subcutaneously injected with 500,000 wild types (WT) or TSHR-overexpressed (TSHR-OE) B16-F10 tumor cells. Once tumors were palpable, mice were injected intraperitoneally (i.p.) with PBS or TSHR inhibitor (TSHRi, 10 mg/kg) on days 14, 16, 18, 20, and 24. Tumors were collected on day 24 after tumor inoculation and processed as described in methods (A). Each group was marked by a different color (A–E). The mean tumor volume of the tumor-bearing mice was shown in the right panel (A), n=6 mice/group. Data are presented as mean values±SEM. Representative histograms showing IFNγ expression in CD4+ T cells (B) and Granzyme B (GzmB) expression in CD8+ T cells (C). (D) Graphs showing PD-L1 MFI in macrophage, moDCs, plasmacytoid DCs (pDCs), neutrophils, eosinophils, and tumor cells. (E) Representative flow cytometry plots showing expression of FoxP3 vs CD25 in CD4 +T cells (left) and boxplots were showing percentage CD25+FoxP3+ Treg cells of total CD4+ cells. (F–G) C57BL6 mice were subcutaneously injected with 500,000 GL261 cell lines. (F) Survival analysis of GL261-bearing mice treated with TSHRi. (G) Tumor volume change in mice treated with TSHRi and anti-PD1. IFNγ, interferon γ; MFI, median fluorescence intensity; moDC, monocyte-derived dendritic cells; PBS, phosphate buffered saline; PD-L1, programmed death-ligand 1.
Discussion
Our study demonstrates that moDCs highly expressed TSHα and TSHβ2 and were the major TSH source in the tumor microenvironment. TSH promotes proliferation, invasion, and immune evasion of tumors with high TSHR expressions, such as THCA and glioma. Combination therapy with TSHRi and ICBs is an effective therapeutic strategy for immune-resistant tumors.
TSHR belongs to glycoprotein hormone receptors, a GPCRs subfamily. TSHR can activate different G protein subtypes, including Gi, Gq, Gs, and related signaling pathways.21 For instance, TSH stimulates JNK activity through the TSHR-AC-PKA axis, promoting the proliferation and differentiation of thyroid cells.22 In addition, TSH activates PKA-dependent phosphorylation of ERK1/2 and JNK, which inhibits FASN expression and regulates lipid metabolism in mature adipocytes.23 Therefore, TSH can activate the TSHR-AC-PKA-JNK pathway, consistent with our study. Through this pathway, TSH regulates the expression of genes associated with thyroid gland development and causes the proliferation of thyroid follicular cells.24 Similarly, TSH also regulates the proliferation and invasion of tumor cells with high TSHR expressions such as THCA and glioma. Both our results and previous reports showed that the effect of TSH on tumor cells was biphasic, with proliferative effects at low concentrations and anti-proliferative action at higher concentrations.25 However, only TSH at a concentration >100 times greater than the normal value can inhibit tumor progression, almost impossible to appear under physiological conditions. Tumor cells are relatively insensitive to TSH stimulation, possibly because of lower TSHR expression levels in tumor cells than in normal thyroid tissues.
In addition, we first report that the TSH–TSHR axis regulated the immunosuppressive phenotype of tumors. TSH enhances PD-L1 expression in the tumor cells and myeloid cells, thus inhibiting the antitumor activity of T cells. It was reported that myeloid cells in the bone marrow and peripheral blood highly expressed TSHR.9 Therefore, myeloid cells could respond to TSH in a similar molecular mechanism with tumor cells. According to our study, PKA phosphorylates JNK on TSH pathway activation. JNK then translocates to the nucleus and phosphorylates c-Jun. Activated c-Jun directly binds to the promoter and first intron of PD-L1, potentially recruiting components to elevate PD-L1 transcription.20
Endocrine therapy is a cornerstone in treating hormone-dependent tumors, such as inhibiting estrogen or androgen signaling in breast or prostate cancers.3 Patients with thyroid cancer should also be treated with thyroid hormone after total thyroidectomy to reduce TSH serum level.18 Our research also explored the pro-tumor role of TSH, which exerts on both tumor cells and immune cells. Therefore, we confirmed that TSH suppression was indispensable for the postoperative management of thyroid cancer. Due to the significant role of hormones in immune responses, early-phase clinical trials are testing whether endocrine therapy could enhance the efficacy of immunotherapies. For instance, a phase II clinical trial in prostate cancer suggests that androgen deprivation therapies after administration of ICBs could improve therapeutic responses.26 Our study indicated that TSH suppression therapy might increase the response rate of patients with THCA and glioma to ICBs.
Thyroid cancer consists of a broad spectrum of histological tumor types, including differentiated THCA (DTC, 97% of all patients). Approximately 7.5% of patients with DTC develop recurrent disease at distant sites.27 The prognosis in patients with advanced DTC is poor, even with novel targeted therapies, with a median survival of 18.3 months.28 ICB therapy alone is also ineffective in a considerable number of patients, although PD-L1 is expressed by nearly 90% DTC.29 In the KEYNOTE-028 trial, partial response was achieved only in 2/22 patients with PD-L1 +advanced DTC treated with pembrolizumab (anti-PD1) for up to 24 months.30 Therefore, it remained to explore further immunotherapy for advanced DTC, such as the combination of ICBs and other therapies. Our study clarified the molecular mechanism of the combination of ICBs and TSH suppression therapy through cellular and animal experiments, which also need to be validated in the clinical trial furthermore.
Malignant primary brain tumors are a leading cause of cancer mortality in children and young adults, with few therapeutic options. Relative to other tumor types, malignant glioma displays low numbers of tumor-infiltrating lymphocytes and rampant T cell dysfunction, associated with poor ICB therapy responses.31 The blood-brain barrier restricted access of exogenous drugs and circulating immune cells to the central nervous system (CNS), indicating that endogenous molecules and resident cells majorly determined the brain tumor microenvironment.32 Therefore, the glioma microenvironment could accumulate more TSH released by the pituitary but not by immune cells, including moDCs. The high concentration of TSH stimulated glioma proliferation and limited T cell killing for glioma. Treatment targeting intracranial TSH might reverse the immunosuppression status of glioma. This research revealed significant roles that classical neuroendocrine factors played in the CNS tumor microenvironment.
In conclusion, our data demonstrate that targeting TSHR with a small molecule inhibitor is a powerful strategy to promote the rejection of established tumors. TSHRi delivers lower PD-L1 expression in both tumor cells and myeloid cells, thus leading to depletion of Treg cells and enhanced Teff activation. We identified TSHR as a new therapeutic substrate for combination in cancer immunotherapy.
Data availability statement
Data are available upon reasonable request.
Ethics statements
Patient consent for publication
Ethics approval
Blood from healthy donors and patients with differentiated thyroid cancers were obtained from the Wuhan Union Hospital with Institutional Review Board approval by the Ethical Committee of the Tongji Medical College of Huazhong University of Science and Technology (No. S010). Participants gave informed consent to participate in the study before taking part.
References
Supplementary materials
Supplementary Data
This web only file has been produced by the BMJ Publishing Group from an electronic file supplied by the author(s) and has not been edited for content.
Footnotes
Contributors ZW and ZX contributed equally. Guarantor: TH. Conception and design: ZW and SW. Acquisition of data (provided required samples, and clinical information): XZ, JL, NF, LH and RZ. Animal experiments: ZW and YX. Cellular experiments: ZW and ZX. Analysis and interpretation of data (statistical analysis and bioinformatics analysis): ZW and TH. Writing and/or revision of the manuscript: ZW. Study supervision: TH and NZ.
Funding The authors have not declared a specific grant for this research from any funding agency in the public, commercial or not-for-profit sectors.
Competing interests None declared.
Provenance and peer review Not commissioned; externally peer reviewed.
Supplemental material This content has been supplied by the author(s). It has not been vetted by BMJ Publishing Group Limited (BMJ) and may not have been peer-reviewed. Any opinions or recommendations discussed are solely those of the author(s) and are not endorsed by BMJ. BMJ disclaims all liability and responsibility arising from any reliance placed on the content. Where the content includes any translated material, BMJ does not warrant the accuracy and reliability of the translations (including but not limited to local regulations, clinical guidelines, terminology, drug names and drug dosages), and is not responsible for any error and/or omissions arising from translation and adaptation or otherwise.