Article Text

Abstract
Background Current immunotherapies still have limited successful rates among cancers. It is now recognized that T cell functional state in the tumor microenvironment (TME) is a key determinant for effective antitumor immunity and immunotherapy. In addition to exhaustion, cellular senescence in tumor-infiltrating T cells (TILs) has recently been identified as an important T cell dysfunctional state induced by various malignant tumors. Therefore, a better understanding of the molecular mechanism responsible for T cell senescence in the TME and development of novel strategies to prevent effector T cell senescence are urgently needed for cancer immunotherapy.
Methods Senescent T cell populations in the TMEs in mouse lung cancer, breast cancer, and melanoma tumor models were evaluated. Furthermore, T cell senescence induced by mouse tumor and regulatory T (Treg) cells in vitro was determined with multiple markers and assays, including real-time PCR, flow cytometry, and histochemistry staining. Loss-of-function strategies with pharmacological inhibitors and the knockout mouse model were used to identify the potential molecules and pathways involved in T cell senescence. In addition, melanoma mouse tumor immunotherapy models were performed to explore the synergistical efficacy of antitumor immunity via prevention of tumor-specific T cell senescence combined with anti-programmed death-ligand 1 (anti-PD-L1) checkpoint blockade therapy.
Results We report that both mouse malignant tumor cells and Treg cells can induce responder T cell senescence, similar as shown in human Treg and tumor cells. Accumulated senescent T cells also exist in the TME in tumor models of lung cancer, breast cancer and melanoma. Induction of ataxia-telangiectasia mutated protein (ATM)-associated DNA damage is the cause for T cell senescence induced by both mouse tumor cells and Treg cells, which is also regulated by mitogen-activated protein kinase (MAPK) signaling. Furthermore, blockages of ATM-associated DNA damage and/or MAPK signaling pathways in T cells can prevent T cell senescence mediated by tumor cells and Treg cells in vitro and enhance antitumor immunity and immunotherapy in vivo in adoptive transfer T cell therapy melanoma models. Importantly, prevention of tumor-specific T cell senescence via ATM and/or MAPK signaling inhibition combined with anti-PD-L1 checkpoint blockade can synergistically enhance antitumor immunity and immunotherapy in vivo.
Conclusions These studies prove the novel concept that targeting both effector T cell senescence and exhaustion is an effective strategy and can synergistically enhance cancer immunotherapy.
- Tumor Microenvironment
- Immunotherapy
- Melanoma
- Tumor Escape
- T-Lymphocytes
Data availability statement
Data are available on reasonable request. Not applicable.
This is an open access article distributed in accordance with the Creative Commons Attribution Non Commercial (CC BY-NC 4.0) license, which permits others to distribute, remix, adapt, build upon this work non-commercially, and license their derivative works on different terms, provided the original work is properly cited, appropriate credit is given, any changes made indicated, and the use is non-commercial. See http://creativecommons.org/licenses/by-nc/4.0/.
Statistics from Altmetric.com
WHAT IS ALREADY KNOWN ON THIS TOPIC
T cell functional state in the tumor microenvironment (TME) significantly affects the efficacy of antitumor immunity and immunotherapy. Development of senescence in T cells has been shown as an important T cell dysfunctional state in addition to exhaustion in the TME. Targeting T cell senescence is a critical immune checkpoint for cancer immunotherapy.
WHAT THIS STUDY ADDS
We used both in vitro cell culture system and in vivo in different mouse tumor models to identify the potential molecules and pathways involved in mouse T cell senescence within the TME. We also explored the synergistical antitumor efficacy via preventing tumor-specific T cell senescence combined with anti-programmed death-ligand 1 checkpoint blockade therapy in melanoma mouse tumor immunotherapy models.
HOW THIS STUDY MIGHT AFFECT RESEARCH, PRACTICE OR POLICY
These studies indicate that targeting both effector T cell senescence and exhaustion within the TME is an effective and promising strategy for cancer immunotherapy.
Introduction
T cells are the key effectors for antitumor immunity. However, T cells become dysfunctional and are not effective for tumor immunity as expected in the tumor microenvironment (TME), displaying reduced proliferative capacity, decreased effector functions and overexpressed multiple inhibitory receptors.1 T cell exhaustion is a representative of T cell dysfunctional state in the TME, and exhausted T cells express a panel of inhibitory receptors, such as programmed cell death protein 1 (PD-1), cytotoxic T lymphocyte antigen-4 (CTLA-4), T cell immunoglobulin domain and mucin domain protein 3 (TIM-3), and lymphocyte activation gene 3 protein (LAG-3).1–3 Immune checkpoint blockade therapy targeting PD-1, PD-L1, and/or CTLA-4 is designed to improve T cell function and has proven to be an effective strategy for enhancing antitumor T cell activity in various cancers.4 5 However, the current checkpoint blockade therapy has limited successes in certain types of cancers with no more than 40% success rates overall.6 7 The situation of current checkpoint blockade immunotherapy clearly indicates that there are other potential mechanisms in addition to exhaustion involved in T cell dysfunction that induce tumor immunotherapy resistance in the TME.
Cellular senescence in tumor-infiltrating T cells (TILs) has recently also been identified as an important T cell dysfunctional state induced by various malignant tumors.8–10 Both tumor cells and tumor-associated regulatory T (Treg) cells are important inducers for senescence development in effector T cells within the TME.8–13 Senescent T cells display unique phenotypes, including expression of senescence-associated β-galactosidase (SA-β-gal), loss of costimulatory molecules CD27 and CD28, upregulation of cell cycle molecules P16, P53 and P21, secretion of proinflammatory and inhibitory cytokines, and possess potent suppressive activity, which are distinctly different from exhausted T cells.8–13 In addition to impaired antitumor activities, senescent T cells can actively influence other immune cells within the TME, inducing adaptive Treg cells and performing direct inhibition on DCs and effector T cells.9 11 14 15 These recent studies clearly suggest that senescent T cells are a critical mediator and amplifier of immune suppression in the TME.8 Therefore, prevention of effector T cell senescence could also be a critical checkpoint and effective strategy for antitumor immunity and tumor immunotherapy.
In our previous studies, we observed that human Treg cells and tumor cells can induce responder T cells into senescent T cells.9 10 15 Given potential difference of immune system between humans and mouse, whether the molecule processes of T cell senescence also occur in mouse system is unclear, which is critical for the preclinical studies and translational research.16–18 In the current study, we demonstrated that mouse Treg cells and tumor cells can also induce responder T cell senescence. Furthermore, we identified that DNA damage and MAPK signaling pathways are involved in the development of T cell senescence mediated by mouse Treg cells and tumor cells. Our in vivo studies demonstrated that inhibition of DNA damage and/or MAPK P38 signaling can prevent effector T cell senescence and dysfunction, as well as enhance antitumor immunity and immunotherapy in adoptive T cell transfer therapy of melanoma models. In addition, preventing T cell senescence through inhibition of DNA damage or P38 signaling combined with checkpoint blockade immunotherapy with an anti-PD-L1 antibody can synergistically enhance antitumor efficacy in the adoptive T cell transfer therapy of melanoma models. Our studies prove the novel concept that targeting both effector T cell senescence and exhaustion is an effective strategy and can synergistically enhance cancer immunotherapy.
Materials and methods
T cells and tumor cell lines
Mouse splenic CD4+ or CD8+ T cells were purified from C57BL/6 mice by EasySep positive selection kit (StemCell Technologies). For naturally occurring mouse regulatory T cell (nTreg) purification, CD4+ T cells were negatively purified by mouse CD4+ T cell pre-enrichment kit (StemCell Technologies) and followed to purify CD4+CD25+ cells by mouse CD25 positive selection kit (StemCell Technologies). The mouse tumor cell lines E0771, LL/2 and B16F10, and embryonic fibroblasts cell line NIH/3T3 were all obtained from the American Type Culture Collection (ATCC, Manassas, Virginia, USA). All mouse cells were cultured in medium containing complete RPMI 1640 medium, 10%(v/v) FBS, 100 U/mL of penicillin, and 100 μg/mL of streptomycin.
Antibodies and inhibitors
Purified anti-CD3 (145–2 C11) and anti-CD28 (37.51), PE-conjugated antiphosphorylated-ATM (Ser1981), and PE-conjugated anti-FoxP3 were purchased from Biolegend. Antimouse-specific polyclonal phosphorylated antibodies to ERK, P38, and JNK, rabbit polyclonal antibodies to P53 and P21, and PE-conjugated donkey antirabbit IgG or PE-conjugated goat antimouse IgG secondary antibodies were purchased from Cell Signaling Technology. PE-conjugated phospho-CHK2 (Thr68) monoclonal antibody was purchased from eBioscience. MAPK signaling inhibitors U0126, SB203580, LY2228820, and SP600125 were purchased from Cayman Chemical. ATM inhibitor KU55933 was purchased from Sigma and Cayman Chemical. PE-Annexin V and 7-amino-actinomycin (7-AAD) apoptosis detection kit and Foxp3 staining buffer set were purchased from Biolegend.
In vitro Treg cell differentiation
CD4+ T cells were purified from the spleens of Foxp3eGFP reporter mice and then were activated with plate-bound anti-CD3 (2 μg/mL) and anti-CD28 (1 μg/mL) antibodies in the presence of rhTGF-β (5 ng/mL; R&D Systems) and rhIL-2(100 IU/mL, NIH/NCI). The cultured CD4+ cells were incubated at 37°C in 5% CO2 for 4–5 days before sorting the GFP+ cell fractions.
Flow cytometry analysis
The intracellular molecule expression in T cells was determined by flow cytometry with specific staining buffer set using indirect immunofluorescence labeling method unless specifically indicated. Intracellular staining was performed with rabbit antimouse specific antibodies, including anti-P21, anti-P53, anti-p-ATM, anti-p-H2AX, anti-p-CHK2, anti-p-P38, anti-p-ERK, and anti-p-JNK, and then stained with PE conjugated goat antirabbit IgG second antibody. All stained cells were analyzed on a FACS Calibur flow cytometer (BD Biosciences) and data analyzed with FlowJo V.7.6.1 software (TreeStar). In some experiments, MAPK inhibitors U0126, SB203580, or SP600125, as well as ATM inhibitor KU55933 were present at indicated concentrations in the coculture system and T cells were then analyzed for certain molecule expression by flow cytometry.
Senescence-associated β-galactosidase (SA-β-gal) staining
SA-β-gal activity in senescent T cells was detected as we described previously.10 12 15 CD4+ or CD8+ T cells were cocultured with iTreg cells or nTreg cells at a ratio of 4:1 or 2:1 in anti-CD3/CD28-coated 24-well plates for different time points, and cocultured responder T cells were then stained for SA-β-gal expression. For tumor-induced T cell senescence analysis, anti-CD3/CD28 activated CD4+ T cells or CD8+ T cells were cocultured with or without tumor cells or control NIH/3T3 cells at ratio of 1:1 for 1 day and then separated and cultured for an additional 3 days. For SA-β-gal staining, T cells were washed in PBS (pH7.2), fixed in 4% formaldehyde, and incubated overnight at 37°C with freshly prepared SA-β-gal staining solution (1 mg/mL X-gal, 5 mM K3Fe (CN)6, 5 mM K4Fe (CN)6, 2 mM MgCl2 in PBS at pH6.0). The stained T cells were examined for SA-β-gal expression with a computerized image system composed of a Leica ICC50 camera system equipped on a Leica DM750 microscope.
For some experiments, the cocultured T cells were determined for SA-β-gal expression in the presence of various MAPK or ATM inhibitors. Concentrations of inhibitors used in this study were as following: U0126 (10 µM), SB203580 (10 µM), SP600125 (10 µM), and KU55933 (10 µM).
Quantitative real-time PCR (qRT-PCR) analysis
Total RNA was extracted from T cells using the Trizol reagent (Invitrogen), and cDNA was synthesized using SuperScript II First-Strand Synthesis System (Invitrogen, USA), according to the manufacturer’s instructions. qRT-PCR assays were performed with specific primers for T cells listed below and further using an Applied Biosystems 7500 system (Applied Biosystems, USA). HPRT and β-actin were used as internal controls. Mu-Lamin B1: forward GGGAAGTTTATTCGCTTGAAGA and reverse ATCTCCCAGCCTCCCATT; Mu-HPRT: forward CTGGTGAAAAGGACCTCTCG and reverse TGAAGTACTCATTATAGTCAAGGGCA; Mu-β-actin: forward GATCAAGATCATTGCTCCTCCTG and reverse AGGGTGTAAAACGCAGCTCA. Change in expression (fold) for each gene was calculated as 2−Δ (ΔCT) where ΔCT=CT (target)−CT (housekeeping), and Δ (ΔCT) = ΔCT (treated) − ΔCT (control). Reaction product purity was confirmed by examination of melting curves for a single peak.
Animals
Foxp3eGFP mice on the C57BL/6 background, C57BL/6 mice, Rag1−/−-immunodeficient and Pmel-1 TCR/Thy1.1 transgenic mice on the C57BL/6 background (6–8 week-old female) were purchased from The Jackson Laboratory and maintained in the institutional animal facility. ATM knockout mice were provided by Dr Jonathan Fisher (Saint Louis University, St. Louis, Missouri, USA). All animal studies have been approved by the Institutional Animal Care Committee at Saint Louis University (Protocol No. 2411).
In vivo studies
Analysis of T cells in melanoma, lung and breast cancer tumor-bearing mice: mouse breast tumor cell line E0771 (2×10⁵/mouse), melanoma cell line B16F10 (2×10⁵/mouse), or Lewis lung carcinoma cell line LL/2 (2×10⁵/mouse) in 100 µL of buffered saline were subcutaneously injected into the mammary fat pad (E0771) or back (B16F10 and LL/2) of C57BL/6 mice, respectively. Three to eight mice were included in each group. When the tumor volumes reached the expected size (diameter 10–15 mm), the tumor-bearing mice were sacrificed. Blood, lymph nodes (LNs), spleens, and tumor tissues were harvested, and mononuclear cells were purified for subsequent SA-β-gal staining and flow cytometry analyses. In addition, lymphocytes from different organs of normal littermates were harvested and used as controls.
In some experiments, mouse melanoma B16F10 cells (2×10⁵/mouse) in 100 µL of buffered saline were subcutaneously injected into the back of Rag1−/−-immunodeficient mice. Splenocytes from Pmel-1 TCR/Thy1.1 transgenic mice were prepared and activated in the presence of plate-coated antimouse CD3 (2 µg/mL) and antimouse CD28 (1 µg/mL) antibodies for 6–9 days. The activated Pmel-1 T cells (2×10⁶/mouse) were adoptively transferred through intravenous injection into B16F10-bearing mice at day 6 post-tumor inoculation (2×10⁵/mouse). Blood, spleens, and tumor tissues were harvested, and mononuclear cells were purified for subsequent SA-β-gal staining and flow cytometry analyses.
T cell adoptive transfer therapy melanoma models10: Pmel-1 T cell preparation and tumor injections were described previously. The activated Pmel-1 T cells (2×10⁶/mouse) were adoptively transferred into B16F10-bearing mice at day 6 post-tumor inoculation (2×10⁵/mouse). The tumor-bearing mice were radiated with a non-myeloablative dose (500 cGy) to induce lymphopenia 1 day before T cell adoptive transfer. In a parallel experiment, KU559933 (10 mg/kg/mouse, Cayman Chemical), anti-PD-L1 neutralization antibody (50 µg/mouse, clone 10F.9G2, Bio X Cell), or LY2228820 (2.5 mg/kg/mouse, Cayman Chemical) were injected intraperitoneally into the mice at day 1 after T cell transfer and then injected every 3 days for a total of four-time injections. For some experiments to determine the direct effect of inhibitors on T cells, the activated Pmel-1 T cells were pretreated with KU559933 (10 µM) or LY2228820 (1 µM) overnight before adoptively transferring into tumor-bearing mice, and the inhibitors were not injected intraperitoneally into the mice anymore. Five to 10 mice were included in each group. Tumor size was measured with calipers every 2 days, and was further calculated based on two-dimension measurements. Mouse survival were determined based on the tumor sizes calculated according to a standard formula (length × width2 × 0.52). The experiments were terminated for ethical considerations at the endpoint (tumor volume >2000 mm3), and mouse survival then determined. Blood, spleens, and tumors were harvested at the end of each experiment. The transferred CD8+ T cells from different organs and tumor tissues were isolated for subsequent SA-β-gal staining and flow cytometry analyses.
Statistical analysis
Statistical analysis was performed with GraphPad Prism V.5 software. Unless indicated otherwise, data are expressed as mean±SD. For multiple group comparison for in vitro and in vivo studies, a one-way analysis of variance was used, followed by the Dunnett’s test for comparing experimental groups against a single control. For single comparison between two groups, paired Student’s t-tests were used. Non-parametric t-test was chosen if the sample size was too small and did not fit Gaussian distribution. Differences in survival in vivo studies were determined based on Kaplan-Meier survival analysis.
Results
Increased senescent T cells in the suppressive TME
Accumulated senescent CD8+ T cells have been found in patients with certain types of cancers.8 In our previous studies, we observed senescent T cells existing in TILs derived from patients with melanoma, head and neck, and breast cancers.9 10 To further investigate whether prevention of T cell senescence can enhance tumor immunity in preclinical tumor models, we first determined whether high prevalence of senescent T cells existed in vivo in different tumor models. We used murine mammary breast cancer cell line E0771, lung cancer cell line LL/2, and melanoma cell line B16F10 to establish breast cancer, lung cancer and melanoma tumor models, respectively. Lymphocytes from different organs and tumor sites in the tumor-bearing mice were then recovered and analyzed for cell senescence in the advanced tumor stage. We observed markedly elevated SA-β-gal+ lymphocytes existing in blood, lymph nodes, and tumors derived from all tumor-bearing mice compared with T cells from control tumor-free mice (figure 1A). We next identified the mechanism responsible for T cell senescence within the TME. Naïve CD4+ and CD8+ T cells purified from tumor-free mice and preactivated with anti-CD3/CD28 antibodies were cocultured with these tumor cell lines. We found that coculture with different types of mouse tumor cell lines significantly induced SA-β-gal+ T cell populations in preactivated T cells, indicating that mouse tumor cells can directly induce T cell senescence (figure 1B and online supplemental figure 1). However, preactivated T cells cocultured with NIH/3T3 fibroblast cell line did not induce SA-β-gal+ T cell populations (figure 1B). In addition, we determined the expression of cell cycle regulatory molecules P53 and P21 in T cells treated with tumor cells. We found that expression of P53 and P21 was significantly increased in T cells after coculture with different types of mouse tumor cell lines but not with NIH/3T3 fibroblasts (figure 1C). Lamin B1 loss has been shown in senescent primary human and murine cell types with different stimuli conditions, including DNA damage, replicative exhaustion, or oncogene overexpression, which is another senescence-associated biomarker.19 We found that activated T cells treated with different mouse tumor cell lines showed significant decrease of Lamin B1 gene expression (figure 1D). Collectively, these results indicate that increased senescent T cells in the TME and tumor cells can directly induce T cells into senescence.
Supplemental material

Mouse tumor cells promote senescence development in T cells. (A) Accumulated senescent lymphocytes existed in different organs and tumor tissues in E0771, LL/2, and B16F10 tumor-bearing mice. Blood, lymph nodes (LNs), and tumor tissues were harvested from the tumor-bearing mice when primary tumors reached 10–15 mm in diameter. Lymphocytes were purified and stained for SA-β-gal. Lymphocytes purified from tumor-free littermates included as controls. Data shown are mean±SD from 3 to 8 mice in each group. *P<0.05 and **p<0.01, compared with the respective lymphocytes from tumor-free mice. ##P<0.01, compared with the lymphocytes purified from blood in tumor-free mice. (B) Different mouse tumor cell lines (E0771, LL/2, and B16F10) induced SA-β-gal expression in T cells in vitro. Anti-CD3/CD28-activated CD4+ or CD8+ T cells were cocultured with mouse breast cancer (E0771), lung cancer (LL/2), melanoma (B16F10) tumor cells, or control embryonic fibroblast cell line (NIH/3T3) at a ratio of 1:1 for 1 day. The treated T cells were then separated and stained for SA-β-gal after culture for additional 3 days. Data shown are mean±SD from three independent experiments. **P<0.01, compared with the medium only group. (C) Mouse tumor cell treatment upregulated expression of cell cycle regulatory molecules P53 and P21 in responder T cells. Cell treatments and procedures were identical to the experiments in figure part B. Expression levels of P53 and P21 were determined by flow cytometry analysis. (D) Mouse tumor cell treatment promoted the loss of Lamin B1 expression in senescent T cells. Cell treatments and ratios were identical to the experiments in (B). Treated T cells were further cocultured for additional 24 hours or 72 hours. mRNA expression levels of Lamin B1 were determined by real-time PCR analysis. The expression level was normalized to HPRT expression and adjusted to the level in the T cell alone group. Data shown are mean±SD from three independent experiments. *P<0.05 and **p<0.01, compared with the respective medium only group. One-way analysis of variance was performed in figure parts A, B, and D. SA-β-gal, senescence-associated β-galactosidase.
Mouse Treg cells can induce T cell senescence
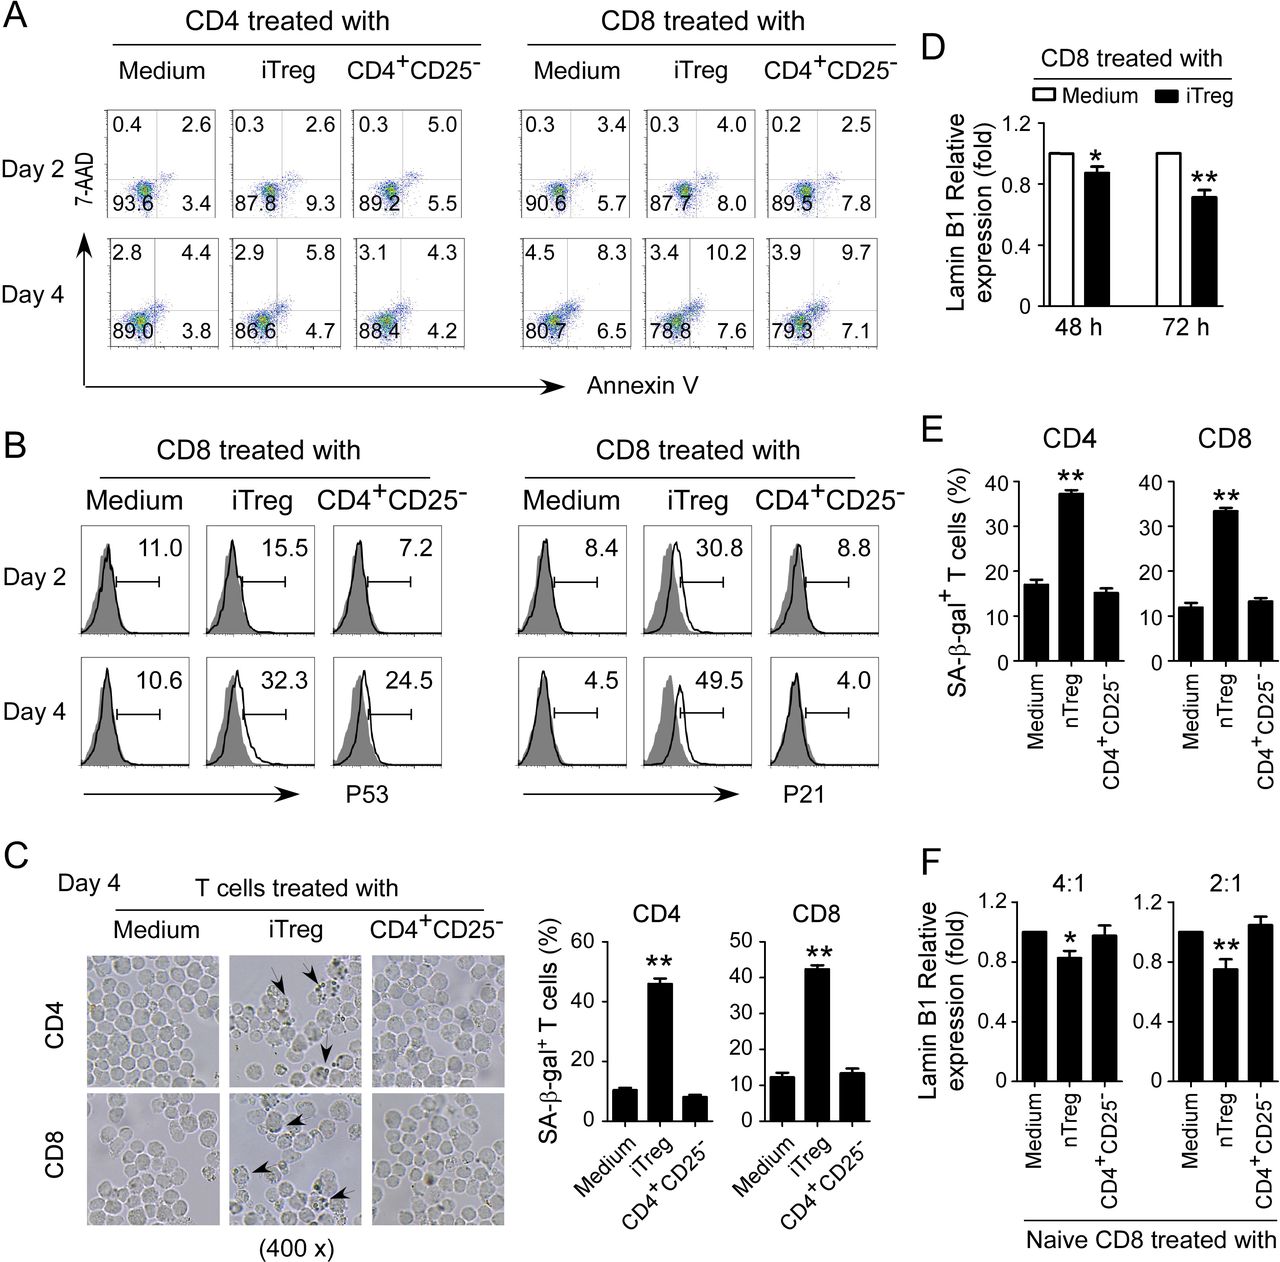
We have identified that human Treg cells can induce T cell senescence.12 15 We next determined whether mouse Treg cells can also use this similar mechanism as human Treg cells to inhibit responder T cells. Induced Treg cells (iTregs) were established with T cells purified from Foxp3eGFP reporter mice in the presence of rhTGF-β and rhIL-2.20 We further confirmed that these induced Treg cell populations were almost all FoxP3+ T cells (online supplemental figure 2A). Previous studies have already demonstrated that murine Treg cells perform their suppressive functions via induction of responder T cell apoptosis.16 We first measured apoptosis and cell death in T cell populations cocultured with iTreg cells. We did not find that murine iTreg cells induce increased apoptosis or cell death in responder T cells (figure 2A). However, we found significantly increased P53 and P21 expression in both CD4+ and CD8+ T cells after coculture with iTreg cells (figure 2B and online supplemental figure 2B). Furthermore, we also found markedly increased SA-β-gal+ T cell populations in T cells after coculture with iTreg cells (figure 2C and online supplemental figure 2C). In addition, we observed Lamin B1 loss in those responder T cells cocultured with iTreg cells (figure 2D and online supplemental figure 2D). We extended the results from iTregs to natural occurring Treg (nTreg) cells. We found that nTreg cells can also promote the expression of SA-β-gal and loss of Lamin B1 in treated responder T cells (figure 2E,F). These results suggest that mouse both iTreg and nTreg cells can induce responder T cell senescence.

Mouse Treg cells induce T cell senescence. (A) Mouse iTreg cells did not induce T cell apoptosis. CD4+ and CD8+ T cells purified from normal mouse spleens were cocultured with iTregs or control CD4+CD25− cells at a ratio of 4:1 in the presence of plate-bound anti-CD3/CD28 antibodies for 2 days or 4 days. Apoptosis in T cells was analyzed after staining with PE-labeled annexin V and 7-AAD. iTreg cells were established with T cells purified from spleens of Foxp3eGFP reporter mice in the presence of rhTGF-β and rhIL-2. (B) iTreg cells promoted expression of cell cycle regulatory molecules P53 and P21 in mouse T cells. Cell treatments and procedures were identical to the experiments in (A). Expression levels of P53 and P21 were determined by flow cytometry analysis. (C) iTreg cell treatment increased SA-β-gal+ T cell populations in responder T cells. Cell treatments and ratios were identical to the experiments in (A). The treated T cells were stained for SA-β-gal. The SA-β-gal+ T cells were identified with dark blue granules indicated by the arrows. Data shown in histograms are mean±SD from three independent experiments. **P<0.01, compared with the medium only group. (D) Mouse iTreg cell treatment induced the loss of Lamin B1 expression in responder T cells. Cell treatments and ratios were identical to the experiments in figure part A. mRNA expression levels of Lamin B1 in treated CD8+ T cells were determined by real-time PCR analysis. The expression level was normalized to HPRT expression and adjusted to the levels in the T cell alone group. Data are mean±SD from three independent experiments. *P<0.05 and **p<0.01, compared with the respective medium only group. (E and F) nTreg cell treatment increased SA-β-gal expression and decreased Lamin B1 expression in responder mouse T cells. CD4+ and CD8+ T cells were cocultured with nTreg cells or control CD4+CD25− cells at a ratio of 4:1 or 2:1 in the presence of plate-bound anti-CD3/CD28 antibodies for 3 days. The treated T cells were stained for SA-β-gal (in figure part E). mRNA expression levels of Lamin B1 were determined by real-time PCR analysis (in figure part F). The expression level was normalized to HPRT expression and adjusted to the levels in the T cell alone group. Data are mean±SD from three independent experiments. *P<0.05 and **p<0.01, compared with the respective medium only group. One-way analysis of variance was performed in figure parts C, E, and F. Paired Student’s t-test was performed in D. 7-AAD, 7-amino-actinomycin; SA-β-gal, senescence-associated β-galactosidase.
Induction of DNA damage response controls T cell senescence induced by Treg and tumor cells
Induction of DNA damage response has been shown to molecularly involve senescence initiation in responder T cells mediated by human Treg and tumor cells.9 12 We therefore investigated whether induction of DNA damage is also the main trigger for mouse Treg and tumor cell-induced senescence and dysfunction in treated T cells. We first determined the phosphorylation levels of ATM, the chief inducer of the DNA damage response, in T cells treated with mouse tumor cell lines. We found that CD4+ and CD8+ T cells cocultured with control NIH/3T3 cells or medium only had minor expression of phosphorylated ATM. In contrast, treatment with mouse tumor cell lines E0771, LL/2 and B16F10 significantly increased phosphorylation of ATM in responder T cells (figure 3A). We also found increased activation and phosphorylation of the other key DNA damage response proteins, including ATM substrate H2AX and the downstream target checkpoint kinase 2 (CHK2) in responder T cells treated with tumor cell lines but not with NIH/3T3 cells (figure 3A). We confirmed that elevated DNA damage response with increased phosphorylation of ATM and CHK2 also existed in T cells derived from blood, lymph nodes, spleens, and tumors in E0771, LL/2 and B16F10 tumor-bearing mice rather than in control tumor-free mice (figure 3B and online supplemental figure 3A). We extended our findings to mouse Treg cells and found that coculture with iTreg cells also markedly induced activation and phosphorylation of ATM, CHK2, and H2AX in both responder CD4+ and CD8+ T cells (figure 3C).
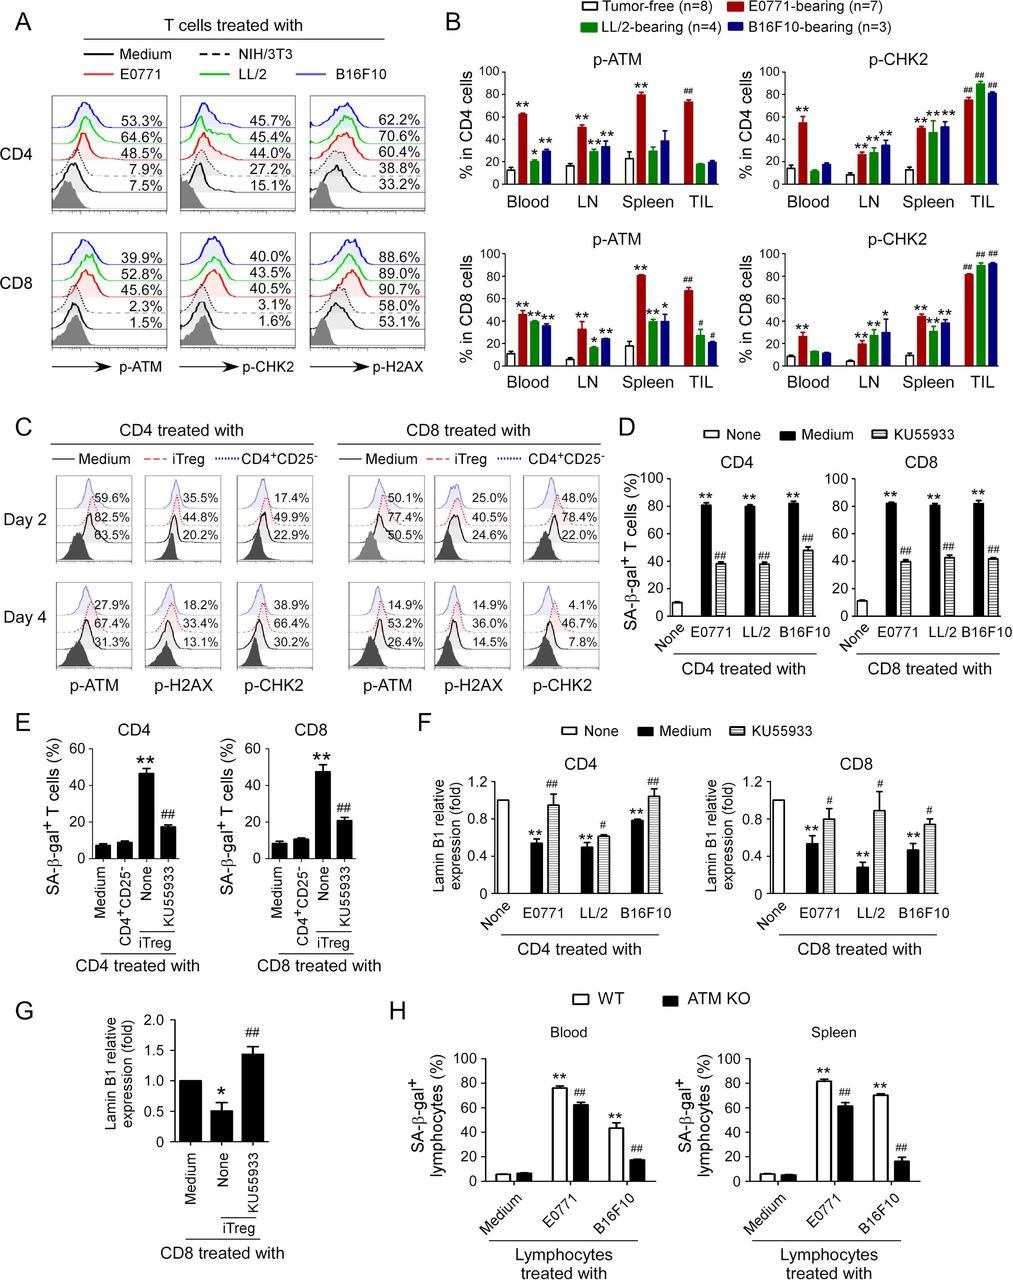
ATM-associated DNA damage response involves T cell senescence induced by Treg and tumor cells. (A) Phosphorylated activation of ATM and other associated molecules H2AX and CHK2 in both CD4+ and CD8+ T cells treated with different mouse tumor cell lines. Preactivated mouse CD4+ and CD8+ T cells were cocultured with E0771, LL/2, and B16F10 tumor cells, or NIH/3T3 fibroblasts at a ratio of 1:1 for 1 day. The treated T cells were then separated and cultured for additional 3 days. The p-ATM, p-H2AX, and p-CHK2 expression in treated T cells were analyzed by flow cytometry. (B) T cells purified from different organs and tumors in E0771, LL/2, and B16F10 tumor-bearing mice had activated phosphorylation of ATM and CHK2. Blood, LNs, spleens, and tumor tissues were harvested from the tumor-bearing mice when primary tumors reached 10–15 mm in diameter. T cells purified from tumor-free littermates included as controls. The p-ATM and p-CHK2 expression levels in T cells were analyzed by flow cytometry. Data shown are mean±SD from 3 to 8 mice in each group. *P<0.05 and **p<0.01, compared with the respective T cells in tumor-free mice. ##P<0.01, compared with the T cells purified from blood in tumor-free mice. (C) Phosphorylated activation of ATM, H2AX, and CHK2 in both CD4+ T and CD8+ T cells treated with iTreg cells. CD4+ and CD8+ T cells were cocultured with iTregs or control CD4+CD25− cells at a ratio of 4:1 in the presence of plate-bound anti-CD3/CD28 antibodies for 2 days or 4 days. The p-ATM, p-H2AX, and p-CHK2 expression levels in treated T cells were analyzed by flow cytometry. (D) Treatment with KU55933 dramatically prevented T cell senescence induced by tumor cells. Preactivated CD4+ and CD8+ T cells were treated with ATM inhibitor KU55933 (10 μM) for 24 hours and then cocultured with different types of tumor cells at a ratio of 1:1 for 1 day. The treated T cells were separated and stained for SA-β-gal after culture for additional 3 days. Data shown are mean±SD from three independent experiments with similar results. **P<0.01, compared with the T cells in medium only group. ##P<0.01, compared with T cell and tumor cell coculture group without KU55933 treatment. (E) Treatment with KU55933 markedly reduced senescent T cell populations in responder T cells induced by iTreg cells. Naïve CD4+ and CD8+ T cells were pretreated with ATM inhibitor KU55933 (10 μM) for 24 hours and then cocultured with iTreg cells at a ratio of 4:1 in anti-CD3/CD28 coated (2 µg/mL) plates for 3 days. The treated T cells were purified and stained for SA-β-gal. Data shown are mean±SD from three independent experiments with similar results. **P<0.01, compared with the T cells in medium only group. ##P<0.01, compared with T cells and the Treg coculture group without KU55933 treatment. (F and G) KU55933 treatment reversed the loss of Lamin B1 expression in responder T cells mediated by tumor cells and iTreg cells. Cell treatment and procedures were identical to the experiments in figure parts D or E. The treated T cells were then purified, and Lamin B1 mRNA expression levels in senescent T cells induced by tumor cells (F) or iTreg cells (G) were evaluated with the real-time qPCR and then normalized to HPRT expression level and adjusted to the levels in T cell in medium only (served as 1). Data shown are mean±SD from three independent experiments with similar results. *P<0.05 and **p<0.01, compared with the T cells in the medium only group. ##P<0.01, compared with the T cell coculture group without KU55933 treatment. (H) ATM knockout in lymphocytes prevented cell senescence induced by tumor cells. Anti-CD3/CD28 antibodies preactivated lymphocytes purified from the blood and spleens of ATM−/− mice or wild-type (WT) mice were cocultured with mouse E0771 or B16F10 cells at a ratio of 1:1 for 1 day. The treated lymphocytes were then separated and stained for SA-β-gal after culture for additional 3 days. Data shown are mean±SD from three independent experiments. **P<0.01, compared with lymphocyte only group from WT mice, and ##p<0.01, compared with lymphocytes from WT mice cocultured with tumor cells. One-way analysis of variance was performed in B, D, E, F, G, and H. Paired Student’s t-test was also performed in D, E, F, G, and H. SA-β-gal, senescence-associated β-galactosidase.
To further identify that induction of ATM-associated DNA damage is the cause for responder T cell senescence mediated by mouse tumor cells and Treg cells, we used the loss-of-function approach with the ATM-specific pharmacological inhibitor KU55933 to block ATM signaling in responder T cells and then determined whether it could prevent T cell senescence. We found that treatment of responder T cells with KU55933 can markedly decrease the activation and phosphorylation of ATM, CHK2, and H2AX in responder CD4+ and CD8+ T cells treated with different mouse tumor cells (online supplemental figure 3B). Importantly, pretreatment of responder T cells with KU55933 dramatically prevented the development of SA-β-gal+ T cells in both CD4+ and CD8+ T cells induced by mouse tumor cells and iTreg cells (figure 3D,E). Furthermore, ATM signaling blockage with the inhibitor partially restored the loss of Lamin B1 in senescent CD4+ and CD8+ T cells induced by mouse iTreg cells and tumor cell lines (figure 3F,G). In addition, blockage of ATM signaling significantly prevented the promoted expression of P21 and P53 in senescent CD4+ and CD8+ T cells induced by mouse tumor cell lines (online supplemental figure 3C). To further confirm that the DNA damage response is involved in mouse T cell senescence, we obtained T cells from ATM knockout mice and determined whether tumor cells can still induce senescence in responder T cells without ATM expression. We found that lymphocytes purified from ATM knockout mice have significantly decreased SA-β-gal+ cell populations mediated by different mouse tumor cell lines compared with lymphocytes from wild-type mice (figure 3H). These results clearly indicate that ATM-associated DNA damage response is a critical checkpoint for T cell senescence mediated by Treg and tumor cells in mouse.
MAPK signaling involves regulation of T cell senescence induced by Treg and tumor cells
Based on our previous studies in T cell senescence induced by human Treg cells, we next investigated whether MAPK signaling pathways are also involved in the regulation of mouse iTreg and tumor cell-induced T cell senescence.12 15 We first determined phosphorylation levels of P38, ERK, and JNK in T cells treated with mouse tumor cell lines E0771, LL/2, and B16F0. We found that CD4+ and CD8+ T cells cocultured with or without control NIH/3T3 cells had low expression of phosphorylated P38, ERK, and JNK. In contrast, coculture with three mouse tumor cell lines significantly induced phosphorylation of P38, ERK, and JNK in responder T cells (figure 4A). We further confirmed that markedly elevated activation of MAPK signaling in T cells with increased phosphorylation levels of P38 and ERK existed in lymph nodes, spleen, and tumors derived from tumor-bearing mice of the three mouse tumor models (figure 4B and online supplemental figure 4A). In addition, we found that coculture with iTreg cells dramatically induced activation and phosphorylation of P38, ERK, and JNK in both responder CD4+ and CD8+ T cells (figure 4C). However, coculture with control CD4+CD25− T cells did not promote activation of those molecules in responder T cells. To further confirm that activation of MAPK signaling controls responder T cell senescence induced by mouse tumor and Treg cells, we used specific pharmacological inhibitors to block P38, ERK, and JNK activation in responder T cells and determined whether the blockages could prevent senescence induction in T cells. We found that pretreatments with different inhibitors, including SP600125 (a JNK inhibitor), SB203580 (a p38 inhibitor), and U0126 (an ERK1/2 inhibitor), in responder T cells significantly prevented induction of SA-β-gal+ T cell populations in both CD4+ and CD8+ T cells mediated by mouse tumor cells or iTreg cells (figure 4D,E). Furthermore, MAPK signaling blockage through specific inhibitors partially restored the loss of Lamin B1 in senescent CD4+ and CD8+ T cells induced by different types of mouse tumor cell lines or iTreg cells (figure 4F,G). In addition, pretreatment of responder T cells with KU55933 suppressed the phosphorylated activation of P38, ERK, and JNK in T cells mediated by different types of tumor cells (online supplemental figure 4B). These results suggest that ATM-associated DNA damage signaling cooperates with MAPK signaling to control senescence development in T cells induced by both Treg cells and tumor cells.

MAPK signaling controls T cell senescence induced by Treg and tumor cells. (A) Phosphorylated activation of ERK, P38, and JNK in both CD4+ T and CD8+ T cells treated with different types of mouse tumor cell lines. Anti-CD3/CD28 preactivated mouse CD4+ T and CD8+ T cells were cocultured with E0771, LL/2, and B16F10 tumor cells, or control NIH/3T3 cells at a ratio of 1:1 for 1 day. The treated T cells were then separated and cultured for additional 3 days. Expression of p-ERK, p-P38, and p-JNK in treated T cells was analyzed by flow cytometry. (B) T cells purified from different organs and tumors in E0771, LL/2, and B16F10 tumor-bearing mice had increased phosphorylation levels of ERK and P38. LNs, spleens, and tumor tissues were harvested from the indicated tumor-bearing mice when primary tumors reached 10–15 mm in diameters. T cells purified from tumor-free littermates served as controls. The p-ERK and p-P38 expression levels in T cells were analyzed by flow cytometry. Data shown are mean±SD from 3 to 8 mice in each group. *P<0.05 and **p<0.01, compared with the respective T cells in tumor-free mice. ##P<0.01 compared with the T cells from spleen in tumor-free mice. (C) Phosphorylated activation of ERK, P38, and JNK in both CD4+ T and CD8+ T cells treated with iTreg cells. CD4+ and CD8+ T cells were cocultured with iTregs or control CD4+CD25- T cells at a ratio of 4:1 in the presence of plate-bound anti-CD3/CD28 antibodies for 2 days or 4 days. The p-ERK, p-P38, and p-JNK expression levels in treated T cells were analyzed by flow cytometry. (D and E) Treatment with MAPK signaling inhibitors dramatically reduced senescent T cell induction in responder T cells mediated by tumor cells (in figure part D) and iTreg cells (in figure part E). Preactivated CD4+ and CD8+ T cells were treated with ERK inhibitor U0126 (10 μM), P38 inhibitor SB203580 (10 μM), or JNK inhibitor SP600125 (10 μM) for 24 hours and then cocultured with different types of tumor cells (in figure part D) or iTreg cells (in figure part E). The cell coculture and procedures were identical to experiments in figure parts A or C, respectively. The treated T cells were separated and stained for SA-β-gal. Data shown are mean±SD from three independent experiments with similar results. **P<0.01, compared with the T cells in medium only group. ##P<0.01, compared with the respective cell coculture group without inhibitor treatment. (F and G) Inhibition of MAPK signaling pathways reversed the loss of Lamin B1 expression in responder T cells mediated by tumor cells (in figure part F) and iTreg cells (in figure part G). Cell treatment and procedures were identical as in figure parts D and E. Treated T cells were purified, and Lamin B1 mRNA expression levels in senescent T cells induced by tumor cells (F) or iTreg cells (G) were evaluated with real-time qPCR and then normalized to HPRT expression level and adjusted to the levels in T cells in medium only (served as 1). Data shown are mean±SD from three independent experiments with similar results. **P<0.01, compared with the T cells in medium only group. #P<0.05 and ##p<0.01, compared with the respective T cell coculture group without inhibitor treatment. One-way analysis of variance was performed in B, D, E, F, and G. LNs, lymph nodes; SA-β-gal, senescence-associated β-galactosidase.
Prevention of tumor-specific T cell senescence by blocking DNA damage and/or MAPK signaling enhances antitumor immunity in vivo
Our current and previous studies suggest that prevention of senescence development in tumor-specific T cells is critical for antitumor immunity.9 12 13 Based on our current in vitro studies, we next explored whether targeting ATM-associated DNA damage response and/or MAPK signaling activation could be effective strategies to prevent senescence in tumor-specific T cells for cancer immunotherapy. We used the well-established B16F10 melanoma and Pmel (gp100-specific) TCR transgenic mouse models for the studies.10 We first determined whether B16F10 tumor cells could promote senescence development in tumor-specific Pmel-1 T cells in vivo. Anti-CD3/CD28 preactivated gp100-specific CD8+ T cells were adoptively transferred into B16F10 tumor-bearing Rag1−/−-immunodeficient mice through intravenous injection at day 6 after B16F10 tumor cell inoculation. Blood, spleens, and tumor tissues were harvested from the tumor-bearing mice when primary tumors reached 10–15 mm in diameter. As expected, we found that Pmel-1 T cells purified from tumor tissues, blood, and spleens of tumor-bearing mice had much higher SA-β-gal+ populations than those in respective blood and spleens in tumor-free Rag1−/− mice (online supplemental figure 5A). Furthermore, Pmel-1 T cells purified from tumor tissues and different organs of tumor-bearing mice had significantly increased cell cycle regulatory molecules P21 and P53 expression, as well as activated phosphorylation of ATM and CHK2 compared with those in tumor-free Rag1−/− mice (online supplemental figures 5B and 5C). These results collectively suggest that tumor cells could promote senescence and induce DNA damage in tumor-specific T cells in vivo.
We next explored whether targeting ATM-associated DNA damage response can prevent senescence in tumor-specific T cells for cancer immunotherapy. Anti-CD3/CD28 preactivated gp100-specific CD8+ T cells were adoptively transferred into B16F10 tumor-bearing immune complete C57BL/6 mice through intravenous injection at day 6 after B16F10 tumor cell inoculation. KU55933 (10 mg/kg/mouse) was injected intraperitoneally into the mice every 3 days for a total of four injections following the adoptive transfer of activated Pmel-1 T cells. Tumor growth was evaluated. In addition, the adoptively transferred Pmel-1 T cells were recovered from different groups at the end of experiments and further analyzed for the effector functions and senescence development. We observed that B16F10 tumor grew very aggressively in vivo and that tumor-specific Pmel-1 T cells can strongly inhibit B16F10 tumor growth (figure 5A). Furthermore, administration with ATM signaling inhibitor KU55933 dramatically promoted the inhibition of tumor growth mediated by gp100-specific CD8+ T cells (figure 5A). However, KU55933 treatment alone did not have an inhibitory effect on tumor growth if without T cell involvement. To further confirm the results shown in vitro studies, we found that treatment with KU55933 markedly increased CD8+ T cell fractions in different organs of tumor-bearing mice with adoptive transfer of Pmel-1 T cells. In addition, KU55933 administration significantly increased granzyme B+, perforin+, and IFN-γ+ T cell populations within the adoptively transferred Pmel-1 T cells recovered from different organs and tumor sites of tumor-bearing mice (figure 5B). As expected, KU55933 treatment dramatically prevented cell senescence in gp100-specific CD8+ T cells from blood, spleens, and tumor tissues from B16F10-bearing mice (figure 5C). These results suggest that blockage of ATM-associated DNA damage can prevent tumor-specific T cell senescence and enhance antitumor ability mediated by tumor-specific effector T cells.

Prevention of tumor-specific T cell senescence by blocking DNA damage and/or MAPK signaling enhances antitumor immunity in vivo. (A) Administration of ATM inhibitor KU55933 enhanced antitumor immunity against melanoma mediated by Pmel-1 T cells. Mouse B1610 tumor cells (2×10⁵/mouse) were subcutaneously injected into C57BL/6 mice. The activated Pmel-1 T cells (2×10⁶) were adoptively transferred through intravenous injection into B16F10-bearing mice at day 6 post-tumor inoculation. KU55933 (10 mg/kg/mouse) was injected intraperitoneally into the mice at day 1, 4, 7, and 10 after T cell transfer. Tumor volumes were measured and presented as mean±SD (n=4–6 mice/group). (B) KU55933 treatment significantly increased IFN-γ+, granzyme B+, perforin+, and CD8+ cell populations in lymphocytes from different organs and tumor tissues in B16F10-bearing mice. Cell treatment and adoptive transfer procedures were identical as in figure part A. Blood, spleens, and tumors were harvested at day 24 post-tumor injection. Lymphocytes were separated from different organs and tumor tissues, and T cell subpopulations were analyzed by flow cytometry. Data shown are mean±SD from different groups (n=4 mice/group). *P<0.05 and **p<0.01, compared with the T cell adoptive transfer only group. #P<0.05 and ##p<0.01, compared with the adoptive transfer T cells in tumor-bearing mice without KU55933 treatment group. (C) Injection of KU55933 markedly prevented induction of senescence in transferred Pmel-1 T cells in B16F10-bearing mice. Cell treatment and adoptive transfer procedures were identical as in figure parts A and B. The transferred Pmel-1 T cells in different organs and tumors were isolated and stained for SA-β-gal. Data shown are mean±SD from 6 to 7 mice each group. **P<0.01, compared with the T cell adoptive transfer only group. ##p<0.01, compared with the adoptive transfer T cells in tumor-bearing mice without KU55933 treatment group. (D) Administration of P38 inhibitor LY2228820 enhanced antitumor immunity against melanoma mediated by Pmel-1 T cells. Mouse B1610 tumor cells (2×10⁵/mouse) were subcutaneously injected into Rag1−/− mice. The activated Pmel-1 T cells (2×10⁶) were adoptively transferred through intravenous injection into B16F10-bearing mice at day 6 post-tumor inoculation. LY2228820 (2 mg/kg/mouse) was injected intraperitoneally into the mice at day 1, 4, 7, and 10 after T cell transfer. Tumor volumes were measured and presented as mean±SD (n=4–6 mice per group). (E) Inhibition of P38 signaling with LY2228820 markedly blocked the induction of senescence in transferred Pmel-1 T cells in B16F10-bearing mice. Cell treatment and adoptive transfer procedures were identical as in figure part D. Blood and tumors were harvested at day 19 post-tumor injection. The transferred Pmel-1 T cells in blood and tumors were isolated and stained for SA-β-gal expression. Data shown are mean±SD from 3 to 4 mice each group. **P<0.01, compared with the T cell adoptive transfer only group. ##P<0.01, compared with the adoptive transfer T cells in tumor-bearing mice without LY2228820 treatment group. (F) LY2228820 treatment significantly increased IFN-γ+, granzyme B+, perforin+, and CD8+ cell populations in lymphocytes in B16F10-bearing mice. Cell treatment and adoptive transfer procedures were identical as in figure parts D and E. The transferred Pmel-1 T cells in blood and tumors were isolated, and T cell subpopulations were analyzed by flow cytometry. Data shown are mean±SD from different groups (n=3–4 mice/group). **P<0.01, compared with the T cell adoptive transfer only group. #P<0.05 and ##p<0.01, compared with the adoptive transfer T cells in tumor-bearing mice without LY2228820 treatment group. One-way analysis of variance was performed in figure parts A, B, C, D, E, and F. SA-β-gal, senescence-associated β-galactosidase.
We next investigated whether blockage of MAPK signaling in T cells can also prevent T cell senescence and enhance antitumor immunity in vivo. We used P38 specific pharmacological inhibitor LY2228820 and the B16 melanoma model previously to test our hypothesis. Similar with the results shown in the KU55933 studies, we found that administration of LY2228820 significantly enhanced antitumor efficacy mediated by tumor-specific Pmel-1 T cells in this B16F10 melanoma model (figure 5D). Furthermore, LY2228820 treatment prevented senescence induction, as well as promoted effector T cell populations as evidenced with increases in granzyme B+, perforin+, and IFN-γ+ T cell populations in tumor-specific Pmel-1 T cells (figure 5E,F). These results clearly indicate blockage of P38 signaling in T cells can also prevent tumor-specific T cell senescence and enhance antitumor immunity.
To further confirm the therapeutic effects mediated by ATM and p38 inhibitors are due to direct inhibition of senescence on T cells, activated Pmel-1 T cells were pretreated with ATM inhibitor KU559933 (10 μM) or P38 inhibitor LY2228820 (1 μM) overnight and then were adoptively transferred into B16F10-bearing mice. We found that pretreatment with ATM inhibitor KU55933 or P38 inhibitor LY2228820 in Pmel-1 T cells also enhanced antitumor immunity against melanoma mediated by Pmel-1 T cells (online supplemental figure 6A). Furthermore, pretreatments with KU55933 or LY2228820 significantly increased CD8+ T cell fraction and IFN-γ+CD8+ T cell populations in lymphocytes from tumor tissues, as well as prevented senescence induction in transferred Pmel-1 T cells in B16F10-bearing mice (online supplemental figures 6B,C). These results further suggest that ATM and P38 signaling inhibitor-mediated antitumor effects are through senescence inhibition on tumor-specific T cells in these therapeutic models.
Reversal of tumor-specific T cell senescence combined with anti-PD-L1 checkpoint blockade can synergistically enhance antitumor immunity and immunotherapy in vivo
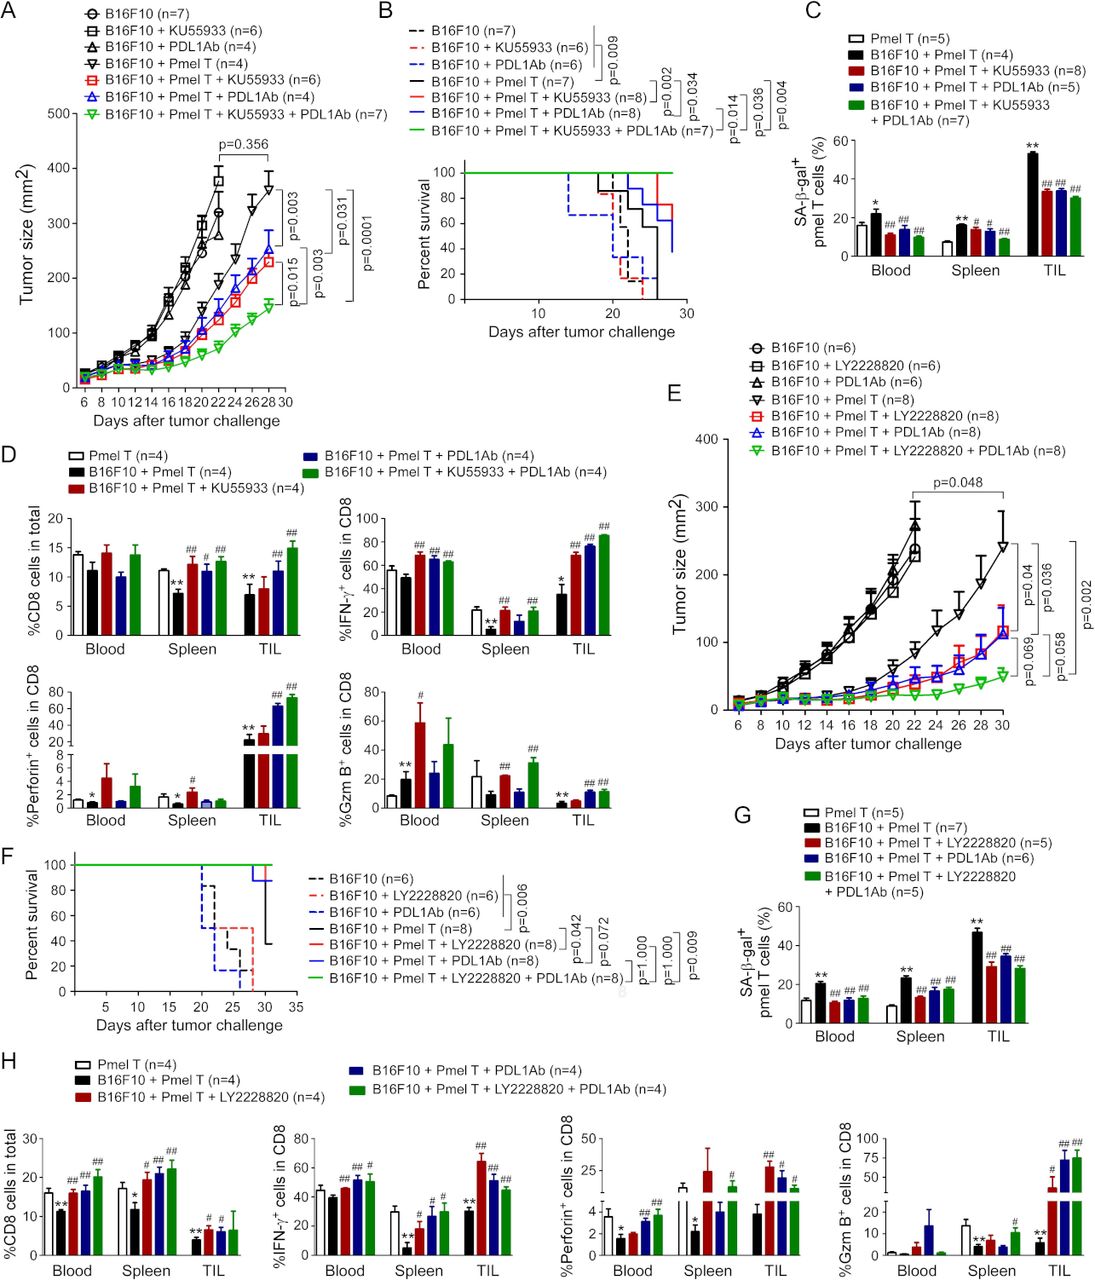
PD-1/PD-L1 blockade has shown promising effects in immunotherapy in certain types of cancers; however, single anti-PD-1/PD-L1 therapy has limited therapeutic effects.21 22 Therefore, we explored whether combined strategies to target both T cell exhaustion and senescence can improve antitumor efficacy mediated by checkpoint blockage therapy in cancer. We determined whether blockage of ATM-associated DNA damage response and/or MAPK signaling in tumor-specific T cells can improve antitumor efficacy of anti-PD-L1 checkpoint blockade therapy in B16 melanoma models. KU55933 (10 mg/kg/mouse) and antimouse PD-L1 (50 µg/mouse) were injected intraperitoneally into the mice separately or in combination every 3 days for a total of four injections following the adoptive transfer of Pmel-1 T cells in the B16F10 tumor-bearing mice. Treatments with KU55933 or anti-PD-L1 only did not have direct effects on tumor growth (figure 6A). However, treatments with KU55933 or anti-PD-L1 antibody can significantly promote antitumor efficacy mediated by gp100-specific CD8+ T cells (figure 6A). Furthermore, combinations with KU55933 and anti-PD-L1 antibody can synergistically enhance antitumor immunity and immunotherapy mediated by tumor-specific Pmel-1 T cell transfer against B16F10 melanoma (figure 6A). In addition, Kaplan-Meier survival analysis showed that mice treated with Pmel-1 T cells combined with KU55933 or antimouse PD-L1 had much longer survival than the Pmel-1 T cell treatment only group (figure 6B). Importantly, Pmel-1 T cells combined with KU55933 and anti-PD-L1 treatments had a much better effect on mouse survival than the Pmel-1 T cell only or combined with KU55933 or antimouse PD-L1 alone groups (figure 6B). To analyze the treatment effects on senescence development in tumor-specific T cells, we found that treatments with KU55933, antimouse PD-L1, or combinations dramatically prevented cell senescence in gp100-specific CD8+ T cells purified from blood, spleens, and tumor tissues of B16F10-bearing mice (figure 6C). In addition, treatments with KU55933, antimouse PD-L1, or combinations can significantly increase CD8+ T cell fractions, and promote granzyme B+, perforin+, and IFN-γ+ cell populations in the adoptively transferred Pmel-1 T cells derived from blood, spleens, and tumor tissues in B16F10 tumor-bearing mice (figure 6D). Notably, combinations with KU55933 and antimouse PD-L1 treatments had more increases in those effector molecules in T cells than other treatment groups.

Reversal of tumor-specific T cell senescence combined with anti-PD-L1 checkpoint blockade therapy synergistically enhance antitumor immunity in vivo. (A) Combination treatments with KU55933 and anti-PD-L1 antibody synergistically enhanced antitumor immunity against melanoma mediated by Pmel-1 T cells. Mouse B1610 tumor cells (2×10⁵/mouse) were subcutaneously injected into C57BL/6 mice. The preactivated Pmel-1 T cells (2×10⁶/mouse) were adoptively transferred through intravenous injection into B16F10-bearing mice at day 6 post-tumor inoculation. KU55933 (10 mg/kg/mouse) and/or anti-PD-L1 antibody (50 µg/mouse) were injected intraperitoneally into the mice at day 1, 4, 7, and 10 after T cell adoptively transfer. Tumor volumes were measured and presented as mean±SD (n=4–7 mice per group). (B) Combination treatments with KU55933 and anti-PD-L1 antibody prolonged survival of tumor-bearing mice mediated by Pmel-1 T cells. Cell treatment and adoptive transfer procedure were identical to the experiments in figure part A. Mouse survival was determined based on the ethical consideration of tumor size (tumor volume >2000 mm3) and evaluated with Kaplan-Meier analysis. (C) Administration of KU55933 combined with anti-PD-L1 blockade markedly prevented induction of senescence in transferred Pmel-1 T cells in B16F10-bearing mice. Cell treatment and adoptive transfer procedure were identical to figure part A. Blood, spleens, and tumors were harvested at day 28 post-tumor injection. The transferred Pmel-1 T cells in different organs and tumors were isolated and stained for SA-β-gal. Data shown are mean±SD from four to eight mice in each group. *P<0.05 and **p<0.01, compared with the T cell adoptive transfer only group. #P<0.05 and ##p<0.01, compared with the T cell transfer in B16F10 tumor-bearing mice group. (D) Administration of KU55933 combined with anti-PD-L1 blockade significantly increased IFN-γ+, granzyme B+, perforin+, and CD8+ cell populations in transferred Pmel-1 T cells in B16F10-bearing mice. Cell treatment and adoptive transfer procedure were identical to figure part A. Lymphocytes were separated from different organs and tumor tissues, and T cell subpopulations were analyzed by flow cytometry. Data shown are mean±SD from different groups (n=4 mice/group). *P<0.05 and **p<0.01, compared with the T cell adoptive transfer alone group. #P<0.05 and ##p<0.01, compared with the T cell transfer in B16F10 tumor-bearing mice group. (E) Combination treatments with P38 inhibitor LY2228820 and anti-PD-L1 antibody synergistically enhanced antitumor immunity against melanoma mediated by Pmel-1 T cells. Mouse B1610 tumor cells (2×10⁵/mouse) were subcutaneously injected into C57BL/6 mice. The preactivated Pmel-1 T cells (2×10⁶/mouse) were adoptively transferred through intravenous injection into B16F10-bearing mice at day 6 post-tumor inoculation. LY2228820 (2.5 mg/kg/mouse) or/and anti-PD-L1 antibody (50 μg/mouse) were injected intraperitoneally into the mice at day 1, 4, 7, and 10 after T cell adoptively transfer. Tumor volumes were measured and presented as mean±SD (n=6–8 mice per group). (F) Combination treatments with LY2228820 and anti-PD-L1 antibody prolonged survival of tumor-bearing mice mediated by Pmel-1 T cells. Cell treatment and adoptive transfer procedure were identical to the experiments in figure part E. Mouse survival was determined based on the ethical consideration of tumor size (tumor volume >2000 mm3) and evaluated with Kaplan-Meier analysis. (G) Administration of LY2228820 combined with anti-PD-L1 antibody markedly blocked the induction of senescence in transferred Pmel-1 T cells in B16F10-bearing mice. Cell treatment and adoptive transfer procedures were identical to figure part E. Blood, spleens, and tumors were harvested at day 30 post-tumor injection. The transferred Pmel-1 T cells in different organs and tumors were isolated and stained for SA-β-gal. Data shown are mean±SD from five to seven mice in each group. **P<0.01, compared with the T cell adoptive transfer only group. #P<0.05 and ##p<0.01, compared with the T cell transfer in B16F10 tumor-bearing mice group. (H) Administration of LY2228820 combined with anti-PD-L1 antibody blockade increased IFN-γ+, granzyme B+, perforin+, and CD8+ cell populations in transferred Pmel-1 T cells in B16F10-bearing mice. Cell treatment and adoptive transfer procedure were identical to (E). Lymphocytes were separated from different organs and tumor tissues, and T cell subpopulations were analyzed by flow cytometry. Data shown are mean±SD from different groups (n=4 mice/group). *P<0.05 and **p<0.01, compared with the T cell adoptive transfer alone group. #P<0.05 and ##p<0.01, compared with the T cell transfer in B16F10 tumor-bearing mice group. One-way analysis of variance and unpaired Student’s t-test was performed in A, C, D, E, G, and H. SA-β-gal, senescence-associated β-galactosidase.
We next determined whether blocking MAPK signaling could also promote the antitumor effect of PD-L1 checkpoint blockade therapy in vivo. Similar to the results shown in KU55933 studies, we found that administration of P38 inhibitor LY2228820 can significantly promote antitumor efficacy and prolong mouse survival mediated by gp100-specific CD8+ T cells (figure 6E,F). Furthermore, combined treatments with LY2228820 and anti-PD-L1 antibody can synergistically enhance antitumor immunity mediated by tumor-specific Pmel-1 T cells against B16F10 melanoma, and the tumor-bearing mice with combination treatments had much longer survival than other treatment groups (figure 6E,F). In addition, treatments with LY2228820, anti-PD-L1 antibody, or combinations prevented senescence induction, as well as promoted effector T cell populations in tumor-specific Pmel-1 T cells, suggesting enhanced antitumor immunity (figure 6G,H). Collectively, these studies indicate that prevention of both cell exhaustion and senescence in tumor-specific T cells is an effective strategy for cancer immunotherapy.
Discussion
It is now well recognized that accumulated dysfunctional T cells in the suppressive TME are the major obstacle for effective antitumor immunity and tumor immunotherapy.1 Development of novel strategies to overcome T cell dysfunctions is urgently needed for successful tumor immunotherapy. Our previous studies have demonstrated that both human malignant tumor cells and Treg cells can induce senescence in responder effector T cells, which is an important T cell dysfunctional state in the TME.9 15 In this study, we identified that mouse Treg cells and tumor cells can also convert responder T cells into senescence, similarly presented as in human T cells induced by human Treg cells and tumor cells. We further demonstrated that DNA damage and MAPK signaling pathways are both critical and involved in the development of T cell senescence mediated by mouse Treg cells and tumor cells. Our in vivo studies indicated that inhibition of DNA damage and/or MAPK P38 signaling can prevent effector T cell senescence and dysfunction, resulting in enhanced antitumor immunity and immunotherapy in the adoptive T cell transfer therapy of melanoma models. Importantly, combined strategies to prevent T cell senescence and blockade of T cell exhaustion in tumor-specific T cells can synergistically enhance antitumor efficacy compared with the single immune checkpoint blockade therapy. Our studies clearly suggest that targeting both effector T cell senescence and exhaustion is an effective and novel strategy for cancer immunotherapy.
Studies from other group have previously shown that mouse Treg cells can suppress the proliferation and function of responder T cells through induction of T cell apoptosis.16 However, our recent studies have identified that human nTreg and tumor-derived Treg cells, as well as human tumor cells can induce naïve and effector T cell senescence.9–13 15 Therefore, whether senescence also occurs in mouse T cells is unclear. Furthermore, understanding whether mouse Treg and tumor cells can also induce effector T cell senescence is critical for our in vivo preclinical studies to test the hypothesis that blockage of effector T cell senescence is an important checkpoint for tumor immunotherapy. To address these important issues, our current studies have clearly demonstrated that both mouse Treg cells and different types of tumor cells also can induce responder T cell senescence, evidenced by expression of SA-β-gal, decrease of Lamin B1 expression, and promotion of cell cycle molecule P53 and P21 expression. Importantly, we observed that accumulation of senescent T cells in the TME of different types of mouse tumor models, including breast cancer E0771, B16 melanoma and lung cancer LL/2. These studies clearly suggest that T cell senescence is a general feature occurred in the TME in both human and mouse cancers and that Treg cells and tumor cells from both humans and mouse share the similar suppressive mechanism on T cells. These results are critical for our in vivo in preclinical models to determine antitumor efficacy mediated by prevention of senescence in tumor-specific T cells for cancer immunotherapy.
Our current study further explored the molecular processes responsible for T cell senescence in the TME mediated by both Treg cells and tumor cells. MAPK signaling network is critical for tumor growth, migration, and survival, as well as tumor resistance to stress and chemotherapeutic agents.23 24 Various MAPK family members have been proposed as candidates for therapy, including MEK/ERK, JNK, and P38 molecules.23 MAPK inhibitors have been widely used as target therapy in clinical trials for the treatment of melanoma patients.25–28 Besides the effect on tumor cells, MAPK signaling is also essential for T cell activation, proliferation, and development.29 30 P38 has been shown to promote Treg-mediated immune suppression.31 Our current studies in mouse T cells and previous studies in human T cells have obtained consistent results that MAPK signaling including ERK1/2 and P38 is critical for T cell senescence mediated by Treg cells and tumor cells, except that JNK signaling is not shown activation in senescent human T cells.10 12 15 Importantly, our current studies have demonstrated that activation of P38 and ERK1/2 were also exhibited in T cells derived from tumors and different organs in vivo in tumor-bearing mice. Therefore, targeting MAPK signaling might be an important strategy to prevent effector T cell senescence for tumor immunotherapy. In fact, phase III clinical trials used some selective MAPK inhibitors have shown significant enhancement of T cell recognition of tumor without affecting T cell function in melanoma.25 32 33 To provide proof of concept, we performed in vivo studies in tumor immunotherapy models using a P38 inhibitor LY2228820 (Ralimetinib), both alone and in combination with other agents, for the treatment of breast cancer, ovarian cancer, and glioblastoma.34 Our in vivo studies clearly demonstrated that administration of LY2228820 can significantly prevent senescence development in tumor-specific T cells and enhance antitumor immunity in B16 melanoma models.
In addition to MAPK signaling pathways, we have identified that induction of DNA damage response is the cause for mouse T cell senescence mediated by both Treg cells and tumor cells. Recent studies have demonstrated that DNA damage response becomes defective as a common feature in cancer cells and that targeting the DNA damage pathway is a potential therapeutic strategy for tumors.35 36 ATM and ATR kinases, two key mediators of DNA damage response, can induce cell cycle arrest. Small molecular inhibitors highly selective for ATM and ATR are currently in development in preclinical models and clinical trials for cancer treatments.37 In addition, ATM kinase inhibitors such as AZD0156 have also used in clinical trials for treatments of advanced cancers.38 39 It has been shown that DNA damage molecules accumulated in T cells with age or senescence.40 Senescent T cells have also been shown to accumulate in patients with different types of cancers.8 Our previous studies have demonstrated that ATM-associated DNA damage response is upregulated in senescent T cells induced by human Treg cells or tumor cells.9 10 12 In addition, human Treg-induced T cell senescence can be prevented via inhibition of the DNA damage response through ATM specific inhibitors.12 In the present study, we further demonstrated that blocking ATM signaling with the specific inhibitor can prevent tumor-specific T cell senescence and enhance antitumor immunity in the mouse melanoma models. These data further suggest that inhibiting DNA damage response is also an attractive therapeutic strategy for cancer immunotherapy.
T cell exhaustion is a well-recognized T cell dysfunctional state in the TME in various types of cancers.1–3 Exhausted T cells highly express a panel of inhibitory receptors, such as PD-1, CTLA-4, and Tim-3, and exhibit impaired antitumor function.1–3 Current immune checkpoint blockade therapies targeting these inhibitory molecules have obtained promising efficacy for patients with certain types of advanced cancers.41 42 However, the overall success rates of immune checkpoint blockade immunotherapy are still limited.21 22 43 Therefore, greater efforts are needed to understand the molecular mechanisms involved in the induction of dysfunctional T cells besides T cell exhaustion within the TME and/or develop new therapeutic strategies with novel treatment combinations to enhance antitumor efficacy of immune checkpoint blockade. In our previous and current studies, we have clearly demonstrated that T cell senescence is a general feature and is another important T cell dysfunctional state in the TME.8–10 Recent studies have shown that recovery of CD28 expression is the key for responsiveness of the immune checkpoint blockade therapies.44 45 Loss of costimulatory molecules CD27 and CD28 is an important marker for senescent human T cells.8–10 15 This may partially explain the resistance and low success rates of current checkpoint blockade therapy in certain patients. Therefore, targeting T cell senescence in patients with cancer should be also an important checkpoint for tumor immunotherapy. Our current and previous studies have identified that both DNA damage and MAPK signaling are involved in the induction of T cell senescence mediated by Treg cells and tumor cells, which should be potential targets for prevention of T cell senescence in the TME.10 12 Recent studies have also shown that the PD-L1 expression in tumors is influenced by DNA repair and signaling.46 Furthermore, ATM inhibition can promote PD-L1 expression and increases the sensitivity of pancreatic tumors to anti-PD-L1 therapy, which results from the increased tumorous CD8+ T cells and established immune memory.47 Targeting DNA damage response through inhibition of PARP and CHK1 has also shown to increase PD-L1 expression and potentiate antitumor effect of PD-L1 blockade in lung cancer.36 In addition, PD-L1 blockade therapy in combination with inhibition of MAPK oncogenic signaling resulted in a synergistic and durable tumor regression in the mouse colon cancer models.48 Furthermore, studies from the phase 1 clinical trial have demonstrated that triple combination therapy with dabrafenib (BRAF inhibitor), trametinib (MEK inhibitor), and anti-PD-L1 antibody durvalumab in patients with BRAFV600-mutant melanoma can result in long-lasting responses in patients with advanced melanoma.49 In support of these studies from other groups, our current studies with different combinations further demonstrated that prevention of T cell senescence through the inhibitions of DNA damage and/or MAPK signaling can enhance antitumor efficacy mediated by checkpoint blockage of anti-PD-L1 and adoptive T cell immunotherapies.
In summary, we report that Treg cells and tumor cells can promote responder effector T cells to become senescent T cells, which is an important immune suppressive mechanism that occurred in the TME. This novel mechanism applies to both human and mouse immune systems. We further demonstrated that DNA damage and MAPK signaling pathways are the key molecular processes controlling T cell senescence mediated by mouse Treg cells and tumor cells. Our in vivo studies with different therapeutic combinations further explored the novel concept that targeting both effector T cell senescence and exhaustion within the TME is an effective and promising strategy for cancer immunotherapy.
Data availability statement
Data are available on reasonable request. Not applicable.
Ethics statements
Patient consent for publication
Ethics approval
Not applicable.
Acknowledgments
The authors would like to thank Joy Eslick and Sherri Koehm for cell sorting and flow cytometry analyses. We would like to thank Dr Jonathan Fisher at Saint Louis University for providing ATM knockout mice and Dr Rajeev Aurora at Saint Louis University for providing Foxp3eGFP mice.
References
Supplementary materials
Supplementary Data
This web only file has been produced by the BMJ Publishing Group from an electronic file supplied by the author(s) and has not been edited for content.
Footnotes
XL and FS contributed equally.
Contributors XL and GP designed research, analyzed data, prepared figures, and wrote the paper. XL, FS, DB, FM, YZ, YT, and ES performed in vitro studies with cell coculture system and in vivo experiments with mouse tumor models. GP is responsible for the overall content as the guarantor.
Funding This work was partially supported by grants from the Melanoma Research Alliance (MRA) (to GP) and the National Institutes of Health (NIH) (CA184379, CA242188, CA237149, and AG067441 to GP).
Competing interests None declared.
Provenance and peer review Not commissioned; externally peer reviewed.
Supplemental material This content has been supplied by the author(s). It has not been vetted by BMJ Publishing Group Limited (BMJ) and may not have been peer-reviewed. Any opinions or recommendations discussed are solely those of the author(s) and are not endorsed by BMJ. BMJ disclaims all liability and responsibility arising from any reliance placed on the content. Where the content includes any translated material, BMJ does not warrant the accuracy and reliability of the translations (including but not limited to local regulations, clinical guidelines, terminology, drug names and drug dosages), and is not responsible for any error and/or omissions arising from translation and adaptation or otherwise.