Article Text

Abstract
Background Cancer immune escape is a main obstacle in designing effective anticancer therapeutic approaches. Our work was aimed to explore the function of cullin 3 (CUL3) in ovarian cancer cell immune escape and chemosensitivity.
Method Gain and loss of function assays were conducted to investigate the interactions among CUL3, speckle type POZ protein (SPOP) and programmed death ligand-1 (PD-L1) as well as their effects on ovarian cell malignant phenotypes and chemosensitivity. A mouse model of xenografted ovarian cells was further established for in vivo substantiation.
Result Poorly-expressed CUL3 and SPOP were found in ovarian cancer. Overexpression of CUL3 reduced malignant features as well as immune escape of ovarian cancer cells but enhanced chemosensitivity. Functionally, CUL3 degraded PD-L1 protein by forming complex with SPOP. Overexpression of CUL3 inhibited tumor formation and enhanced chemosensitivity of ovarian cancer cells in mice by degrading PD-L1 protein.
Conclusion All in all, CUL3/SPOP formed a complex to promote PD-L1 degradation to inhibit ovarian cancer cell immune escape and increase chemosensitivity, offering a therapeutic target for ovarian cancer treatment.
- Tumor Biomarkers
- Genetic Markers
- Immunity, Cellular
Data availability statement
Data are available upon reasonable request. All data relevant to the study are included in the article or uploaded as supplementary information. The data sets used and/or analysed during the current study are available from the corresponding author on reasonable request.
This is an open access article distributed in accordance with the Creative Commons Attribution Non Commercial (CC BY-NC 4.0) license, which permits others to distribute, remix, adapt, build upon this work non-commercially, and license their derivative works on different terms, provided the original work is properly cited, appropriate credit is given, any changes made indicated, and the use is non-commercial. See http://creativecommons.org/licenses/by-nc/4.0/.
Statistics from Altmetric.com
WHAT IS ALREADY KNOWN ON THIS TOPIC
Immune system has been proved to be a crucial factor during cancer initiation and progression, including ovarian cancer.
WHAT THIS STUDY ADDS
Cullin 3/speckle type POZ protein formed a complex to promote programmed death ligand-1 degradation to inhibit ovarian cancer cell immune escape and increase chemosensitivity.
HOW THIS STUDY MIGHT AFFECT RESEARCH, PRACTICE OR POLICY
Our current study offers a therapeutic target for ovarian cancer treatment.
Background
Ovarian cancer ranks seventh among common cancer in women and eighth leading cause of cancer-related death, with 5-year survival rates less than 45%.1 It has been well-characterized that the co-evolution of neoplastic cells and the adjacent microenvironment share close correlation with ovarian cancer progression.2 Notably, most patients have ovarian cancer at advanced stage at the time of initial diagnosis, causing challenge for curing ovarian cancer.3 Patients with refractory malignancies show different reaction in chemosensitivity to cisplatin, including ovarian cancer, and how resistance is resolved remains unknown.4 In this regard, efforts are required to explore the mechanisms involved in ovarian progression for the development of novel therapeutic regimens for ovarian.
Cullin 3 (CUL3) gene encodes a key component of the E3 ubiquitin ligase complex and is capable of regulating proteasome degradation.5 A previous report has highlighted the critical role of CUL3 in diverse processes, including autophagy, differentiation, and tumorigenesis.6 It has been suggested that in ES2 and SKOV3 ovarian cancer cells, CUL3 depletion increased cisplatin induced cytotoxicity which could be antagonized by siCUL1.7 Furthermore, CUL3-regulated ubiquitination of Beclin 1 has been demonstrated to inhibit autophagy and induce tumor progression in ovarian cancer.8 More importantly, speckle type POZ protein (SPOP), a substrate recognition receptor for CUL3/RING type ubiquitin E3 complex, is capable of inhibiting proliferation and promoting apoptosis of human ovarian cancer cells by blockage of Hh signaling pathway, which provides a new approach for ovarian cancer treatment.9 10
Immune system has been proved to be a crucial factor during cancer initiation and progression, including ovarian cancer.11 Ovarian cancer is an immunogenic tumor and immunotherapy is intensively required by targeting on the immune checkpoints.12 13 Programmed death ligand-1 (PD-L1), an immune checkpoint, can inhibit the activation of T cells, resulting in the progression of tumors.14 As previously reported, inhibition of the programmed cell death protein-1 (PD-1)/PD-L1 pathway can suppress immune escape in glioma.15 Importantly, the therapeutic effect of PD-L1 on ovarian cancer has been proved.16 As recently described, through binding with CUL3, SNX6 is able to limit the interaction between the adaptor protein SPOP and CUL3, which subsequently reduces CUL3-mediated PD-L1 ubiquitination.17 Given the aforementioned evidence, we tried to assess the CUL3-regulated SPOP in immune escape of ovarian cancer cells in relation to PD-L1.
Materials and methods
Ethics statement
Animal experimentations were implemented under the ratification of the animal Ethics Committee of Shanghai Ninth People’s Hospital, School of Medicine, Shanghai Jiaotong University (SH9H-2020-A173-1).
Bioinformatics analysis
Ovarian cancer-related expression microarray data sets GSE12470, GSE52037 and GSE63885 were collected from the Gene Expression Omnibus database. GSE12470 data set contains 10 normal control samples and 43 ovarian cancer samples; GSE52037 data set contains 10 normal control samples and 10 ovarian cancer samples; while GSE63885 data set contains 101 ovarian cancer samples.
R language ‘limma’ package was employed to identify differentially expressed genes (DEGs) in GSE12470 and GSE52037 with the threshold of |log fold change| >1, p value<0.01. A total of 501 E3 ubiquitin ligase were obtained from iUUCD database.
The R language ‘survival’ package was applied for Kaplan-Meier survival analysis with p value<0.01 as the threshold. The tumor-immune system interactions (TISIDB) database was adopted to assay the correlation between genes and immune regulatory factors. The gene expression profiling interactive analysis (GEPIA) database was adopted to analyze the differential expression of target genes in ovarian cancer.
Study subjects
Cancer tissues (from the primary tumor of patients with ovarian cancer) of 30 patients with ovarian cancer (45–72 years old; average age: 54 years) undergoing surgery in Shanghai Ninth People’s Hospital, School of Medicine, Shanghai Jiaotong University and their adjacent normal tissue specimens (from non-tumor tissues of the same patient >5 cm from the outer edge of the tumor) were collected. All patients had not received chemotherapy, radiotherapy or other special treatments before surgery. The collected tissue was divided into two parts, one was immediately preserved in liquid nitrogen, and the other was made into paraffin-embedded section after fixation with 10% formaldehyde.
Cell culture, grouping and transfection
Human ovarian cancer cell line (A2780, SKOV3, and OVCAR3) and human renal epithelial cell line HEK293T were obtained from Nanjing Cobioer Biosciences (Jiangsu, China). Human normal ovarian epithelial cell line IOSE80 was obtained from Ningbo Mingzhou Biology (Ningbo, China). All cells were cultured in an RPMI1640 medium (Gibco, Carlsbad, California, USA) appended to 1% penicillin–streptomycin (Invitrogen, Carlsbad, California, USA) and 10% fetal bovine serum (FBS, Gibco), and placed at 37°C, 5% CO2 cell culture incubator. The growth medium was renewed every 3 days. On reaching 80% confluency, cells were subjected to 0.25% trypsin/EDTA digestion and passage.
Transfection was performed under 50% confluence. Ovarian cancer cells were treated with oe-NC, sh-NC, oe-CUL3, sh-CUL3, sh-SPOP, sh-CTRL, sh-PD-L1, DMSO, MG132, MLN4924, or cisplatin. After transfection for 36 hours, the cells were incubated with CHX (20 µg/mL, SC0353, Beyotime, Jiangsu, China) for 0 hour, 2 hours, 4 hours, 6 hours, and 8 hours.
After transfection for 48 hours, the cells were cultured in a medium containing puromycin (1 µg/mL, A1113803, Gibco; Thermo Fisher Scientific, Waltham, Massachusetts, USA) to select stable transfected cell lines. The cells were collected when they no longer died in the puromycin-containing medium, and the overexpression or knockdown efficiency was quantified by reverse transcription quantitative PCR (RT-qPCR) or western blot analysis. Cisplatin was added at a concentration of 10 µg/mL (M2223, AbMole). If MG132 or MLN4924 needed, MG132 (10 µm, S1748, Beyotime) or MLN4924 (1 µm, A11260, ADOOQ) was used to treat the cells for 12 hours before collection.
T-cell isolation and culture
Separation of human peripheral blood lymphocytes: 5 mL of fresh anticoagulant blood was carefully aspirated and added with the mixture of 5 mL of lymphocyte separation solution (17-1440-02, GE) and 5 mL of phosphate buffered saline (PBS), followed by centrifugation at 1500×g for 30 min in a horizontal centrifugation. After that, the solution in the centrifuge tube was divided into four layers from top to bottom. The second layer was ring-shaped milky white lymphocytes which were aspirated and washed twice with two times the volume of PBS (centrifuged at 1200×g for 10 min with the supernatant discarded), the resulting precipitate was monocytes.
Cultivation of human T lymphocytes: the crude monocytes were cultured in a cell incubator for 24 hours, and the medium containing lymphocytes was resuspended in PBS, incubated with anti-CD3 (1 µg/mL, 11365D, Invitrogen) for 60 min, and with immunomagnetic beads FlowComp Dynabeads (11365D, Invitrogen) for 30 min. The magnetic bead sorting rack was applied to sort CD3+ T cells. The sorted cells were placed in RPMI1640 complete medium appended to 10% FBS, and anti-CD3 (2 µg/mL, 13-0289-82, eBioscience) and anti-CD28 (2 µg/mL, 46-0037-42, eBioscience) were added to stimulate the proliferation of T lymphocytes. After 48 hours, the activated and proliferated human peripheral T lymphocytes were aggregated into spheroids. The cell pellet was harvested by centrifugation and cultured with 1640 complete medium appended to anti-CD3 and anti-CD28 to expand human T lymphocytes for subsequent experimentations.
Co-culture of T cells and ovarian cancer cells
Transwell co-cultivation experiment was carried out in a Transwell well plate with a 0.4 µm pore size chamber. The cells were resuspended in RPMI-1640 (Gibco) medium replenishing 10% FBS. Ovarian cancer cells (2×10⁵/well) grow in the outer chamber of a 24-well plate, and the isolated CD3+ T cells (6×10⁵/well) were added into the Transwell chamber. The control was set with CD3+ T cells in the inner chamber and no ovarian cancer cells in the outer. The cells were cultured in a 37°C 5% CO2 incubator for 16 hours. After that, the plate was centrifuged (400×g, 5 min) and the cell supernatant was harvested for ELISA.
Lactate dehydrogenase release experiment
The cell supernatant in the co-culture system was aspirated, and 150 µL of lactate dehydrogenase (LDH) release reagent (LDH kit, C0016, Beyotime) diluted 10 times with PBS was added for incubation for 1 hour. Subsequently, the cells were centrifuged at 400 g for 5 min. About 120 µL of supernatant from each well was added to the corresponding well of a new 96-well plate for detection. Each well was added with 60 µL LDH detection working solution for 30 min of incubation in the dark at ambient temperature. The absorbance was quantified at 490 nm employing the microplate reader (M1000 PRO, Tecan). T-cell toxicity = (absorbance of processed sample – absorbance of control well) / (absorbance of cell maximum enzyme activity − absorbance of control well) × 100.
RT-qPCR
Trizol kit (Invitrogen) was selected for total RNA extraction. The quality and concentration of RNA was tested by UV-Vis spectrophotometry (ND-1000, NanoDrop).
For measuring messenger RNA (mRNA) expression, reverse transcription was processed using PrimeScript RT-qPCR kit (TaKaRa, Dalian, China). SYBR Premix Ex TaqTM (TaKaRa) was adopted for RT-qPCR on the LightCycler 480 system (Roche Diagnostics, Pleasanton, California, USA). GAPDH was used as a normalizer for mRNA. The primers (online supplemental table S1) were designed and provided by Shanghai General Biotechnology. The 2–ΔΔCt method was adopted to quantify relative expression levels of target genes.
Supplemental material
Co-immunoprecipitation
Cells were lysed by EBC buffer (50 mM Tris pH 7.5, 120 mM NaCl, and 0.5% NP-40) containing protease inhibitor (Cocktail, 11697498001, Sigma) and phosphatase inhibitor (Calbiochem, P8139, Sigma) on ice for 10 min and centrifuged at 15,000×g at 4°C for 15 min with the supernatant collected. A total of 20 µL sample was selected as input, and the remaining was subjected to reaction with 10 µL Protein G magnetic beads, followed by overnight incubation with 1 µL anti-HA (sc-7392, 1/1000; Santa Cruz) or anti-PD-L1 (Cat # NBP1-76769, 1/1000; Novus Biologicals) at 4°C. After centrifugation at 5000×g for 5 min at 4°C, the supernatant was discarded, and the recovered complex was washed with NETN buffer (20 mM Tris, pH 8.0, 100 mM NaCl, 1 mM EDTA and 0.5% NP-40) four times, separated by SDS-PAGE and subjected to subsequent western blot analysis with corresponding antibodies.
Western blot analysis
The protein extracts were subjected to electrophoresis separation, and then the separated protein was electrotransferred to polyvinylidene fluoride membrane which was blocked with 5% bovine serum albumin (BSA) at ambient temperature for 1 hour. Then, the membrane was incubated with diluted primary antibodies: CUL3 (10450, 1/1000; Cell Signaling Technology (CST)), PD-L1 (NBP1-76769, 1/1000; Novus Biologicals), SPOP (16 750–1-AP, 1/1000; Proteintech), Flag-tag (MA1-91878, 1/1000; Sigma), GAPDH (sc-47724, 1/2000; Santa Cruz, internal reference), and HA-tag (sc-7392, 1/1000; Santa Cruz) overnight at 4°C as well as with anti-Mouse-HRP secondary antibody (7076, 1/5000; CST) or anti-Rabbit-HRP secondary antibody (7074, 1/5000; CST) for 1 hour at ambient temperature. Subsequently, the membrane was developed with ECL working solution (EMD Millipore). ImageJ analysis software was run to quantify the gray levels of each group of bands.
Cell counting kit-8
The cell viability was quantified by referring to the instructions of the cell counting kit-8 kit (SB-CCK8S, Share-Bio, China). A microplate reader (M1000 PRO, Tecan) was adopted to evaluate the absorbance at 450 nm.
ELISA
T-cell supernatant in the co-culture system was collected, and the total protein was quantified using the BCA Kit (Pierce, Rockford). In the light of ELISA kit instruction, levels of interleukin (IL)-2 (D2050, R&D systems) and interferon (IFN)-γ (DIF50C, R&D systems) were determined. A microplate reader (Molecular Devices, California, USA) was adopted to evaluate the optical density (OD) value at 450 nm to quantify the levels of the above-mentioned cytokines.
Colony formation experiment
The single cell suspension was seeded in a 6-well plate at 100 cells/well. The cells were cultured for 2 weeks to form colonies, the supernatant was discarded, and 500 µL of 4% paraformaldehyde was added to each well for fixation. Then, 500 µL of 0.5% crystal violet solution was added into each well for 30 min of staining. With the removal of supernatant, the stained 6-well plate was washed with PBS, air-dried, counted, and photographed with the number of clones formed in each well calculated (number of cells >50 was regarded as a clone).
Immunohistochemistry
Tissue specimens were fixed with 4% paraformaldehyde for 12 hours, and then made into paraffin-embedded sections with a thickness of 3 µm. The sections were subjected to antigen retrieval in 0.01M citrate buffer for 15–20 min, followed by immunostaining with 50 µL primary antibodies of CUL3 (ab245410, 1/100, Abcam, Cambridge, Massachusetts, USA), SPOP (16 750–1-AP, 1/200, Proteintech), ki-67 (ab15580, 1/100, Abcam) for 1 hour and with secondary antibodies goat anti-rabbit IgG (ab6721, 1/100, Abcam) and goat anti-mouse IgG (ab205719, 1/100; Abcam) at 37°C for 20 min. The sections were treated with streptavidin–peroxidase at 37°C for 30 min, colored by DAB (ST033, WHIGA, Guangzhou, Guangdong) for 5–10 min, counterstained with hematoxylin for 2 min, sealed with neutral resin, observed and counted under an upright microscope (BX63, Olympus, Japan). Five high-powered field of views were selected from each section for observation. Image-Pro Plus V.6.0 software was run for evaluating the average OD of the picture.
Construction of mouse subcutaneous xenograft tumor model
Six-week-old female NSG mice were purchased from Beijing Charles River Laboratory Animal Technology (Beijing, China) and each mouse was raised in an SPF (specific-pathogen-free) animal laboratory in separate cages. The laboratory humidity was 60%~65% and the temperature was 22~25℃. The experiment was started after 1 week of acclimation.
To establish a subcutaneous xenograft model of ovarian cancer, ovarian cancer cells SKOV3 (1.0×10⁶) expressing oe-CUL3, sh-PD-L1, or sh-CUL3 were subcutaneously injected into 6-week-old NSG mice, followed by treatment with or without cisplatin. Mice injected with PBS were used as the control. For the cisplatin treatment group, mice were intraperitoneally injected with 5 mg/kg cisplatin (purchased from Shandong Qilu Pharmaceutical Factory, Shandong, China). From the first day of modeling, mice were injected one time a week for a total of three doses. Three weeks later, the mice were sacrificed, the tumors were weighed, and the tumor tissues were taken for subsequent immunohistochemistry and flow cytometry. Another four groups of mice injected with PBS or cells expressing oe-CUL3 and sh-PD-L1 were taken for survival analysis. After ovarian cancer cell injection (day 6), human hematopoietic stem cells were surgically transplanted into NSG mice to produce T cells, when the tumor could be clearly observed.
Flow cytometry
Detection of T-cell infiltration: Single cells derived from tumor tissues were collected. The tissues were cut into small pieces and digested by 5 mL of 2 mg/mL collagenase (17018029, Sigma) at 37°C for 1 hour. After the cells were filtered through a 70 µm filter, the cell pellet was suspended by the red blood cell lysate (C3702, Beyotime) for 5 min, centrifuged, collected, and resuspended in 0.5 mL fixation buffer (420801, BioLegend) for 20 min. The cells were then washed with 1×PBS containing 2% BSA, centrifuged twice, permeabilized, and suspended in intracellular staining rupture buffer (421002, BioLegend). Afterwards, the cells were stained with CD4 (1/100, 100510, BioLegend), CD8 (1/100, 100708, BioLegend), anti-IFN-γ (1/100, 505808, BioLegend), anti-IL-2 (1/100, ab243650, Abcam) or ki-67 (1/100, ab16667, Abcam) antibodies to assess the activity of T cells. The cells were incubated with the corresponding antibodies for 30 min at ambient temperature, and washed with 1×PBS containing 2% BSA and analyzed by flow cytometry analysis.
Detection of ovarian cancer cell apoptosis: the collected ovarian cancer cells were stained with Annexin V-FITC (Annexin V-fluorescein isothiocyanate) and PI(propidium iodide) using the apoptosis kit (APOAF-20TST, Sigma) at 4°C for 10 min. The apoptosis rate (105 cells/sample) was tested on the CytoFlex flow cytometer (Beckman Coulter). FlowJo software (V.7.0; FlowJo) was adopted for data analysis.
Terminal deoxyribonucleotidyl transferase-mediated dUTP-digoxigenin nick end labeling
Mouse ovarian cancer tissue was fixed with 4% paraformaldehyde for 15 min, treated with 0.1% Triton-X 100 for 3 min and stained with terminal deoxyribonucleotidyl transferase-mediated dUTP-digoxigenin nick end labeling (TUNEL) staining kit (C1091, Beyotime, China). The sample was then incubated with 50 µl streptavidin-HRP working solution for 30 min, and treated with 0.5 mL DAB chromogenic solution at ambient temperature for 5 min. Then, the samples were counterstained with DAPI (10 µg/mL, C1025, Beyotime) for 10 min. Images were observed with a confocal microscope (FV1000, OLYMPUS), and the proportion of apoptosis in each group was calculated using the Image-Pro Plus V.6.0 software.
Statistical analysis
All experiments were conducted independently for at least three times, and data were summarized as mean±SD. Paired t-test or independent-sample t-test was applied for analyzing the difference between data. One-way analysis of variance (ANOVA) was adopted to compare data among multiple groups, followed by Tukey’s post hoc. For comparison between groups at different time points, two-way ANOVA or repeated measures ANOVA was used, and Bonferroni was used for post hoc tests. The Kaplan-Meier method was applied to calculate the survival rate of the patients, and the log-rank test was selected for univariate analysis. All statistical analyses were carried out with the help of GraphPad Prism V.5.0. Moreover, p<0.05 indicated statistically significant difference.
Results
CUL3 is poorly expressed in ovarian cancer, which is related to poor prognosis of patients with ovarian cancer
E3 ubiquitin ligase played an important role in carcinogenic transformation and cancer treatment.18 In order to determine the E3 ubiquitin ligase that may cause or inhibit ovarian cancer, we first screened out 5082 and 1665 DEGs from the GSE12470 and GSE52037 data sets, respectively (figure 1A,B). After intersection of these DEGs with 501 E3 ubiquitin ligases obtained from the iUUCD database, 20 differentially expressed E3 ubiquitin ligases were finally identified (figure 1C). Further analysis of the survival data of patients with ovarian cancer in the GSE63885 data set found that only CUL3 was a prognostic factor for ovarian cancer, and its low expression was associated with poor prognosis of patients with ovarian cancer (figure 1D, online supplemental figure 1). In addition, analysis of the GSE12470 and GSE52037 data sets both showed that CUL3 was lowly expressed in ovarian cancer samples (figure 1E,F).
Supplemental material
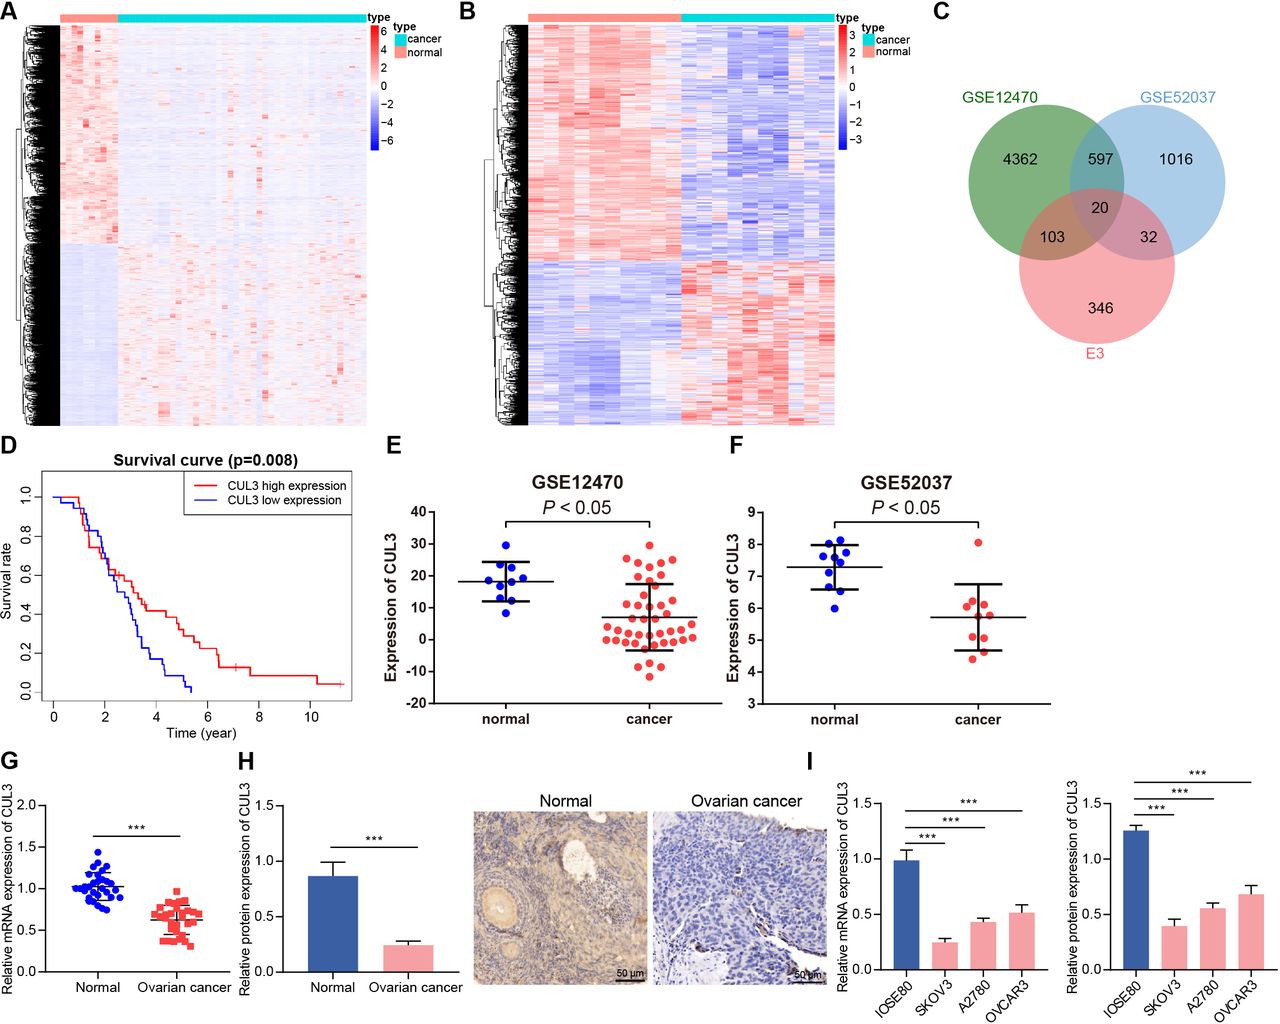
Decreased CUL3 expression in ovarian cancer. (A) Heatmap of DEGs between normal samples (normal group, n=10) and ovarian cancer samples (cancer group, n=43) in GSE12470. (B) The heat map of DEGs between normal samples (normal group, n=10) and ovarian cancer samples (cancer group, n=10) in GSE52037. (C) Venn diagram of intersection of E3 ubiquitin ligases from iUUCD database and GSE12470 and GSE52037 data sets. (D) The prognosis of CUL3 in the GSE63885 data set (n=101). (E) The expression of CUL3 in the GSE12470 data set (normal group, n=10; cancer group, n=43). (F) The expression of CUL3 in the GSE52037 data set (normal group, n=10; cancer group, n=10). (G) RT-qPCR detection of CUL3 mRNA expression in adjacent normal tissues and ovarian cancer tissues (n=30). (H) Immunohistochemistry of CUL3 protein expression in adjacent normal tissues and ovarian cancer tissues (scale bar: 50 µm). (I) Detection of expression level of CUL3 in human ovarian cancer cell lines (A2780, SKOV3, OVCAR3) and human normal ovarian epithelial cell lines IOSE80 by RT-qPCR (left) and western blot analysis (right). CUL3, cullin 3; DEG, differentially expressed gene; mRNA, messenger RNA; RT-qPCR, reverse transcription quantitative PCR. ***p<0.001. All experiments were repeated three times.
We found that CUL3 was lowly expressed in clinical samples from patients with ovarian cancer (figure 1G,H). Similar downregulation of CUL3 was detected in A2780, SKOV3, and OVCAR3 cells as compared with that in IOSE80 cells, and the CUL3 expression in SKOV3 and A2780 cells was significantly lower (figure 1I). Therefore, SKOV3 and A2780 cell lines were selected for subsequent experimentations.
Conclusively, CUL3 was downregulated in ovarian cancer samples, and CUL3 may be related to the poor prognosis of patients with ovarian cancer.
CUL3 degrades PD-L1 protein through ubiquitination in ovarian cancer cells
Protein ubiquitination has become an important regulatory mechanism of PD-L1 protein.19 We analyzed the correlation between CUL3 and PD-L1 (CD274) mRNA levels through the TISIDB database, and the results showed a negative correlation between CUL3 and PD-L1 expression in ovarian cancer (figure 2A). Therefore, we speculate that CUL3 may regulate PD-L1 expression in ovarian cancer cells. For validation, we first used RT-qPCR and western blot to detect changes in the expression of CUL3 and PD-L1 in cells following different interventions. The results depicted that the protein expression of PD-L1 was diminished after CUL3 was overexpressed in SKOV3 and A2780 cells, while no significant change found in mRNA level (figure 2B,C). However, there was no significant change in CUL3 protein level after sh-PD-L1 treatment (figure 2D).
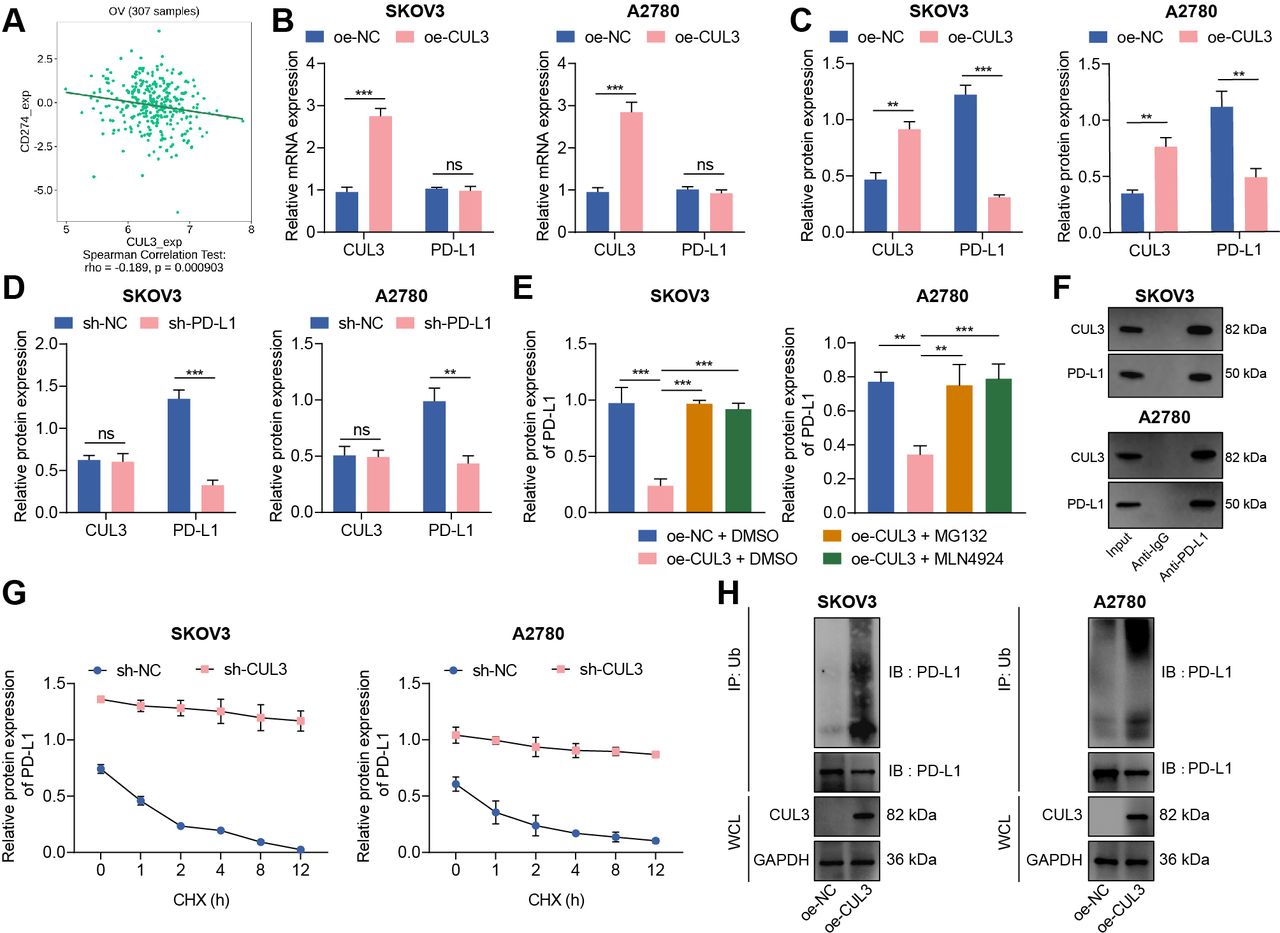
Reduced CUL3 stabilized PD-L1 protein expression in ovarian cancer cells. (A) The correlation between CUL3 and PD-L1 (CD274) expression in ovarian cancer (n=307) was analyzed by tumor-immune system interactions database. (B) Reverse transcription quantitative PCR detection of CUL3 and PD-L1 mRNA levels after CUL3 overexpression in SKOV3 and A2780 cells. (C) Western blot detection of CUL3 and PD-L1 protein levels in SKOV3 and A2780 cells after CUL3 overexpression. (D) Western blot detection of CUL3 and PD-L1 protein levels in SKOV3 and A2780 cells after CUL3 knockdown. (E) Western blot detection of the effect of overexpressed CUL3 and MG132 and MLN4924 inhibitors on PD-L1 protein in SKOV3 and A2780 cells. (F) Co-IP experiment to detect the interaction between CUL3 and PD-L1 proteins in SKOV3 and A2780 cells. (G) Western blot was used to detect the effect of silencing CUL3 and CHX inhibitors on PD-L1 protein level in SKOV3 and A2780 cells. (H) Co-IP experiment to detect the interaction between CUL3 and PD-L1 ubiquitination protein after overexpression of CUL3 in SKOV3 and A2780 cells. **p<0.01, ***p<0.001, ns p>0.05. All experiments were repeated three times. Co-IP, co-immunoprecipitation; CUL3, cullin 3; mRNA, messenger RNA; PD-L1, programmed death ligand-1.
To further confirm the specific way that CUL3 regulates PD-L1 expression, we treated ovarian cancer cell SKOV3 and A2780 with proteasome inhibitor MG132 and ubiquitinated ligase inhibitor MLN4924. Western blot showed that PD-L1 protein abundance decreased after overexpression of CUL3, while PD-L1 protein abundance was effectively enhanced after treatment of MG132 and MLN4924 in cells overexpressing CUL3 (figure 2E). The above results indicated that CUL3 may regulate PD-L1 protein expression through post-transcriptional ubiquitination.
The co-immunoprecipitation (Co-IP) experiment further confirmed that in SKOV3 and A2780 cells, there were interaction between CUL3 and PD-L1 proteins (figure 2F). Therefore, we added CHX, a protein synthesis inhibitor, to SKOV3 and A2780 cells expressing sh-CUL3. Western blot detection showed that with the increase of time, PD-L1 was significantly degraded after CHX treatment; and after knocking down CUL3, the stability of PD-L1 protein was enhanced (figure 2G). In addition, the Co-IP experiment also confirmed that overexpression of CUL3 could enhance the ubiquitination of PD-L1 protein (figure 2H).
Thus, CUL3 could degrade PD-L1 protein through the ubiquitination-proteasome pathway, while decreased CUL3 could stabilize PD-L1 protein expression.
Overexpression of CUL3 inhibits the stability of PD-L1 protein to prevent the immune escape function of ovarian cancer cells
The significance of PD-L1 in immune escape of ovarian cancer has been proved.20 To explore the regulatory mechanism of PD-L1 in the microenvironment of ovarian cancer, we tested the effect of CUL3 on SKOV3 and A2780 cells themselves and on the immune function mediated by T cells after ubiquitination degradation of PD-L1 by CUL3. As reflected by RT-qPCR and western blot, the mRNA and protein levels of CUL3 in cells treated with oe-CUL3 were up-regulated, but the mRNA level of PD-L1 was not affected, and the protein level of PD-L1 was reduced, while oe-PD-L1 treatment reduced mRNA and protein expression of PD-L1 but exerted no alteration in mRNA and protein expression of CUL3. Relative to oe-CUL3 treatment, further addition of oe-PD-L1 exerted no function in the mRNA and protein expression of CUL3 but elevated the protein expression of PD-L1 (figure 3A,B).
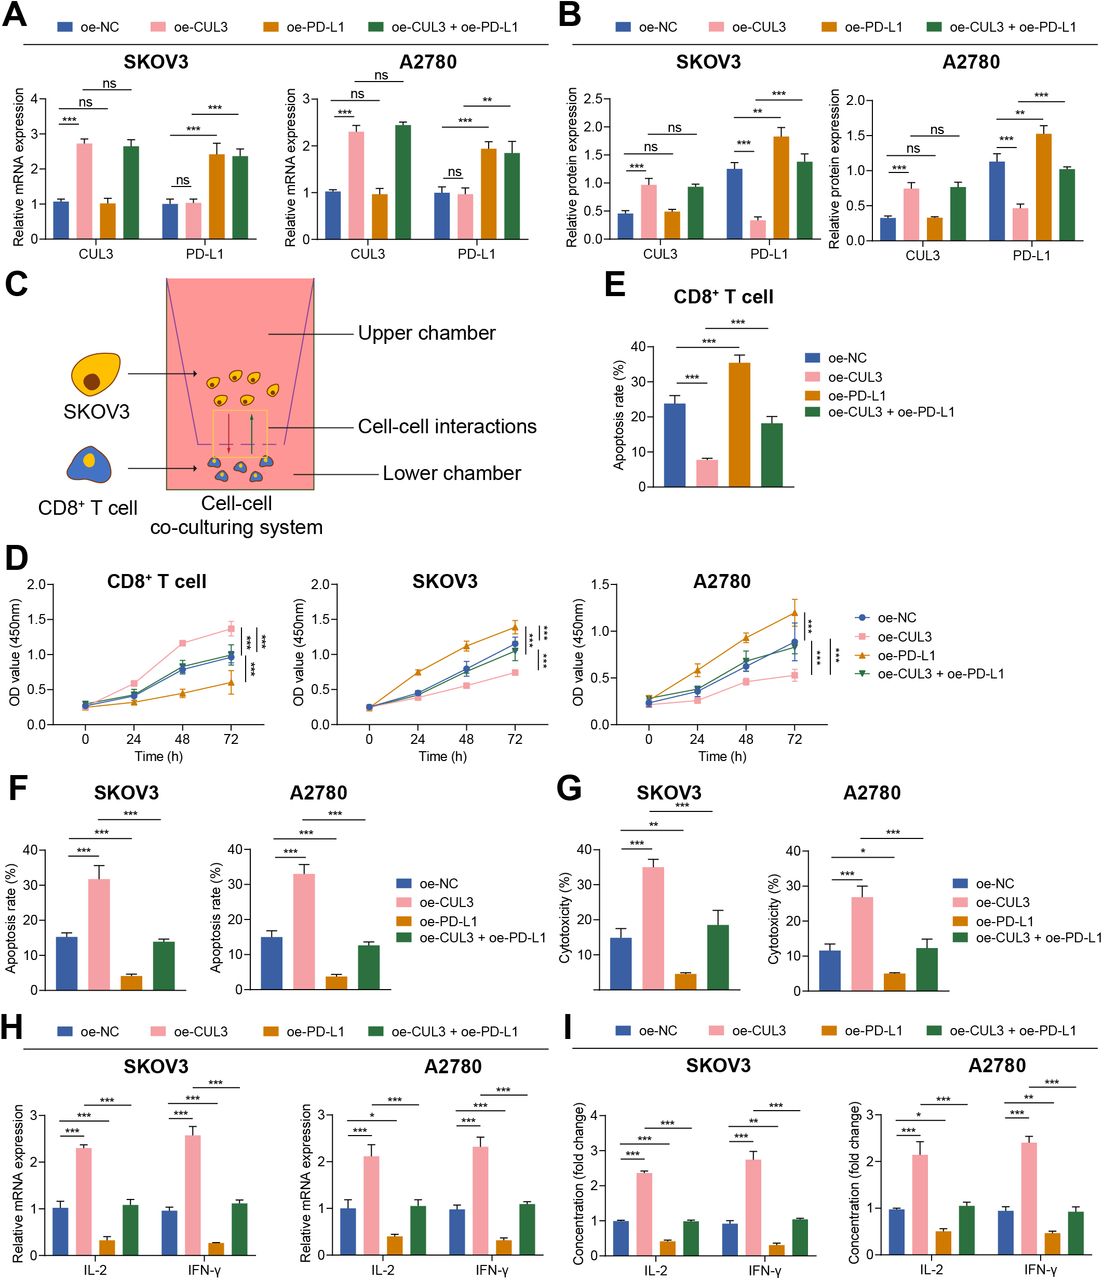
Overexpression of CUL3 regulated the effect of PD-L1 expression on T cells and ovarian cancer cells. (A) RT-qPCR detection of CUL3 and PD-L1 mRNA levels in SKOV3 and A2780 cells after overexpression of CUL3 or PD-L1. (B) Western blot analysis detection of CUL3 and PD-L1 protein levels in SKOV3 and A2780 cells after overexpression of CUL3 or PD-L1. (C) Transwell for construction of a T cell, SKOV3 and A2780 cell co-culture system. (D) Detection of the proliferation of T cells (left) and SKOV3 (middle) and A2780 cells (right) in the co-culture system by CCK8. (E) Detection of the apoptosis rate of T cells in the co-culture system by flow cytometry. (F) Flow cytometry to detect the apoptosis rate of SKOV3 and A2780 cells in the co-culture system. (G) Lactate dehydrogenase release experiment detected the killing effect of T cells on SKOV3 and A2780 cells. (H) Detection of the changes in the mRNA levels of IL-2 and IFN-γ in each group of T cells in the co-culture system by RT-qPCR. (I) Detection of the changes in the protein levels of IL-2 and IFN-γ in the supernatant in the co-culture system by ELISA. **p<0.01, ***p<0.001. All experiments were repeated three times. CUL3, cullin 3; IFN, interferon; IL, interleukin; mRNA, messenger RNA; PD-L1, programmed death ligand-1; RT-qPCR, reverse transcription quantitative PCR.
Studies have shown that CD8+ T-cell apoptosis can lead to immune escape.21 22 Therefore, we co-cultured the activated effector T cells with SKOV3 and A2780 cells (figure 3C). Functional assays depicted that the proliferation ability of T cells was enhanced and apoptosis was reduced on oe-CUL3 treatment while the proliferation ability of SKOV3 and A2780 cells was weakened and apoptosis was increased; while oe-PD-L1 treatment caused opposing trends. However, relative to oe-CUL3 treatment alone, the above findings were reversed after further addition of oe-PD-L1 (figure 3D–F, online supplemental figure S2A,B).
Supplemental material
The results of LDH release experiments confirmed that T-cell toxicity was enhanced in cells treated with oe-CUL3, and contrary finding was witnessed following oe-PD-L1 treatment; while relative to oe-CUL3 treatment alone, further treatment of oe-PD-L1 led to reduced T-cell toxicity (figure 3G). RT-qPCR and ELISA experiments further found that the expression of the immune-related factors IL-2 and IFN-γ in the supernatant of oe-CUL3-treated cells were increased, but those were diminished following oe-PD-L1 treatment. In comparison with oe-CUL3-treated cells, further oe-PD-L1 treatment caused diminished IL-2 and IFN-γ levels (figure 3H,I).
The above findings suggested that overexpression of CUL3 inhibited the stability of PD-L1 protein, thereby preventing the immune escape of ovarian cancer cells.
In ovarian cancer cells, CUL3 promotes PD-L1 ubiquitination and degradation by forming a complex with SPOP
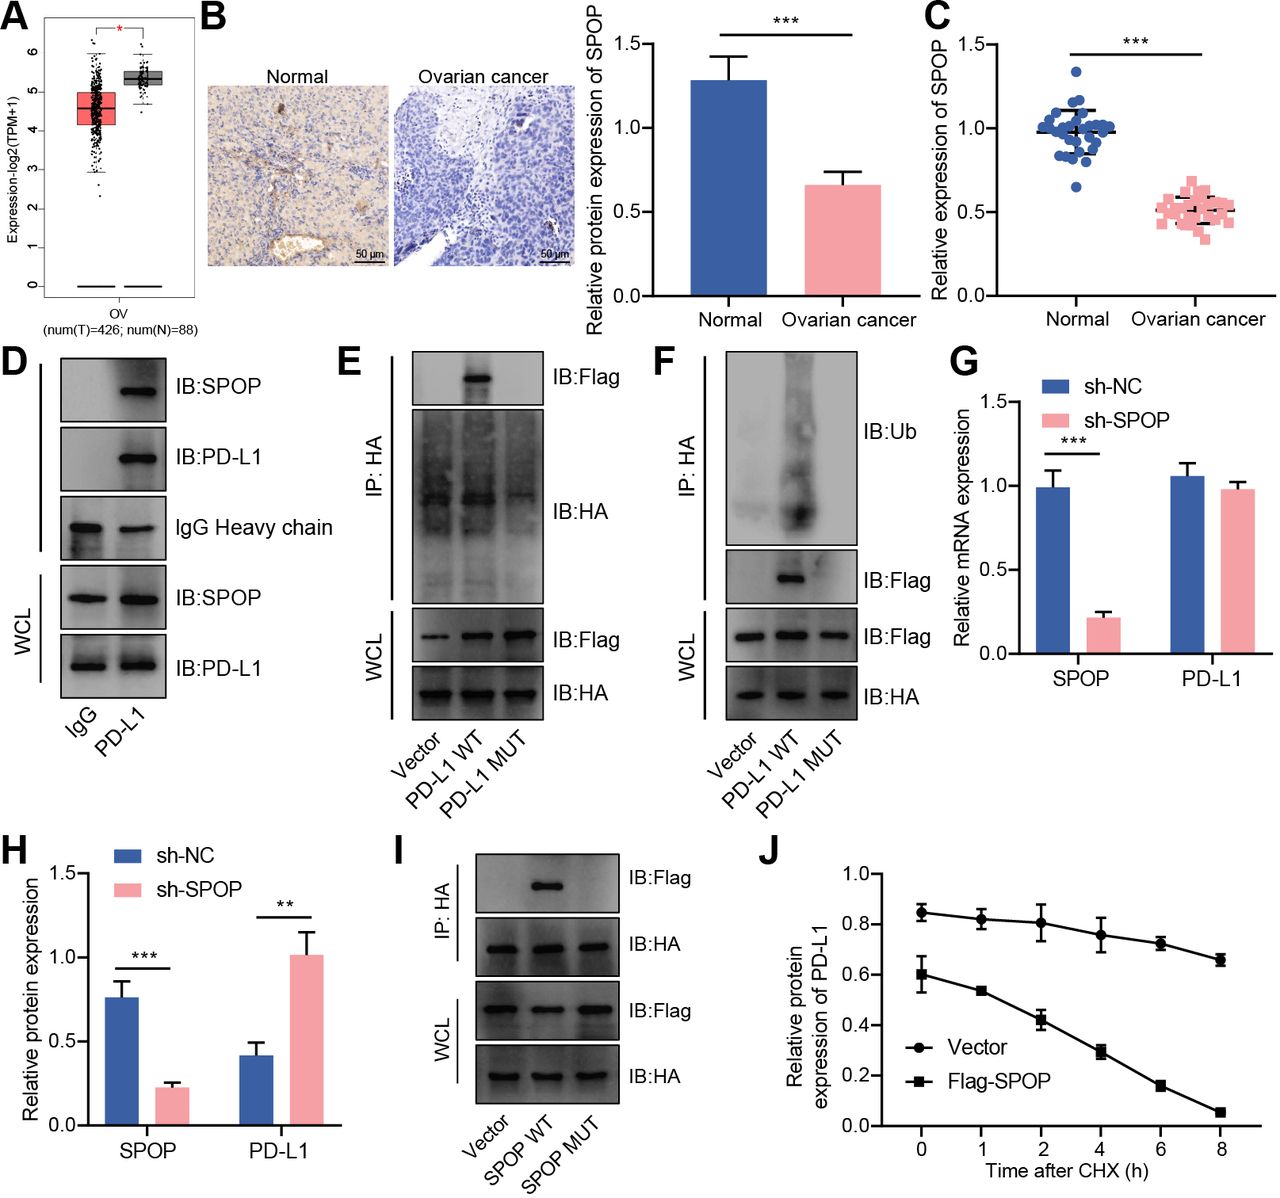
Ubiquitin ligase mainly recognized downstream substrates through adaptor molecules. In tumor cells, CUL3 recruited the MATH domain of SPOP to recognize the C-terminus of PD-L1 and promote PD-L1 ubiquitination degradation.19 In this study, an analysis of the GEPIA database found that SPOP expression was reduced in ovarian cancer samples (figure 4A). As confirmed by RT-qPCR and immunohistochemistry, SPOP was decreased in ovarian cancer tissues (figure 4B,C). Therefore, we speculated that the CUL3/SPOP complex (E3 ubiquitin ligase complex) may also modulate the expression of PD-L1 through ubiquitination modification, thereby mediating the immune escape of ovarian cancer.

CUL3 promoted PD-L1 ubiquitination and degradation by forming a complex with SPOP in ovarian cancer cells. (A) Analysis of the expression of SPOP in ovarian cancer (normal group, n=38; cancer group, n=426) by gene expression profiling interactive analysis database. (B) Immunohistochemistry of SPOP protein expression in ovarian cancer tissue. (C) Detection of the mRNA expression of SPOP in adjacent normal tissues and ovarian cancer tissues (n=30) by RT-qPCR. (D) Detection of the interaction between PD-L1 and SPOP in SKOV3 cells by Co-IP experiment. (E) Co-IP experiment detected the interaction relationship between PD-L1 and SPOP in each group of SKOV3 cells. (F) Co-IP experiment detected the interaction relationship between SPOP and PD-L1. (G) RT-qPCR detection of the mRNA levels of SPOP and PD-L1 in SKOV3 cells after knocking down SPOP. (H) Western blot detection of the protein levels of SPOP and PD-L1 in SKOV3 cells after knocking down SPOP. (I) Co-IP experiment detected the interaction between PD-L1 and SPOP in SKOV3 cells after mutation of the binding site of SPOP and PD-L1. (J) Western blot detection of the protein degradation rate of PD-L1 in SKOV3 cells transfected with Flag-SPOP. **p<0.01, ***p<0.001. All experiment was repeated three times. Co-IP, co-immunoprecipitation; CUL3, cullin 3; mRNA, messenger RNA, PD-L1, programmed death ligand-1; RT-qPCR, reverse transcription quantitative PCR; SPOP, speckle type POZ protein.
From IP experiment, we found an interaction between PD-L1 and SPOP in SKOV3 cells (figure 4D). Next, we transferred the HA-labeled PD-L1 vector (WT) or the HA-labeled PD-L1 vector that does not contain the binding site of PD-L1 and SPOP (ie, the C-terminal of PD-L1, ▲C-tail) into SKOV3 cells (online supplemental figure S3A,B). At the same time, we transferred the SPOP overexpression plasmid with Flag tag (Flag-SPOP) into SKOV3 cell, followed by addition of MG132. Co-IP experiment further found that under normal circumstances, ubiquitination was seen in PD-L1 protein; If the binding site of PD-L1 protein was deleted, the binding of PD-L1 and SPOP protein was not detected, and PD-L1 ubiquitination level was reduced (figure 4E,F). This result indicated that SPOP was ubiquitinated by binding to the C-terminus of PD-L1 in ovarian cancer cells.
Supplemental material
We further knocked down SPOP and found that knocking down SPOP did not affect the mRNA expression of PD-L1, but the stability of PD-L1 protein was increased (figure 4G,H). In addition, HA-labeled SPOP vector (SPOP-WT) or SPOP vector without PD-L1 and SPOP binding site (SPOP-MUT) were transfected into SKOV3 cells which were further transfected with Flag-labeled PD-L1 overexpression plasmid (Flag-PD-L1). The results of Co-IP showed that after mutating the SPOP binding site, no binding of PD-L1 and SPOP protein was detected (figure 4I). On the basis of overexpression of PD-L1, Flag-SPOP was transfected, and western blot results depicted that the degradation of PD-L1 protein was accelerated within 0–8 hours on oe-SPOP treatment (figure 4J).
Therefore, in ovarian cancer cells, CUL3 could form an E3 ubiquitin ligase complex with SPOP, and degrade PD-L1 protein through the ubiquitination-proteasome pathway.
Overexpression of CUL3 degrades PD-L1 protein through ubiquitination to inhibit tumorigenesis of ovarian cancer cells in mice
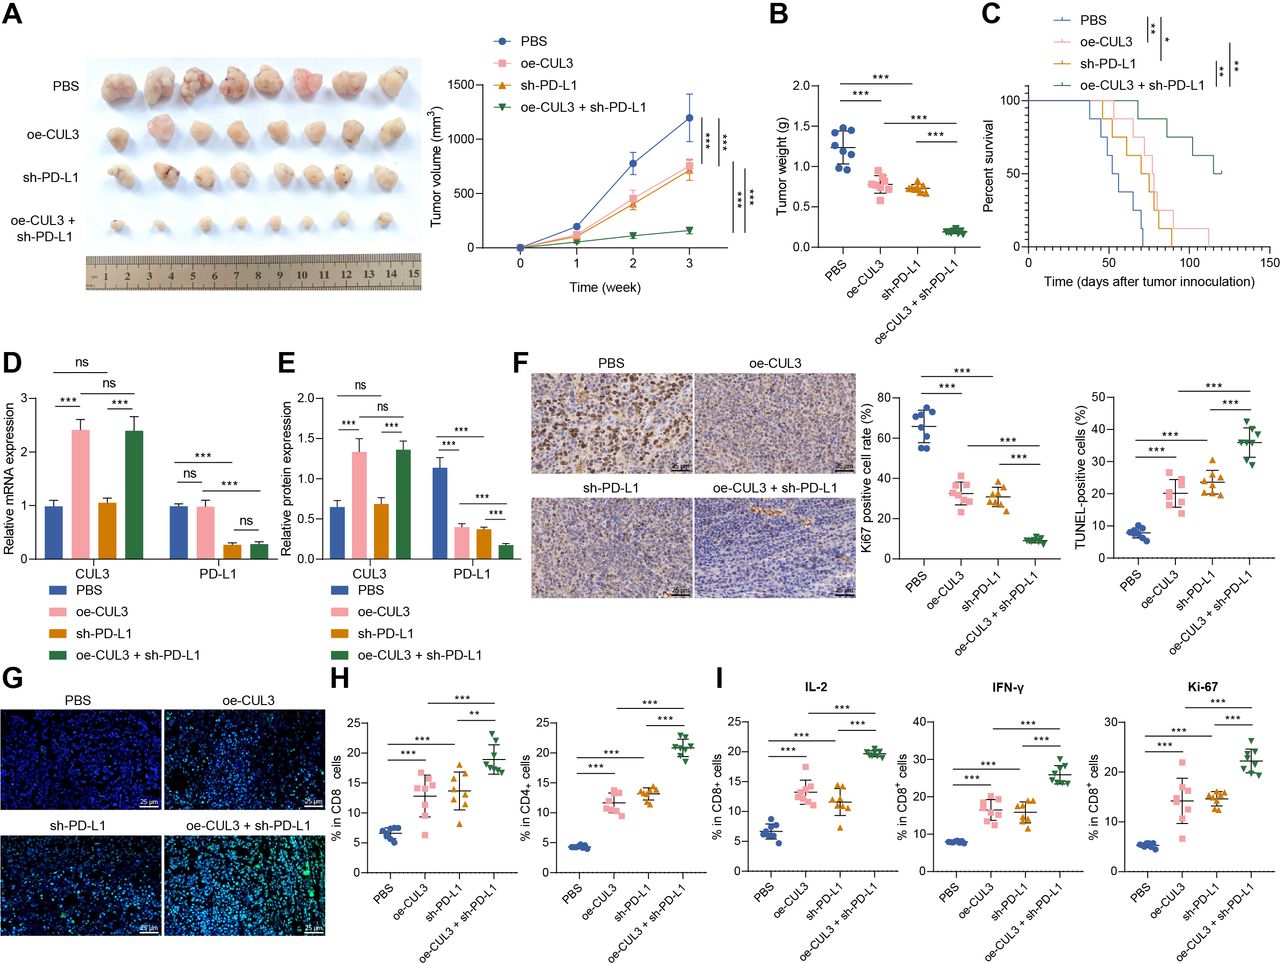
Finally, we explored the role of CUL3/PD-L1 in vivo by constructing a subcutaneous xenograft model of ovarian cancer in mice. We found that overexpression of CUL3 or knockdown of PD-L1 inhibited tumor growth and improved overall survival rate of mice. Compared with the oe-CUL3 treatment or sh-PD-L1 treatment, simultaneous overexpressing CUL3 and knocking down PD-L1 further inhibited tumor growth, and improved the overall survival rate (figure 5A–C).

Overexpression of CUL3 or knockdown of PD-L1 inhibited tumor growth in tumor-bearing mice. Tumor-bearing mice were injected with cells expressing oe-CUL3 and/or sh-PD-L1. (A) Representative images and growth curves of tumors in tumor-bearing mice. (B) Changes in tumor weight of tumor-bearing mice in each group. (C) Survival rate of tumor-bearing mice in each group. (D) Reverse transcription quantitative PCR detection of CUL3 and PD-Ll messenger RNA levels in ovarian cancer tissues of tumor-bearing mice. (E) Western blot detection of CUL3 and PD-L1 protein levels in ovarian cancer tissues of tumor-bearing mice. (F) Immunohistochemistry of proportion of Ki67 positive cells in ovarian cancer tissues of tumor-bearing mice (scale bar: 25 µm). (G) TUNEL staining was used to detect the changes in cell apoptosis in ovarian cancer tissues of each group of tumor-bearing mice (scale bar: 25 µm). (H) Flow cytometry was used to detect the proportion of CD4+ and CD8+ cells in ovarian cancer tissues of each group of tumor-bearing mice. (I) Flow cytometry to detect the proportion of IL-2, IFN-γ and ki-67 positive cells in CD8+ cells in ovarian cancer tissue of tumor-bearing mice. *p<0.05, **p<0.001, ***, ns p>0.05, n=8. CUL3, cullin 3; IFN, interferon; IL, interleukin; PBS, phosphate buffered saline; PD-L1, programmed death ligand-1; TUNEL, terminal deoxyribonucleotidyl transferase-mediated dUTP-digoxigenin nick end labeling.
In addition, oe-CUL3 treatment caused an increase in the expression of CUL3 mRNA and protein, and a reduction in the protein stability of PD-L1, but no change in the expression of PD-L1 mRNA. On sh-PD-L1 treatment, the expression of CUL3 mRNA and protein showed no changes, but PD-L1 mRNA and protein stability were reduced. Simultaneous oe-CUL3 and sh-PD-L1 treatment exerted no function in the expression of CUL3 mRNA and protein, but reduced the stability of PD-L1 protein (figure 5D,E).
As reflected by immunohistochemistry and TUNEL staining, the proportion of Ki-67 positive cells in the ovarian cancer tissue of mice on the oe-CUL3 or sh-PD-L1 treatment was decreased, and the proportion of apoptotic cells was increased. However, simultaneous oe-CUL3 and sh-PD-L1 treatment led to more pronounced changes (figure 5).
Further flow cytometry revealed that the number of CD4+ and CD8+ T cells infiltrated was increased on the oe-CUL3 or sh-PD-L1 treatment. And, simultaneous oe-CUL3 and sh-PD-L1 treatment led to more pronounced changes (figure 5H). Further, the proportion of IL-2, IFN-γ, and ki-67 positive cells was increased in the CD8+ cells after the oe-CUL3 treatment or sh-PD-L1 treatment. However, simultaneous oe-CUL3 and sh-PD-L1 treatment led to more pronounced changes (figure 5I).
The above results indicated that overexpression of CUL3 in tumor-bearing mice repressed the protein stability of PD-L1 through post-transcriptional levels, thereby inhibiting the tumorigenic ability of ovarian cancer cells in nude mice.
Knockdown of CUL3 expression reduces the chemotherapy sensitivity of tumor-bearing mice to cisplatin by stabilizing PD-L1 protein
We then explored the effect of CUL3-mediated PD-L1 on the chemotherapy sensitivity of tumor-bearing mice. We found that tumor volume and tumor weight was reduced in mice injected with cisplatin, further sh-CUL3 treatment led to opposite trends. Compared with mice injected with cisplatin+sh-CUL3, mice treated with cisplatin+sh-CUL3+sh-PD-L1 showed reduced tumor volume and tumor weight (figure 6A,B).

Decreased CUL3 reduced chemotherapy sensitivity of tumor-bearing mice to cisplatin by stabilizing the expression of PD-L1 protein. Tumor-bearing mice were injected with cells expressing sh-CUL3 and/or sh-PD-L1 or treated with Cisplatin. (A) Representative images and growth curves of tumors in tumor-bearing mice in each group. (B) Changes in tumor weight of tumor-bearing mice in each group. (C) Immunohistochemistry was used to detect the proportion of Ki67 positive cells in ovarian cancer tissues of each group of tumor-bearing mice (scale bar: 25 µm). (D) TUNEL staining to detect changes of cell apoptosis in ovarian cancer tissues of each group of tumor-bearing mice (scale bar: 25 µm). (E) Flow cytometry was used to detect the proportion of CD4+ and CD8+ T cells in ovarian cancer tissues of each group of tumor-bearing mice. (F) Flow cytometry to detect the proportion of IL-2, IFN-γ and ki-67-positive cells in CD8+ T cells in ovarian cancer tissues in each group of tumor-bearing mice. ***p<0.001, n=8. CUL3, cullin 3; IFN, interferon; IL, interleukin; PBS, phosphate buffered saline; PD-L1, programmed death ligand-1; TUNEL, terminal deoxyribonucleotidyl transferase-mediated dUTP-digoxigenin nick end labeling.
In addition, the proportion of Ki-67 positive cells in ovarian cancer tissues was decreased, and the proportion of apoptotic cells was increased in mice injected with cisplatin, while further sh-CUL3 treatment led to contrary findings. Compared with mice injected with cisplatin+sh-CUL3, the proportion of Ki-67 positive cells was decreased, and the proportion of apoptotic cells was increased in mice treated with cisplatin+sh-CUL3+sh-PD-L1 (figure 6C,D).
Further, the number of CD4+ and CD8+ T cells infiltrated was increased after cisplatin treatment, while sh-CUL3 treatment led to contrary results. Compared with the cisplatin+sh-CUL3 treatment, the number of CD4+ and CD8+ T cells infiltrated in the cisplatin+sh-CUL3+sh-PD-L1 treatment was increased (figure 6E). Cisplatin treatment caused elevated proportion of IL-2, IFN-γ and ki-67 positive cells in the CD8+ cells, while sh-CUL3 treatment led to opposite trends. Compared with the cisplatin+sh-CUL3 treatment, the proportion of IL-2, IFN-γ and ki-67 positive cells in the CD8+ cells was increased on cisplatin+sh-CUL3+sh-PD-L1 treatment (figure 6F).
Thus, knocking down CUL3 reduced the chemotherapy sensitivity of tumor-bearing mice to cisplatin by stabilizing PD-L1 protein.
Discussion
Ovarian cancer is the most lethal gynecologic malignancy and patients with ovarian cancer is liable to relapse and chemoresistance.23 Numerous studies have proved that cisplatin plays a vital role in ovarian cancer treatment.24–26 Immunotherapy has attracted much attention for revolutionizing the treatment of different cancers, including ovarian cancer.27 Here, we elucidated that CUL3 formed a complex with its linker molecule SPOP to promote the ubiquitination and degradation of PD-L1, leading to increased T-cell proliferation, activity and toxicity, thereby inhibiting the immune escape of ovarian cancer cells and sensitizing ovarian cancer cells to cisplatin.
Our initial findings of the bioinformatics analysis identified CUL3 as a candidate gene related to ovarian cancer due to its low expression in ovarian cancer tissues, which was correlated with the poor prognosis of patients with ovarian cancer. We then validated a reduction in CUL3 expression in ovarian cancer cells. The significance of CUL3 has been proved in serous ovarian cancer.28 It is speculated that miR-141-induced elevation of CD47 and CUL3 represses proliferation and migration of 293T and SH-SY5Y cells.29 Furthermore, CUL3-mediated ubiquitination represses autophagy and promotes tumor progression.8 Besides, decreased SPOP is also observed in ovarian cancer from our assays. It has been established that SPOP, a representative substrate recognition subunit of cullin-ring E3 ligase, acts dual roles in tumorigenesis and cancer progression.30 Besides, SPOP may promote malignant features of renal carcinoma cells by promoting the expression of C-Jun.31 Consistent with our findings, a reduction in SPOP has also been demonstrated in human epithelial ovarian cancer, and its high expression leads to suppressed cancer cell proliferation.9
Further to explore the downstream mechanisms, we unraveled that CUL3 degraded PD-L1 protein by forming a complex with SPOP. CUL3/SPOP complex inhibited the immune escape of ovarian cancer cells and improved the chemotherapy sensitivity of ovarian cancer cells. Protein ubiquitination, a post-translational modification, exerts crucial functions in cell cycle transition, DNA replication, DNA repair, gene transcription, signal transduction, and viral infections.32 Recent study has shown that CUL3 forms complexes containing SPOP target a myriad of DNA-binding proteins engaged in DNA repair and gene expression, underscoring its critical role in modulating cellular homeostasis.33 Previous evidence has depicted that expression of PD-L1 on tumor cells is related to poor outcome in solid cancers.34 Moreover, restoration of PD-L1 in tumor cells has been implicated in immune escape in immunogenic tumors as well as contributes to suppression of CD8 T-cell cytotoxicity.35 PD-L1 has been attributable to immunosuppressive and blocking the PD-1/PD-L1 pathway could repress immune escape in glioma.15 In addition, it has been established that deletion of PD-L1 suppresses chemoresistance of cisplatin-resistant ovarian cancer cells to cisplatin, providing a deeper understanding for ovarian cancer treatment.36 PD-L1 on tumor cells inhibits antitumor immunity and adversely affects the prognosis of patients with ovarian cancer.16 In line with our study, Zhang et al also has demonstrated that CUL3/SPOP is able to destroy the stability of PD-L1.19 More importantly, KLHL18, a BTB domain protein and binds CUL3, can suppress non-small cell lung cancer by reducing the activity of PI3K/PD-L1 axis.37 Thus, we made a conclusion that CUL3/SPOP could degrade PD-L1 to suppress immune escape of ovarian cancer cells and promote the sensitivity of ovarian cancer cells to chemotherapy, suggestive of the critical roles of CUL3 and SPOP in ovarian cancer.
Conclusion
Taken together, CUL3 promoted the degradation of PD-L1 by forming a complex with its interface molecule SPOP, which led to suppressed malignant characteristics of cancer cells, thereby inhibiting immune escape of ovarian cancer cells and improving the chemoresistance of ovarian cancer cells (figure 7). Our findings deepen our standing of the tumorigenesis of ovarian cancer and provide a theoretical basis for development of novel targeted therapies for ovarian cancer. However, attention should be also paid to repeat the findings in SKOV3/nude mouse and a spontaneous ovarian cancer mouse model with complete immune system for further confirming the role of CUL3/SPOP-mediated PD-L1 in treatment of ovarian cancer.

Schematic map of CUL3-mediated PD-L1 in ovarian cancer. CUL3 can form a complex with its linker molecule SPOP to promote the ubiquitination and degradation of PD-L1, leading to increased T-cell proliferation, activity and toxicity, thereby inhibiting the immune escape of ovarian cancer cells and improving the chemotherapy sensitivity of ovarian cancer cells. CUL3, cullin 3; IFN, interferon; IL, interleukin; PD-1, programmed cell death protein-1; PD-L1, programmed death ligand-1; SPOP, speckle type POZ protein.
Supplemental material
Data availability statement
Data are available upon reasonable request. All data relevant to the study are included in the article or uploaded as supplementary information. The data sets used and/or analysed during the current study are available from the corresponding author on reasonable request.
Ethics statements
Patient consent for publication
Ethics approval
The experiment was approved by the Ethics Committee of Shanghai Ninth People’s Hospital, School of Medicine, Shanghai Jiaotong University (SH9H-2020-TK75-1) and conducted in compliance with the Helsinki declaration. All individuals signed informed written consent documents.
References
Supplementary materials
Supplementary Data
This web only file has been produced by the BMJ Publishing Group from an electronic file supplied by the author(s) and has not been edited for content.
Footnotes
MD and MQ contributed equally.
Correction notice This article has been corrected since it was first published online. The authors' affiliation has been updated to include 'Shanghai Ninth People’s Hospital'.
Contributors MD: Conceptualization, Data Curation, Formal Analysis, Project Administration, Resources, Writing—Original Draft. MQ: Conceptualization, Investigation, Validation, Visualization, Writing—Original Draft. ZR: Conceptualization, Methodology, Software, Supervision, Writing—Review and Editing, Guarantor.
Funding The authors have not declared a specific grant for this research from any funding agency in the public, commercial or not-for-profit sectors.
Competing interests None declared.
Provenance and peer review Not commissioned; externally peer reviewed.
Supplemental material This content has been supplied by the author(s). It has not been vetted by BMJ Publishing Group Limited (BMJ) and may not have been peer-reviewed. Any opinions or recommendations discussed are solely those of the author(s) and are not endorsed by BMJ. BMJ disclaims all liability and responsibility arising from any reliance placed on the content. Where the content includes any translated material, BMJ does not warrant the accuracy and reliability of the translations (including but not limited to local regulations, clinical guidelines, terminology, drug names and drug dosages), and is not responsible for any error and/or omissions arising from translation and adaptation or otherwise.