Article Text

Abstract
Multiple myeloma (MM) is a hematological malignancy originating from malignant and clonally expanding plasma cells. MM can be molecularly stratified, and its clonal evolution deciphered based on the Ig heavy and light chains of the respective malignant plasma cell clone. Of all MM subtypes, IgE type MM accounts for only <0.1% of cases and is associated with an aggressive clinical course and consequentially dismal prognosis. In such malignancies, adoptive transfer of autologous lymphocytes specifically targeting presented (neo)epitopes encoded by either somatically mutated or specifically overexpressed genes has resulted in substantial objective clinical regressions even in relapsed/refractory disease. However, there are no data on the genetic and immunological characteristics of this rare and aggressive entity. Here, we comprehensively profiled IgE type kappa MM on a genomic and immune repertoire level by integrating DNA- and single-cell RNA sequencing and comparative profiling against non-IgE type MM samples. We demonstrate distinct pathophysiological mechanisms as well as novel opportunities for targeting IgE type MM. Our data further provides the rationale for patient-individualized neoepitope-targeting cell therapy in high tumor mutation burden MM.
- immunity, cellular
- tumor microenvironment
- lymphocytes, tumor-infiltrating
- adaptive immunity
This is an open access article distributed in accordance with the Creative Commons Attribution Non Commercial (CC BY-NC 4.0) license, which permits others to distribute, remix, adapt, build upon this work non-commercially, and license their derivative works on different terms, provided the original work is properly cited, appropriate credit is given, any changes made indicated, and the use is non-commercial. See http://creativecommons.org/licenses/by-nc/4.0/.
Statistics from Altmetric.com
Introduction
Novel immunotherapeutic approaches including cell therapy are believed to be the next generation of paradigm-changing treatment options in B cell-derived malignancies. However, despite substantial progress over the last years, B cell-derived malignancies including multiple myeloma (MM) continue to represent up to 5% of all cancers, and the 10-year relative overall survival in developed countries is at 55%–70%. Resistance to induction therapy or disease progression are clinical features of aggressive disease and represent major clinical challenges.
Cancer immunotherapy has experienced an unprecedented renaissance with the introduction and broad clinical application of immune checkpoint inhibitors (ICIs). ICI block negative signals to T cells, thus enabling the activation of endogenously present tumor-specific T cells. These T cells generally recognize mutated tumor-specific epitopes, which are often highly individualized (so called private neoepitopes).1 2 ICI, however, is not very effective in hematological malignancies with few somatic mutations, including acute myeloid leukemia (AML) and B cell-derived malignancies, as the potential targets for T cells to recognize are limited. Instead of ICI, in such cancers adoptive transfer of autologous lymphocytes specifically targeting presented (neo)epitopes encoded by either somatically mutated or specifically overexpressed genes has resulted in substantial objective clinical regressions even in relapsed/refractory disease.1–5
MM demonstrates disseminated bone marrow involvement by a clonal plasma cell infiltrate. MM can be molecularly stratified, and its clonal evolution deciphered based on the Ig heavy and light chains of the respective malignant plasma cell clone. IgG type MM represents 70% of cases followed by IgA type MM. While IgD or IgE type MM have been reported, these cases are rarely seen. IgE type MM was first described in 1967, with an estimated prevalence of<0.1% of all plasma cell neoplasms.6 Similar epidemiology and clinical presentation are seen in patients with IgE type MM as compared with patients with other myelomas. Anemia, Bence-Jones proteinuria, and progression to secondary plasma cell leukemia have been seen in higher frequency in IgE type MM patients.7 Overall, IgE type MM is associated with an aggressive clinical course and consequentially dismal prognosis.6 To this date, there are no data on the genetic characteristics of this rare and aggressive entity. Here, we comprehensively profiled a case of IgE kappa MM on a genomic and microenvironmental level by integrating DNA-cell and single-cell RNA profiling and demonstrate distinct pathophysiological mechanisms as well as novel opportunities for targeting IgE type MM. Our data further provide the rationale for patient-individualized neoepitope-targeting cell therapy in high tumor mutation burden (TMB) MM.
Results
We present a male patient in his late 30s who was first diagnosed in spring 2019 with IgE type MM and an International Staging System (ISS) score of 3 (ß−2-microglobulin=30 mg/L, albumin=41.1 g/L), standard risk cytogenetics and multiple osteolytic bone lesions identifiable by CT and MRI (figure 1A–C). At initial diagnosis, peripheral blood IgE levels were at 17.088 IU/L and were leveraged as patient-individual marker of treatment response (figure 1B). Initial treatment comprised four cycles of Bortezomib, cyclophosphamide and dexamethasone (VCD), followed by tandem high dose melphalan therapy and autologous stem cell transplantation and lenalidomide/dexamethasone maintenance. The best International Myeloma Working Group (IMWG) response following first line therapy was stable disease. The patient suffered from early relapse 12 months after completion of first-line therapy, and therefore, underwent comprehensive molecular NCT/DKFZ/DKTK MASTER precision oncology program,8 including whole-genome sequencing (WGS) and evaluation of potential targeted treatment options beyond the standard of care. Bone-marrow aspirate at relapse was analyzed by flow cytometry and iFISH to assess potential therapeutic targets (figure 1D,E). Consistent with previous studies on the genomic background of IgE type MM,9 interphase FISH (iFISH) analysis confirmed IgH rearrangement, characterized as a t(11;14) translocation in 97% of cells (figure 1E) and scRNA analysis confirmed overexpression of CCND1 (online supplemental figure 1a). While the cytogenetic profile remained constant at relapse, we found homogenous surface expression of common therapeutic targets such as BCMA and SLAMF7 on IgE type MM cells, which are approved or under clinical investigation as cell therapy targets in non-IgE type MM (figure 1D,E). Notably, BCMA-targeting CAR-T cell therapy was recently approved by the U.S. Food and Drug Administration (FDA) and European Medicines Agency (EMA). Flow cytometry-based analysis of the bone marrow-associated immune infiltrate at relapse revealed 3.73% exhausted CD8+ T cells and 5.95% exhausted CD4+ T cells, respectively. (figure 1F).
Supplemental material

Clinical case presentation of IgE type multiple myeloma. (A) MRI (T1 and DWI) and CT imaging of osteolytic lesions in pelvic bone and cervical spine (highlighted in red). (B) Serological activity parameters (IgE in IU/L, serum free kappa light chains (sFLC) and urine free kappa light chains (uFLC) in mg/l) over course of disease. (C) Histopathological features of bone marrow biopsy at disease relapse. Immunohistochemistry stains indicated in-figure. (D) Flow cytometry quantification of aberrant markers and expression of potential therapeutic targets on malignant IgE type MM cells in bone marrow aspirate at relapse. (E) Cytogenetic analysis by iFISH identifies IgH rearrangement in form of t(11;14). (F) Flow cytometry-based assessment and quantification of bone marrow-associated CD4+ and CD8+ T cells and respective programmed cell death protein 1 (PD-1) surface expression on CD4+ and CD8+ T cell subsets. MM, multiple myeloma. DWI, diffusion weighted imaging.
To further characterize genomic and microenvironmental characteristics of IgE type MM, we performed WGS analysis of CD138+ aberrant plasma cells as well as single-cell RNA profiling of bone marrow-derived mononuclear cells including aberrant plasma cells and CD45+ immune cells, as well as peripheral blood mononuclear cells (PBMCs) to assess putative immunological effects of disease activity including excessive systemic IgE levels. We analyzed IgE kappa MM bone marrow aspirate on a genomic and microenvironmental level by integrating DNA- and single-cell RNA sequencing and comparative profiling against non-IgE type RRMM samples10 (figure 2A). IgE type MM cells demonstrated a distinct transcriptional profile including homogenous Immunoglobulin Heavy Constant Epsilon (IGHE) expression in comparison to non-IgE type MM cells, therefore, separating as distinct entity in Uniform Manifold Approximation and Projection (UMAP)-guided clustering (figure 2A, online supplemental figure 1a). Immune cell subset abundances of bone marrow-associated T and NK cells defined by canonical transcriptional markers (online supplemental figure 2a–c), however, did not significantly differ between IgE and non-IgE MM (figure 2B,C). From WGS data, 159 expressed single-nucleotide variants (SNVs) and 18 expressed small insertions and deletions (indels) were called in IgE type MM compared with a median of 69 expressed SNVs and 5 indels in non-IgE type MM (figure 2D,E, (online supplemental table 2). Of note, we found commonly described alternations, such as an SNV in ALK (24% DNA-AF), as well as SNV in SOX10 (32% DNA-AF) and CHEK1 (40% DNA-AF), the latter being a master coordinator of DNA damage response. Notably, this case of IgE type MM demonstrated the highest TMB within the analyzed MM cohort with 5.0 non-synonymous mutations per coding megabase (figure 2D,E). TMB has been repeatedly shown to associate with increased response rates to ICI in solid tumors, putatively via the enhanced generation of tumor neoepitopes.3 11 12 Single-cell BCR-Seq of malignant plasma cells revealed several point mutations in the Ig heavy chain (IgH) gene forming putative neoepitopes on the cell surface (figure 2F). Consequently, we next aimed to investigate how the hypermutated tumor phenotype and the secretion of aberrant IgE might shape the tumor-associated and systemic immune microenvironment.
Supplemental material
Supplemental material
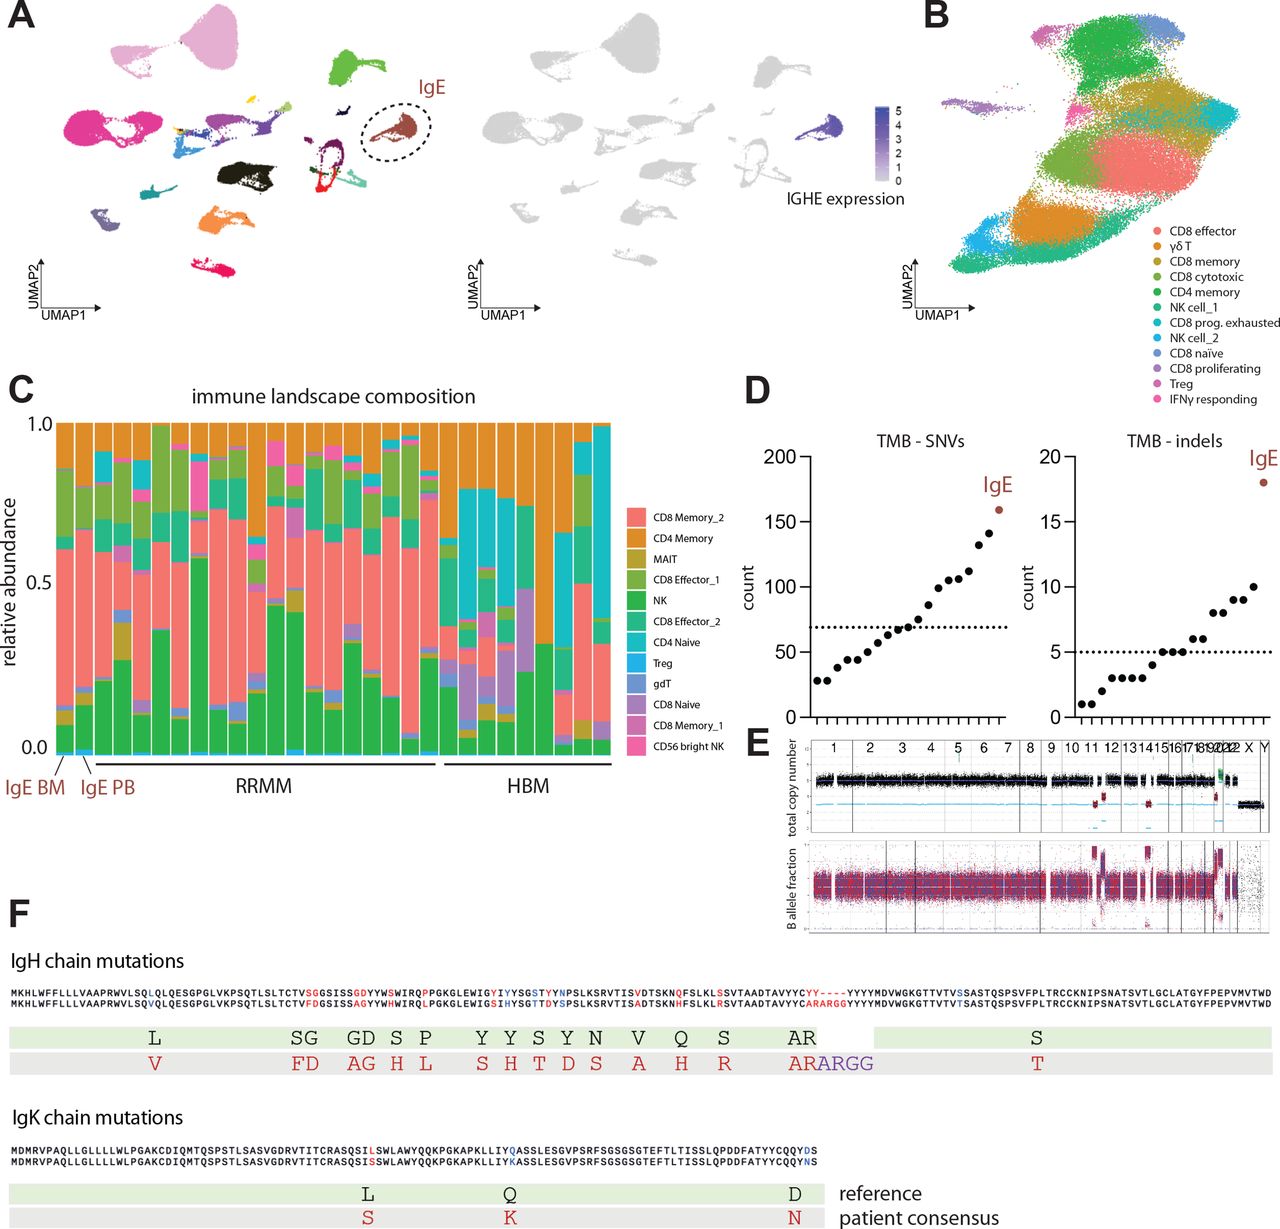
IgE type multiple myeloma is a biologically distinct entity with increased tumor mutational burden. (A) Left: Visualization of scRNA data using uniform manifold approximation and projection (UMAP). UMAP color-coded for individual patient identifier. n=19 patients with relapsed/refractory non-IgE type MM, n=patient with relapsed/refractory IgE type MM. Right: FeaturePlot depicting log-normalized RNA expression of IGHE gene. (B) UMAP depicting cell composition of IgE type MM-associated T and NK cells (C) Composition of T and NK cell subsets identified as bone-marrow infiltrating immune cells in n=18 patients with relapsed/refractory non-IgE type MM, n = 1 patient with relapsed/refractory IgE type MM and n=9 healthy control patients (D) Tumor mutation burden (TMB) of IgE type MM patient and WGS dataset of n=18 non-IgE type RRMM patients visualized as counts of single nucleotide variants (SNVs) and indels. (E) Copy number profile of IgE type malignant MM cells determined by WGS indicating total copy number (top) and RAW B allele fractions (bottom). (F) Amino acid changes derived from underlying mutations in IgE heavy chain and IgE kappa chain as called by CellRanger 6.0.0 algorithm. MM, multiple myeloma; WGS, whole-genome sequencing; RRMM, relapsed-refractory multiple myeloma.
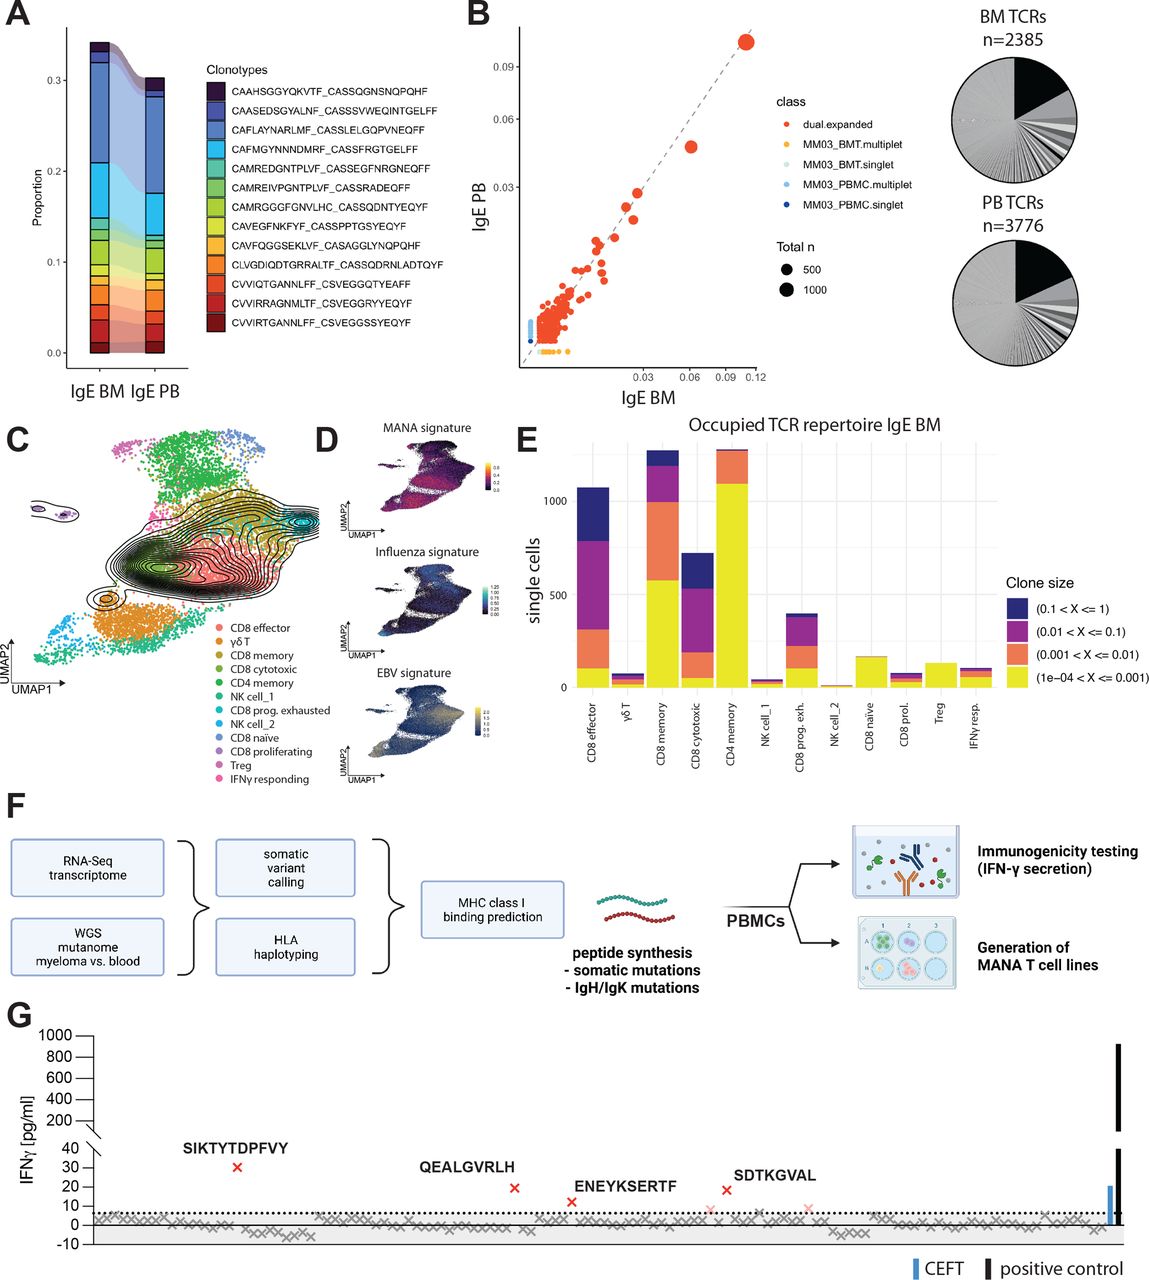
While overall abundance of tumor-infiltrating lymphocyte (TIL) subsets did not significantly differ between IgE type and non-IgE type MM (figure 2C), single-cell VDJ-sequencing of the tumor-associated immune infiltrate revealed a hyperexpanded T cell repertoire with strong overlap of large T cell clones between bone marrow and peripheral blood (figure 3A,B). Mapping of clones identified by their T cell receptor (TCR) CDR3 region, to T cell subsets defined by scRNA-seq revealed T cell expansion to be mainly focused on effector and cytotoxic CD8+ cells (figure 3C–E). We further leveraged recently published signatures13 of CD8+ responses to Mutation-associated neoantigens (MANA) and virus reactive transcriptional signatures to Epstein-Barr virus (EBV) and influenza and found that hyperexpanded T cell clones demonstrated MANA signature expression, but no significant expression of transcripts indicating virus reactivity (figure 3C,D). In this case, MANA signature expression correlated positively with clonal frequency, suggesting that large T cell clones might be tumor reactive.
IgE type MM immune repertoire is composed of large CD8+ T cell clones and reacts to de novo predicted tumor neoepitopes. (A) Clonotype overlap between T cells in peripheral blood mononuclear cells (PBMC) and bone marrow aspirate (BMT) called by CDR3 amino acid sequence indicated by color coding. Proportion shown. (B) Left: Scatterplot of TCR repertoire in BMT on x-axis and PBMC on y-axis. Axis values indicate proportion in sample, dot size indicates total count of clonotype. Right: pie chart of respective TCR repertoire by frequency in BMT (n=2385 productive TCRs; bottom) and PBMC (n=3776 productive TCRs; bottom). (C) Clonal density plot indicating clonal IgE type MM patient T cells with TCR frequency >1%. UMAPs color-coded for individually annotated T cell subset clusters. n=18 patients with relapsed/refractory non-IgE type MM, n=1 patient with relapsed/refractory IgE type MM (PBMC and BMT). (D) gene signature scores indicating MANA, EBV or influenza-specific T cell transcriptomes plotted as feature expression on UMAP from (C). n = 18 patients with relapsed/refractory non-IgE type MM, n = 1 patient with relapsed/refractory IgE type MM (PBMC and BMT) (E) distribution of TCR clone size classes on T cell subsets in BM of IgE type MM patient. Clone size classes are defined by frequency in sample according to the shown thresholds. (F) Workflow utilized for patient-specific neoepitope prediction and -testing utilizing autologous patient PBMCs. (G) IFN-γ ELISA of n=124 predicted 8-9mer somatic neoepitopes after co-cultivation and peptide-specific expansion for 10 days, followed by recall with 10 µg/mL peptide of interest for 72 hours. IFN-γ concentrations in pg/mL. The dotted line represents the 0.95 percentile. Human viral peptide library (CEFT; blue BAR) and PMA+Ionomycin (positive control; black BAR) were used as controls. EBV, Epstein-Barr virus; MM, multiple myeloma; UMAP, Uniform Manifold Approximation and Projection; WGS, whole-genome sequencing.
Based on these findings and the high TMB in this case, we hypothesized that the clonal expansion of T cell clones expressing tumor reactive signatures is a result of mutation-derived tumor neoepitopes. We; therefore, aimed to identify potential neoepitopes driving the expansion of tumor reactive TILs. To this end, we performed HLA haplotyping and somatic variant calling from WGS data and MHC class I binding predictions and identified 124 8-9mer peptides derived from SNVs that qualified as MHC class I ‘strong binders’ as well as 7 predicted strong-binder peptides derived from indels (figure 3F, online supplemental tables 1 and 2). We tested all predicted somatic neoepitopes as well as 59 predicted neoepitopes derived from clonal IgH mutations identified by scBCR-seq for reactivity of patient-derived PBMCs by measuring IFN-γ secretion. While there was no reactivity of patient T cells against any of the predicted neoepitopes derived IgH mutations (online supplemental figure 3a), we found some reactivity to a viral epitope pool compassing 27 MHC class I presented peptides derived from Clostridium tetani, Epstein-Barr virus (EBV) Human cytomegalovirus (HHV-5) and Influenza A, as expected in patient-derived PBMCs. We further found four peptides derived from somatic mutations which elicited T cell cytokine responses (figure 3G). Two of the mutated genes (SPATA2, MAVS) generating the T cell-reactive 9-mer neoepitopes STYTDPFVY (HLA-A*01:01) and EENESERTF (HLA-B*44:02), respectively, were highly expressed in IgE type as well as non-IgE type MM and might represent recurrent neoepitopes (online supplemental figure 3b). We further found pronounced expression of HLA-F transcripts in IgE type MM cells, which—while in principle suggesting the integrity of major histocompatibility complex (MHC) class I-restricted antigen presentation to CD8+ T cells—also represents a non-classical HLA class I heavy chain paralogue correlated with poor prognosis in several cancer entities14–16 (online supplemental figure 1a). Taken together with the MANA signature expression of large T cell clones, these data suggest that the clonal proliferation of CD8+ effector clones is a consequence of tumor neoepitope reactivity of these TILs and correlates with the pronounced TMB in this MM entity.
Supplemental material
Supplemental material
Discussion
Here, we comprehensively profiled the very rarely occurring IgE type MM on a genomic and microenvironmental level and offer novel insights into pathophysiology and therapeutic opportunities in this orphan disease. While the clinical and genomic characteristics of this disease appear to be in line with previous reports,6 9 specifically demonstrating a t(11;14) translocation as well as early clinical relapse), this report is the first to set out to investigate the microenvironmental dynamics at play in this entity. However, further research in this very rare entity is needed, as we were only able to profile one patient and any therapeutical implications thus far remain limited to this case.
The bone marrow-associated immune cell composition of this case of IgE type MM does not differ significantly from other types of MM, when integrating this dataset with published datasets of healthy bone marrow donors and relapsed-refractory MM patients.10 17 There is increasing evidence of oligoclonal expansion of bone marrow-associated T cells in MM. However, the relevance of pre-existing expanded T cell clones for patient prognosis remains unclear and likely to be influenced by disease state and prior therapy.18 19
Here, we show that IgE MM in this case is characterized by a distinct transcriptional profile and demonstrates a hypermutated phenotype. Moreover, high mutation burden is correlated with a hyperexpanded CD8+ T cell compartment expressing transcriptional signatures of tumor cell recognition, as it has been previously described in melanoma and non-small cell lung cancer.13 20
We further demonstrate reactivity of patient-derived T cells against four tumor neoepitopes predicted from WGS data of malignant plasma cells. In line with previous reports, there was marked reactivity of T cells against MHC class I presented peptides derived from Clostridium tetani, EBV (HHV-4) human cytomegalovirus (HHV-5) and Influenza A, highlighting the relevance of differentiating specific tumor reactive TCRs from T cells that are cross-reacting to both human neoepitopes and microbial antigens.11 21 Moreover, there is the possibility of non-mutated, but overexpressed tumor antigens or cancer/testis antigens that were shown to be recognized by clonal T cell populations in patients with cancer.22 23
As described in earlier publications, aberrant IgE secretion of IgE type MM does not seem to elicit a hyperexcitability syndrome, which we could not observe at any time point in the disease course, despite excessive IgE serum levels.24 The observed CD8+ T cell hyperexpansion, therefore, appears to be postinfectious, as described above or a consequence of an antitumor immune response. The latter hypothesis is further corroborated by patient-individualized prediction and functional testing of immunogenic neoepitopes.
This study’s applicability to a broader patient population is limited given the extremely rare incidence of IgE type MM and the nature of this representative translational study. However, our data provide the rationale for routine neoepitope testing and future patient-individualized cell therapy approaches in high TMB MM, specifically as T cell clonal expansion and its relation to prognosis have been studied in detail in other non-solid cancers. On a broader level, we underline how next-generation sequencing techniques and transcriptional TME profiling might provide novel therapeutic insights with clinical relevance, specifically in insufficiently characterized tumor entities.
Materials and methods
Methods for clinical diagnostics
Clinical diagnostics, including MRI and CT imaging, iFISH analysis, flow cytometry analysis of the bone marrow aspirate as well as histopathological analyses were carried out according to clinical diagnostic standards of the Heidelberg University Hospital and German clinical licensing institutions.
Whole-genome sequencing
WGS was performed on an Illumina NovaSeq 6000 instrument with S4 flow cells in paired-end mode (2×151 bp). Previously described protocols (PMID 34112699) were used for the extraction of nucleic acids, library preparation, and computational processing.
Methods for single-cell immune profiling
Processing of human bone marrow samples
Bone marrow mononuclear fractions were isolated through ficoll density gradients coupled with magnetic sorting of CD3 T cells. Unbiased mRNA profiling coupled with feature barcoding technology for cell surface protein (TotalSeq-B) of BM CD3 T cells was then performed by using the chromium single-cell (10 x Genomics). Paired-end sequencing was performed on Illumina platform. Cell Ranger and Seurat pipeline were used for sample de-multiplexing, barcode processing, single-cell 5’ gene counting, cell surface protein expression and data analysis.
Processing of human peripheral blood samples
Peripheral blood samples were 1:1 diluted in preparation buffer (phosphate-buffered saline (PBS) with 0.1% BSA and 2 mM EDTA), and mononuclear cell separation was performed by density centrifugation (Bicoll separating solution, Biochrom) with diluted peripheral blood cells (centrifugation 20 min, 1300 g). Cells were carefully aspirated and washed with preparation buffer (centrifugation 5 min at 470 g). Red blood cells were lysed using RCL buffer (155 mM NH4Cl, 10 mM KHCO3, 0.1 mM EDTA) for 1 min at room temperature and cells were washed (centrifugation 5 min, 470 g) and resuspended in preparation buffer. After cell counting, 1 × 10⁷ cells were frozen per aliquot in 90% FCS (Sigma-Aldrich) supplemented with 10% DMSO (Serva Electrophoresis) and stored in liquid nitrogen until further use.
Single-cell RNA sequencing and data preprocessing
Our protocol used viably frozen cells that were thawed at 37°C, resuspended in ice-cold phosphate-buffered saline (PBS) and washed twice with cells being collected by centrifugation at 500 g for 4 min. The freezing step had little effect on data quality, major cell-type composition and transcriptome as evaluated by us previously. Tirier et al 10 Viable, CD45+ cells were isolated by fluorescence-activated cell sorting on a BD Aria Fusion device. Single-cell capture, reverse transcription, and library preparation were carried out on the Chromium platform (10x Genomics) with the Single-cell 5ʹ reagent v2 kit (10x Genomics) according to the manufacturer’s protocol using 40 000 cells as input per channel. Each of the final libraries were paired-end sequenced (26 and 92 bp) on one Illumina NovaSeq 6000 S2 lane. Raw sequencing data were processed and aligned to the human genome (GRCh38) using the CellRanger pipeline (10x Genomics, V.6.0).
Single-cell transcriptomic analyses
Quality control and normalization
Single-cell RNA, including VDJ data were processed using the CellRanger pipeline (V.6.0.0) to the GRChg38 reference genome.
Single-cell transcriptomic analysis was done using Seurat V.4.1.0. All cells, which had unique feature counts over 2500 or less than 200 as well as >5% mitochondrial counts were excluded from the analysis. In addition, genes detected in fewer than three cells were excluded from downstream analysis. Gene expression was normalized using Seurat’s LogNormalization() and highly variable genes were identified by using the FindVariableFeatures(). Control datasets for myeloma-infiltrating immune cells as well as CD138+cells were kindly provided by SS and can be found in Tirier et al.10
Analysis of CD45+ bone marrow compartment
After preprocessing and QC, all patient and control datasets were mapped onto the CITE-seq reference of human bone marrow mononuclear cells using the MapQuery function in Seurat with default parameters by finding anchors between each of our datasets with the query dataset via FindTransferAnchors(). Beforehand Seurat reference dataset was normalized in the same manner as described in the according vignette .
Subsetted analyses
T-cells and NK-T cells were identified and subsequently subsetted into 12 different clusters based on CITE-seq expression profiles. (‘gdT’, ‘CD8 Memory_1’, ‘MAIT’, ‘NK’, ‘CD56 bright NK’, ‘CD8 Memory_2’, ‘CD8 Naive’, ‘Treg’, ‘CD4 Naive’, ‘CD4 Memory’, ‘CD8 Effector_1’,and ‘“CD8 Effector_2’).
Subsetted T & NK cells were further integrated using the Harmony package V.0.1.0 using RunHarmony(c(‘orig.ident’, ‘batch’), plot_convergence=TRUE, dims.use=1:20, max.iter.harmony=30, max.iter.cluster=60, epsilon.cluster = -Inf, epsilon.harmony = -Inf), using 5000 variable features. Before Harmony integration, batch-effect associated genes as well as TCR genes (JUN, FOS, RP, ZFP36, EGR, HSP, MALAT1, XIST, MT-, HIST, TRAV, TRAD, TRAJ, TRBV, TRBD, TRBJ, TRGV, TRGD, TRGJ, TRDV, TRDD, TRDJ) were removed from ScaleData() and RunPCA(). T & NK cell clusters were identified using RunUMAP(reduction = ‘harmony’, dims=1:20), FindNeighbors(reduction = ‘harmony’, dims=1:20), FindClusters (resolution=c(1.0)). Manual dataset curation to allow for clear visualization of T cell subsets was done removing contaminating potential doublets and RBCs. T cell subsets were manually annotated according to marker identification using FindAllMarkers(). MANA, EBV and influenza signature gene list were taken from Caushi et al and added using AddModuleScore() and visualized with FeaturePlot(x, min.cutoff=0).
Subsetted myeloma cells were identified from the BM-reference as ‘Plasmablast’ and ‘Prog_B 2’. Cells with irregularily high level of hemoglobin associated genes were excluded. As in Tirier et. Al. Ig-associated genes (JCHAIN, IGHD, IGHA, IGHE, IGHG, IGHJ, IGHM, IGHV, IGKC, IGKJ, IGKV, IGLC, IGLJ, IGLV) were removed from ScaleData() and RunPCA() steps. Myeloma clusters were identified using RunUMAP(reduction = ‘pca’, dims=1:20), FindNeighbors(reduction = ‘pca’, dims=1:20), FindClusters(resolution=c(0.5)).
VDJ analysis
VDJ data were added using the combineExpression() from scRepertoire V.1.3.2. by using the amino acid sequence (CTaa) for clonotype calling. Cells with no output for either the alpha-chain or the beta-chain were removed from the analysis. The CDR3 amino acid sequence was used for clonotype calling. VDJ data was analyzed and visualized using the scRepeertoire package V.1.3.2 according to documentation. DensityPlots were generated using clonalOverlay(, reduction = ‘umap’, freq.cutpoint=0.01, bins=20). BMT and PBMC scatter plot was generated using scatterClonotype() using default parameters.
Correlative analyses on a single cell level between MANA signature score and clonotype frequency and visualization were done using ggplot2_3.3.5 and ggpubr_0.4.0 using stat_cor(method = ‘pearson’). BCR-VDJ data from IgE myeloma cells was analyzed using the 10x Vloupe browser V.4.0.0 software.
Differential gene expression analyses
Differential gene expression was performed using the FindMarkers function by MAST (Finak, G. et al. MAST: a flexible statistical framework for assessing transcriptional changes and characterizing heterogeneity in single-cell RNA sequencing data. Genome Biol. 16, 278 (2015).) to identify highly upregulated genes between different cell types as well as between different patients.
Quantification and statistical analysis
Data are represented as individual values or as median± SD, as indicated. Group sizes (n) and applied statistical tests are indicated in figure legends. Significance was assessed by either unpaired t-test analysis, paired t-test analysis, or two-way analysis of variance analysis with Tukey’s post hoc testing as indicated in figure legends. All reported p values are two-tailed. Multiple testing correction was applied within each condition or timepoint using the false discovery rate (q-value) method and a q<0.05 was considered significant. All analyses were performed using either R V.4.1.0 (www.R-project.org) and Bioconductor V.3.4 or GraphPad Prism V.9.0.
Due to the nature of this study, sample size determination was not applicable, as all available samples were included in this study. All cells passing QC were included in downstream analyses on a single-cell basis. For functional experiments, bone marrow samples were blinded to the experiment performer.
Neoepitope prediction
To predict specific neoepitopes, we established an analysis workflow pipeline. It starts with somatic variant calling from CD138+ MM cells to identify possible sites of neoepitope formation, followed by HLA-haplotyping with OptiType 1.3.125 and binding prediction using netMHCpan V.4.1.26 To narrow an initial large set of possible neoepitopes down to those most likely to be actionable, variant allele frequencies were analyzed. For these analyses, tumor cell data were compared with germline data from PBMCs, thereby eliminating non-somatic neoantigens. Moreover, non-coding variantswere excluded from further analysis. The remaining potential sites of neoepitope formation underwent HLA-binding prediction to further reduce the set of potentially actionable neoepitopes. Since HLA class I alleles predominantly bind to 8–9 mer peptide fragments, we chose to focus on the identification of 8–9 mer neoepitopes derived from non-silent SNVs or indels which were then filtered based on their eluted ligand %-rank meeting the cut-off of 2%. To minimize the risk of predicting neoepitopes that are expressed in healthy tissue, potential self-antigens were removed by filtering the predicted neoepitopes against the UniProtKB protein database using the tool PeptideMatch V.1.0.27 The remaining neoepitopes were then ranked by the allele frequency of the observed coding variant to offset issues arising from tumor heterogeneity.
Immunogenicity testing using IFN-gamma ELISA
Patient PBMCs were thawed and cultured with one respective neoepitope (conc. 1 µg/mL) added for 10 days in ImmunoCult-XF T Cell Exp Medium every in a 96-well format, using 250,000 cells per well. Cytokines to a final concentration of 100 IU/mL for IL-2, 25 ng/mL for IL-7 and 25 ng/mL for IL-15 were supplemented on days 3, 7 and 9. After the day 10, PBMCs were recalled with a final concentration of 10 µg/mL neoepitope peptide and incubated for further 72 hours. The supernatant of these respective peptide-stimulated PBMC cultures was then assayed for IFN-gamma secretion using the Invitrogen IFN gamma Human Uncoated ELISA Kit (Catalog # 88-7316-22) according to the manufacturer's protocol.
Ethics statements
Patient consent for publication
Ethics approval
This study was approved by the University of Heidelberg Institutional review board and all patients provided written informed consent for tumor sequencing and review of patient medical records for detailed demographic, pathologic, and treatment information. Written informed consent was obtained by all patients and donors prior to this study conformed to the principles set out in the WMA Declaration of Helsinki and in the Department of Health and Human Services Belmont Report. Ethical approval for the isolation of bone marrow aspirates, peripheral blood and single-cell analysis was obtained from the Heidelberg Medical Faculty Ethics Committee (Reference number S-096/2017). Participants gave informed consent to participate in the study before taking part.
Acknowledgments
We thank Stefanie Jung and Sandra Bauer, the NCT/DKFZ Sample Processing Laboratory, the DKFZ Genomics and Proteomics Core Facility, the DKFZ Omics IT and Data Management Core Facility, and the NCT Molecular Precision Oncology Program for their technical support.
References
Supplementary materials
Supplementary Data
This web only file has been produced by the BMJ Publishing Group from an electronic file supplied by the author(s) and has not been edited for content.
Footnotes
Twitter @KarstenRippe
Contributors NK and MJF conceptualized the study, designed, and performed experiments, analyzed and interpreted data, and wrote the paper. NK, MK and JM analyzed scRNA-seq data and performed experiments. AB performed histopathological stainings and analysis. SU, SB, SS, and SF performed SNV calling and neoepitope prediction. LSS performed and interpreted clinical diagnostics. TRW and SBE performed TIL isolation and functional testing. MH performed and analyzed diagnostic and translational flow cytometry. NW, KR, LB, MP, CM-T, MSR and HG were involved in study design and data interpretation. MJF supervised the study and interpreted data.
Funding This study was mainly supported by the José Carreras Leukaemia Foundation (PI: MJF; Project-ID DJCLS 01ZI/2022), the Federal Ministry of Education and Research (BMBF) and the Ministry of Science Baden-Württemberg within the framework of the Excellence Strategy of the Federal and State Governments of Germany (PI: MJF; Project-ID ExU 6.1.12). We thank the Dietmar Hopp Foundation (1DH118373) for providing funding for this study as well as the NCT Molecular Precision Oncology Program for funding (H021). N.K received fellowships by the German Academic Scholarship Foundation and the Research Training Group (RTG) 2099 funded by the DFG (Project-ID 259332240). JM received a fellowship by the German Cancer Aid, (Project-ID 70114336). SB received a fellowship by the German Cancer Aid (Project-ID 70114609).
Competing interests None declared.
Provenance and peer review Not commissioned; externally peer reviewed.
Supplemental material This content has been supplied by the author(s). It has not been vetted by BMJ Publishing Group Limited (BMJ) and may not have been peer-reviewed. Any opinions or recommendations discussed are solely those of the author(s) and are not endorsed by BMJ. BMJ disclaims all liability and responsibility arising from any reliance placed on the content. Where the content includes any translated material, BMJ does not warrant the accuracy and reliability of the translations (including but not limited to local regulations, clinical guidelines, terminology, drug names and drug dosages), and is not responsible for any error and/or omissions arising from translation and adaptation or otherwise.