Article Text

Abstract
Background CD47 is an integral membrane protein that alters adaptive immunosurveillance when bound to the matricellular glycoprotein thrombospondin-1 (TSP1). We examined the impact of the CD47/TSP1 signaling axis on melanoma patient response to anti-PD-1 therapy due to alterations in T cell activation, proliferation, effector function, and bioenergetics.
Methods A syngeneic B16 mouse melanoma model was performed to determine if targeting CD47 as monotherapy or in combination with anti-PD-1 impacted tumor burden. Cytotoxic (CD8+) T cells from Pmel-1 transgenic mice were used for T cell activation, cytotoxic T lymphocyte, and cellular bioenergetic assays. Single-cell RNA-sequencing, ELISA, and flow cytometry was performed on peripheral blood mononuclear cells and plasma of melanoma patients receiving anti-PD-1 therapy to examine CD47/TSP1 expression.
Results Human malignant melanoma tissue had increased CD47 and TSP1 expression within the tumor microenvironment compared with benign tissue. Due to the negative implications CD47/TSP1 can have on antitumor immune responses, we targeted CD47 in a melanoma model and observed a decrease in tumor burden due to increased tumor oxygen saturation and granzyme B secreting CD8+ T cells compared with wild-type tumors. Additionally, Pmel-1 CD8+ T cells exposed to TSP1 had reduced activation, proliferation, and effector function against B16 melanoma cells. Targeting CD47 allowed CD8+ T cells to overcome this TSP1 interaction to sustain these functions. TSP1 exposed CD8+ T cells have a decreased rate of glycolysis; however, targeting CD47 restored glycolysis when CD8+ T cells were exposed to TSP1, suggesting CD47 mediated metabolic reprogramming of T cells. Additionally, non-responding patients to anti-PD-1 therapy had increased T cells expressing CD47 and circulating levels of TSP1 compared with responding patients. Since CD47/TSP1 signaling axis negatively impacts CD8+ T cells and non-responding patients to anti-PD-1 therapy have increased CD47/TSP1 expression, we targeted CD47 in combination with anti-PD-1 in a melanoma model. Targeting CD47 in combination with anti-PD-1 treatment further decreased tumor burden compared with monotherapy and control.
Conclusion CD47/TSP1 expression could serve as a marker to predict patient response to immune checkpoint blockade treatment, and targeting this pathway may preserve T cell activation, proliferation, effector function, and bioenergetics to reduce tumor burden as a monotherapy or in combination with anti-PD-1.
- melanoma
- adaptive immunity
- metabolic networks and pathways
- immunotherapy
Data availability statement
Data sharing not applicable as no datasets generated and/or analysed for this study.
This is an open access article distributed in accordance with the Creative Commons Attribution Non Commercial (CC BY-NC 4.0) license, which permits others to distribute, remix, adapt, build upon this work non-commercially, and license their derivative works on different terms, provided the original work is properly cited, appropriate credit is given, any changes made indicated, and the use is non-commercial. See http://creativecommons.org/licenses/by-nc/4.0/.
Statistics from Altmetric.com
WHAT IS ALREADY KNOWN ON THIS TOPIC
Clinical success is observed for melanoma patients receiving anti-PD-1 therapy; however, only a small subset of patients have a durable response to this therapy. Therefore, biomarkers and targeted therapies are needed to predict and enhance therapeutic responses, respectively, to improve the survival of patients. CD47, an emerging innate and adaptive immune checkpoint, is an intriguing therapeutic target as our data shows its novel role in cytotoxic (CD8+) T cell antitumor response when interacting with its ligand thrombospondin-1 (TSP1).
WHAT THIS STUDY ADDS
This work demonstrates that CD47 signaling affects adaptive immune responses by interaction with its high affinity ligand TSP1, thus demonstrating effects beyond the modulation of phagocytocis when binding SIRPα. Our studies show that CD47 and TSP1 expression in the tumor microenvironment is correlated with malignancy in melanoma patient biopsies. The blockade of CD47 decreases tumor burden in a preclinical tumor model, which is associated with increased tumor oxygenation and CD8+ T cell tumor infiltration. CD47 ligation by TSP1 on CD8+ T cells reduces activation, antigen-mediated cytotoxicity of melanoma cells, and metabolic reprogramming; however, these processes are reversed through the blockade of CD47, suggesting a receptor-mediated mechanism for the development of therapeutic resistance. In a melanoma patient cohort receiving anti-PD-1 therapy, TSP1 gene and protein expression and CD47 expressing circulating CD8+ T cells are increased in non-responding patients compared with responding patients, suggesting a potential role of this signaling axis in responding patients therapeutic resistance. Therefore, we demonstrate in a second preclinical tumor model that the blockade of CD47 enhanced anti-PD-1 treatment, supporting that CD47 blockade may be at the center of therapeutic resistance to anti-PD-1.
HOW THIS STUDY MIGHT AFFECT RESEARCH, PRACTICE, OR POLICY
Our studies show that CD47 and TSP1 expression in the tumor microenvironment correlates with malignancy in melanoma patient biopsies. Furthermore, our data demonstrates that this signaling axis may be a predictive biomarker for melanoma patient response to anti-PD-1 treatment. Additionaly, blockade of CD47 sensitizes melanoma tumors to anti-PD-1 therapy to further enhance efficacy and decrease tumor burden.
Background
Cancer immunotherapies, such as the Federal Drug Administration (FDA)-approved immune checkpoint inhibitors, are currently used in the clinic to enhance anticancer immunosurveillance. Although these therapies are revolutionary, only 20% of melanoma patients respond to these treatments.1 2 Therefore, new biomarkers and targeted therapeutics are needed to predict and improve patient response to immune checkpoint blockade therapies.
One reason for this lack of response associated with immune checkpoint blockade is the metabolic state of immune cells, specifically T cells, that these therapies are targeting.3 The metabolic state of a T cell alters based on its particular phenotype. Naïve T cells differentiate to a cytotoxic phenotype by shifting from oxidative phosphorylation to aerobic glycolysis.4–7 This metabolic reprogramming allows cytotoxic (CD8+) T cells to have increased proliferation, cytokine production, and antitumor function.7 However, many tumor microenvironment factors, like hypoxia, leave T cells incapable of performing these metabolic processes and obtain an ‘exhausted-like’ phenotype, potentially impairing their ability to respond to immune checkpoint blockade treatments.8 Therefore, targeted therapies to sustain CD8+ T cell metabolism within the tumor microenvironment are needed to improve response to immune checkpoint blockade therapies.
CD47 is a type I integral membrane protein located in both T cells and cancer cells.9 Its overexpression in tumor tissue allows bypassing of anti-tumor ssing of anti-tumor immunosurveillance by interacting with the innate immune cell counterreceptor signal regulatory protein alpha (SIRPα).10 Previous studies have shown that the upregulation of CD47 in both hematological and solid tumor cancers is correlated with a decrease in patient survival.11 12 CD47 can also be ligated on T cells by the matricellular glycoprotein thrombospondin-1 (TSP1).9 13 This can lead to a cascade of signaling events, including the inhibition of T cell activation and differentiation along with inducing cell death.14–17 Therefore, CD47 activation is beneficial for the proliferation and survival of cancer cells while detrimental to T cell antitumor function and overall survival.
To provide insight into potential therapeutics for patients with cancer, researchers continue to examine the impact CD47 expression has on immune cell antitumor function and metabolism. Previous studies have shown in a fibrosarcoma mouse model that targeting CD47 as a monotherapy or in combination with irradiation mediates a decrease in tumor burden due to an increase of intratumoral antitumor CD8+ T cells.18 However, it is still unknown how targeting CD47 enhances CD8+ T cell antitumor effector function. In an irradiated stress-induced environment, T cells lacking CD47 expression improved glucose uptake and metabolism and enhanced mitochondria function, biogenesis, and oxygen consumption.19 20 The alterations in T cell metabolism mediated by CD47 and its impact on the antitumor function within the tumor microenvironment is unexplored.
Due to the low response rate associated with immune checkpoint blockade therapies for patients with cancer, we examined potential biomarkers and therapeutic targets to predict and improve patient CD8+ T cell response to immune checkpoint blockade therapies. We observed increased expression of CD47 and TSP1 within the tumor microenvironment of human melanoma tissue compared with benign tissue. Due to this increase in CD47/TSP1 expression within the tumor microenvironment observed, a mouse melanoma model was utilized to determine how targeting CD47 impacted tumor burden. Targeting CD47 decreased tumor burden due to increased intratumoral oxygenation and granzyme B secreting CD8+ T cells. Additionally, TSP1 decreased CD8+ T cell activation, effector function, and glycolytic rate; however, targeting CD47 allowed CD8+ T cells to overcome TSP1 ligation and sustain function. We also identified that non-responding melanoma patients to programmed cell death protein 1 (PD-1) therapy have increased CD47 expressing T cells and circulating levels of TSP1 compared with responding patients, signifying potential biomarkers for therapeutic response. Since non-responding patients to anti-PD-1 therapy have increased CD47 and TSP1 expression and TSP1 ligation of CD47 has negative implications on CD8+ T cells and potentially impacts their response to immune checkpoint blockade therapies, we performed a syngeneic melanoma model to observe how targeting CD47 in combination with anti-PD-1 therapy would impact tumor burden. Combining these therapies improved therapeutic response and further decreased tumor burden, signifying CD47 as a potential therapeutic target to enhance response to immune checkpoint blockade therapies.
Methods
Immunohistochemistry
A human microarray containing primary melanoma tumor tissue (n=62), metastatic melanoma tumor tissue (n=22), and benign (n=16) tissue were examined for CD47 and TSP1 expression (Biomax, Cat #ME1004H, Derwood, Maryland, USA). Additionally, B16.F10 (B16) mouse melanoma tumors were analyzed for granzyme B and carbonic anhydrase expression. Tumors were harvested, fixed in 4% paraformaldehyde, and embedded in paraffin. 5 µm tumor tissue sections were created with a microtome. The microarray and B16 melanoma tumors underwent DAB staining according to the manufacturer’s protocol (Dako Envision Dual Linked System HRP, Catalog #K4065). The microarray was stained with anti-human CD47 (eBioscience anti-human CD47, Clone B6H12, Ref #14047982, Lot # 4281568) at a 1:100 dilution and anti-human TSP1 (TSP1- (A6.1) Santa Cruz, sc-59887, Lot # C2514) at 1:250 dilution while the B16 melanoma tumors were strained with 1:100 anti-mouse granzyme B (Thermo Scientific, Product # PA1-37799, Lot # PA1813162) and 1:150 carbonic anhydrase IX/CA9 antibody (Novus Biologics, Catalog # NB100-417, Lot #AJ). All slides were mounted in Cytoseal XYL (Thermo Scientific, Ref # 8312–4).
B16 and YUMM1.7 melanoma tumors were also examined for CD8+ T cell infiltration. Sections were deparaffinized with xylene three times for 5 minutes (min) and rehydrated with 100% ethanol two times for 5 min, 95% ethanol for 3 min, and 70% ethanol for 3 min. Antigen retrieval was performed with 1x citrate buffer. Sections were stained with BioLegend (San Diego, California, USA) fluorescent antibodies for anti-mouse CD3 (APC (red), Clone #172A, Catalog #100235), anti-mouse CD8 (Alexa Fluor 488 (green), Clone #53-6.7, Catalog #100726)) and DAPI (blue) to denote nuclei (Thermo Scientific Ref # 62248, Lot # VG3036772). Cells were counted as CD8+ T cells if CD3 and CD8 antibodies were co-localized (yellow). All slides were mounted with ProLong Gold Antifade Mountant (ThermoFisher, Catalog #P36930).The Olympus BX43 microscope was used to obtain images while the PerkinElmer Mantra and inform software performed analysis to determine CD47 positive tumor cells and TSP1 expression on the microarray and intratumoral granzyme B secreting CD8+ T cells and carbonic anhydrase expression in the B16 melanoma tumors.
In vivo mouse melanoma syngeneic tumor models
Syngeneic B16 or YUMM1.7 mouse melanoma models were performed to examine tumor ablation by targeting CD47 as a monotherapy. The B16 melanoma model was further examined to determine the effects of CD47 blockade in combination with anti-PD-1 therapy. Subcutaneous injections of 5×10⁵ mouse B16 or YUMM1.7 melanoma cells occurred into the outer hind limb of 6–8 weeks old C57Bl/6 mice (Jackson Laboratory). When tumors reached 100 mm3, treatments began for each study. To determine the effect of targeting CD47 on tumor burden, mice received three intraperitoneal treatments of 10 µM CD47 antisense morpholino (CD47(-), Gene Tools, Philomath, OR) or saline over 18–21 days (n=–8/group) (online supplemental figure 1A; figure 2A). Targeting CD47 with antisense morpholino decreases its protein expression within B16 melanoma tumors (online supplemental figure 2C). To determine the impact of targeting CD47 in combination with anti-PD-1 treatment on tumor burden, mice received alternating day intraperitoneal treatments of 10 µM CD47(-) and/or 200 µg anti-PD-1 (anti-mouse PD-1 (CD279), Bio X Cell, Cat #BE00332, Lot#705218N1) over 6 days (n=5/group) 5. Tumor volume (LW2/2, where W=shortest diameter of tumor and L=longest diameter of tumor) was determined by measuring the tumor with calipers every 3 days, while wet tumor weight was determined at the end of the study. Mice were euthanized at the end of the study or when tumor volume reached 1500 mm3.
Supplemental material
Supplemental material
Three-dimensional assessment of melanoma tumor oxygenation and vascularity
Tumor oxygenation was determined by ultrasound-guided photoacoustic imaging (PAI) with the Vevo LAZR instrument (Fujifilm VisualSonics, Toronto, Canada) as previously described.21 Mice were anesthetized with 1.5% isoflurane and placed on a heated platform for PAI. Heart rate was monitored by the electrodes and kept constant throughout the procedure at 350–400 beats per minute in all mice. A depilatory cream removed the hair from the imaging area (Nair, Church & Dwight). Three-dimensional (3D) mode was used for imaging, allowing recording a PAI signal from the whole tumor using a step size of 0.2 mm and a 40 dB gain setting. Imaging protocols were standardized to optimize experimental conditions by limiting background noise, standardizing the amplitude of the PAI signal, and keeping the imaging depth consistent among all scanned mice. Data analysis was performed with the Vevo 2100 LAZR software tools (HemoMeaZure and OxyZated) that allow a coregistration of the PAI signal from hemoglobin with an anatomic view of the tumor in real-time and enable the calculation of mean oxygen saturation (sO2) concentration throughout the tissue. The concentration of sO2 was determined in the whole tissue. Tumor vascularity was determined using Power Doppler Mode in conjunction with a 3D- Mode using a step size of 0.2 mm and a 37 dB gain setting. Vevo CQ software was used to calculate the percent of tumor vascularity, defined as an index of relative vascular density within a tumor volume.
Isolation of primary cytotoxic T cell
Primary CD8+ T cells were derived from the spleens of three different mice: C57Bl/6 wild type (WT), cd47 null (cd47-/-, B6.129S7-Cd47tm1Fpl/J, JAX stock #003173), and Pmel-1 transgenic mice (B6.Cg-Thy1a/Cy Tg(TcraTcrb)8Rest/J, JAX stock #005023). The CD8+ T cells derived from WT mice express CD47 while cd47-/- CD8+ T cells lack CD47 expression due to a heterogeneous mutant allele.22 Pmel-1 transgenic mice have CD8+ T cells with a rearranged T cell receptor specific for gp100, a peptide fragment of the Pmel-1 antigen expressed on B16 melanoma cells (online supplemental figure 2A,B).23 24 All mice were obtained from Jackson Laboratories at 6–8 weeks old. To get CD8+ T cells, the spleen was harvested and placed into a single-cell suspension within a Hanks' Balanced Salt Solution (HBSS) solution containing Phosphate-buffered saline (PBS), 3% FBS, and 10 µM EDTA. Red blood cells (RBC) were lysed with 1 x RBC lysis buffer (BioLegend, San Diego, California, USA, Category # 420301). CD8+ T cells were magnetically isolated by the MagniSort mouse CD8 T cell Enrichment Kit (ThermoFisher, Carlsbad, CA, Catalog #8804-6822) from WT and cd47-/- splenocytes according to the manufacturer’s protocol. For Pmel-1 CD8+ T cells, splenocytes were expanded in suspension for 5 days with 30 units of IL-2 (ThermoFisher, Catalog #PHC0023) and 1 µM gp100 (AnaSpec, Fremont, California, USA, Catalog #AS-62589) to promote CD8+ T cell differentiation and proliferation (online supplemental figure 2E).25 26 Cells were maintained in T cell media containing RPMI, 2 mM L-glutamine, 1% penicillin/streptomycin, 1 mM sodium pyruvate, 1% non-essential amino acids, 10 µM HEPES, 50 µM BME, 10% HyClone FBS at 37°C with 5% CO2.
T cell activation assay
Once Pmel-1 CD8+ T cells were isolated, as discussed above, cells were centrifuged at 300 g for 5 min, and the supernatant was aspirated. Pmel-1 CD8+ T cells were stained with 5 µM carboxyfluorescein succinimidyl ester (CFSE, BioLegend, San Diego, California, USA, Catalog #423801) for 20 min at room temperature with protection from light. This fluorescent dye can trace the division of cells through flow cytometry. 5x the volume of T cell media was added to the Pmel-1 CD8+ T cells to quench the CFSE stain. Pmel-1 CD8+ T cells were centrifuged at 300 g for 5 min. The supernatant was aspirated, resuspended in T cell media, and treated with 30 units of IL-2 and 1 µM gp100 to induce antigen-mediated activation. Pmel-1 CD8+ T cells were treated with 10 µM CD47(-), 3 µl/mL endoporter and/or 10 nM TSP1 and incubated for 72 hours at 37°C with 5% CO2 with protection from light. After 72 hours, flow cytometry was performed on the BD-FACS Calibur Analyzer and analyzed in FCS Express software to examine Pmel-1 CD8+ T cell proliferation.
In vitro cytotoxic T lymphocyte assay
An antigen-mediated cytotoxic T lymphocyte (CTL) assay was performed in the xCELLigence Real-Time Cell Analysis(RTCA) system (Agilent, Santa Clara, CA) system to measure Pmel-1 CD8 +T cell killing of B16 melanoma cells as described.26 Adherent B16 cells were cultured and maintained with RPMI containing 2 mM L-glutamine, 10% FBS, and 1% penicillin/streptomycin at 37°C with 5% CO2, while Pmel-1 CD8+ T cells were obtained and cultured as described above. Target (T) B16 cells were seeded and grown at 37°C with 5% CO2. Effector (E) Pmel-1 CD8+ T cells were activated with 1 µM gp100 and treated with 10 µM CD47(-), 10 µM control morpholino (CTRL (-)) and/or 10 nM TSP1. Target cell viability was measured through the xCELLigence RTCA system (Agilent, Santa Clara, CA) and calculated as a normalized cell index and percent of cytolysis. Results were compared with CTRL (-), which caused no significant differences in Pmel-1 CD8+ T cell cytolytic activity from the control (online supplemental figure 2F).
Cell respiratory measurements of cytotoxic T cells
The Seahorse XF96 analyzer was used to determine the glycolytic flux of T cells based on CD47 expression. We examined Jurkat T cells with and without (CD47-) CD47 expression, WT, cd47-/- primary CD8+ T cells, and Pmel-1 WT and CD47 (CD47(-)) targeted CD8+ T cells. Glycolytic flux of WT and CD47- Jurkat T cells was determined by counting and adhering 300,000 cells to the Seahorse plate with polylysine-D and performing sequential injections of 10 mM glucose, 1 µM oligomycin, and 50 mM 2 Deoxy-D-glucose (2-DG). As described above, WT, cd47-/-, and Pmel-1 CD8+ T cells were isolated. T cells were cultured in Seahorse plates coated with Cell Tak (Corning, Catalog # 354240) and seeded with 1,000,000 cells. The glycolytic flux of activated WT and cd47-/- CD8+ T cells was determined by sequential injections of 10 mM glucose, Dynabeads mouse T activator CD3/CD28 at a 1:1 cell to Dynabead ratio (ThermoFisher, Catalog #11 456D), 1 µM oligomycin and 50 mM 2-DG. Pmel-1 CD8+ T cells were pretreated with 10 μM CD47(-) and/or 10 nM TSP1 to undergo a Seahorse Mito Stress test where extracellular acidification rate (ECAR) was quantified before inhibitor injections. The measurements from these assays are expressed as ECAR and analysis was performed on the Wave software.
Single-cell RNA-sequencing of human melanoma patient peripheral blood mononuclear cells
Peripheral blood mononuclear cells (PBMC) and plasma were processed from the blood of human melanoma patients. Patient participation corresponded with clinical evaluation and consent under IRB-approved protocol. Blood was obtained and placed into an EDTA treated vacutainer tube (BD, Catalog #B2970-48). Blood was processed to obtain plasma and PBMC as previously described.27 PBMC was maintained with RPMI containing 2 mM L-glutamine, 10% FBS, and 1% penicillin-streptomycin at 37°C with 5% CO2.
Once PBMC were isolated, single-cell RNA-sequencing (scRNA-seq) was performed using a 10 x genomics system.27 PBMC went through single-cell analysis, and results were displayed as clusters based on immune cell population: NK cells (NKG7+, CD56+), T lymphocytes (CD3+, CD28+), B cells (CD19+, CD40+), and monocytes (CD68+, CD163+) (online supplemental figure 3A).
TSP1 ELISA of human melanoma patient plasma
Plasma was obtained and processed from the blood of melanoma patients pre and post anti-PD-1 therapy, as described above. The plasma underwent a human TSP1 Quantikine ELISA (R&D Systems, Catalog #DTSP10, Minneapolis, Minnesota USA) assay according to the manufacture protocol to determine the concentration (ng/mL) of circulating TSP1.
Flow cytometry
To examine different cell populations within human melanoma patient PBMC and mouse Pmel-1 splenocytes, cell surface flow cytometry was performed as previously described.27 Human melanoma patient PBMC were stained with the following anti-human antibodies from BD: Fixable Viability Stain 575V, CD3 APC-R700, CD19 APC-H7, CD47 APC, PD-1 BV 421, and CD8 BUV496. Pmel-1 splenocytes were stained with dilutions of the following anti-mouse antibodies from BD: CD19 BV421, Fixable Viability Stain 575V, CD64 BV786, CD8a APC-H7, and CD3 BUV496. Flow cytometry was performed on the BD LSRFortessa X-20 Analyzer, and analysis was performed on FCS Express software (online supplemental figures 3C and 3D).
Statistics
Differences between groups for T cell activation and CTL assays were analyzed by analysis of variance (ANOVA) followed by Fischer’s LSD tests. In vivo studies were analyzed using repeated-measures ANOVA, with SD. Unpaired t-test was used to analyze the differences between two groups. Results are represented as the mean±SEM and are considered significant if *p<0.05. Statistical analysis was performed on GraphPad Prism.
Results
Elevated CD47 and TSP1 expression within human melanoma tumors
CD47 expression on cancer cells and secretion of TSP1 in the tumor microenvironment can be detrimental to immune cell antitumor response.10 14–16 Therefore, we examined the expression of CD47 and TSP1 within human melanoma tumor tissue. We observed an increase in both CD47 and TSP1 within the tumor microenvironment of human malignant melanoma tissue compared with normal, benign tissue (figure 1A–C). Furthermore, CD47 and TSP1 expression increased within the tumor microenvironment as the disease progressed from primary to metastatic (figure 1A and D–E).
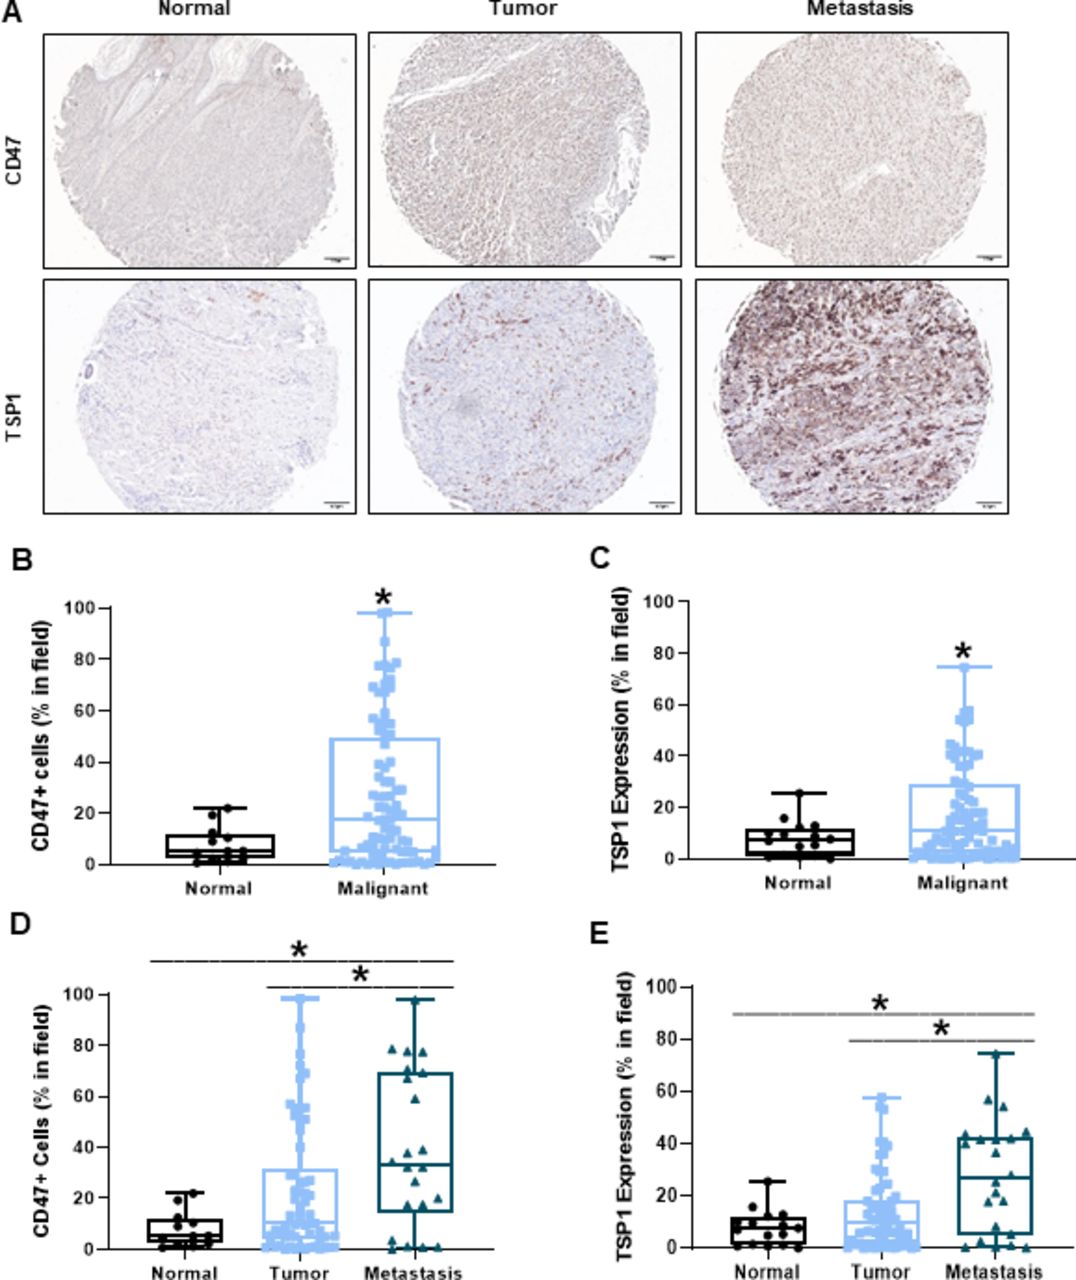
Increased CD47 and TSP1 expression within the tumor microenvironment of human melanoma tissue. (A) Representative images of human normal, primary melanoma tumor and metastatic melanoma tumor tissue. (B) CD47 and (C) TSP1 expression was compared between the normal and malignant tumor microenvironment of these tissues. Additionally, (D) CD47 and (E) TSP1 expression was compared in the tumor microenvironment as disease progressed from primary to metastatic tumor. Images were obtained through light microscopy on the Olympus BX43 microscope and analyzed on the PerkinElmer Mantra and inform software. (*p<0.05, n=96–100). TSP1, thrombospondin-1.
Targeting CD47 decreases melanoma tumor burden due to increased intratumoral oxygenation and cytotoxic T cells
Blockade of CD47 in combination with irradiation reduced tumor burden in a mouse 15-12RM fibrosarcoma model due to increased tumor-infiltrating CD8+ T cells.18 Therefore, we examined if targeting CD47 reduced tumor burden in a syngeneic mouse melanoma model figure 2A. C57Bl/6 mice received subcutaneous injections of B16 melanoma cells into their hind limb. Three intraperitoneal treatments of CD47(-) or saline occurred over 21 days once tumors reached 100 mm3 (Figure 2A). Blockade of CD47 resulted in a significant reduction of both tumor volume and weight compared with WT tumors (figure 2B,C). A similar decrease in tumor growth by CD47 blockade was observed in mice that received a subcutaneous injection of the Braf mutated YUMM1.7 melanoma cell line (online supplemental figure 1A).
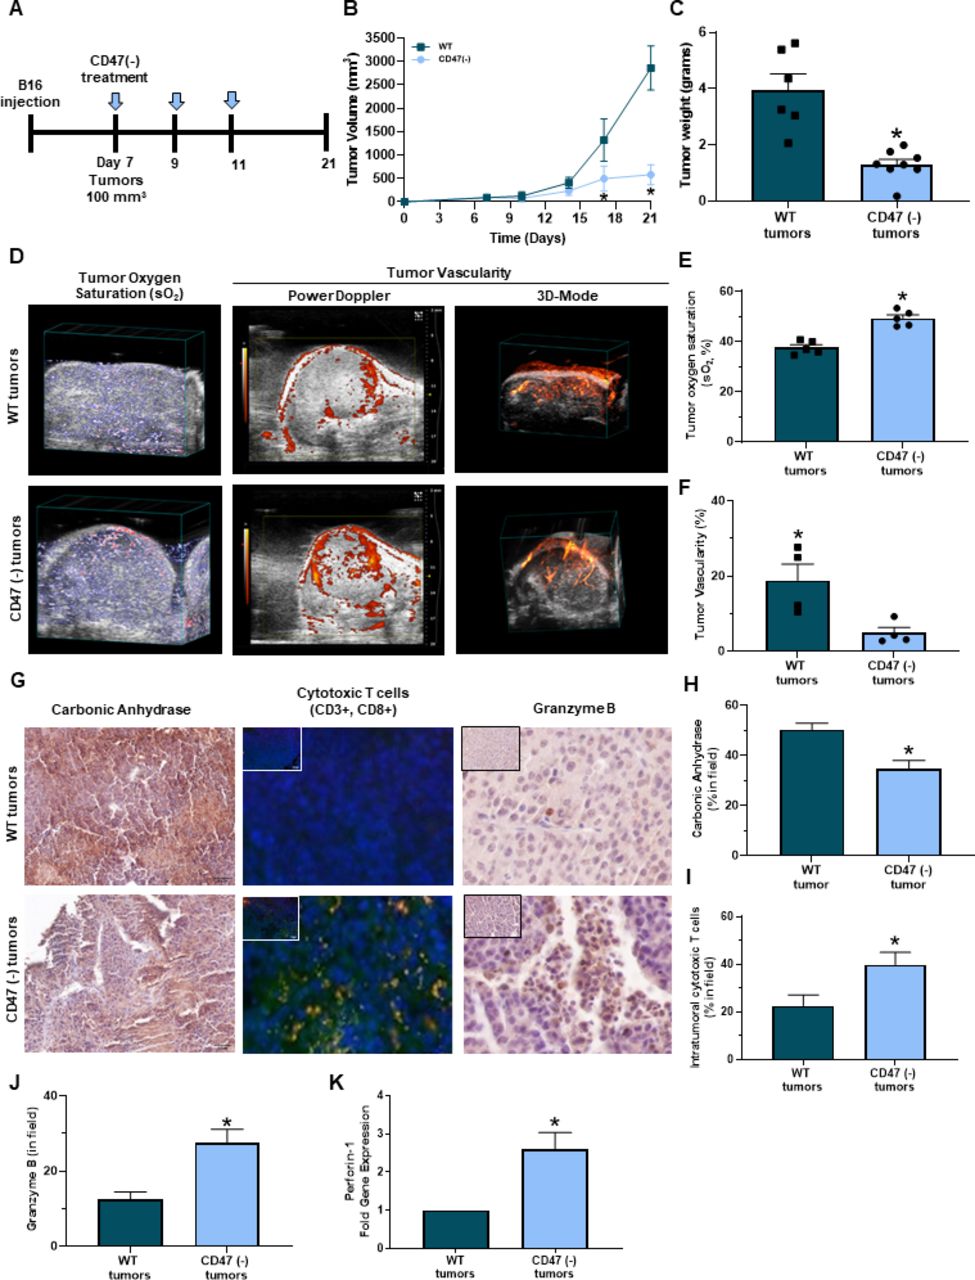
Targeting CD47 decreases melanoma tumor burden in vivo. (A) Schematic of the in vivo syngeneic mouse melanoma treatment regimen. C57Bl/6 mice were injected subcutaneously with B16 melanoma cells into the hind flank. Once tumors reached 100 mm3, intraperitoneal injections of 10 uM CD47 morpholino (CD47(-)) or saline began once a week for 3 weeks. (B) Tumor volume was determined throughout the study (LW2/2). (C) Mice were euthanized at the end of the study (day 21) or when tumor volume reached 1500 mm3 where tumor weight was determined (*p<0.05, n=6–8/group). (D) Representative PAI imaging for tumor sO2 along with Power Doppler in 3D-Mode to determine tumor vascularity. (E) Tumor sO2 was quantified with the Vevo 2100 LAZR software tools while (F) tumor vascularity was quantified with Vevo CQ software of WT and CD47 targeted tumors (*p<0.05, n=4–5/group). (G) Representative immunohistochemistry images of tumor sections for (H) carbonic anhydrase, (I) intratumoral cytotoxic (yellow cells due to colocalization of CD3+ (red, APC) and CD8+ (green, FITC) T cells and (J) granzyme B (*p<0.05, n=4–5/group). Images were obtained at 20x magnification with the Olympus BX43 microscope and quantified using the PerkinElmer Mantra and inform analysis. (K) Gene expression of perforin-1 was determined through RT-qPCR of tumors (*p<0.05, n=4–5/group). PAI, photoacoustic imaging; WT, wild type.
Hypoxia can have detrimental effects on the activation, proliferation, and antitumor function of CD8+ T cells within the tumor microenvironment, inhibiting the cytolysis of cancer cells.28–32 PAI imaging was performed to observe if targeting CD47 impacted oxygenation within B16 melanoma tumors. CD47 targeted tumors had greater sO2 compared with WT tumors (figure 2D left panel,F). However, Power Doppler and 3D mode revealed that CD47 targeted tumors decreased percent vascularity compared with WT tumors (figure 2D middle/right panel,F). Therefore, tumor vascularity may not be not responsible for increasing oxygenation within these CD47 targeted tumors. We next observed that Carbonic anhydrase expression was decreased in CD47 targeted tumors compared with WT tumors (figure 2G,left panel,H). Thus validating increased tumor oxygenation mediated by CD47 expression Additionally, tumor sections were stained with antibodies to examine intratumoral CD8+ T cells through immunofluorescence. An increase in CD8+ T cells was observed in B16 and YUMM1.7 CD47 targeted tumors compared with WT control tumors (figure 2G middle panel,I, online supplemental figure 1B). Additionally, the CD8+ T cells within the CD47 targeted tumors had increased granzyme B immunoreactivity and perforin-1 gene expression acompared with WT tumors (figure 2G right panel,J-K).
Targeting CD47 enhances cytotoxic T cell activation and proliferation when exposed to TSP1
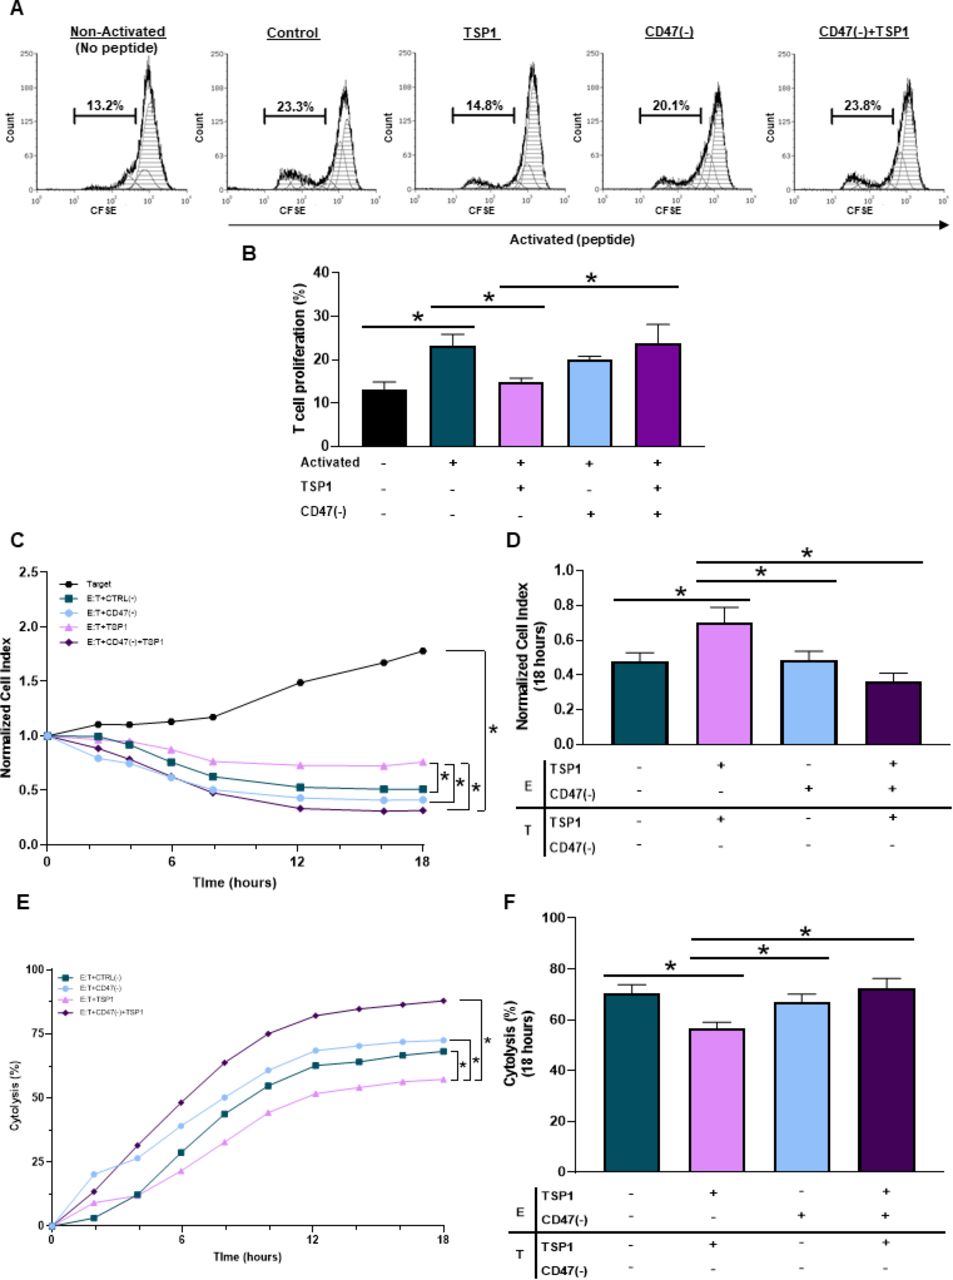
Ligation of CD47 through TSP1 impairs T cell activation.14 15 33 However, the use of peptide 4N1K derived from the COOH-terminal of TSP1 does not represent the full TSP1 structure and is known to have off-target effects not associated with TSP1.34 Therefore, we performed our studies using a physiologically relevant, fully structured recombinant TSP1 to examine how CD47 ligation by TSP1 impacts T cell activation and proliferation. When Pmel-1 CD8+ T cells were exposed to TSP1, a decrease in activation and proliferation occurred (figure 3A,B). Pmel-1 CD8+ T cells were then treated with CD47(-) to decrease CD47 protein expression (online supplemental figure 2D). Although targeting CD47 had no significant impact on T cell activation or proliferation, CD47 targeted Pmel-1 CD8+ T cells exposed to TSP1 continued to activate and proliferate (figure 3A,B). Therefore, CD47 targeted Pmel-1 CD8+ T cells were able to overcome the inhibitory effects of the TSP1 interaction.

CD47 expression regulates cytotoxic T cell activation, proliferation and antitumor function. (A, B) Pmel-1 CD8+ T cells were stained with CFSE stain to determine if CD47 expression and TSP1 exposure impacted their activation and proliferation through flow cytometry. The BD LSRFortessa X-20 Analyzer was used to acquire data, while FCS Express was used for analysis (*p<0.05, n=3). To determine if CD47 expression and TSP1 exposure impact CD8+ T cell antitumor function, effector (E) Pmel-1 CD8+ T cells were cocultured with target (T) B16 melanoma cells after stimulation with IL-2 and gp100 peptide. Target cell viability was dynamically monitored by surface impedance and presented as (C, D) normalized cell index and (E, F) percent of cytolysis at 18 hours after adding effector Pmel-1 CD8+ T cells (*p<0.05, n=3). CFSE, carboxyfluorescein succinimidyl ester; TSP1, thrombospondin-1.
The antitumor function of TSP1 exposed cytotoxic T cells improved by targeting CD47
Since CD47 ligation by TSP1 had detrimental effects on T cell activation and proliferation, we examined how TSP1 would impact T cell antitumor function. Effector (E) Pmel-1 CD8+ T cells were cocultured with target (T) B16 melanoma cells to examine target cell viability through normalized cell index and percent cytolysis quantifications. Pmel-1 CD8+ T cells exposed to TSP1 had decreased cytolytic activity against the B16 cells compared with the control (figure 3C,F), allowing B16 melanoma cells to continue to grow and increase target cell index (figure 3C,D). It should be noted that TSP1 had no impact on B16 melanoma cell viability, validating that TSP1 limits CD8+ T cell effector function through its interaction with CD47 (online supplemental figure 2G). Additionally, targeting CD47 had no significant impact on Pmel-1 CD8+ T cell antitumor function compared with control Pmel-1 CD8+ T cells (figure 3C–F). However, CD47 targeted Pmel-1 CD8+ T cells exposed to TSP1 continued their cytolytic activity against B16 melanoma cells (figure 3E,F), causing target cell index to decrease (figure 3C,D).
CD47 expression regulates glycolysis of cytotoxic T cells exposed to TSP1
T cells lacking CD47 expression have enhanced bioenergetics compared with CD47 expressing T cells under an irradiated stressed-induced environment.19 Therefore, we examined how CD47 expression impacted the bioenergetics of T cells, specifically glycolysis of CD8+ T cells as activated T cells shift from oxidative phosphorylation to glycolysis to obtain a cytotoxic phenotype with antitumor functionalities.4–7 CD47- Jurkat T cells had an increase in ECAR compared with WT Jurkat T cells (figure 4A). When further quantified, CD47- Jurkat T cells had an increase in both the rate and overall glycolysis compared with WT Jurkat T cells (figure 4B,C). We next examined how CD47 expression impacts glycolysis of activating CD8+ T cells. Pre activation, cd47-/- CD8+ T cells had increased glycolytic rate compared with WT CD8+ T cells, validating the results above in primary CD8+ T cells (figure 4D,E). Successively, once the CD8+ T cells were activated, the ECAR and glycolytic rate continued to increase in cd47-/- CD8+ T cells compared with WT CD8+ T cells (figure 4D,E). Lastly, we observed the impact of TSP1 on glycolysis of antigen-mediated activation of Pmel-1 CD8+ T cells. Targeting CD47 increased ECAR of Pmel-1 CD8+ T cells compared with control Pmel-1 CD8+ T cells (figure 4F). On the other hand, Pmel-1 CD8+ T cells exposed to TSP1 had a decrease in ECAR compared with control Pmel-1 CD8+ T cells (figure 4F). However, glycolysis was restored in CD47 targeted Pmel-1 CD8+ T cells exposed to TSP1 as increased ECAR was observed compared with TSP1 treated Pmel-1 CD8+ T cells (figure 4F).
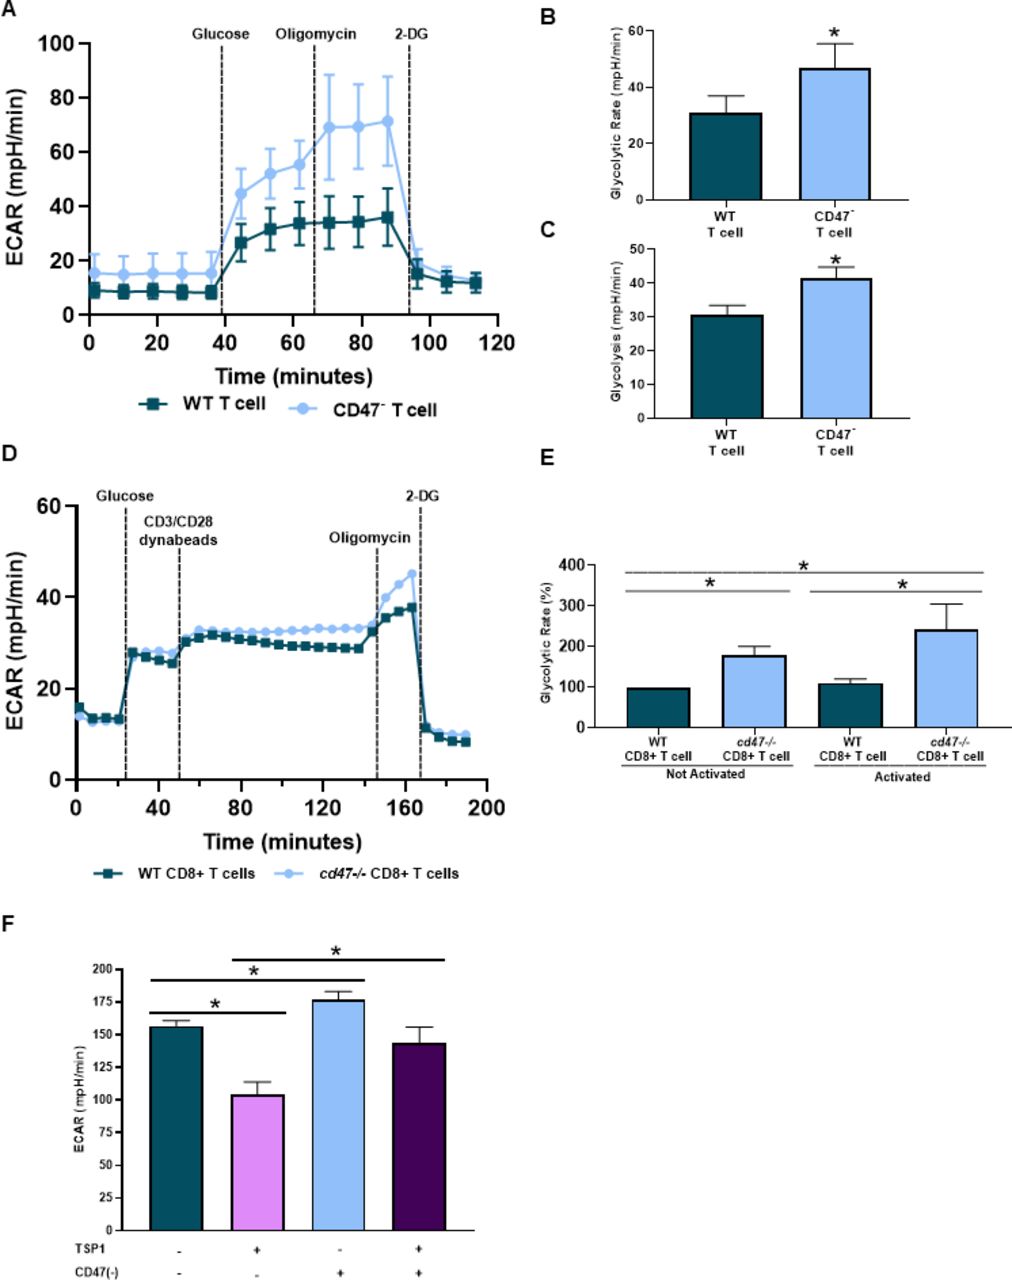
CD47 expression regulates cytotoxic T cell bioenergetics. Cell respiratory measurements were acquired to determine the impact of CD47 on glycolysis of (A–C) WT and CD47- Jurkat T cells, (D, E) naïve and activated WT and cd47-/- CD8+ T cells and (F) WT and CD47 targeted (CD47(-)) Pmel-1 CD8+ T cells exposed to TSP1 (*p<0.05, n=3). ECAR, extracellular acidification rate; TSP1, thrombospondin-1; WT, wild type.
Elevated TSP1 and CD47 expression in human melanoma patients receiving immune checkpoint blockade therapy
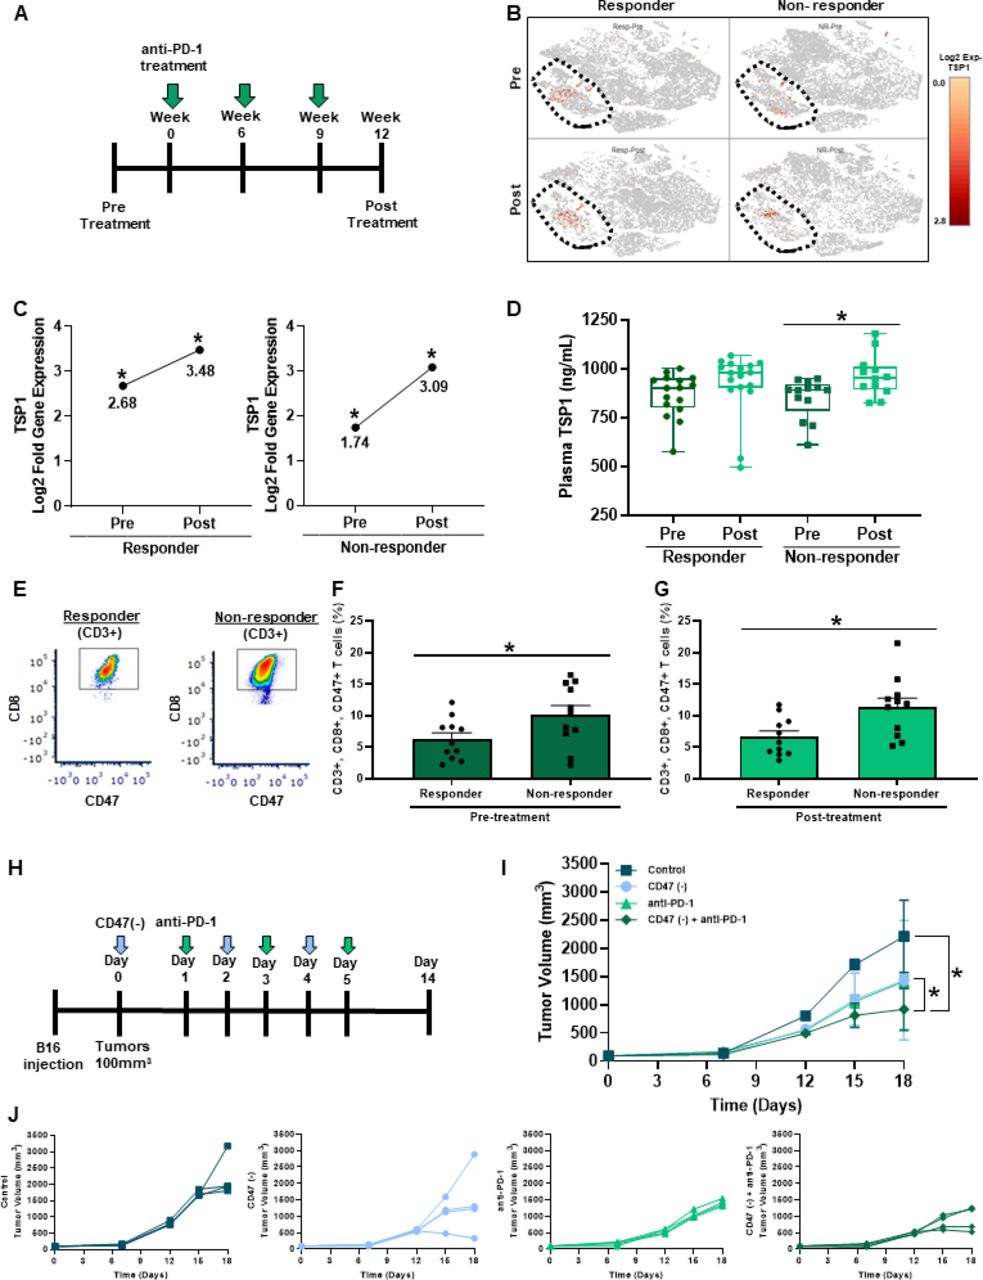
Biomarkers are needed to predict patient response to immune checkpoint blockade therapies. Therefore, we examined the plasma and PBMC of a cohort of melanoma patients receiving anti-PD-1 treatment to determine if TSP1 and CD47 could be potential biomarkers of response (figure 5A). scRNA-seq of PBMC displayed increased gene expression of TSP1 located in the circulating monocyte cell population (CD68+, CD163+) of both responding and non-responding patients receiving anti-PD-1 therapy (figure 5B). Although TSP1 gene expression shifted in both patient populations after the first cycle of anti-PD-1 therapy, the non-responding patient cohort had a two-fold increase in TSP1 gene expression (figure 5C). This was further validated by examining circulating TSP1 protein levels in the plasma of this patient cohort, where non-responding patients had a significant increase in TSP1 protein levels post-therapy while responding patients did not (figure 5D).
Targeting CD47 in combination with anti-PD-1 therapy decreases melanoma tumor burden in vivo. (A) Schematic of the melanoma patient cohort therapy regimen. (B, C) scRNA-seq was performed through a 10x genomics system on patient PBMC pre-anti-PD-1 and post-anti-PD-1 therapy (*p<0.05, n=16 (4/group)). (D) Circulating TSP1 was determined through ELISA of human patient plasma pre and post-anti-PD-1 therapy (*p<0.05, n=11–16/group). (E) Patient PBMC stained with antibodies for human CD3, CD8, and CD47 to determine CD47 expression on T cells (F) pre-anti-PD-1 and (G) post-anti-PD-1 therapy through flow cytometry. Data were acquired using BD LSRFortessa X-20 Analyzer and analyzed using FCS Express (*p<0.05, n=24). (H) Schematic of in vivo syngeneic mouse melanoma combination treatment regimen. C57Bl/6 mice were injected subcutaneously with B16 melanoma cells into the outer hind limb. Mice received alternating day intraperitoneal treatments of 10 µM CD47(-) and/or 200 µg anti-PD-1 or their controls over 6 days. (I, J) Tumors were measured three times a week to determine tumor volume (LW2/2). (*p<0.05, n=5). PBMC, peripheral blood mononuclear cells.
The expression of PD-L1/PD-1 can be valuable in predicting clinical outcomes; however, its utility remains inconsistent.35 We examined whether the expression of PD-1 on peripheral CD8+ T cells was associated with response by flow cytometry analysis. Our data show that PD-1 expression is not significantly different by response in our patient cohort (online supplemental figure 3C). Since our data and others show that CD47 ligation by TSP1 negatively impacts T cells function14–17, we examined CD47 expression on circulating T cells in this patient cohort. Through flow cytometry analysis, we observed that in pre-anti-PD-1 and post-anti-PD-1 treatment, non-responding patients had significantly increased CD47 expression on their T cells, specifically CD8+ T cells, compared with responding patients (figure 5E–G). The coexpression of CD47 and PD-1 was not found to be associated with response (online supplemental figure 3D). Taking together the data on TSP1 and CD47 expression suggests that these two proteins may be able to serve as a potential biomarker of anti-PD-1 therapy response.
Targeting CD47 sensitizes melanoma tumors to anti-PD-1 therapy to decrease tumor burden
We demonstrated that the ligation of CD47 on CD8+ T cells by TSP1 impairs activation, proliferation, antitumor function, and bioenergetics. At the same time, non-responding melanoma patients to anti-PD-1 therapy had increased circulating levels of TSP1 and CD47 expressing T cells. Therefore, we wanted to examine the impact of targeting CD47 in combination with anti-PD-1 therapy on tumor burden through a syngeneic mouse melanoma model (figure 5H). B16 melanoma cells were subcutaneously injected into the hind limb of C57Bl/6 mice. Once tumors reached 100 mm3, alternating intraperitoneal injections of CD47(-) and/or anti-PD-1 were administered over 6 days. Blockade of CD47 or PD-1 individually resulted in significantly reduced tumor volume compared with the control (figure 5I,J). However, when these therapies were combined, a further reduction in tumor volume was observed compared with monotherapy and control (figure 5I,J).
Discussion
With the lack of response associated with immune checkpoint blockade therapies, we examined potential biomarkers and targeted therapies to improve CD8+ T cell function and response of melanoma patients receiving anti-PD-1 therapy. We demonstrated that human melanoma tissue has an increase in both CD47 and TSP1 within the tumor microenvironment, signifying intriguing therapeutic targets. Targeting CD47 in two different mouse melanoma models showed a significant decrease in tumor burden. This was partly due to an increase in intratumoral oxygenation and granzyme B secreting CD8+ T cells. We determined that the CD47/TSP1 signaling axis impairs T cell activation, proliferation, antitumor function, and bioenergetics. Additionally, we demonstrated that CD47 and TSP1 are potential biomarkers of melanoma patient response to anti-PD-1 therapy. Due to these observations, we performed a syngeneic mouse melanoma model and determined that targeting CD47 sensitizes B16 melanoma tumors to anti-PD-1 therapy, further decreasing tumor burden compared with the monotherapy and control. Overall, this study highlights potential biomarkers and targeted therapies through the CD47/TSP1 signaling axis to predict and improve immune checkpoint blockade response by improving CD8+ T cell function within the tumor microenvironment.
Increased expression of CD47 and/or TSP1 in the tumor microenvironment is correlated with a decrease in survival of patients with several types of cancer.11 12 36 Additionally, CD47 expressed on cancer cells can interact with its counterreceptor SIRPα on innate immune cells, resulting in ‘don’t eat me’ signals.10 This allows cancer cells to continue proliferating without immune cell interference and allows the disease to progress.10 Therefore, the increased CD47 expression we observed within the tumor microenvironment of melanoma tumors may further disguise cancer cells from immune cell recognition and antitumor function but need further investigation. Additionally, the increase in TSP1 expression of melanoma tumors may impede T cell antitumor function within the tumor microenvironment.
Targeting CD47 has decreased tumor burden combined with irradiation in a fibrosarcoma mouse model due to increased intratumoral CD8+ T cells with enhanced antitumor activity.18 Therefore, we wanted to examine how targeting CD47 would impact tumor burden in a melanoma model. We choose to target CD47 with oligonucleotide antisense morpholino due to its potential to be translated to the clinic as morpholinos have been FDA approved for Duchenne muscular dystrophy and used in clinical trials for prostate cancer.37 38 Additionally, antibodies targeting CD47 are designed to block the binding and signaling of SIRPα and not TSP1.39 Other groups have developed strategies such as a cyclic TAX2 peptide to inhibit TSP1/CD47 interaction.40–42 The data using TAX2 peptide supports our observations that TSP1 ligation of CD47 can support tumor growth and that inhibition of this interaction by treatment with this compound results in reducing tumor burden. Still, the effects of the TAX2 peptide on the SIRPα/CD47 signaling axis are not understood. Thus, the antisense morpholino is the only strategy that can limit the pro-tumorigenic effects of CD47 expression by limiting interactions with TSP1 and SIRPα.
Hipoxic tumors are often associated with low response rates to therapies and decreased overall survival of cancer patients.43 44 Therefore, we wanted to determine the impact of targeting CD47 on intratumoral oxygenation. Targeting CD47 increased oxygenation within tumors; however, this increase in oxygenation was not dependent on tumor vascularity as a decrease in percent vascularity was observed in CD47 targeted tumors compared with WT tumors. Therefore, CD47 mediates oxygenation within the tumor through a different mechanism. Hypoxia can regulate CD47 expression as it has a hypoxic response element in its promoter region.45 Therefore, we hypothesized that CD47 may regulate hypoxia through HIF release within the tumor microenvironment. We examined carbonic anhydrase expression, which is regulated by HIF and acts as a marker of hypoxia, and demonstrated its increase in WT tumors compared with CD47 targeted tumors.46 Due to this increase in oxygenation within the tumor, we examined intratumoral CD8+ T cells and their antitumor function. CD47 targeted tumors had increased intratumoral CD8+ T cells with enhanced antitumor function due to increased perforin-1 gene expression and granzyme B release compared with WT tumors. Overall, this in vivo data indicates that targeting CD47 increases tumor oxygenation, allowing an increase in intratumoral CD8+ T cells with enhanced antitumor function to ultimately decrease tumor burden.
The ligation of CD47 by TSP1 impairs T cell activation.14 15 However, the TSP1 used in these studies does not represent the physiological relevant structure or concentration.35 Additionally, the established Jurkat T cell, which has a ‘helper-like’ (CD4+) phenotype, was activated through CD3/CD28 antibodies.14 15 Therefore, we performed our studies using a physiologically relevant, fully structured recombinant TSP1 and at a concentration relevant to a patient with cancer, which would be at nanomolar level compared with a healthy picomolar level.47 We also used CD8+ T cells whose activation was antigen-mediated. We observed that CD8+ T cells exposed to TSP1 decreased activation and subsequently proliferation. Although CD47 targeted CD8+ T cells had no significant changes in activation compared with control, CD47 targeted CD8+ cells exposed to TSP1 were able to overcome this inhibitory interaction and continue to activate and proliferate. Therefore, TSP1 limits primary CD8+ T cell antigen-mediated activation by interacting with CD47.
The ligation of CD47 by TSP1 can cause the differentiation of T cells to an immunosuppressive phenotype or induce cell death, impairing the cells’ ability to have antitumor cytolytic capabilities.16 17 To our knowledge, it has not been examined how CD47 ligation by TSP1 impacts CD8+ T cell antitumor function. Therefore, we examined how TSP1 affects CD8+ T cell antitumor function. We used effector Pmel-1 CD8+ T cells differentiated from the splenocytes of Pmel-1 transgenic mice. The T cells from these mice have rearranged T cell receptors that can recognize and target B16 melanoma cells due to their Pmel-1 antigen expression.23 24 When CD47 was targeted, there was no significant change in Pmel-1 CD8+ T cell cytolysis or target B16 cell index compared with control. However, Pmel-1 CD8+ T cells exposed to TSP1 had decreased CD8+ T cell cytolytic activity as an increase in target B16 cell index was observed. When we targeted CD47 on Pmel-1 CD8+ T cells and exposed these cells to TSP1, we demonstrated that the negative implications associated with TSP1 ligation were depleted as cytolytic activity of Pmel-1 CD8+ T cells increased and target B16 cell index decreased. Therefore, TSP1 impairs CD8+ T cell antitumor through its interaction with CD47.
The nutrient competition within the tumor microenvironment often deteriorates the bioenergetics of antitumor CD8+ T cells.48 49 Therefore, targeted therapies are needed to sustain the bioenergetics of CD8+ T cells within the tumor microenvironment to continue their antitumor functions. The lack of CD47 expression has enhanced the bioenergetics of various immune cells. CD47- Jurkat T cells have increased bioenergetics within an irradiated stress-induced environment compared with WT Jurkat T cells.19 Additionally, the bioenergetics of cd47-/- natural killer cells is enhanced compared with WT natural killer cells.50 However, it is unknown how CD47 expression impacts the bioenergetics of naïve and antigen-mediated activation of CD8+ T cells exposed to TSP1 and in the context of cancer. We specifically focused on glycolysis as naïve T cells shift from oxidative phosphorylation to glycolysis when differentiating into CD8+ T cells.3 We examined how CD47 expression impacted glycolysis of an established T cell line and primary CD8 +T cells. CD47- Jurkats T cells had an increased glycolytic rate compared with WT Jurkat T cells. This was further validated in primary cd47-/- CD8+ T cells that had a high glycolytic rate compared with WT CD8+ T cells. Next, we examined how CD47 expression would impact glycolysis in activating CD8+ T cells. When cd47-/- CD8+ T cells were activated, the rate of glycolysis continued to increase compared with WT CD8+ T cells. The blockade of CD47 may increase glycolysis by mediating an increase in glucose receptor expression or downstream enzymes of the glycolytic pathway; however, this needs to be further investigated. In addition to CD47 blockade enhancing CD8 +T cell rate of glycolysis, it also allowed CD8+ T cells to sustain energy production when exposed to TSP1. Pmel-1 CD8+ T cells exposed to TSP1 had a decrease in ECAR; however, CD47 targeted Pmel-1 CD8+ T cells exposed to TSP1 had an increase in ECAR compared with TSP1 exposed Pmel-1 CD8+ T cells. This demonstrates that targeting CD47 allows CD8+ T cells to sustain glycolysis with a competitive, TSP1 concentrated tumor microenvironment to maintain their activation, proliferation, and cytolytic activity against cancer cells.
We have demonstrated that melanoma patients receiving anti-PD-1 therapy have different levels of CD47 expressing T cells and circulating levels of TSP1 based on response. This may indicate that non-responders with elevated circulating TSP1 and CD47 expressing T cells will interact and negatively affect T cell activation, antitumor function, and bioenergetics. If T cells are not functioning due to the negative implications of CD47 ligation by TSP1, they will not respond to anti-PD-1 therapy and induce an effective antitumor immune response. Therefore, the CD47/TSP1 signaling axis could be an immune checkpoint blockade response marker.
Due to the low response rate associated with immune checkpoint blockade in the clinic, targeted therapies combined with immune checkpoint inhibitors are needed to improve patient response and overall survival. Targeting CD47 in combination with immune checkpoint blockade treatments has been observed in several preclinical models.51 52 In a mouse melanoma model, targeting CD47 with antisense morpholino combined with anti-CTLA-4 and irradiation decreased tumor burden and increased survival.51 In esophageal squamous cell cancer model, CD47 blockade combined with anti-CTLA-4 and anti-PD-1 reduced tumor burden and increased survival.52 However, CD47 blockade in combination with anti-PD-1 was not observed.52 We determined that non-responding melanoma patients to anti-PD-1 therapy have a significant increase in T cells expressing CD47 and circulating levels of TSP1. We also demonstrated the negative impact of CD47 ligation by TSP1 on T cells’ activation, proliferation, bioenergetics, and antitumor function; however, targeting CD47 allows T cells to overcome this interaction. Therefore, we wanted to examine how targeting CD47 would impact anti-PD-1 therapy response and the impact on tumor burden. We observed that targeting CD47 and PD-1 as monotherapy decreased tumor burden; however, using these therapies in combination significantly reduced tumor burden compared with the monotherapies and control. Therefore, targeting CD47 may allow T cells to overcome the negative implications that TSP1 ligation can have on activation, energy production, and antitumor function, enabling T cells to be primed to respond appropriately to anti-PD-1 therapy and decrease tumor burden.
Overall, this data demonstrates potential biomarkers to predict melanoma patient response to anti-PD-1 therapy and the impact of using targeted therapies to improve immune checkpoint blockade response. CD47 and TSP1 are intriguing therapeutic targets due to their increased expression in human melanoma tissue compared with normal tissue. CD47 targeted therapy enhanced the CD8+ T cells glycolytic rate when exposed to TSP1, which generally deteriorates in the tumor microenvironment. The improved glycolytic rate of CD8+ T cells may improve activation, proliferation, antitumor function, and cytotoxicity of cancer cells, leading to the reduction of tumor size observed. Additionally, non-responders to anti-PD-1 treatment have elevated levels of TSP1 and CD47 expressing T cells, potentially impairing CD8+ T cells and their ability to respond to anti-PD-1 therapy. Therefore, CD47/TSP1 expression could be used as a biomarker to predict melanoma patients' response to anti-PD-1 treatment. Moreover, CD47 targeted therapy appears to sensitize tumors to anti-PD-1 therapy to further reduce melanoma tumor burden. CD47 targeted therapies can potentially improve the efficacy of immunotherapy treatment, like immune checkpoint blockade, to improve overall outcomes for tumor-bearing patients with cancer.
Data availability statement
Data sharing not applicable as no datasets generated and/or analysed for this study.
Ethics statements
Patient consent for publication
Ethics approval
Human subject studies were approved by the institutional review board (IRB), and animal studies were approved by the Institutional Care and Use Committee, Wake Forest Health Sciences.
Acknowledgments
The authors wish to acknoledge the Preclinical Ultrasound and Photoacoustic Imaging Core of Wake Forest University School of Medicine supported in part by the Wake Forest Clinical and Translational Science Institute (NIH NCATS UL1TR001420) and Hypertension and Vascular Research Center. This work was also supported by the Wake Forest Baptist Comprehensive Cancer Center's Shared Resources: Cancer Genomics (CGSR), Tumor Tissue & Pathology (TTPSR), Bioinformatics (BISR), and Flow Cytometry (FCSR), supported by the National Cancer Institute's Cancer Center Support Grant, award number P30CA012197. The authors also wish to thank patients and their families for participation in the clinical trial.
References
Supplementary materials
Supplementary Data
This web only file has been produced by the BMJ Publishing Group from an electronic file supplied by the author(s) and has not been edited for content.
Footnotes
Twitter @oncoscientist
Contributors DRS-P: Study supervision; ERS, MT, MAA-M, Methodology design; ERS conducted most of the experimental work and collected data; ERS, AW carried out in vivo and cell culture experiments; ERS, DRS-P, MT, and MAA-M analyzed data; PT, MK provided and processed patient samples and supported analysis of patient data; ERS, MAA-M, FACS analysis; WZ and LDM supported single cell sequencing analysis; LMY performed in vivo photoacoustic analysis. DRS-P, MT conception and design; DSP acquisition of funding; DRS-P, ERS, MT drafting of manuscript; DRS-P, ERS, MAA-M, WZ, LDM, PT Review of Manuscript. DRS-P is responsible for the overall content as the guarantor.
Funding ERS: NIAID Immunology and Pathogenesis T32 Training Grant (T32AI007401). DRS-P: V Scholar in Cancer Research V Foundation (V2019-018/V Foundation for Cancer Research), NCI/NIH P30 CA012197/CA/NCI NIH HHS/USA, American Cancer Society Research Scholar (133727-RSG-19-150-01-LIB).
Competing interests No, there are no competing interests.
Provenance and peer review Not commissioned; externally peer reviewed.
Supplemental material This content has been supplied by the author(s). It has not been vetted by BMJ Publishing Group Limited (BMJ) and may not have been peer-reviewed. Any opinions or recommendations discussed are solely those of the author(s) and are not endorsed by BMJ. BMJ disclaims all liability and responsibility arising from any reliance placed on the content. Where the content includes any translated material, BMJ does not warrant the accuracy and reliability of the translations (including but not limited to local regulations, clinical guidelines, terminology, drug names and drug dosages), and is not responsible for any error and/or omissions arising from translation and adaptation or otherwise.