Article Text

Abstract
Background Novel therapies are urgently needed for ovarian cancer (OC), the fifth deadliest cancer in women. Preclinical work has shown that DNA methyltransferase inhibitors (DNMTis) can reverse the immunosuppressive tumor microenvironment in OC. Inhibiting DNA methyltransferases activate transcription of double-stranded (ds)RNA, including transposable elements. These dsRNAs activate sensors in the cytoplasm and trigger type I interferon (IFN) signaling, recruiting host immune cells to kill the tumor cells. Adenosine deaminase 1 (ADAR1) is induced by IFN signaling and edits mammalian dsRNA with an A-to-I nucleotide change, which is read as an A-to-G change in sequencing data. These edited dsRNAs cannot be sensed by dsRNA sensors, and thus ADAR1 inhibits the type I IFN response in a negative feedback loop. We hypothesized that decreasing ADAR1 editing would enhance the DNMTi-induced immune response.
Methods Human OC cell lines were treated in vitro with DNMTi and then RNA-sequenced to measure RNA editing. Adar1 was stably knocked down in ID8 Trp53-/- mouse OC cells. Control cells (shGFP) or shAdar1 cells were tested with mock or DNMTi treatment. Tumor-infiltrating immune cells were immunophenotyped using flow cytometry and cell culture supernatants were analyzed for secreted chemokines/cytokines. Mice were injected with syngeneic shAdar1 ID8 Trp53-/- cells and treated with tetrahydrouridine/DNMTi while given anti-interferon alpha and beta receptor 1, anti-CD8, or anti-NK1.1 antibodies every 3 days.
Results We show that ADAR1 edits transposable elements in human OC cell lines after DNMTi treatment in vitro. Combining ADAR1 knockdown with DNMTi significantly increases pro-inflammatory cytokine/chemokine production and sensitivity to IFN-β compared with either perturbation alone. Furthermore, DNMTi treatment and Adar1 loss reduces tumor burden and prolongs survival in an immunocompetent mouse model of OC. Combining Adar1 loss and DNMTi elicited the most robust antitumor response and transformed the immune microenvironment with increased recruitment and activation of CD8+ T cells.
Conclusion In summary, we showed that the survival benefit from DNMTi plus ADAR1 inhibition is dependent on type I IFN signaling. Thus, epigenetically inducing transposable element transcription combined with inhibition of RNA editing is a novel therapeutic strategy to reverse immune evasion in OC, a disease that does not respond to current immunotherapies.
- genital neoplasms, female
- tumor microenvironment
- lymphocytes, tumor-infiltrating
- interferon inducers
- adjuvants, pharmaceutic
Data availability statement
Data are available in a public, open access repository. Data are available on reasonable request.
This is an open access article distributed in accordance with the Creative Commons Attribution Non Commercial (CC BY-NC 4.0) license, which permits others to distribute, remix, adapt, build upon this work non-commercially, and license their derivative works on different terms, provided the original work is properly cited, appropriate credit is given, any changes made indicated, and the use is non-commercial. See http://creativecommons.org/licenses/by-nc/4.0/.
Statistics from Altmetric.com
- genital neoplasms, female
- tumor microenvironment
- lymphocytes, tumor-infiltrating
- interferon inducers
- adjuvants, pharmaceutic
WHAT IS ALREADY KNOWN ON THIS TOPIC
We have previously published that inhibiting DNA methyltransferases (DNMTs) activates transcription of double-stranded (ds)RNA, including transposable elements.
These dsRNAs activate sensors in the cytoplasm and trigger type I interferon (IFN) signaling, recruiting host immune cells to kill the tumor cells.
Others have shown that adenosine deaminase 1 (ADAR1) is induced by IFN signaling and edits mammalian dsRNA with an A-to-I nucleotide change, which is read as an A-to-G change in sequencing data.
Knockout of Adar1 in tumors overcomes resistance to immune checkpoint blockade in the B16 mouse melanoma model through immune modulation of the tumor microenvironment by inducing a type I IFN response.32
Lastly, Mehdipour et al recently showed that ADAR1 restricts the DNA methyltransferase inhibitors (DNMTis)-induced viral mimicry response in human cancer cell lines by establishing a negative-feedback loop.26
In-depth studies have not yet been performed in ovarian cancer (OC), and the immune effects of the combination of DNMTi treatment with ADAR1 loss have not yet been studied.
WHAT THIS STUDY ADDS
This study encompasses a comprehensive evaluation of the effects of DNMTi alone, Adar1 knockdown alone, and the combination of both on type I IFN production, chemokine, and cytokine production, and the immune microenvironment in immune-competent models of OC.
We show for the first time that the combination of DNMTi and Adar1 knockdown induces type I IFN-driven changes in the tumor immune microenvironment, specifically an increase in CD8+ T cells and natural killer cells.
This immunogenic combination results in a significant increase in survival and decrease in tumor burden in an aggressive model of late-stage OC, which is dependent on type I IFN signaling.
We are the first to perform total interferon alpha and beta receptor 1 (IFNAR1) blockade with combination Adar1 loss and DNMTi in an immune-competent murine model of cancer.
We are also the first to perform this experiment in Ifnar1 null mice, and from this comparison, we show that tumor intrinsic type I IFN signaling is driving the survival advantage.
We are also the first to show in an immune-competent murine model that combination Adar1 loss and DNMT inhibition promotes higher sustained CD8+ T cytotoxicity, which translates to better control of tumor burden in vivo.
We conclude that epigenetically inducing immunogenic dsRNAs in tumor cells, combined with inhibition of RNA editing, is a novel therapeutic strategy to reverse immune evasion in OC.
HOW THIS STUDY MIGHT AFFECT RESEARCH, PRACTICE, OR POLICY
This study may further drive efforts to manufacture an ADAR1 inhibitor and may further motivate research investigating ADAR1 dysregulation in cancer and potential combination therapy with ADAR1 inhibitors or small interfering RNA and epigenetic modulators such as DNMTis.
Further development of tools to study RNA editing and further understanding of efficacious preclinical combination therapies may lead to the development of new clinical trials for OC and other malignancies.
OC has not traditionally been responsive to immune therapies, so this is a novel and exciting strategy to reverse immune evasion in this understudied and deadly disease.
Background
Ovarian cancer (OC) is the fifth deadliest cancer in women, with a 5-year survival rate that has remained unchanged for decades.1 While poly (ADP-ribose) polymerase inhibitors have recently been shown to extend survival for patients with germline or somatic BRCA mutations, these make up at most 25% of patients with high-grade serous ovarian cancer (HGSOC).2 OC is characterized by an immunosuppressive tumor microenvironment (TME),3 and immune checkpoint blockade therapies have thus far not produced durable responses in OC.4 5 Although the objective response rate in OC for combined immune checkpoint blockade (antiprogrammed cell death protein 1 (PD-1) and anticytotoxic T-lymphocyte-associated antigen 4) was ~31% in a recent clinical trial, this response was not durable, and progression-free survival was only about 4 months.5 Interestingly, better OC prognosis overall is correlated with a higher number of tumor-infiltrating CD8 T cells,6–8 so there remains an opportunity to activate the immune system against OC for curative therapy.
One strategy to reverse an immunosuppressive TME is treatment with epigenetic modulators. These include DNA methyltransferase inhibitors (DNMTis) such as 5-azaacytidine (5-Aza/Aza) or 2’-deoxy-5-azacytidine (decitabine/Dac), which are currently Food and Drug Administration-approved drugs for the treatment of acute myeloid leukemia, chronic myelomonocytic leukemia, and myelodysplastic syndromes.9 We previously showed that DNMTi treatment increases antitumor immune cells and decreases suppressive immune cells in an immunocompetent model of OC.10 DNMTis remove the repressive methylation marks that silence DNA, allowing for transcription of transposable elements (TEs) that can form immunogenic double-stranded (ds)RNAs.11–15 Interestingly, this DNMTi treatment of OC cells alters immunogenic dsRNA expression in a TP53-dependent manner.13 We previously showed that cell lines with TP53 mutations have significantly higher baseline expression of immunogenic dsRNAs. Additionally, p53 activation increased expression of these immunogenic dsRNAs by binding directly to the TE loci.13
TEs are families of repetitive genomic sequences that include long-interspersed nuclear elements (LINEs), short-interspersed nuclear elements (SINEs) (Alu elements), and long-terminal repeats (LTRs)/endogenous retroviral elements (ERVs).16 LINEs and SINEs are both non-LTR TEs. ERVs fall under the LTR family TEs, and these are relics of ancient viruses that integrated into the genome millions of years ago.17 LINEs, SINEs, and LTRs are all class I retrotransposons, meaning that they use reverse-transcribed RNA copies of themselves to re-insert back into the genome. In the presence of enzymatically active reverse transcriptase, TEs can move around in the genome, although they are normally silenced in terminally differentiated cells to maintain genome stability.16 18 19 Although most TEs in the human genome have lost their ability to transpose, they may still be transcribed if they lose epigenetic silencing.20 Due to global loss of DNA methylation, cancers lose silencing of TEs, resulting in significantly higher expression of TEs compared with normal cells.21 TE RNA transcripts can form dsRNA molecules that are sensed by RIG-I-like receptor (RLRs) cytosolic dsRNA sensing proteins, such as MDA522 and toll-like receptor 3.11 RLR sensing induces the antiviral type I interferon (IFN) signaling pathway, causing secretion of interferon-beta (IFN-β). Autocrine signaling through receptors for this protein on the cell surface then induces interferon-stimulated genes (ISGs) within the cell through the transcription factor STAT1.23 CCL5, a T cell-trafficking chemokine activated by the type I IFN response, is consistently upregulated in OC cell lines following DNMTi treatment.24 CCL5 is associated with increased intratumoral T cell infiltration in OC.25 Thus overall, DNMTi transform the TME in preclinical models of OC, decreases tumor burden, and significantly prolongs survival. However, DNMTi alone or in combination with immune checkpoint blockade is not curative in murine models of OC.10 24
Mehdipour et al recently showed that adenosine deaminase 1 (ADAR1) restricts the DNMTi-induced IFN response in human cancer cell lines by establishing a negative-feedback loop.26 ADAR1 is an enzyme that causes A-to-I edits in mammalian RNA to destabilize the dsRNA structure, preventing recognition by dsRNA sensors (RLRs) and inhibiting the IFN response.27 RNA editing can benefit tumor progression by altering translation of genes28 29 or by helping tumor cells evade the immune system. For example, hyper-edited dsRNAs are sufficient to suppress the IFN response and apoptosis.30 Edited RNAs often have aberrant splicing patterns, and hyperedited RNAs are retained in the nucleus,31 thus eliminating immunogenic sensing, which occurs in the cytoplasm. Knockout of Adar1 in tumors overcomes resistance to immune checkpoint blockade in the B16 murine model of melanoma by inducing a type I IFN response to change the immune microenvironment.32 A deeper understanding of the DNMTi-induced IFN response and how this is regulated by ADAR1, RNA editing, and dsRNA sensing may identify new therapeutic targets and inform ongoing clinical trials combining epigenetic and immune therapy in OC.33 34
We tested the hypothesis that inhibition of ADAR1-dependent RNA editing increases the antitumor immune response to DNMTi in OC. Here, we show for the first time that combining ADAR1 knockdown with DNMTi inhibition in OC: (1) increases type I IFN signaling and pro-inflammatory cytokine/chemokine release, (2) transforms the TME by recruiting lymphocytes that can kill cancer cells, and (3) significantly decreases tumor burden and increases survival in an immunocompetent murine model of OC compared with either intervention alone. Thus, epigenetically inducing TE transcription combined with inhibition of RNA editing is a novel therapeutic strategy to reverse immune evasion in OC, an understudied disease that shows very low response rates to current immune therapies.
Methods
Cell culture
A2780, Hey, and TykNu human OC cell lines were a kind gift from Dr Steve Baylin’s laboratory (Johns Hopkins University). Human OC cell lines (Hey and TykNu) were cultured as previously reported in McDonald et al.13 Hey (and isogenic HC2/HH23 Hey-derived, CRISPR-edited cell lines) and TykNu human OC cell lines were cultured in RPMI 1640 (Corning, 10-104-CV) with 10% fetal bovine serum (FBS) (X&Y Cell Culture, FBS-500-HI), and 1% penicillin and streptomycin solution (Gibco, 15070063). The 293T (HEK 293T) cell line was cultured in Dulbecco’s Modified Eagle Medium (DMEM) media (Gibco, 10569044) with 10% FBS (X&Y Cell Culture, FBS-500-HI), and 1% penicillin and streptomycin solution (Gibco, 15070063).
ID8 murine cell lines (Trp53+/+ and Trp53-/- ) were a kind gift from Dr Iain McNeish35 and were cultured in DMEM media (Gibco, 10569044) with 4% FBS (X&Y Cell Culture, FBS-500-HI), 1% penicillin and streptomycin solution (Gibco, 15070063), ITS (5 μg/mL insulin, 5 µg/mL transferrin, and 5 μg/mL sodium selenite) (Gibco, 41400045).
HGS2 (Trp53-/- Pten-/- BrCa2-/- ) murine cell line was a kind gift from Dr Ronny Drapkin36 and were cultured in DMEM-F12 media (Gibco, 31331028) with 4% FBS (X&Y Cell Culture, FBS-500-HI), 1% penicillin and streptomycin solution (Gibco, 15070063), ITS (5 μg/mL insulin, 5 μg/mL transferrin, and 5 μg/mL sodium selenite) (Gibco, 41400045), 250 μg hydrocortisone (Sigma, 10437-028), 1% anti-anti (Gibco, 15240062), 5 μg murine epidermal growth factor (Sigma, E4127-.1MG).
IFN-β stimulation
TykNu cells were stimulated with human recombinant IFN-β (Peprotech, 300-02BC) at a final concentration of 10 ng/mL for 24 hours prior to harvesting. The murine shAdar1 knockdown and shGFP control cells were plated at 2e6 cells per T75 flask. Four hours after plating, the cells were stimulated with 10 µL/mL of media (1000 units/mL) with mouse IFN-β (PBL, 12405-1). Twenty-four hours after stimulation the pellets were collected, counted, washed with phosphate-buffered saline (PBS), and frozen. ID8 Trp53-/- shGFP and ID8 Trp53-/- shAdar1 #2 were used in the interferon alpha and beta receptor 1 (IFNAR1) blocking in vitro assays. For these in vitro assays, anti-IFNAR1 blocking antibody (Leinco, clone MAR1-5A3) or isotype control (Leinco, clone HKSP) was used at 10 μg/mL or 100 μg/mL (stated in the figures).
Colony formation assays
For the colony formation assays, the murine OC cell lines used were ID8 wild-type, ID8 Trp53-/-, and HGS2 (Trp53-/- Pten-/- BrCa2-/-); 1e5 cells were plated per well in 6-well plates and cultured in the appropriate media. The cells were treated with Dac, 5-Aza, and murine IFN-β (PBL, 12405-1). The treatments were done in triplicate (3 wells per treatment) for 3 days and were collected on day 10. Media was aspirated and cells were fixed with 4% paraformaldehyde/PBS (Thermo Scientific, J61899AK), which was left on for 5 min then aspirated. Cells were stained with 0.05% w/v crystal violet (Sigma, C0775-25G mixed into a 20% methanol and 80% deionized water solution) for 20 min, washed with water, and then the plates were photographed.
Growth inhibition assays
The murine OC cell line proliferation assay included the following cell lines: ID8 Trp53+/+ shGFP, ID8 Trp53+/+ shAdar1 #2, ID8 Trp53-/- shGFP, ID8 Trp53-/- shAdar1 #2, HGS2 shGFP, and HGS2 shAdar1 #2. On day 0, 0.5e6 cells were plated for the ID8 Trp53-/- and ID8 Trp53+/+ cell lines and 1.5e6 cells for the HGS2 cell lines into T75 flasks. Treatments were done in triplicate, three flasks for each treatment per cell line leading to a total of 60 flasks. The treatments were Mock (treat with dimethyl sulfoxide (DMSO) diluted in media: day 1, day 2, and day 3), Dac (treat with 100 nM Dac/DMSO diluted in media: day 1, day 2, day 3), 5-Aza (treat with 1 µM 5-Aza/DMSO diluted in media: day 1, day 2, day 3), and IFN-β (PBL, 12405-1) (only for HGS2, treat with murine IFN-β on day 3). On day 4, supernatant was removed from the cells and collected. The cells were trypsinized with a 1:4 dilution of 0.25% trypsin in PBS. The cells were spun down, the supernatant aspirated, and the cells were resuspended in 5 mL of media. The cells were then counted twice with an automated cell counter (BioRad TC20). Pellets were washed with PBS and then viably frozen.
Cytokine/Chemokine analysis from in vitro experiments
Cytokines and chemokines from cell culture supernatants from day 4 of the growth inhibition assay were analyzed using the LEGENDplex Mouse Anti-Virus Response Panel (BioLegend, 740621). Samples and standards were plated in technical duplicates and the assay was executed per the manufacturer’s protocol. Data were collected using the FACSCelesta (Becton Dickinson) and analyzed using the cloud-specific LEGENDplex Data Analysis Software Suite V.2021.07.01 (BioLegend/Qognit).
Invitrogen IFN-γ Mouse ProQuantum Immunoassay Kit (Thermo Fisher Scientific, A41150) was used in conjunction with the QuantStudio thermo cycler to measure concentrations of IFN-γ protein in the supernatants of murine T cell cultures.
RNA extraction/RT-qPCR
RNA was extracted using Trizol (Thermo Fisher Scientific 15596026) and MaXtract High Density phase separation tubes (Qiagen, 129056) per manufacturers’ protocols. RNA was DNAse-treated (Thermo Scientific, EN0525) and then complementary DNA (cDNA) was synthesized (Applied Biosystems High Capacity cDNA Kit, 4368814). The following TaqMan qPCR primers were used in conjunction with TaqMan Master Mix and the QuantStudio thermo cycler (Applied Biosystems): murine Ifi27 (Mm00835449_g1), murine b-actin (Mm00607939_s1), human CCL5 (Hs99999048_m1), human ISG15 (Hs01921425_s1), human IFI27 (Hs01086373_g1), human ACTB (Hs01060665_g1).
Cytokine/Chemokine and antibody isotyping analysis from in vivo experiments
Cytokines and chemokines from ascites supernatants from the first drain of each mouse (list cytokines/chemokines) were analyzed using the LEGENDplex Mouse Anti-Virus Response Panel (BioLegend, 740621). Transforming growth factor beta (TGF-β) was analyzed using TGF-β1 Quantikine ELISA assay (R&D Systems, DB100C). Antibody isotype concentrations were analyzed using the LEGENDplex Mouse Immunoglobulin Isotyping Panel (BioLegend, 740493).
Transwell migration assays
CD4 and CD8 T cells were isolated from C57BL/6 IFN-γ GFP reporter mouse spleens using negative isolation kits (STEMCELL Technologies, 19852 and 19853). Cells were cultured in RPMI 1640 (Corning, 10-040-CV)+10% FBS (FBS-500-HI, X&Y Cell Culture)+0.05 mM 2-mercaptoethanol (Sigma-Aldrich, M6250)+1% penicillin and streptomycin solution (Gibco, 15070063)+1% GlutaMax (Gibco, 35050061)+1% sodium pyruvate (Gibco, 10569044)+1% HEPES (Gibco, 15630080)+1% MEM+NEAA (Gibco, 11140050)+30 U/mL recombinant murine IL-2 (Peprotech, 212-12)+30 U/mL recombinant murine IL-7 (Peprotech, 212-17), activated with mouse T-activator CD3/CD28 Dynabeads (Thermo Scientific, 11452D), and allowed to expand for 6 days in culture.
ID8 Trp53-/- shGFP and shAdar1 cells were plated on day 0 in 6-well dishes with 2.5 mL ID8 media (DMEM+GlutaMax+4% FBS+1% penicillin/streptomycin+1% ITS), and then treated days 1–3 with vehicle (DMSO diluted in media) or 100 nM Dac in triplicate. On day 4, Dynabeads were removed, and T cell concentration was normalized by resuspended in Murine Transwell Assay Media (RPMI+0.1% bovine serum albumin (BSA)+1% penicillin/streptomycin+1% L-glutamine+1% HEPES+1% MEM NEAA+1% sodium pyruvate+0.05 mL 2-mercaptoethanol); 2e6 T cells were plated in transwell inserts with 3 µM pore size (Greiner, 657630) in 1 mL volume. Positive control wells were plated with ID8 media in the bottom chamber of the wells with 10,000 pg/mL recombinant murine CCL5 (Peprotech, 250-07). Negative control wells were plated with ID8 media in the bottom chamber of the wells with 0.1% BSA added at the same volume as the CCL5 was added for positive control wells. Dishes were then incubated at 37°C+5% CO2 for 2 hours. Transwell inserts were then removed, and T cells were collected from the media supernatant below the transwells. Adherent cells were washed with PBS and trypsinized. T cells and ID8 cells were combined for each well and then stained with Live/Dead Aqua (Thermo Fisher Scientific, L34965) followed by CD45-PerCP/Cy5.5 (BioLegend), CD3-AlexaFluor 700 (BioLegend, 152316), CD4-BV785 (BioLegend, 100453), CD8a-APC/Fire750 (BioLegend, 100766) surface stains. Cells were then resuspended in Cell Staining Buffer (BioLegend, 420201) and CountBright Absolute Counting Beads (Invitrogen, C36950) were added to each tube before running on the flow cytometer. Number of cells from in each tube were normalized using the absolute counting beads.
Statistical analysis
All experiments were performed in triplicate unless noted otherwise. Kaplan-Meier survival curves were generated with GraphPad Prism (V.8), using the Gehan-Breslow-Wilcoxon method for statistical analysis. GraphPad Prism (V.8) was also used to generate all graphs and complete all other statistical analysis (unpaired t-tests, one-way analysis of variance, and Spearman’s correlation). Outliers were identified and removed using the ROUT method (Q=5%), also with GraphPad Prism (V.8).
Drugs and treatments
As previously reported in McDonald et al 13 for RNA sequencing analysis, human cell lines were plated in T75 flasks and treated for 5 days with 500 µM Aza or PBS (with daily media replacement). Murine OC cells were plated day 0 in appropriate media and then treated on days 1, 2, and 3 with vehicle (DMSO diluted in media), 1 µM 5-Aza/Aza (Sigma-Aldrich) or 100 nM decitabine/Dac (EMD Millipore) in triplicate. On day 4, cells were harvested and/or passaged. If passaged on day 4, cells rested until day 7 when they were harvested.
RNA editing analysis
Ribosomal RNA (rRNA) reads were removed using SortMeRNA V.4.2.037 and then the remaining reads were trimmed with cutadapt per McDonald et al.13 One-pass alignment to the Hg38 human reference genome was performed with STAR V.2.7.8a with the following flag ‘— outFilterMatchNminOverLread 0.95’ per Roth et al.38 Duplicates were removed from sorted reads using Picard 2.25.1 MarkDuplicates, and read pairs were clipped using bamUtils 1.0.15 clipOverlap (parameters-storeOrig CG-poolSize 50000000). The resulting bam files were run through the RNA Editing Indexer tool38 for the automated calculation of editing indices. The UCSC Table Browser was used to make BED files specific for additional repeat regions (LINE, L1, SINE, LTR, ERV).
Lentiviral Adar1 knockdowns
Plasmids for murine Adar1 knockdown (shAdar1, TRCN0000071313) and the control plasmid (shGFP, Catalog #SHC005) were ordered from Sigma-Aldrich and were prepared as follows: Terrific Broth (Fisher, BP2468-500) with ampicillin was inoculated with the plasmid glycerol stock and left to grow overnight at 37°C in a bacterial shaker. The bacteria culture was harvested 12–16 hours later and prepared using the Invitrogen PureLink HiPure Plasmid Midiprep Kit; 1.6 µg of the pLKO.1 backbone short-hairpin RNA plasmid was added into the media of 293T cells in culture along with sPAX2 (the packaging plasmid) and 0.2 µg of pMD2.G (the envelope plasmid).39 40 After 24 hours the media on the 293T cells was changed. After 48 hours the media was filtered and concentrated using a 10,000 MWCO concentrator to isolate the lentivirus. The virus was added to the media of the target cells with 8 µg/mL polybrene. The cells were then selected using 400 µg/mL neomycin (G418) and 1 µg/mL of puromycin to create the lentiviral Adar1 knockdowns for murine cell.
Mouse experiments
The experimental unit is one single mouse, and each group was initially assigned 10 mice. Sample sizes were determined using a sample size calculator (the main outcome measure for determining this was survival). Animals were not randomized nor blinded due to limited personnel available to work on the study (COVID-19 pandemic restrictions on capacity). Confounders were controlled by keeping the animals/cages in the same building for the duration of the experiment, and all cages were housed in the same room. The ARRIVE1 reporting guidelines41 were used.
Female C57BL/6 mice from Charles River Laboratories (Wilmington, Massachusetts, USA) or B6(Cg)-Ifnar1tm1.2Ees/J (Ifnar1 null with C57BL/6 genetic background) mice from the Jackson Laboratory were acclimatized in the designated housing room for at least 3 days before they were given intraperitoneal injections with 5e6 ID8 Trp53-/- shGFP (control cells) or shAdar1 murine OC cells suspended in 0.5 mL 1X PBS (Corning, 21-040-CV) at 8–20 weeks of age. Ifnar1 null mice were genotyped in our facility using the genotyping protocol and primer sequences provided by Jackson Laboratory. Tumors do not take in about 5%–10% of mice (a limitation of this animal model), thus, we decided a priori to use the ROUT method (Q=5%) to identify and remove outliers from each group. Censoring criteria were also established a priori: animals would be censored from the survival curve if they expired or were sacrificed prior to the development of advanced disease (ascites).
Intraperitoneal drug injections were begun about 3–4 weeks after tumor inoculation. Tetrahydrouridine (THU)/DNMTi-treated mice received treatments on day 1 and day 4 of every week. Mice first received an injection of clinical-grade THU at 10 mg/kg (a kind gift from Dr Yogen Saunthararajah) and subsequently received DNMTi 30–60 min later.42 43 On day 1, these mice received decitabine (Dac, 0.1 mg/kg) as the DNMTi, and on day 4 these mice received Aza (1 mg/kg) as the DNMTi. The following were recorded as a measure of tumor burden: circumference (weekly), body weight (weekly), and ascites volume (as needed). Ascites were drained when body weight and/or circumference increased by over 30% of starting body weight and circumference. Mice were anesthetized with isoflurane and drained of ascites up to 3 times before being sacrificed. To minimize suffering and distress from the ascites draining procedure, mice were given subcutaneous saline injections and provided heating pads, diet gel, hydro gel, and food pellets on the cage floor. Mice can tolerate multiple taps of ascites drainage but usually reach a humane end point 2–3 weeks after first ascites draining occurs. Experiments were terminated at 20 weeks after initial injection of tumor cells for any mice still alive. If the mice appeared moribund at any timepoint per our IACUC protocol (have a hunched posture, appear ruffled, ungroomed, or lethargic, show signs of labored breathing or hypoactivity or hyperactivity) or developed signs of infection, they were humanely sacrificed by CO2 inhalation prior to the expected study end point.
For the immune depletion experiments, anti-IFNAR1 blocking antibody (Leinco, clone MAR1-5A3), anti-CD8a depletion antibody (BioXcell, clone 53–6.7) or anti-NK1.1 depletion antibody (BioXcell, clone PK136) or isotype control antibodies were given 1 day before tumor inoculation and then on day 2 and day 5 of every week, for the duration for the experiment; 5e6 ID8 Trp53-/- shAdar1 cells were given via intraperitoneal injection and then drug treatments were started 2–3 weeks after tumor inoculation as stated above.
Immunoblotting
Western blot analysis was used to confirm Adar1 knockdown in tumor cells. Isolated cell pellets were lysed in RIPA buffer (Pierce, 89900) with 1X protease and phosphatase inhibitors (Pierce, A32961). Lysates were sonicated in a Bioruptor (Diagenode, Denville, New Jersey, USA) at 4°C for 8 min (8 cycles of 30 s on, 30 s off). Protein concentration was determined using a Pierce BCA Protein Assay Kit (Thermo Fisher Scientific, 23225) according to the manufacturer’s protocol. Samples were mixed with 1X NuPAGE LDS loading gel (NP0007) and 1X NuPAGE reducing agent (NP0009) and boiled at 95°C for 10 min. Samples were loaded onto 4%–20% (BioRad, 4561093) or 10% gels (BioRad, 4561033) and transferred to a LF PVDF membrane (BioRad, 170-4274). Membranes were blocked with LI-COR Biosciences (Lincoln, Nebraska, USA) Odyssey Blocking Buffer (927-40100) diluted 1:2 in PBS. Bands were detected using Azure Biosystems (Dublin, California, USA) Imaging System c600, processed using ImageStudioLite, and quantitated using ImageJ. The antibodies used for immunoblotting included: ADAR1 (15.8.6) mouse mAb (Santa Cruz, SC73408), beta-actin (13E5) rabbit mAb (Cell Signaling Technologies #4970S), AzureSpectra 700 antibody goat antimouse IgG (Azure Biosystems, AC2129), AzureSpectra 800 antibody goat antirabbit IgG (Azure Biosystems, AC2134).
Flow cytometry
Ascites samples and murine spleens were collected from 2 to 10 mice per group and incubated in ACK buffer (Lonza) for 2 min to lyse red blood cells, washed with PBS, and pelleted. The single cell suspensions were then washed and stained for the myeloid panel with CD45-PerCP/Cy5.5 (BioLegend, 103132), Ly6C-APC/Fire750 (BioLegend, 128046), Ly6G-BV605 (BioLegend, 127639), CD11b-BV785 (BioLegend, 1012430), F4/80-PE (BioLegend, 123110), IA/IE-FITC (BioLegend, 107605), CD80-BV650 (BioLegend, 104732), CD206-APC (BioLegend, 141708), CD11c-BV421 (BioLegend, 117343), CD40-PE/Cy7 (BioLegend, 124622), CD3-AlexaFluor 700 (BioLegend, 100216), B220-AlexaFluor 700 (BioLegend, 103232), NK1.1-AlexaFluor 700 (BioLegend, 108730). After staining, cells were then fixed with Foxp3/Transcription Factor Staining Buffer Set (Thermo Fisher Scientific, 00-5523-00). Data acquisition was performed on a 3-laser, 12-color FACSCelesta (Becton Dickinson), and data were analyzed using FlowJo Software (V.10.6). The gating strategy for the myeloid panel can be found in online supplemental figure 1L.
Supplemental material
For the T cell panel, portions from the same single cell suspension were also cultured for 6 hours in RPMI+10% FBS in the presence of 2 μL/ml Cell Stimulation Cocktail (Thermo Fisher Scientific, 00497503). These cells were then washed and stained with Live/Dead Aqua (Thermo Fisher Scientific, L34965), CD45-PerCP/Cy5.5 (BioLegend), CD3-AlexaFluor 700 (BioLegend, 152316), CD4-BV785 (BioLegend, 100453), CD8a-APC/Fire750 (BioLegend, 100766), CD62L-BV421 (BioLegend, 104436), CD44-PE/Cy7 (BioLegend, 103029), NK1.1-BV605 (BioLegend, 108753), CD279-PE (BioLegend, 135205). After viability and surface staining, cells were then fixed and permeabilized with Foxp3/Transcription Factor Staining Buffer Set (Thermo Fisher Scientific, 00-5523-00), and then stained with IFN-γ-FITC (BioLegend, 505806) and FOXp3-AlexaFluor 647 (BD, 563486). Data acquisition was performed on a 3-laser, 12-color FACSCelesta (Becton Dickinson), and data were analyzed using FlowJo Software (V.10.6). The gating strategy for the lymphocyte panel can be found in online supplemental figure 1M.
In independent experiments, ascites were processed as described above but used to immunophenotype other immune cell populations with additional flow panels. For the B cell panel, single cell suspensions were cultured for 6 hours in RPMI+10% FBS in the presence of 2 μL/mL Cell Stimulation Cocktail (Thermo Fisher Scientific, 00497503) and LPS (Thermo Fisher Scientific, 004976-93). These cells were then washed and stained with Live/Dead Aqua (Thermo Fisher Scientific, L34965), CD45-SparkBlue 550 (BioLegend, 103165), CD3e-AlexaFluor 700 (BioLegend, 152316), B220 (CD45R)-APC/Fire 750 (BioLegend, 103259), CD19-BV750 (BioLegend, 115561), CD23-PE/Dazzle 594 (BioLegend, 101633), IgM-APC (BioLegend, 406509), IgD-BV421 (BioLegend, 405725), CD5-PE/Cy7 (BioLegend, 100621), CD43-FITC (BioLegend, 143203), I-A/I-E (major histocompatibility complex (MHC)-II)-Pacific Blue (BioLegend, 107619), CD24-BV605 (BioLegend, 101827), CD1d(Ly-38)-PerCP/Cy5.5 (BioLegend, 123513). After viability and surface staining, cells were then fixed and permeabilized with Foxp3/Transcription Factor Staining Buffer Set (Thermo Fisher Scientific, 00-5523-00), and then stained with IL-10-PE (BioLegend, 505007). Data acquisition was performed on a 3-laser Aurora spectral cell analyzer (Cytek Biosciences), and data were analyzed using FlowJo Software (V.10.6). The gating strategy for the B cell panel can be found in online supplemental figure 7.
Supplemental material
The CITE-seq validation panel included: L/D Aqua Fluor (Thermo #L34965), CD45 SB550 Fluor (BioLegend #103165), Ly-6G APC/Fire750 Fluor (BioLegend, 127651), CD3 BV785 Fluor (BioLegend #100231), CD19 BV605 Fluor (BioLegend #115539), CD4 AF647 Fluor (BioLegend, 100533), CD8a PE Fluor (BioLegend 100707), NK-1.1 BV421 Fluor (BioLegend #108731), CD11b BV650 Fluor (BioLegend #101239), Ly-6C FITC Fluor (BioLegend #128005), CD11c PerCP/Cy5.5 Fluor (BioLegend #117327), I-A/I-E (MHC-II) AF700 Fluor (BioLegend #107621), CD103 PacBlue Fluor (BioLegend #121417), B220 (CD45R) PE/Cy5 Fluor (BioLegend #103209), CD172a (SIRPa) PE/Cy7 Fluor (BioLegend #123145), and F4/80 PE/Dazzle594 Fluor (BioLegend #123145). The gating strategy for the CITE-Seq validation panel can be found in online supplemental figure 7.
10X Genomics Prep for CITE-seq analysis
Single cell libraries were prepared using 10X Genomics 5’ Feature Barcode Kit (#1000256), Dual Index Kit TN Set A (#1000250), Chromium Next GEM Single Cell 5’ Kit v2 (#1000265), Chromium BCR and TCR Amplification Kits (#1 000 255 and #100254), Dual Index Kit TT Set A (#1000215), Library Construction Kit (#1000190), and Chromium Next GEM Chip K Single Cell Kit (#100287). Ascites fluid from each sample were collected and centrifuged at 500× g for 8 min at 4°C to to pellet cells; 1 mL of ACK Lysis Buffer (ThermoFisher, #A1049201) per 100 µL of cell pellet was used to resuspend the cell pellets in a 15 mL conical tube. The tubes were then inverted at room temperature for 2 min, followed by the addition of 5 mL 1X PBS. The samples were then spun at 500× g for 8 min at 4°C to pellet the cells and the ACK lysis steps were repeated. The pellets were resuspended in 0.5 mL of EasySep Buffer (STEMCELL #20144) and strained through a 70 µM FlowMi cell strainer tip into a 2 mL Eppendorf LoBind tube. Cells were counted using a hemacytometer and sample viabilities under 90% were put through the EasySep Dead Cell Removal (Annexin V) kit protocol (Stem Cell Technologies, #17899). After counting, the samples were centrifuged at 300× g for 5 min at room temperature and the supernatant was removed. EasySep Buffer was added to bring the concentration to 100e6 cells/mL or so that the volume was at least 100 µL. The clustering and gating strategy for the ‘10X Panel’ and CITE-seq validation can be found in online supplemental figure 7.
10X Genomics workflow
Into a 96-well V-bottom plate, 100 µL of samples were plated and centrifuged for 5 min at 500× g at 4°C. The supernatant was removed and a 10X Blocking Buffer (Cell Staining Buffer, TruStain FcX PLUS (antimouse CD16/32)) antibody (BioLegend #156603/156604) master mix was made. Samples were resuspended in 50 µL of the 10X Blocking Buffer and transferred into 75 mm flow cytometry tubes then incubated at 4°C for 10 min. The antibody pool was prepared using titrated TotalSeq-C antibodies: CD45 (BioLegend, 103169), Ly-6G (BioLegend, 127657), CD3 (BioLegend 100623), CD19 (BioLegend, 115571), CD4 (BioLegend, 100571), CD8a (BioLegend, 100785), NK-1.1 (BioLegend, 108765), CD11b (BioLegend, 101275), Ly-6C (BioLegend, 128051), CD11c (BioLegend, 117361), I-A/I-E (MHC-II) (BioLegend, 107658), CD103 (BioLegend, 121442), B220 (CD45R) (BioLegend, 103273), CD172a (SIRPa) (BioLegend, 144041), and F4/80 (BioLegend #123157). The prepared antibody cocktail was added to the 50 µL blocked cell suspension and incubated for 30 min at 4°C. 3 mL of Cell Staining Buffer was added to each sample and spun for 4°C at 5 min at 500× g. This step was repeated twice more. After removing the supernatant, the samples were resuspended in 200–500 µL of PBS+2% BSA and filtered through a 70 µm FlowMi cell strainer into a 2 mL Eppendorf LoBind tube. Cell viability and counting was performed again, and the volumes were adjusted for the 10X Chromium Chip input at a concentration of 1000 cells/µL. The GW Genomics Core used the 10X Genomics Chromium Controller to create GEM bead emulsions and subsequent library prep steps using 10X Genomics kits. Bead emulsions included surface target protein antibodies obtained from BioLegend. The WashU GTAC Core sequenced the libraries on a NovaSeq 6000 (Illumina).
Flow immunophenotyping
Cells were centrifuged for 5 min and resuspended at a final concentration of 1e6 cells/100 µL in Cell Staining Buffer (BioLegend #420201); 100 µL of cells were plated in a 96-well V-bottom plate and washed with 100 µL of 1X PBS. After centrifuging the samples at 500× g for 5 min at 4°C, the supernatant was discarded and washed again with 200 µL of 1X PBS. The cells were then resuspended in diluted Live/Dead Aqua (Thermo Fisher Scientific, L34967) and incubated on ice for 30 min protected from light. Cells were washed with 150 µL of 1X PBS and centrifuged at 500× g for 5 min at 4°C. Surface antibodies were suspended in Cell Staining Buffer (BioLegend, 4420201) with Brilliant Stain Buffer plus (BD, 566385) prior to antibody addition. Cells were blocked and stained as described above in section X. Cells were then fixed using BD Cytofix/Cytoperm Buffer (BD, 554722, 554714) and incubated for 20 min at 4°C. The samples were spun at 500× g at 4°C for 5 min and the supernatant was removed. Cells were resuspended in 200 µL Cell Staining Buffer and then strained with a cell strainer cap before running on a 3-laser Aurora spectral cell analyzer (Cytek Biosciences).
CITE-seq analysis of shAdar1-DNMTi-treated C57BL6/J mice
Sequenced samples were trimmed and aligned using CellRanger/7.0.0. Background noise from antibody-derived tags (ADTs) was removed using the dsb/1.0.2 package DSBNormalizeProtein() function using a raw ADT count matrix and defined empty droplet count matrix.44 Denoise.counts argument was set to TRUE to remove cell-cell technical variations. Denoised samples were then moved to Seurat/4.0.6 where individual SeuratObjects were made using the CreateSeuratObject() function adding both RNA and denoised ADT matrices together. Seurat objects where then merged together using the Seurat merge() function. The merged Seurat object was split by treatment group (shGFP-Mock or shAdar1-DNMTi). The integration of scRNA-seq data was then analyzed using methods described by Stuart Butler et al 45. Using Seurat functions ScaleData, RunPCA, RunUMAP, and FindClusters, RNA and protein clustering was performed for both treatment groups. Differential analysis was performed using the multtest/2.52.0 and /1.8 package functions FindConservedMarkers for individual clusters. Protein expression analysis was used to rename clusters based on cell type, and gene enrichment analysis per cell type was performed. CITE-seq antibody expression cluster expression can be found in online supplemental figure 7.
Results
Adar1 loss decreases tumor burden and prolongs survival, which is further enhanced by DNMTi treatment
To test the hypothesis that Adar1 loss synergizes with DNMTi in vivo, we combined DNMTi and Adar1 knockdown in an aggressive model of OC. This murine OC model uses implantable Trp53-/- ID8 ovarian carcinoma cells which are syngeneic to C57BL/6 mice and thus enable the study of an intact immune system.10 24 35 The CRISPR-engineered Trp53-/- ID8 line is more representative of the human disease because TP53 mutations occur in over 90% of HGSOCs.35 46 Mice in this ID8 model develop hemorrhagic ascites (a buildup of malignant fluid in the peritoneum), and tumor nodules are disseminated throughout the peritoneal cavity, closely modeling advanced disease in humans.35 47 It has been previously shown that accumulation of ascites is a marker of advanced, disseminated OC in humans,47 and can be used as a surrogate measure of tumor burden.10
Mice were implanted with control tumors (shGFP in the Trp53-/- ID8 cell line background) or Adar1 knockdown tumors (shAdar1 in the Trp53-/- ID8 cell line background) and given either Mock or THU/DNMTi treatment (figure 1A). THU is a competitive inhibitor of cytidine deaminase, the enzyme which rapidly breaks down 5-Aza and decitabine/Dac in vivo.43 48 With this regimen, Dac and 5-Aza were alternated to exploit cross-priming mechanisms as shown in previous studies.48 49 This new THU/DNMTi treatment regimen offers significant survival advantage in the Trp53-/- mouse model of OC (online supplemental figure 1A–C) compared with our previous treatment regimen (online supplemental figure 1D–F).10 24 Importantly, we began treating mice much later post-tumor implantation for the Adar1 studies (4 weeks compared with 1 week) to achieve a more clinically relevant model since patients with HGSOC are often diagnosed and treated at advanced stages of disease.46

Adar1 loss decreases tumor burden and prolongs survival, which is further enhanced by DNMTi treatment and correlates with increases of CD8+ T cells and NK cells in the tumor microenvironment. (A) Schematic of mouse experiment. ID8 Trp53-/- shGFP (control) or shAdar1 knockdown tumor cells were grown in tissue culture dishes and then 5e6 cells were i.p. injected into mice. Mock or THU/DNMTi treatment began around week 4 (advanced stage of disease), and around week 6, mice began developing ascites (a buildup of fluid in the peritoneum). (B) Survival curve. shGFP/Mock n=9 (one mouse was excluded: it did not develop ascites and was identified as an outlier using the ROUT method), shGFP/DNMTi n=10 (no mice excluded/censored), shAdar1/Mock n=9 (one mouse was excluded: it did not develop ascites and was identified as an outlier using the ROUT method), shAdar1/DNMTi n=7 (three mice were censored: one mouse was sacrificed due to a severe dermatitis condition, one mouse had an accidental/fatal fall, and one mouse was still alive and well at the end of the predefined, 20-week long study). One limitation of this model is that mice do not typically develop palpable tumors, thus making it difficult to know whether each mouse was effectively inoculated prior to start of treatment. (C) Ascites fluid drained at week 7 (attempted from all mice that were still alive from each group). Ascites is a sign of advanced stage of disease and ascites volume is an indicator of tumor burden. (D) Ascites fluid collection over time. (E–H) Immunophenotyping was performed on ascites drained from mice in figure 1A via flow cytometry. For flow analysis days, all mice that were still alive had an attempted ascites drain (despite body weight and circumference), and all samples obtained were analyzed. One limitation of this model is that ascites is required for flow analysis of the TME, and the mice in different groups do not develop ascites at the same time. To minimize potential batch effect, drain and flow stain days were chosen to maximize the number of samples obtained from two or more groups at one time. Due to difference in disease progression in each group, the shAdar1 Mock group (group 3) only resulted in two data points (two mice), which is too few data points to perform statistical analysis on. Therefore, all data are shown, although statistical comparisons have been excluded for group 3. Group 1: mice injected with shGFP (control) cells and given mock treatment (n=9). Group 2: mice injected with shGFP (control) cells and given THU/DNMTi treatment (n=8). Group 3: mice injected with shAdar1 (Adar1 knockdown) cells and given mock treatment (n=2). Group 4: mice injected with shAdar1 (Adar1 knockdown) cells and given THU/DNMTi treatment (n=5). (E) Absolute lymphocyte cell count (per mL of ascites). Absolute lymphocyte cell count (per mL of ascites) plotted against survival. (F) Absolute myeloid cell count per (per mL of ascites). Absolute myeloid cell count per (per mL of ascites) plotted against survival. (G) Absolute count of CD8+ T cells (per mL of ascites). Absolute count of CD8+ T cells (per mL of ascites) plotted against survival. (H) Absolute count of NK cells (per mL of ascites). Absolute count of NK cells (per mL of ascites) plotted against survival. Spearman’s correlation was performed for statistical significance on linear regression graphs. A one-way ANOVA was performed for statistical significance on box-and-whisker graphs. Gehan-Breslow-Wilcoxon method was performed for statistical significance on Kaplan-Meier survival curve. A one-way ANOVA was performed for statistical significance on column graph. *P<0.05. ANOVA, analysis of variance; DNMTi, DNA methyltransferase inhibitor; i.p., intraperitoneally; NK, natural killer; THU, tetrahydrouridine; TME, tumor microenvironment.
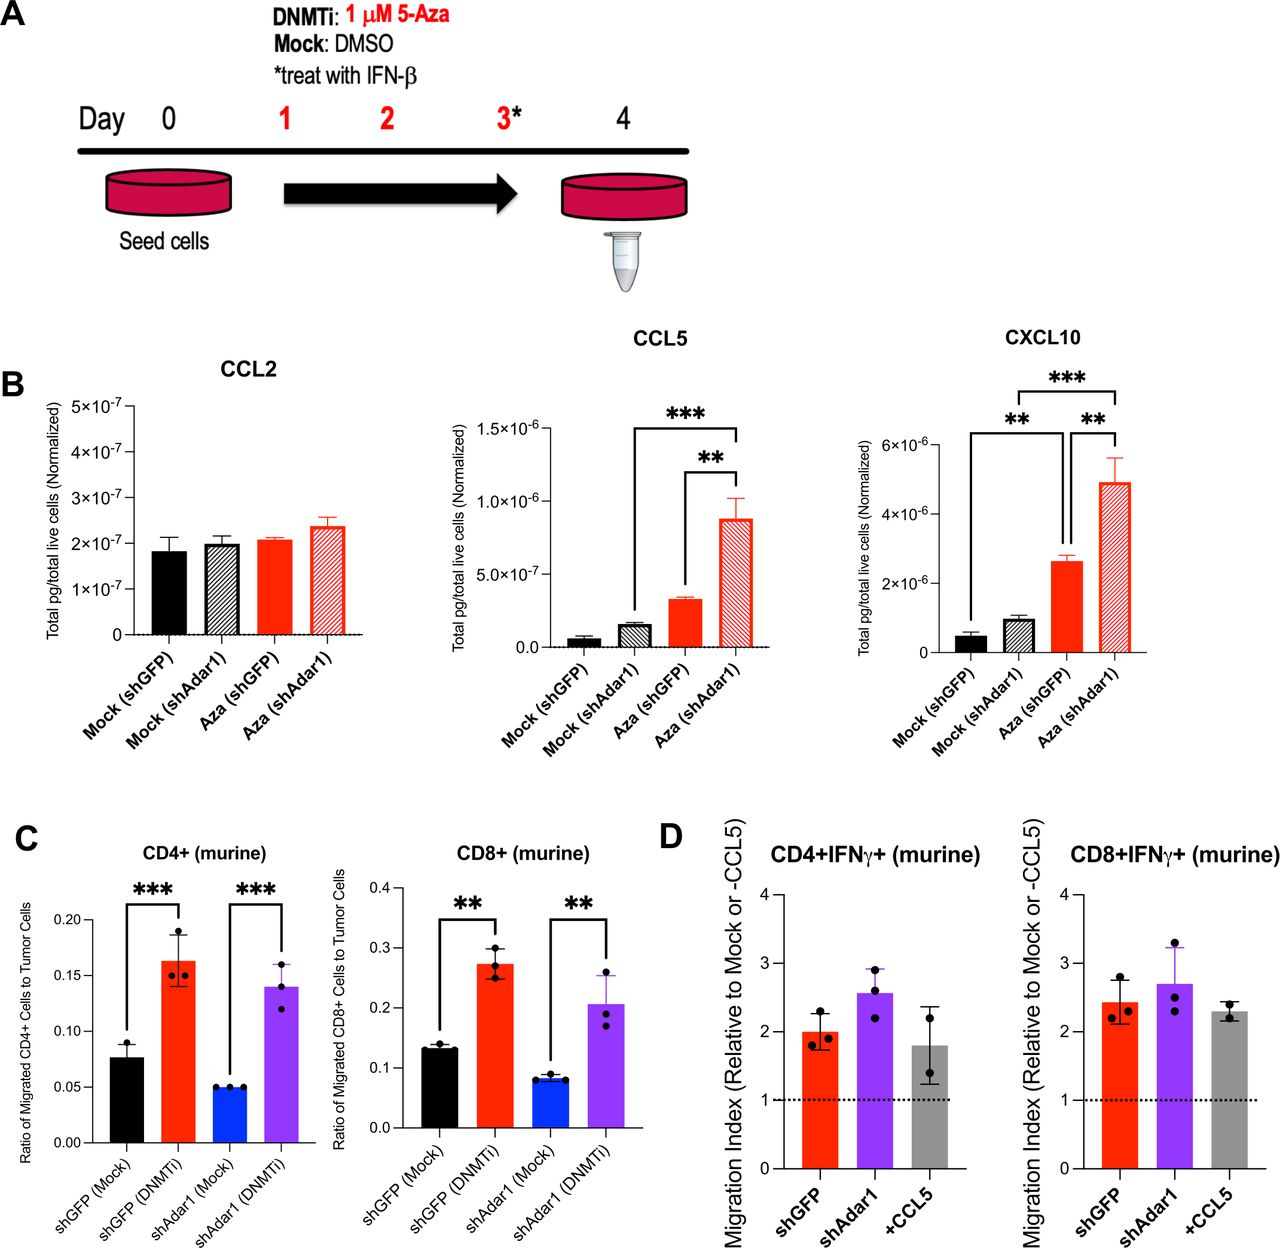
DNMTi treatment enhances secretion of pro-inflammatory chemokines from murine OC cells and increases migration of T cells. (A) ID8 Trp53-/- Adar1 knockdown (shAdar1) and control cells (shGFP) were plated on day 0 and treated with DNMTi for three consecutive days without media change. Cell culture supernatant was collected on day 4 for chemokine/cytokine analysis with the BioLegend LEGENDplex Mouse Anti-Virus Response Panel. Chemokine/Cytokine levels were normalized by number of live cells. (C) Graphs show ratio of migrated CD4+ or CD8+ T cells to tumor cells. (D) Graphs show migration index, which is the fold change of DNMTi-treated migrated T cells to mock-treated migrated T cells (red and purple bars), or alternatively, the fold change of migrated T cells in the +CCL5 condition to the −CCL5 condition (gray bars). A one-way analysis of variance was performed for statistical significance. *P<0.05; **p<0.01; ***p<0.001. 5-AZA, 5-zaacytidine; DMSO, dimethyl sulfoxide; DNMTi, DNA methyltransferase inhibitor; IFN, interferon; OC, ovarian cancer.
Mice implanted with Adar1 knockdown cells and treated with DNMTi had significantly longer survival than all other groups (p<0.05) (figure 1B). Additionally, mice that were implanted with Adar1 knockdown tumors and received mock treatment lived significantly longer than both groups of mice that were implanted with the control (shGFP) tumor cells, with or without DNMTi. Average ascites volume was significantly decreased at week 7 for all groups compared with the group implanted with control (shGFP) cells and given mock treatment (figure 1C). Although the mice with Adar1 knockdown tumors did not present with ascites at week 7, most of these mice did develop ascites at later timepoints. Mice with Adar1 knockdown tumors had a reduced rate of ascites accumulation and a reduced total volume of ascites compared with the mice with control (shGFP) tumors (figure 1D). Using ascites as a surrogate marker of tumor burden,10 we thus conclude that overall tumor burden was decreased in mice implanted with Adar1 knockdown tumors compared with mice implanted with control (shGFP) tumors.
Combined DNMTi treatment and Adar1 loss increases lymphocytes in the tumor microenvironment
We hypothesized that the combined effect of Adar1 loss and DNMTi treatment on survival and tumor burden was due to changes in the immune microenvironment. To identify immune populations responsible for the reduction in tumor burden, we immunophenotyped cells in the ascites fluid from the four groups of mice (figure 1E–H, online supplemental table 1). When we analyzed absolute cell counts (per mL of ascites) of lymphocytes, we observed that lymphocytes significantly increased with Adar1 loss and DNMTi treatment (figure 1E). Additionally, the absolute lymphocyte count (per mL of ascites) positively correlated with survival (figure 1E). However, absolute cell counts of myeloid cells (figure 1F) did not significantly change, and there was no association between absolute myeloid cell count (per mL of ascites) and survival.
Supplemental material
Combined DNMTi treatment and Adar1 loss increases CD8+ T cells and NK cells in the tumor microenvironment
When we performed a more comprehensive breakdown of the cellular composition of the ascites (figure 1G,H, online supplemental figure 1G–K), we found that absolute cell concentration (per mL of ascites) of CD8+ T cells (figure 1G) and NK cells (figure 1H) were significantly increased with the combination of Adar1 loss and DNMTi treatment (p<0.05). Additionally, survival positively correlated with the absolute number of CD8+ T cells (figure 1G) and the absolute number of NK cells (figure 1H). Except for IFN-γ+CD8+ T cells (online supplemental figure 1G), frequencies of lymphocyte subpopulations did not change significantly. Interestingly, although total numbers of CD8+ T cells were increased, the combination of Adar1 loss and DNMTi treatment significantly (p<0.05) decreased the percentage of CD8+IFN-γ+ T cells of total CD8+ T cells (online supplemental figure 1G). This reduction in CD8+IFN-γ+ T cell frequency was despite non-significant changes in the frequency of PD-1+CD8+ T cells (online supplemental figure 1G), suggesting that this reduction in functional CD8+ T cells was not due to exhaustion. We also did not observe any significant changes in frequency of NKT cells (online supplemental figure 1H), CD4+ T cells (online supplemental figure 1I) or memory/effector/naïve subsets of CD4+ T cells of CD8+ T cells (online supplemental figure 1J,K). Overall, the biggest impact of DNMT and Adar1 inhibition was a significant recruitment of lymphocytes to the TME. This change shifts the TME from immunosuppressive to more immune permissive, which is consistent with an increase in type I IFN signaling and release of downstream pro-inflammatory cytokines and chemokines.1 12
DNMTi enhances secretion of pro-inflammatory chemokines from murine OC cells and increases migration of T cells
We hypothesized that DNMTi-induced type I IFN signaling in tumor cells causes secretion of pro-inflammatory chemokines capable of inducing migration of lymphocytes to the tumor. To test this hypothesis, we treated ID8 Trp53-/- control (shGFP) and Adar1 knockdown (shAdar1) cells in vitro with Mock (DMSO) or DNMTi (Dac, Aza) and assessed secreted chemokine levels (figure 2A,B).50 DNMTi-induced induced type I IFN signaling resulted in increased secretion of pro-inflammatory chemokines from tumor cells. 5-Aza treatment significantly (p<0.05) increased the levels of the chemokines CCL5 and CXCL10 in ID8 Trp53-/- cells with Adar1 knockdown compared with control (shGFP) cells (figure 2B). Dac treatment significantly (p<0.05) increased the levels of these chemokines compared with mock-treated cells (online supplemental figure 2A). Overall, we conclude that the production of chemokines is largely driven by DNMTi rather than Adar1 loss alone or in combination with DNMTi.
Supplemental material
To determine whether these levels of CCL5 and CXCL10 could induce T cell migration, we performed transwell chemotaxis/cell migration assays (online supplemental figure 2B). We treated Adar1 knockdown versus control ID8 Trp53-/- cells with DNMTi for three consecutive days, and on day 4, performed a transwell chemotaxis/migration assay using activated, murine T cells from non-tumor bearing syngeneic mice (figure 2C,D, online supplemental figure 2C,D). The ratio of migrated CD4+ and CD8+ T cells to tumor cells was significantly higher (p<0.05) with DNMTi treatment irrespective of Adar1 status (figure 2C). Furthermore, ~2.5-fold more CD4+IFN-γ+ and CD8+IFN-γ+ T cells migrated in wells with DNMTi-treated ID8 Trp53-/- cells (shGFP or shAdar1) compared with T cells in mock-treated wells (figure 2D). We thus conclude that DNMTi treatment increases secretion of inflammatory chemokines CCL5 and CXCL10, causing increased T cell migration relative to number of live tumor cells.
Combined Adar1 loss and DNMT inhibition significantly increases numbers of tumor-specific, cytotoxic CD8+ T cells
To understand the difference in cytotoxic lymphocytes in the TME and survival conferred by Adar1 knockdown, we assessed the cytotoxicity of CD8+ T cells from the different mouse groups in figure 1. We hypothesized that mice implanted with shAdar1 tumors receiving DNMTi treatment were generating more tumor-specific CD8+ T cells compared with the control mice (shGFP tumors with mock treatment). To test this hypothesis, we first independently assessed the effect of DNMTi treatment on CD4+ and CD8+ T cells isolated from spleens of healthy, non-tumor-bearing mice. After treating with DNMTi or mock for three consecutive days, we observed significantly higher concentrations of secreted IFN-γ in the cell culture supernatant (figure 3A). It has previously been shown that loss of methylation through genetic deletion of DNA methyltransferase enzymes in T cells,51 52 or DNMTi treatment of exhausted T cells in models of chronic viral infection,53 increases IFN-γ expression, which we confirm in our ex vivo model.

Combined Adar1 loss and DNMT inhibition significantly increases numbers of tumor-specific, cytotoxic CD8+ T cells. (A) CD4+ or CD8+ T cells were isolated from spleens of healthy, non-tumor-bearing mice and treated with mock or 5-Aza for 3 days. IFN-γ protein concentration was then assessed in the cell culture media supernatant. (B) Total CD8+ T cells isolated from spleens of shGFP mock-treated mice or shAdar1 THU/DNMTi-treated mice. (C,D) Co-culture cytotoxicity assay. Per cent (%) specific lysis measured at 4 hours from co-cultures of: (1) shGFP mock-treated tumor cells+CD8+ splenic T cells from the shGFP mock-treated mice or from the shAdar1 THU/DNMTi-treated mice; (2) shGFP DNMTi-treated tumor cells+CD8+ splenic T cells from the shGFP mock-treated mice or from the shAdar1 THU/DNMTi-treated mice; (3) shAdar1 mock-treated tumor cells+CD8+ splenic T cells from the shGFP mock-treated mice or from the shAdar1 THU/DNMTi-treated mice; and (4) shAdar1 DNMTi-treated tumor cells+CD8+ splenic T cells from the shGFP mock-treated mice or from the shAdar1 THU/DNMTi-treated mice. (D) Per cent (%) specific lysis measured at 48 hours of co-culture (same groups as in figure 3C). *P<0.05; **p<0.01; ***p<0.001. 5-AZA, 5-zaacytidine; DNMT, DNA methyltransferase; DNMTi, DNA methyltransferase inhibitor; IFN, interferon; ns, not significant; THU, tetrahydrouridine.
Next, we isolated CD8+ T cells from spleens of mice in the shGFP/Mock group and the shAdar1/DNMTi group and performed co-culture cytotoxicity assays with pretreated (mock or DNMTi), luciferase-expressing shGFP or shAdar1 Trp53-/- ID8 cells. Not surprisingly, we isolated significantly more CD8+ T cells from the spleens of mice implanted with shAdar1 tumors and given DNMTi treatment compared with the mice implanted with shGFP tumors and given mock treatment (figure 3B). The shAdar1/DNMTi spleens were larger by eye, which suggested to us that this group had undergone more lymphoproliferation, and thus likely had more primed, tumor-specific CD8+ T cells.
Regardless of tumor Adar1/treatment status, CD8+ T cells from shAdar1/DNMTi mice exhibited higher baseline cytotoxicity compared with CD8+ T cells from shGFP/Mock mice (figure 3C,D, online supplemental figure 3). These data further suggest that the mice in the shAdar1/DNMTi group have more tumor-specific CD8+ T cells. At the 4-hour timepoint, we observed that shGFP DNMTi-treated tumor cells had significantly increased cytotoxicity (figure 3C, online supplemental figure 3A), likely due to increased MHC-I presentation.54 55 Activated CD8+ T cells can recognize peptides presented by tumor cell MHC-I and kill the tumor cell if it is an antigen that the T cell specifically recognizes.56 Furthermore, we have previously shown that DNMTi treatment upregulates MHC-I expression on the surface of OC cells.24 For quick killing to occur, a high tumor-specific T cell frequency would need to be present. For a high tumor-specific T cell frequency, the T cells in the spleen would have been primed and undergone proliferation weeks before T cell isolation. We did see evidence of lymphoproliferation in the shAdar1 DNMTi-treated mice (figure 3B), suggesting that T cells from that group were capable of specifically killing and lysing tumor cells. Alternatively (or in addition too), IFN-γ secreted from T cells can induce endoplasmic reticulum stress and trigger apoptosis in tumor cells.57
Supplemental material
Interestingly, this cytotoxicity was not sustained by the 48-hour timepoint (figure 3D, online supplemental figure 3B). We observed greatest sustained cytotoxicity in shAdar1 mock or DNMTi-treated tumors (~35% specific lysis) when co-cultured with CD8+ T cells from mice in the shGFP Mock group or the shAdar1 DNMTi group. The cytotoxicity observed at the 48 timepoint likely involves both (1) direct tumor cell recognition and killing by CD8+ T cells through specific peptide presentation through MHC-I, but also (2) indirect killing through IFN-γ-mediated mechanisms. These data further show that Adar1 loss sensitizes tumor cells to IFN-γ-mediated cytotoxicity.
Adar1 loss increases sensitivity to type I interferon in murine cell lines
While we observed evidence of tumor extrinsic mechanisms of tumor control on shAdar1 loss/DNMTi treatment of OC cells (figures 1–3), we hypothesized that tumor intrinsic mechanisms could also be involved.58 DNMTi plus Adar1 loss in vivo resulted in longer survival and lower tumor burden (figure 1B–D), which could result from (1) direct tumor killing by immune cells (tumor extrinsic) or (2) type I IFN-driven cytotoxic or cytostatic effects (tumor intrinsic). To test the hypothesis that Adar1 loss increases sensitivity to type I IFN as previously shown in human lung cancer cell lines59 and breast cancer cell lines,60 we performed growth assays using shAdar1 and control cells (shGFP) in the ID8 Trp53-/- cell line background (figure 4). Since previous studies have demonstrated that DNMTi treatment induces type I IFN (such as IFN-β),11 we used exogenous IFN-β as a control for the growth assays. We treated shGFP and shAdar1 cells with Mock (DMSO), DNMTi (Dac, 5-Aza) or IFN-β in growth inhibition assays (figure 4A). We first assessed secretion of IFN-β in the cell culture supernatant after 3 days of Mock or DNMTi treatment. We observed that 5-Aza treatment significantly increased IFN-β levels in ID8 Trp53-/- cells with Adar1 loss compared with control (p<0.05) (figure 4B). We did, however, also see significantly increased IFN-β levels when comparing Dac-treated shGFP with mock-treated shGFP. Likely in response to this tumor intrinsic production of IFN-β, we observed robust induction of the IFN-inducible Adar1 p150 isoform by day 7 in the DNMTi-treated ID8 Trp53-/- control (shGFP) cells (figure 4C). Although growth was not significantly different between mock-treated shGFP control cells (gray bar) and Adar1 knockdown cells (blue bar) (online supplemental figure 4A), we observed that Adar1 loss confers increased sensitivity to IFN-β, Dac, and 5-Aza treatment (figure 4D).
Supplemental material

Adar1 loss increases sensitivity to type I IFN in murine OC cell lines. (A) Schematic for growth inhibition assay. ID8 Trp53-/- Adar1 knockdown (shAdar1) and control cells (shGFP) were plated on day 0 and then treated with DNMTi for three consecutive days without media change. Cell culture supernatant was collected on day 4 for chemokine/cytokine analysis, and cell pellets were harvested on day 4 for western blot analysis. Cells were re-plated on day 4 and harvested on day 7 for western blot analysis. (B) Cell culture supernatant from day 4 was analyzed using BioLegend LEGENDplex Mouse Anti-Virus Response Panel. IFN-β cytokine levels normalized by number of live cells. (C) Representative western blot analysis of Adar1 protein expression at day 7. (D) Growth inhibition assays showing IFN-β or DNMTi (Dac and 5-Aza) compared with Mock (each condition performed in triplicate). (E) Schematic for colony formation assay. Cells were plated on day 0, and then anti-IFNAR1 or isotype control (10 μg/mL) was given on days 1, 3, 6, and 9. Cells were treated on days 1, 2, and 3 with either DMSO, Dac (100 nM), or 5-Aza (1 μM). IFN-β condition was treated on day 3. Cells were incubated until day 10 when they were subsequently stained with crystal violet. (F) Colony formation assays showing Mock, 5-Aza, and IFN-β (each condition performed in triplicate). (G) Colony formation assays using 100 μg/mL of anti-IFNAR1 or isotype control and showing Mock, 5-Aza, and IFN-β (each condition performed in triplicate). A one-way analysis of variance was performed for statistical significance. *P<0.05; **p<0.01; ***p<0.001. 5-AZA, 5-zaacytidine; Dac, 2’-deoxy-5-azacytidine; DMSO, dimethyl sulfoxide; DNMTi, DNA methyltransferase inhibitor; IFN, interferon; IFNAR1, interferon alpha and beta receptor 1; OC, ovarian cancer.
We next assessed long-term growth using colony formation assays (10 days in culture) with and without blockade of the type I IFN receptor (figure 4E). For these experiments, we used an antibody against IFNAR1, to inhibit type I IFN signaling. Colony formation assays test the ability of a single cell to grow into a colony, and thus can be used to determine cell reproductive death after experimental perturbation.61 After treating with exogenous IFN-β, we observed that Adar1 knockdown cells were strikingly more sensitive to IFN-β compared with control shGFP cells (figure 4F). Additionally, we observed that IFNAR1 blockade did not rescue cell growth in Adar1 knockdown cells, although it rescued growth for control cells. We hypothesized that a higher concentration of the IFNAR1 blocking antibody was required for rescue of IFN-β-stimulated Adar1 knockdown cells. This would likely be due increased cell surface expression of IFNAR1, or compromised surface stability of IFNAR1 (resulting in increased receptor endocytosis and recycling).62 63 When we perform IFNAR1 blockade and subsequently treat with exogenous IFN-β (online supplemental figure 4B), we observe robust upregulation of the ISG Ifi27 in the Adar1 knockdown cells (striped red bar), but not in control cells (striped gray bar) (online supplemental figure 4C). IFN-β stimulation did not robustly induce expression of an ISG (Ifi27) at 24 hours poststimulation in the control (shGFP) cell line (solid gray bar), although this gene was robustly upregulated in Adar1 knockdown cell line at the same timepoint (solid red bar) (online supplemental figure 4C). This suggests that the Adar1 knockdown cell line is more sensitive to type I IFN. These combined data suggest that Adar1 knockdown cells have increased cell surface expression of the type I IFN receptor, potentially explaining their increased sensitivity to type I IFN in cells with Adar1 loss. For example, certain viruses have been shown to antagonize type I IFN signaling by inhibiting IFNAR1 surface expression,64 and other studies have reported that the absence of the intracellular Jak tyrosine kinase signaling domain Tyk2, mature IFNAR1 is weakly expressed on the cell surface.62 65
We thus performed the assay again and treated with a higher concentration of the IFNAR1 blocking antibody and observed a nearly complete rescue of growth in the Adar1 knockdown cells (figure 4G). We conclude that the growth inhibitory effects of Adar1 knockdown in OC cells are through canonical type I IFN signaling. Furthermore, we treated Adar1 knockdown cells (shAdar1) or control cells (shGFP) with Dac or 5-Aza and observed that Adar1 loss confers increased sensitivity to DNMTi treatment independent of IFN-β sensing (figure 4G). A major mechanism of DNMTis in tumor cells is demethylation of tumor suppressor genes, including p16, whose expression can promote tumor cell apoptosis independent of type I IFN signaling.10
Besides the ID8 Trp53-/- model, two additional murine OC cell lines show similar colony formation trends on Adar1 loss (online supplemental figure 4D–F). In these studies, we compared ovarian surface epithelial-derived CRISPR-modified ID8 cells: Trp53-/- and Trp53+/+ (the CRISPR control cell line).35 Although Trp53-/- knockout more closely resembles the mutational background seen in most human OC, the ID8 cell line is not derived from the same tissue of origin as HGSOC. Since human HGSOC is most commonly derived from the fallopian tube, we also performed these in vitro comparisons using the fallopian tube-derived HGS2 cell line.36 Colony formation assays demonstrate that Adar1 loss dramatically increased IFN-β sensitivity of both Trp53-/- cell lines (online supplemental figure 4F). We additionally compared IFN-β cytokine expression in the cell culture supernatant in the two Trp53-/- cell lines (ID8 Trp53-/- and HGS2) and the Trp53+/+ cell lines (ID8 CRISPR control) following DNMTi treatment (online supplemental figure 4G–I). DNMTis (5-Aza, Dac) induce a more robust IFN response in p53 wild-type murine cells, although an increased response is still elicited in Trp53-/- ID8 cells. Additionally, we observed similar trends across all three cell lines for secretion of CCL2, CCL5, and CXCL10 (online supplemental figure 4J–K). Overall, these data demonstrate that Adar1 inhibition increases type I IFN production and inhibits OC tumor cell growth in murine models when combined with DNMTi treatment. This is also consistent with studies in human cancer cells demonstrating that ADAR1 establishes a negative-feedback loop to restrict the DNMTi-induced IFN response.26
RNA editing of immunogenic RNA increases with DNMTi in human OC cells
As Adar1 knockdown plus DNMTi had significant benefit in a murine model of OC, we next assessed the effects of ADAR1 knockdown plus DNMTi treatment in a panel of human OC cell lines (figure 5). In our previous studies in human OC cell lines, we observed that TP53 mutant cells exhibited higher baseline TE expression, although they upregulated fewer TEs in response to DNMTi treatment compared with wild-type.13 We hypothesized that higher TE expression in human cell lines leads to the desensitization of IFN signaling, and that ADAR1 loss sensitizes these cell lines to IFN.

RNA editing of immunogenic RNA increases with DNMTi in human OC cells. (A–C) TykNu and isogenic CRISPR-edited Hey cell lines (TP53 R175H mutant/TP53 wild-type) were treated for five consecutive days with Mock (PBS) or 5-Aza (500 nM) and then harvested on day 9. Another set of flasks were stimulated with IFN-β for 24 hours prior to harvesting. Protein was isolated and immunoblotted for ADAR1 and β-actin (loading control). (D–F) TykNu and isogenic CRISPR-edited Hey cell lines (TP53 R175H mutant/TP53 wild-type) were treated for five consecutive days with Mock (PBS) or 5-Aza (500 nM) and then harvested on day 9. RNA was isolated from three treatment replicates each, and Illumina sequencing libraries were prepared and sequenced, resulting in paired-end, stranded reads. (D) Alu editing index and LTR editing for TykNu TP53 R175H mutant. (E) Alu editing index and LTR editing for Hey TP53 R175H mutant. (F) Alu editing index and LTR editing for Hey TP53 wild-type. (G) Colony formation assays showing Mock, IFN-β Dac±IFN-β, 5-Aza±IFN-β, and across TykNu shSCR or shADAR1 (each condition performed in triplicate). (H) Colony formation assays showing Mock, IFN-β Dac±IFN-β, 5-Aza±IFN-β, and across Hey TP53 mutant shSCR or shADAR1 (each condition performed in triplicate). Unpaired t-tests were performed for statistical significance for figure 1D,F. *P<0.05; **p<0.01. ADAR1, adenosine deaminase 1; 5-AZA, 5-zaacytidine; Dac, 2’-deoxy-5-azacytidine; DNMTi, DNA methyltransferase inhibitor; IFN, interferon; LTR, long-terminal repeat; OC, ovarian cancer; PBS, phosphate-buffered saline.
To test this hypothesis, we used the following panel of human OC cell lines: TykNu (TP53 R175H hotspot mutant), Hey (TP53 wild-type), and A2780 (TP53 wild-type). We CRISPR-modified the Hey cell line to have the same TP53 hotspot mutation in the TykNu cell line (R175H), and we have used this cell line for these studies along with our TP53 wild-type matching isogenic CRISPR control (clones HH23 and HC2, respectively). We first assessed IFN induction of the ADAR1 p150 isoform after treating with DNMTi or IFN-β (figure 5A–C). Interestingly, IFN-β stimulation did not upregulate ADAR1 p150 protein expression as robustly in the TP53 mutant cell lines in comparison to the TP53 wild-type cell line. This suggests that TP53 mutant cell lines exhibit decreased sensitivity to IFN. To determine whether DNMTi treatment impacts RNA editing, we performed RNA editing analysis in DNMTi-treated human OC cell lines. Alu elements are targets of ADAR1 and, on induction by DNMTis, trigger a type I IFN response.26 We used the RNA Editing Indexer tool to quantify A-to-I RNA editing from RNA-sequencing data38 from DNMTi-treated OC cell lines. We observed a significant increase in the Alu editing index38 in the TykNu OC cell line (TP53 R175H hotspot mutant) with DNMTi treatment compared with mock (figure 5D),66–68 and in the HH23 cell line (CRISPER-edited Hey with TP53 R175H hotspot mutation) (figure 5E), but not in the HC2 OC cell line (CRISPR control Hey cell line with TP53 wild-type) (p<0.05) (figure 5F).
We previously reported that the TP53-mutant cell lines had a significantly higher baseline expression of TEs compared with TP53 wild-type cell lines.13 We have also previously shown that inhibition of DNA methylation increases levels of immunogenic dsRNAs in OC cells and induces type I IFN signaling in tumor cells via viral mimicry.11 This increased RNA editing is likely due to increased baseline TE expression in TP53 mutant cell lines, as we previously published.13 After performing validation of RNA editing for other repetitive elements using a publicly available dataset (online supplemental figure 5A), we also assessed RNA editing of LTRs, ERVs and LINEs in these OC cell lines (online supplemental figure 5B–D). Interestingly, RNA editing increases with DNMTi, but not with IFN-β treatment in the TykNu cell line (online supplemental figure 5C). Strikingly, the LINE and L1 (LINE1) RNA editing index are significantly increased with DNMTi treatment in the TykNu cell line (online supplemental figure 5B,C), although those increases are not evident in either of the Hey cell lines (online supplemental figure 5D).
Supplemental material
To investigate the potential effect of RNA editing activity levels on sensitivity to DNMTi treatment and/or ADAR1 loss, we knocked down ADAR1 in the human OC cell lines (online supplemental figure 5E), performed growth assays (figure 5G–H, online supplemental figure 5F,G), and assessed expression of ISGs (online supplemental figure 5H–K). We observed that human OC cell lines have differential responses to ADAR1 loss and DNMTi treatment based on their TP53 status. The TykNu cell line (TP53 mutant) is strikingly sensitive to ADAR1 loss (figure 5G), likely due to high baseline levels of dsRNA expression.15 60 In the TykNu cell line, ADAR1 loss confers sensitivity to exogenous IFN-β stimulation or 5-Aza treatment, and increased levels of ISG expression are observed accordingly with combined ADAR1 loss and DNMTi treatment (online supplemental figure 5H). We observed a similar pattern with the Hey TP53 mutant isogenic clone (figure 5H). Strikingly, we did not observe sensitivity to DNMTi or IFN-β on ADAR1 knockdown in the Hey TP53 wild-type cell line (online supplemental figure 5F), which did not have as much effect on ISG response (online supplemental figure 5J). Interestingly, ADAR1 loss in A2780 (TP53 wild-type) confers increased sensitivity to exogenous IFN-β stimulation or 5-Aza treatment (online supplemental figure 5G), and we observe increases in ISG expression with DNMTi treatment (online supplemental figure 5K).
In conclusion, with combined ADAR1 loss and DNMT inhibition in human OC cell lines, we observed increased sensitivity to IFN, and increased expression of ISGs across a panel of human OC lines with different mutational backgrounds. We additionally show that RNA editing activity may be linked with DNMTi or IFN sensitivity in human OC cells. Overall, ADAR1 knockdown seemed to have the biggest effect on TP53 mutant human OC cells, which is translationally relevant as nearly all HGSOC tumors are TP53 mutant.69
Type I interferon signaling drives prolonged survival in mice with combined Adar1 loss and DNMT inhibition
We have previously shown that DNMTi treatment prolongs survival and reduces tumor burden (as measured by ascites accumulation), and that this response is ablated with IFNAR1 blockade.10 Thus, we next sought to delineate the effects of increased type I IFN sensitivity on tumor burden and survival in vivo for mice implanted with Adar1 knockdown tumors and treated with DNMTi. We implanted mice with Adar1 knockdown Trp53-/- tumors and treated with THU/DNMTi while blocking IFNAR1 (figure 6, online supplemental figure 6). Compared with Adar1 knockdown mice given DNMTi treatment and isotype control, IFNAR1 blockade significantly (p<0.05) decreased survival in mice implanted with Adar1 knockdown tumors and treated with THU/DNMTi (figure 6A). Furthermore, accumulation of ascites occurred sooner in combination Adar1 loss plus DNMTi-treated mice with blocked IFN response compared with isotype control (figure 6B).
Supplemental material
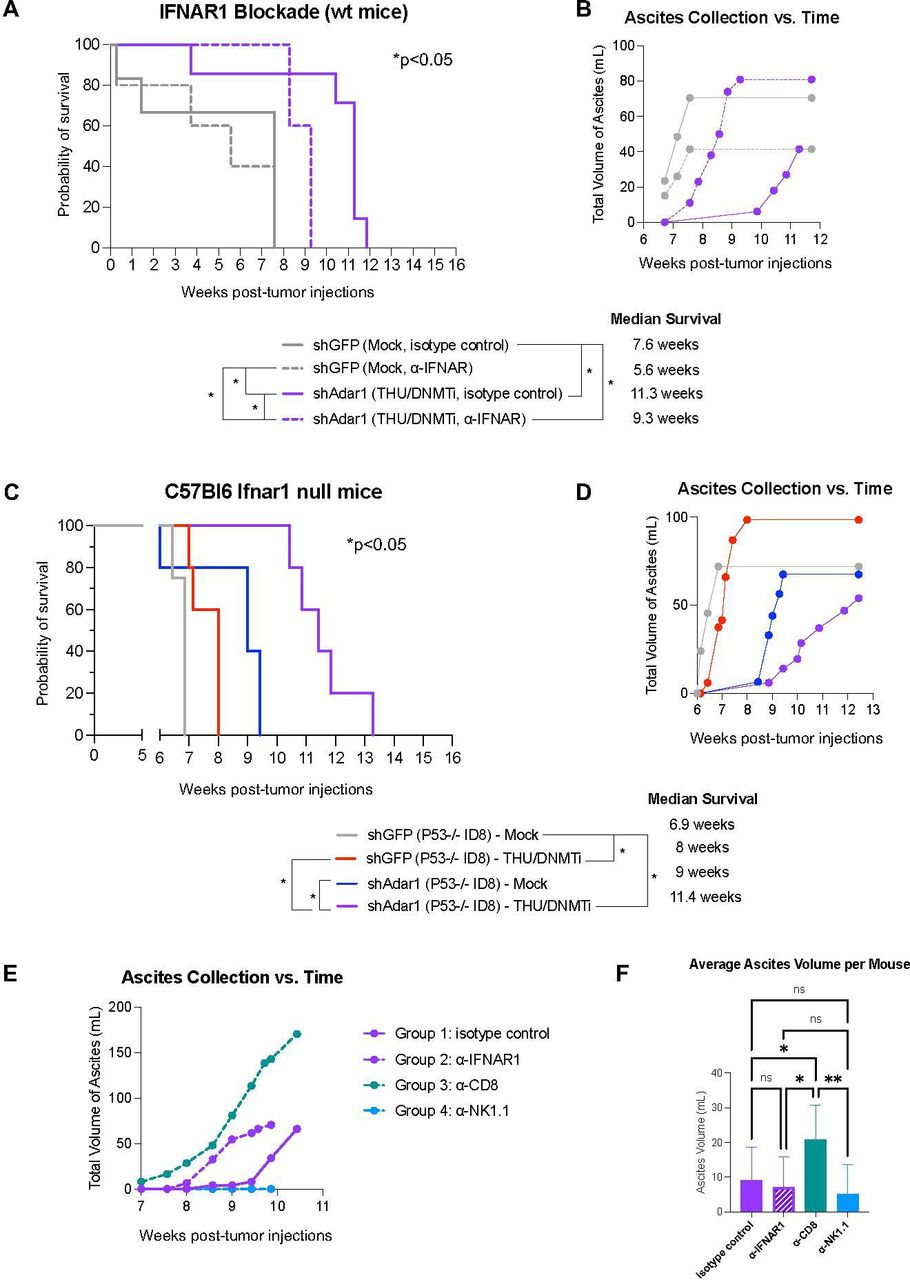
Prolonged survival in mice with combined Adar1 loss and DNMT inhibition is dependent on type I IFN signaling. (A) ID8 Trp53-/- shAdar1 knockdown tumor cells were grown in tissue culture dishes and then 5e6 cells were i.p. injected into C57Bl6 wild-type mice 1 day after the first injections of antibodies. THU/DNMTi treatment began around week 2. Survival curve for the following groups: shGFP Mock/isotype control group (n=5), shGFP Mock/anti-IFNAR1 group (n=5), shAdar1 THU/DNMTi/isotype control (n=7), shAdar1 THU/DNMTi/anti-IFNAR1 (n=5). Two mice from the shGFP Mock isotype control group were censored from the study because they had not developed tumors by the study end point (week 20). (B) Ascites (a buildup of fluid in the peritoneum) collected over time for mice in figure 6A. Ascites is a sign of advanced stage of disease and ascites volume is an indicator of tumor burden in this model. (C) Survival curve (n=5 per group). ID8 Trp5-/- shGFP (control) or shAdar1 knockdown tumor cells were grown in tissue culture dishes and then 5e6 cells were i.p. injected into mice. Mock or THU/DNMTi treatment began around week 2, and around week 6, mice began developing ascites (a buildup of fluid in the peritoneum). (D) Ascites (a buildup of fluid in the peritoneum) collected over time for mice in figure 6C. Ascites is a sign of advanced stage of disease and ascites volume is an indicator of tumor burden. (E) Ascites (a buildup of fluid in the peritoneum) collected over time for C57Bl6 wild-type mice that received shAdar1 tumors with THU/DNMTi treatment and either: (1) isotype control (n=10), (2) anti-IFNAR1 (n=10), (3) anti-CD8a (n=10), or (4) anti-NK1.1 (n=10) antibodies. ID8 Trp53-/- shAdar1 knockdown tumor cells were grown in tissue culture dishes and then 5e6 cells were i.p. injected into mice 1 day after the first injections of antibodies. THU/DNMTi treatment began around week 2. (F) Average volume of ascites (a buildup of fluid in the peritoneum) for C57Bl6 wild-type mice that received shAdar1 tumors with THU/DNMTi treatment and either: (1) isotype control (n=10), (2) anti-IFNAR1 (n=10), (3) anti-CD8a (n=10), or (4) anti-NK1.1 (n=10) antibodies. ID8 Trp53-/- shAdar1 knockdown tumor cells were grown in tissue culture dishes and then 5e6 cells were i.p. injected into mice 1 day after the first injections of antibodies. THU/DNMTi treatment began around week 2. *P<0.05; **p<0.01. DNMTi, DNA methyltransferase inhibitor; IFN, interferon; IFNAR1, interferon alpha and beta receptor 1; i.p., intraperitoneally; ns, not significant; THU, tetrahydrouridine.
Additionally, when we superimpose survival curves from the experiment in figure 1B onto the survival curves from the experiment in online supplemental figure 6A (online supplemental figure 6B), we observe that blockade of the type I IFN response in the shAdar1+DNMTi group (dotted purple line) shows similar survival as DNMTi treatment of the control (shGFP) group (solid red line). These survival trends, combined with data from our in vitro IFNAR1 blockade experiments (figure 4, online supplemental figure 4), show that the survival benefit of Adar1 loss is due to enhanced type I IFN signaling from the tumor cells.
Using an antibody to block IFNAR1, we have previously shown that blockade of type I IFN signaling ablates the DNMTi-induced effects on survival and ascites accumulation in mice implanted with ID8 murine ovarian tumors.10 We have also previously shown that inhibition of DNA methylation induces a type I IFN response in tumor cells through viral mimicry due to transcriptional induction of endogenous dsRNA.11 We next hypothesized that type I IFN produced by tumor cells signals to myeloid cells in the TME in a paracrine manner to amplify this immune response. To test this hypothesis, we injected control (shGFP) and Adar1 knockdown (shAdar1) tumor cells into mice lacking type I IFN receptor function (Ifnar1 null C57BL/6 mice). In contrast to total IFNAR1 blockade (figure 6A,B), survival and ascites accumulation were not dramatically affected in Ifnar1 mice (figure 6C,D) compared with wild-type mice (figure 1A–D). We thus conclude that potential paracrine signaling to myeloid cells in the TME has an inconsequential effect on survival and tumor burden in this mouse model of OC. Instead, chemokine and cytokine production from tumor cells, downstream of type I IFN signaling, is what attracts lymphocytes to control tumor burden.
CD8+ T cells control tumor outgrowth and prolong survival in mice with combined Adar1 loss and DNMT inhibition
We hypothesized that CD8+ lymphocytes, recruited by the above chemokines, were responsible for the control of tumor burden. In ex vivo co-culture assays, we demonstrated that CD8+ T cells from the shAdar1/DNMTi group displayed significantly higher levels of cytotoxicity at the 4-hour timepoint compared with CD8+ T cells from the shGFP/Mock group (figure 3C). We also showed that Adar1 knockdown tumors were more susceptible to CD8+ T cell killing by the 48-hour timepoint (figure 3D). To test this hypothesis in vivo, we depleted CD8+ T cells in mice with Adar1 knockdown tumors receiving DNMTi treatment (online supplemental figure 6A,C,D). Although we observed only a modest difference in survival in comparison to the mice that received isotype control (online supplemental figure 6A), we did observe notably earlier and more rapid rate of tumor burden, as measured by ascites accumulation (figure 6E). Strikingly, the CD8+ depletion group had a significantly increased average volume of ascites per mouse (figure 6F). Depleting NK cells in this model did not affect the average ascites volume or survival (figure 6E,F; online supplemental figure 6A,D). Altogether, these data indicate that CD8+ lymphocytes are critical in controlling tumor outgrowth, while also aiding in prolonging survival in mice with combined Adar1 loss and DNMT inhibition.
Using ascites supernatant to analyze levels of chemokines and cytokines in vivo, we observed increased concentrations of CCL5 and CXCL10 in mice with Adar1 knockdown tumors and DNMTi treatment compared with mice with control tumors (shGFP) receiving Mock treatment (figure 7A), which is concordant with our in vitro data (figure 2). Furthermore, IFNAR1 blockade demonstrated that this increase in chemokines is dependent on IFN signaling (online supplemental figure 7A). Interestingly, significantly higher levels of IFN-γ and IFN-α were measured in the ascites supernatant of mice with Adar1 loss, DNMT inhibition, and blocked type I IFN signaling (online supplemental figure 5B,C). IFN-β was detected at very low levels in some groups, and below the limit of detection for other groups (online supplemental figure 5C). We hypothesize that mice are eventually succumbing to disease due to tumor extrinsic immunosuppressive factors or through another tumor intrinsic negative-feedback loop, which could be dampening the initially enhanced IFN response.70 71 When we assessed the ascites supernatant for immunosuppressive cytokines, we observed a significant decrease in TGF-β in the shAdar1 DNMTi group compared with the shGFP Mock group (figure 7B). Interestingly, we observed significant increase in interleukin (IL)-10 in mice with Adar1 knockdown tumors and DNMTi treatment compared with mice with control tumors (shGFP) and mock treatment (figure 7B). IL-10 could be acting to suppress the T cells that have been recruited to the TME.72

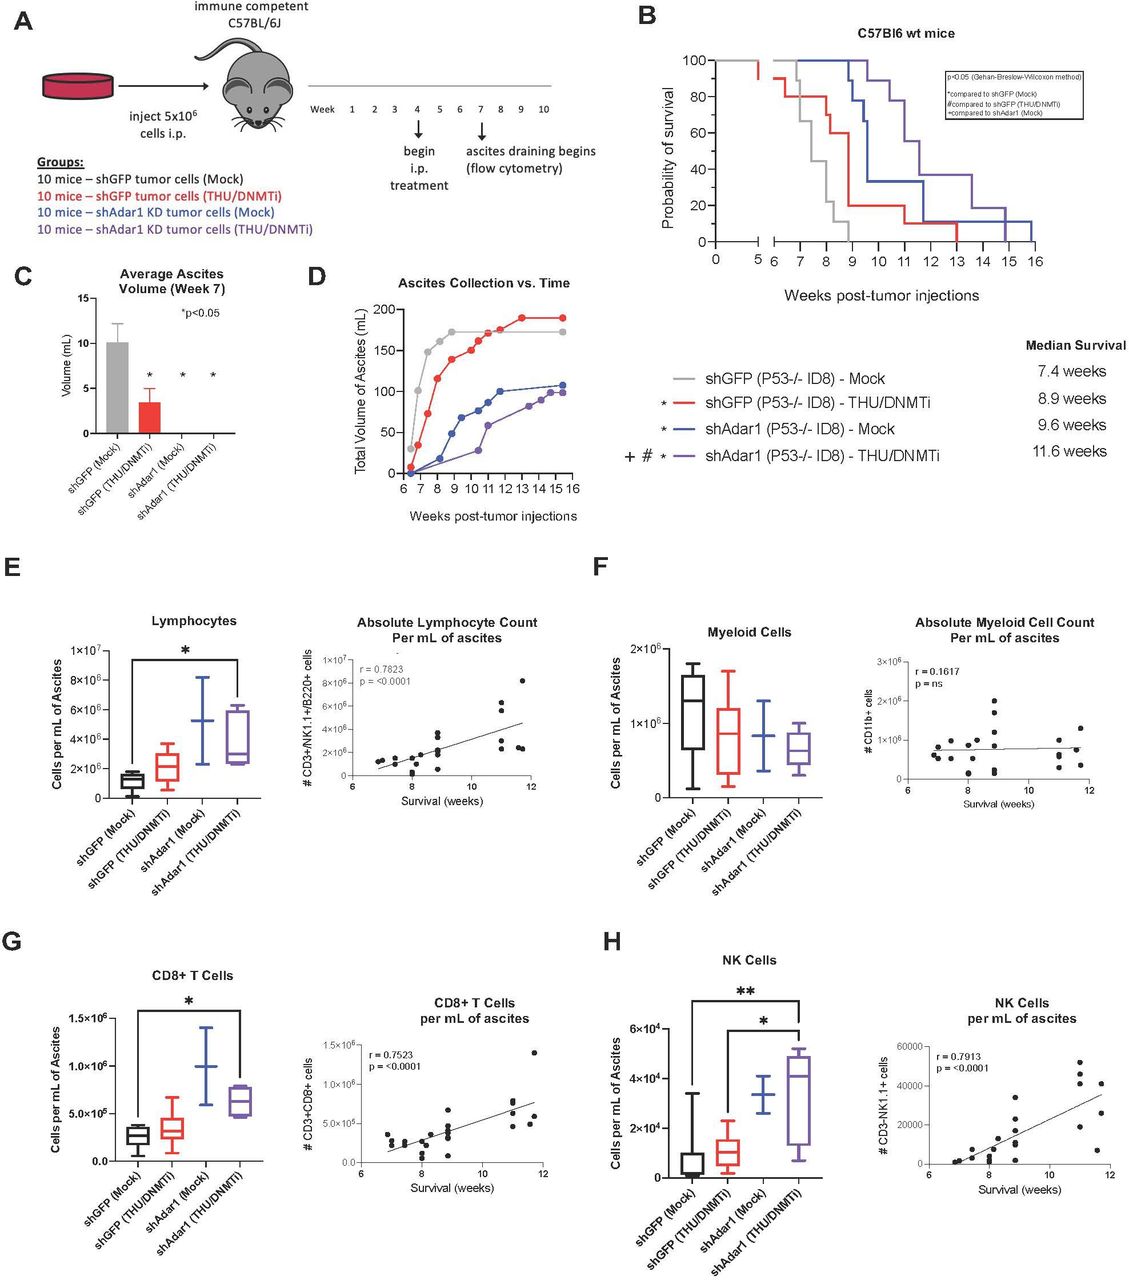
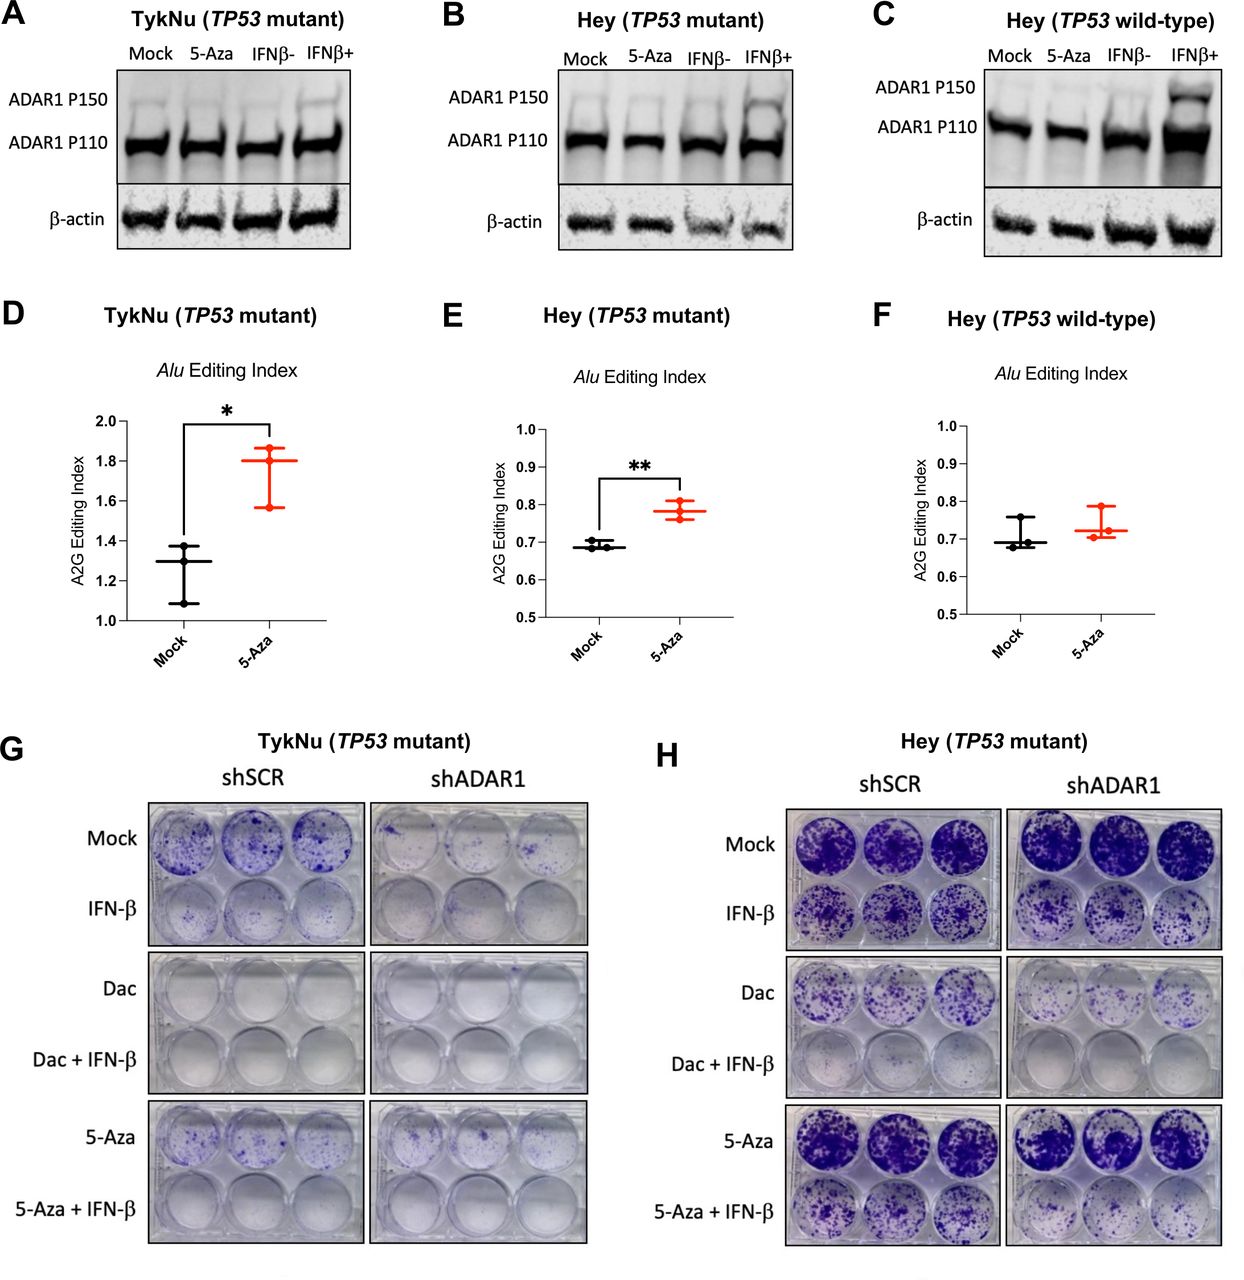
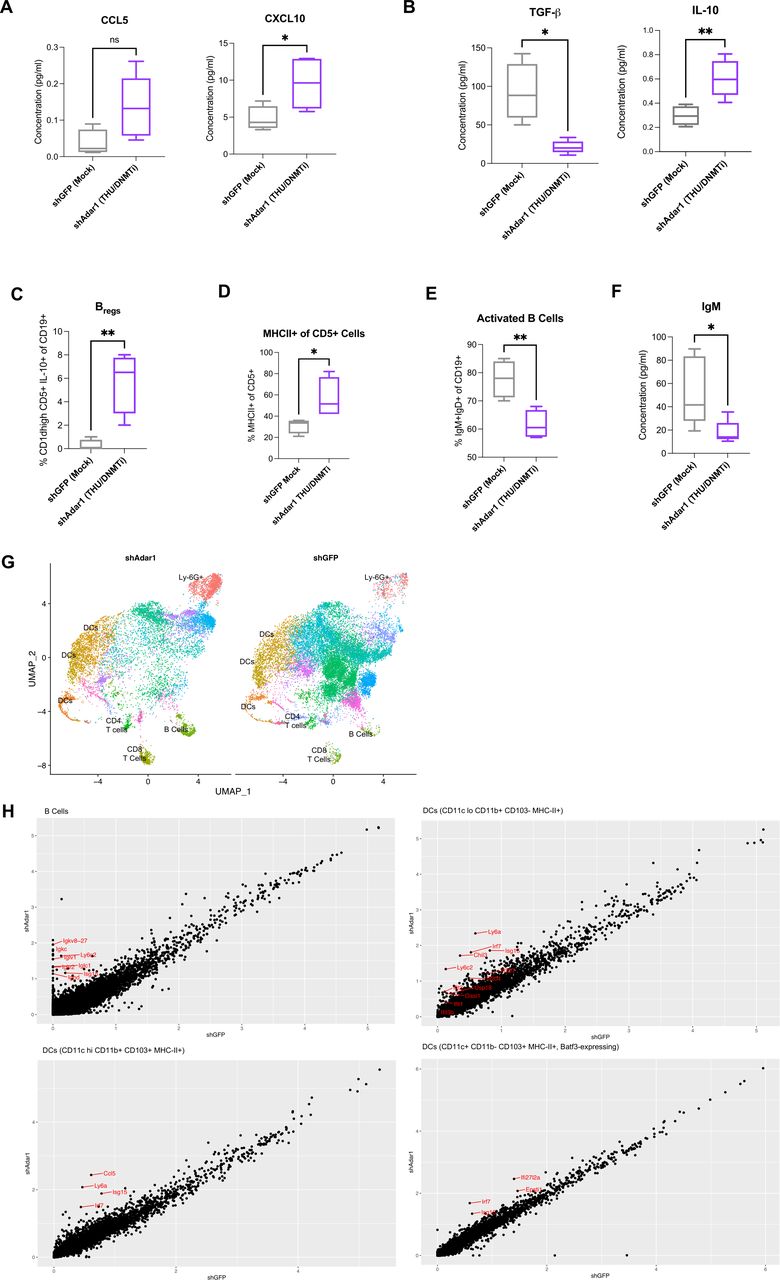
(A–D) Ascites was drained from mice in the experiment from figure 6A–D and analyzed for chemokines and cytokines present in the TME. (A) CCL5 and CXCL10 protein concentration in ascites supernatant. (B) TGF-β and IL-10 protein concentration in ascites supernatant. (C–E) Immunophenotyping of the ascites TME using flow cytometry. (C) Regulatory B cells-Bregs (% CD1d hi CD5+IL-10+of CD19+). (D) % MHC-II+ of CD5+ B cells. (E) Activated B cells (% IgM+IgD+ of CD19+). (F) IgM antibody concentration in ascites supernatant. (G) CITE-seq UMAP of cells in ascites of shGFP Mock-treated mice and shADdr1 THU/DNMTi-treated mice. (H) Differential expression of B cell populations of DC subpopulations in the ascites of shGFP Mock-treated mice and shADdr1 THU/DNMTi-treated mice. *P<0.05; **p<0.01. DC, dendritic cell; DNMTi, DNA methyltransferase inhibitor; IL, interleukin; MHC, major histocompatibility complex; ns, not significant; TGF-β, transforming growth factor beta; TME, tumor microenvironment.
Immunophenotyping reveals a recruitment of B cells to the tumor microenvironment on combined Adar1 knockdown and DNMTi treatment
Clinical evidence indicates that B cells may play an important role in OC,33 34 73 74 and recent studies have begun to investigate mechanisms in which B cells may function in OC.75 Specifically, B cells and tertiary lymphoid structures in the TME may predict a response to immune checkpoint blockade.34 Additionally, B cells can also play immunosuppressive roles in autoimmune diseases76 and cancer.77 These immunosuppressive B cells are called B regulatory cells (Bregs), and they are known to produce IL-10, which is a cytokine that suppresses T cells and the T helper 1 immune response.78 The peritoneal cavity, which is the TME for OC, is also known to be home to a prominent population of tissue resident B cells (B1 and B2 cells) that are known to express high levels of IgM.79 Knowing that B cells can play important roles that could influence either an antitumor or an immunosuppressive TME, we performed flow immunophenotyping on the B cell population. Since B cells have been largely understudied relative to T cells and NK cells in tumor immunology, they have not yet been comprehensively investigated in the ID8 mouse model of OC.
Indeed, we observe a significantly increased frequency of Breg cells in the combination Adar1 and DNMT inhibition group (figure 7C). Although we also observed a significant increase in the frequency of MHC-II+CD5+ B cells in this group (figure 7D), there was additionally a significant reduction in the frequency of activated B cells (figure 7E). We additionally observed a significant decrease in IgM concentration in the ascites fluid (figure 7F). Natural antibodies are secreted by CD5+ B cells. These IgM or IgG natural antibodies can play a role in detecting neoantigens expressed by cancer cells, and they have recently been shown to play a role in tumor control.80–82 In this case, IL-10 may be acting as an immunosuppressant to CD8+ T cells and activated B cells, and Breg cells may be a potential source of the IL-10.
To understand the transcriptional changes induced by Adar1 knockdown and DNMTi treatment at single-cell resolution, we comprehensively investigated the ascites TME using CITE-seq, a method that combines cell surface protein marker expression with RNA expression (figure 7G,H). Confirming our flow cytometry immunophenotyping results, the shAdar1 DNMTi group exhibited increases in the CD8+ T cell population as well as the B cell population (figure 7G). Beyond the lymphocyte response, we observed increase in the Ly-6G+population in the shAdar1 DNMTi group compared with the shGFP Mock group (figure 7G). Based on expression data, these cells are likely neutrophils and other myeloid-derived suppressor cells. Importantly, B cells and dendritic cells significantly upregulated ISGs in the shAdar1 DNMTi group, confirming a robust type I IFN response (figure 7H). Interestingly, we also found upregulation of immunoglobulin genes in the B cells in the shAdar1 DNMTi group, indicating that B cells are maturing to plasma cells. However, when we measured the concentrations of various immunoglobulin isotypes present in the ascites fluid, we did not observe significant increases (online supplemental figure 7J). The reduced concentration of antibodies in the TME could also be playing specific roles in tumor control in OC.83 Overall, Adar1 knockdown plus DNMTi treatment recruited B cells to the TME, but populations of these B cells may have immunosuppressive effects. Importantly, we observe evidence of lymphocyte dysfunction in the TME of the shAdar1/DNMTi mice, despite presence of a type I IFN response in immune cells, and despite significant recruitment of lymphocytes to the TME.
Discussion/Conclusion
In summary, we showed that inhibition of RNA editing in OC activates type I IFN signaling and upregulates the production the downstream chemokines CCL5 and CXCL10. This response is further increased by inhibiting DNA methylation to promote transcription of immunogenic dsRNA. This elevated type I IFN signaling transforms the TME, significantly reduces tumor burden, and significantly prolongs survival in an aggressive, clinically relevant murine model of OC. Furthermore, our results implicate ADAR1 as a novel target for OC. There are several ADAR1 inhibitors currently in development for use against cancer. Although there are no known, selective ADAR1 inhibitors commercially available at the moment,84 future directions include testing these inhibitors as they become available.
Another impactful observation from this work is that murine Trp53-/- cells were as sensitive to IFN-β as murine Trp53+/+ cells when Adar1 was knocked down (online supplemental figure 4F). Additionally, three of the four human OC lines with different TP53 mutational statuses exhibited sensitivity to ADAR1 knockdown when combined with DNMTi treatment (figure 4, online supplemental figure 4F). This is relevant because over 90% of HGSOC exhibit TP53 mutations46 and are very aggressive and highly resistant to available therapeutics. ADAR1 is an interesting emerging target for OC because ADAR1 expression levels are significantly higher in serum and ascites fluid from the peritoneal cavity in patients with malignant OC than in those with benign neoplasms.85 There is also evidence of RNA hyper-editing in OC, melanoma, and breast cancer TCGA (The Cancer Genome Atlas) patient samples.86
We were surprised to observe differences in OC cell response to the DNMTi drugs Dac and Aza (figure 2B, online supplemental figure 2A). This could be due to the differential mechanism of action of these two DNMT inhibitors. Dac and 5-Aza are both nucleoside analogs that integrate into DNA to inhibit DNMT1 irreversibly.87 Dac integrates only into DNA, however, 5-Aza can also integrate into RNA.87 Integration of 5-Aza into RNA could potentially impact RNA editing,88 89 splicing,90 or other global transcriptional regulation such as RNA decay.91
A better understanding of mechanisms of resistance can lead to the development of rational and effective combination immune therapies for cancer cure. Increased Adar1 protein levels may lead to increased RNA editing and potentially higher extracellular adenosine levels. Extracellular adenosine can suppress immune cells.92 Other contributors to increased extracellular adenosine include CD73 expression, which is upregulated in OC.93 94 Thus, blockade of the A2A adenosine receptor may synergize with Adar1 and DNMT inhibition to enhance NK cell maturation and cytotoxic function in the TME.95 Additionally we noticed that some of the ex vivo-cultured tumors had a spindle-like morphology rather than a cobble-stone morphology, suggesting epithelial to mesenchymal transition during the tumor escape phase.96 Further understanding of immune-related EMT-promoting factors could therefore be beneficial to explore as potential targets effective for highly metastatic and highly drug-resistant cells during advanced stage disease. Furthermore, the TME may have an increased abundance of immunosuppressive cells, which may cause decreased frequencies of IFN-γ+ CD8+ T cells (online supplemental figure 1G).
Since we observed significantly increased numbers of CD8+ T cells in the ascites TME (figure 1G) and in the spleen (figure 3B) at the humane end point for the mice, we hypothesized that either: (1) higher anti-CD8a antibody concentration is required for efficient CD8+ T cell depletion due to increased proliferation of CD8+ T cells, and/or (2) CD8+ T cells minimally prolonged survival because they were largely inhibited by the immunosuppressive TME. Interestingly, when we depleted NK cells in mice implanted with Adar1 knockdown tumors and treating with DNMTi, we did see a delayed accumulation of ascites, although the average ascites volume per mouse was not significantly different compared with the isotype control mice, and there was also no significant difference in survival outcome (online supplemental figure 6E,F).
In conclusion, we show that combined Adar1 and DNMT inhibition increases immunogenic dsRNAs to decrease tumor burden and prolong survival in an aggressive mouse model of OC. Combined Adar1 and DNMT inhibition resulted in a striking increase in the lymphoid compartment of the ascites TME. In vitro assays show that DNMTi treatment of tumor cells increases migration of T cells and promotes tumor cell sensitivity to IFN and DNMT inhibitors. Ex vivo co-culture assays show increased CD8+ T specific lysis in mice with Adar1 tumors and DNMTi treatment, and in vivo depletion experiments show that CD8+ T cells control tumor outgrowth. Lastly, prolonged survival in mice with combined Adar1 loss and DNMT inhibition is dependent on type I IFN signaling. Although we do observe an enhanced effect directly on T cells with DNMTi, the tumor intrinsic loss of ADAR1 is likely driving the response. For instance, we do not see large differences in immune profiled of Adar1 mice (blue group in figure 1) and combination group (purple group in figure 1). With ADAR1 loss, we also see robust sensitivity to IFN and DNMTi in vitro (figure 4), which may have a more robust effect on prolonging survival than increases in cytotoxic lymphocytes. These studies show that inhibition of ADAR1 and DNMTs may be a promising novel combination treatment to sensitize OC tumors to immune therapies, which do not respond to current immune therapies. These studies also begin to shed light on novel targets and immunological mechanisms to investigate for the reversal of immune suppression in OC.
Supplemental material
Supplemental material
Data availability statement
Data are available in a public, open access repository. Data are available on reasonable request.
Ethics statements
Patient consent for publication
Ethics approval
All mouse experiments were performed in accordance with our laboratory protocol approved by the Institutional Case and Use Committee (IACUC) at the George Washington University (#A406 and #2021-019).
Acknowledgments
The authors would like to acknowledge the Institute for Biomedical Sciences at the George Washington University for graduate student support and training. The authors would like to thank Dr Iain McNeish (Imperial College London) for the 123 isogenic Trp53+/+ and Trp53−/− murine ovarian cancer cell lines. The authors would like to thank Dr Ronny Drapkin (University of Pennsylvania) for the HGS2 murine high-grade serous ovarian cancer (HGSOC) cell line. The authors would like to thank the George Washington Flow Cytometry Core Facility, specifically Ms Kimberlyn Acklin and Dr Gregory Cresswell, for flow cytometry support and training. The core is supported by the George Washington University Cancer Center and School of Medicine and Health Sciences. The authors would like to thank the George Washington University Genomics Core, specifically Dr Castle Raley and Ms Kimberly Ward, for providing single cell library construction services. The authors would like to thank the Genome Technology Access Center at the McDonnell Genome Institute at Washington University School of Medicine for help with genomic analysis. The Center is partially supported by NCI Cancer Center Support Grant #P30 CA91842 to the Siteman Cancer Center from the National Center for Research Resources (NCRR), a component of the National Institutes of Health (NIH), and NIH Roadmap for Medical Research.
References
Supplementary materials
Supplementary Data
This web only file has been produced by the BMJ Publishing Group from an electronic file supplied by the author(s) and has not been edited for content.
Footnotes
Twitter @ScientistStephG
Contributors Conceptualization: KBC, SG. Data curation: SG, JIM, UR, OLC. Formal analysis: SG, UR, OLC, RRW. Funding acquisition: KBC, SG, CMB. Investigation: SG, OLC, KBC, JIM, EA, ND, UR, EP, MH, TK, JK, EEG. Methodology: SG, KBC, YS. Project administration: SG, KBC. Resources: KBC, SN, AV, YS, EA, ND. Software: SG, UR, RRW. Supervision: KBC, SG, CMB, DL. Validation: SG, OLC, UR, RRW. Visualization: SG, OLC, RRW. Writing—original draft: SG, OLC, KBC, UR, RRW. Writing—review and editing: SG, KBC, DL, AV, CMB, EEG, JIM. Guarantor: KBC.
Funding Research was supported by the National Cancer Institute R00CA204592 and R37CA251270 (to KBC), the DOD Ovarian Cancer Research Program (W81XWH2010273 to KBC), and by the Marlene and Michael Berman Endowed Fund for Ovarian Cancer Research. JIM and RRW were supported by an NCI NRSA Institutional Research Training Program grant (T32 CA 247756). SG was supported by a NRSA Predoctoral Fellowship (NIH/NCI 1F31CA254315). EEG was supported by a NRSA Predoctoral Fellowship (NIH/NCI 1F31CA271788).
Disclaimer This publication is solely the responsibility of the authors and does not necessarily represent the official view of NCRR or NIH.
Competing interests None declared.
Provenance and peer review Not commissioned; externally peer reviewed.
Supplemental material This content has been supplied by the author(s). It has not been vetted by BMJ Publishing Group Limited (BMJ) and may not have been peer-reviewed. Any opinions or recommendations discussed are solely those of the author(s) and are not endorsed by BMJ. BMJ disclaims all liability and responsibility arising from any reliance placed on the content. Where the content includes any translated material, BMJ does not warrant the accuracy and reliability of the translations (including but not limited to local regulations, clinical guidelines, terminology, drug names and drug dosages), and is not responsible for any error and/or omissions arising from translation and adaptation or otherwise.