Article Text

Abstract
Background Adjuvant therapy for high-risk resected melanoma with programmed cell-death 1 blockade results in a median relapse-free survival (RFS) of 5 years. The addition of low dose ipilimumab (IPI) to a regimen of adjuvant nivolumab (NIVO) in CheckMate-915 did not result in increased RFS. A pilot phase II adjuvant study of either standard dose or low dose IPI with NIVO was conducted at two centers to evaluate RFS with correlative biomarker studies.
Methods Patients with resected stages IIIB/IIIC/IV melanoma received either IPI 3 mg/kg and NIVO 1 mg/kg (cohort 4) or IPI 1 mg/kg and NIVO 3 mg/kg (cohorts 5 and 6) induction therapy every 3 weeks for 12 weeks, followed by maintenance NIVO. In an amalgamated subset of patients across cohorts, peripheral T cells at baseline and on-treatment were assessed by flow cytometry and RNA sequencing for exploratory biomarkers.
Results High rates of grade 3–4 adverse events precluded completion of induction therapy in 50%, 35% and 7% of the patients in cohorts 4, 5 and 6, respectively. At a median of 63.9 months of follow-up, 16/56 patients (29%) relapsed. For all patients, at 5 years, RFS was 71% (95% CI: 60 to 84), and overall survival was 94% (95% CI: 88 to 100). Expansion of CD3+CD4+CD38+CD127−GARP− T cells, an on-treatment increase in CD39 expression in CD8+ T cells, and T-cell expression of phosphorylated signal-transducer-and-activator-of-transcription (STAT)2 and STAT5 were associated with relapse.
Conclusions Adjuvant IPI/NIVO at the induction doses used resulted in promising relapse-free and overall survival, although with a high rate of grade 3–4 adverse events. Biomarker analyses highlight an association of ectoenzyme-expressing T cells and STAT signaling pathways with relapse, warranting future validation.
Trial registration number NCT01176474 and NCT02970981.
- Immunotherapy
- Biomarkers, Tumor
- CTLA-4 Antigen
- Clinical Trials, Phase II as Topic
- Programmed Cell Death 1 Receptor
Data availability statement
Data are available upon reasonable request. NA.
This is an open access article distributed in accordance with the Creative Commons Attribution Non Commercial (CC BY-NC 4.0) license, which permits others to distribute, remix, adapt, build upon this work non-commercially, and license their derivative works on different terms, provided the original work is properly cited, appropriate credit is given, any changes made indicated, and the use is non-commercial. See http://creativecommons.org/licenses/by-nc/4.0/.
Statistics from Altmetric.com
- Immunotherapy
- Biomarkers, Tumor
- CTLA-4 Antigen
- Clinical Trials, Phase II as Topic
- Programmed Cell Death 1 Receptor
WHAT IS ALREADY KNOWN ON THIS TOPIC
Adjuvant anti-programmed cell-death 1 (PD-1) monotherapy improves relapse-free survival (RFS) in high-risk resected stage III cutaneous melanoma and is considered a standard clinical practice.
Combination ipilimumab (dosed at 1 mg/kg every 6 weeks) plus nivolumab (dosed at 240 mg every 2 weeks) failed to improve RFS compared with nivolumab monotherapy in resected stage IIIB–D and IV melanoma.
WHAT THIS STUDY ADDS
Nivolumab combined with ipilimumab administered in a more conventional dose (3 mg/kg or 1 mg/kg) and schedule (every 3 weeks for four doses) as adjuvant therapy for high-risk resected stage IIIB–C and stage IV melanoma demonstrates high rates of 5 - year RFS (71%) and overall survival (94%). The toxicity of these regimens, while considerable, was as expected keeping in line with published data from the treatment of advanced melanoma.
In a limited biomarker data set, there was association of relapse with ectoenzyme-expressing T- cells and signal-transducer-and-activator-of-transcription signaling pathways.
The results from this study combined with those from the IMMUNED adjuvant trial in resected stage IV melanoma suggest that the dose intensity of ipilimumab may be important in adjuvant treatment.
HOW THIS STUDY MIGHT AFFECT RESEARCH, PRACTICE, OR POLICY
How this study might affect research, practice, or policy· The role of ipilimumab plus nivolumab at conventional dosing deserves further exploration in the adjuvant treatment of melanoma.
Validation of blood-based biomarkers should be incorporated into adjuvant trials to help discern which patients may benefit from adjuvant therapy versus those who may not need to be treated. This becomes particularly important as anti-PD-1 therapy gains wider use in adjuvant therapy for earlier stage (stage IIB–C) resected melanoma.
Background
The immune checkpoint inhibitor ipilimumab (IPI), a cytotoxic T-lymphocyte antigen 4 (CTLA-4) antagonist antibody, was Food and Drug Administration (FDA)-approved as adjuvant therapy in 2015 based on an advantage in relapse-free survival (RFS) compared with placebo in resected stage III melanoma. Nivolumab (NIVO) and pembrolizumab, both programmed cell-death 1 (PD-1) blocking antibodies, received regulatory approval thereafter for resected stage III melanoma based on improved RFS in randomized trials compared with the active comparator of IPI or placebo.1–3 NIVO is the only agent approved for resected stage IV melanoma based on the results of CheckMate-238 that included patients with stages IIIB–C and IV (American Joint Commission on Cancer (AJCC) seventh edition) melanoma. In that trial, adjuvant NIVO improved RFS compared with IPI (HR) for disease recurrence or death: 0.65 (95% CI: 0.56 to 0.82).3 At a recent update, the 5-year RFS continued to favor NIVO (HR, 0.72, 95% CI: 0.60 to 0.86), although there was no improvement in overall survival (OS), possibly related to an inherent crossover and fewer than anticipated events at data analysis.4 Alternatively, patients with resected stage III melanoma harboring a BRAF V600E/K mutation can receive adjuvant treatment with the BRAF inhibitor dabrafenib combined with the MEK inhibitor trametinib administered for 1 year. In the COMBI-AD trial of dabrafenib and trametinib compared with placebo for resected stage III melanoma, both 5-year relapse-free (HR 0.51) and distant metastasis-free survival (HR 0.55) were improved.5
NIVO (1 mg/kg) plus IPI (3 mg/kg) every 3 weeks for four doses followed by maintenance NIVO is an effective regimen for advanced melanoma, with progression-free survival and OS of 34% and 49%, respectively, at 78 months of follow-up in CheckMate-067.6 The treatment-related toxicity using this combination is considerable, with 59% grade 3–4 events and 31% rate of treatment discontinuation. In the phase 2 IMMUNED trial of stage IV cutaneous or unknown primary melanoma rendered disease-free after surgery or radiotherapy, adjuvant NIVO plus IPI at the same doses used in CheckMate-067, or NIVO alone significantly improved RFS compared with placebo.7 In that trial, the combination regimen reduced the risk of recurrence or death by 77% compared with placebo. The toxicity of that combination necessitated discontinuation in 34 of 55 (62%) patients. CheckMate-915 (CM-915) was a randomized trial of adjuvant IPI combined with NIVO compared with NIVO alone for resected stages IIIB–D and stage IV melanoma. NIVO (480 mg every 4 weeks) was compared with IPI (1 mg/kg every 6 weeks) plus NIVO (240 mg every 2 weeks), each administered for 1 year. Combination IPI/NIVO did not improve RFS (64.6% at 2 years in the combination arm versus 63.2% in the NIVO arm) in the overall study population nor in patients whose tumors had low programmed death ligand-1 (PD-L1) expression.8
We previously reported the safety, efficacy, and correlative studies of a multi-peptide vaccine with escalating doses of adjuvant NIVO for high-risk resected stage IIIC and stage IV melanoma (cohorts 1–3).9 For those cohorts, we described increases of phosphorylated signal-transducer-and-activator-of-transcription 3 (pSTAT3) S727 expression in T cells and expansion of regulatory T cells (Tregs) with reduced suppressive function as biomarkers of RFS.10 Herein, we report our experience with three additional cohorts examining different dosing regimens of adjuvant combination IPI and NIVO for a similar population of patients with resected high-risk melanoma. We also examined expression of a panel of pSTAT proteins and suppressive T-cell phenotypes as potential biomarkers of outcome.
Methods
This open label study was initiated as a single center, pilot phase II trial at the Moffitt Cancer Center (MCC), Tampa, Florida, USA, as MCC15651/NCI P-8316 under BB IND 120711. After enrollment to cohorts 4 and 5 described below (total=40 patients), an additional cohort (cohort 6) of 16 patients was enrolled at the Laura and Isaac Perlmutter Cancer Center, New York University (NYU) Langone Health, New York, New York, USA, as S16-00098. Eligible patients were 16 years or older, with completely resected AJCC seventh edition stage IIIB/C or stage IV melanoma without any clinical or radiologic evidence of disease. There was no restriction with regard to the primary site of melanoma. Patients were required to have an Eastern Cooperative Oncology Group performance status of 0 or 1. Required baseline laboratory parameters included adequate hemogram, renal and hepatic values. Prior treated brain or meningeal metastases were permitted provided at least 8 weeks had elapsed without MRI evidence of progression and at least 2 weeks without immunosuppressive doses of systemic steroids (>10 mg daily of prednisone or equivalent). Key exclusion criteria included active or prior autoimmune disease (except vitiligo, diabetes or resolved childhood asthma/atopy), any concurrent medical condition requiring immunosuppressive therapy including immunosuppressive doses of systemic steroids, known positive test for HIV, active or chronic hepatitis B or C infection, or prior therapy with antibodies targeting the PD-1/PD-L1, CTLA-4, or other T-cell co-stimulatory pathways. Patients with prior non-melanoma malignancy, other than resected melanoma in situ, basal or squamous skin cancer and carcinoma in situ of the cervix, active within the preceding 2 years were also excluded.
This study was conducted in accordance with the Declaration of Helsinki and complied with Good Clinical Practice Guidelines. All participants provided written, informed consent for this study. This trial was registered at ClinicalTrials.gov.
Treatment and procedures
In cohort 4, patients received induction NIVO at 1 mg/kg (over 60 min) plus IPI at 3 mg/kg (over 90 min) administered intravenously every 3 weeks for up to four doses followed by NIVO at 3 mg/kg every 2 weeks for up to an additional 104 weeks. In cohort 5, patients received induction NIVO at 3 mg/kg (over 30 min) plus IPI at 1 mg/kg (over 30 min) administered intravenously every 21 days for up to four doses. The maintenance phase of NIVO was the same as cohort 4. Patients enrolled at NYU Perlmutter Cancer Center in cohort 6 were treated with induction dosing identical to cohort 5 but received maintenance NIVO at a fixed dose of 480 mg intravenously over 60 min every 4 weeks for up to 48 additional weeks. The treatment schedule for each cohort is summarized in table 1.
Schema for treatment plan
Baseline imaging included cross-sectional contrast-enhanced CT of the chest, abdomen, and pelvis, and MRI (or CT) of the brain; imaging of the neck was included if clinically indicated. Imaging was repeated every 12 weeks during the treatment phase of the study, every 3 months for 2 years, then every 6 months thereafter until 5 years after treatment finished, or earlier if clinically indicated. Toxicity was assessed according to the Common Terminology Criteria for Adverse Events (V.4.0). Standard criteria for delay or discontinuation of therapy for immune-related toxicity were followed. For patients who developed dose limiting toxicity during the induction phase necessitating a treatment hold and intervention with steroids or other immunosuppressive management, resumption of treatment with NIVO monotherapy was permitted following recovery to grade 1 or better and reduction of the steroid dose to less than 10 mg daily of prednisone or equivalent.
Correlative studies
Blood samples were collected prior to the start of treatment and at week 10 (cohort 6) or week 13 (cohorts 4 and 5) in sodium heparinized tubes. Peripheral blood mononuclear cells (PBMC) were collected by density gradient centrifugation using Ficoll-Paque. Specimens were stored in liquid nitrogen.
Due to limited availability of samples, not all patients were evaluated in immune correlate assays. The patient samples that were assessed are shown in online supplemental table 1. All samples were thawed and assayed simultaneously to avoid batch effects. Samples were randomized and researchers blinded to sample details during assay and initial analysis of flow data. For evaluation of Treg and Teee markers, cells were surface stained per a standard flow cytometry protocol. Data was acquired on an Attune NxT flow cytometer (Thermo Fisher, Waltham, Massachusetts, USA). For pSTAT evaluation, cells were fixed and stained per Monk et al.11 Antibodies used are reported in online supplemental table 2. Data were acquired on a BD FACSymphony flow cytometer (BD Biosciences, Franklin Lakes, New Jersey, USA). All cells were stained with LIVE/DEAD amine-reactive dyes and non-viable cells excluded during analysis. FlowJo V.10 software (Becton, Dickinson and, Ashland, Oregon, USA) was used to analyze data.
Supplemental material
Supplemental material
RNA sequencing
CD8+ T cells were isolated from patient PBMC samples by a STEMCELL EasySep negative isolation kit (STEMCELL Technologies, Cambridge, Massachusetts, USA). Azenta Life Sciences (South Plainfield, New Jersey, USA) performed sequencing of all libraries. The SMARTer Stranded Total RNA-Seq Kit V.2 Pico Input Mammalian (TaKaRa Bio USA, Mountain View, California, USA) was used to prepare ribosomal RNA-depleted RNA sequencing (RNA-Seq) libraries. Each library was then quantified by quantitative PCR and pooled for sequencing using 150-base paired-end sequencing to a depth of ~30 million reads per sample. Pre-alignment data quality was assessed using FASTQC (V.0.11.9). Paired end sequencing adapters were removed using Trimmomatic (V.0.39). Alignment and mapping were performed using HISAT2 and Ensembl (V.104), with GRCh38 as the reference genome. HTseq generated a gene count matrix; differential gene expression and analysis was performed using DESeq2.
Statistical analysis
The primary endpoint of this trial was RFS. RFS was calculated from date of enrollment to the date of first relapse or death from any cause, whichever came first. Patients who were disease-free and alive at the time of data analysis were censored. Secondary endpoints included OS, and toxicity. Kaplan-Meier (KM) curves were used to summarize RFS and OS by cohort and overall. Log-rank tests were used to provide a comparison of RFS and OS among the three cohorts. Median follow-up time was calculated using the reverse KM method. Toxicity was summarized by grade and cohort.
For immune correlated assay comparisons of two groups (ie, no evidence of disease (NED) (those with no relapse) vs relapse), results are displayed graphically. Unpaired t-tests were used for each correlate. In cases where the variance between NED and relapse patients was significantly different (p<0.05), a Welch’s t-test was used in lieu of an unpaired t-test. The corresponding figure legends indicate where this is the case. For comparisons of more than two groups a one-way analysis of variance was used. For those comparisons where the F-test was significant, post hoc comparisons were made using Tukey’s honest significant difference to adjust for multiple comparisons. For all tests, the set threshold for significance was a two-sided α=5%. GraphPad Prism V.9 (San Diego, California, USA) and the R programming language were used for statistical analysis and graphing.
Results
Demographics
From December 2013 until April 2015, 20 patients each with high-risk resected melanoma in cohorts 4 and 5 were enrolled at the MCC. Sixteen additional patients were enrolled in cohort 6 at NYU from February 2017 until September 2018 (figure 1(A)). Median follow-up was 63.9 months (range, 56–75 months). Demographic characteristics for enrolled patients are summarized by study cohort in table 2. Half of the patients enrolled in cohorts 4 and 5 had resected stage IV disease: of these, four patients had M1a disease, while eight patients presented with M1b or M1c disease prior to enrollment. In cohort 6, 75% had resected high-risk stage IIIB/C disease. Sites of resected or treated metastases for stage IV patients included lung, peritoneum, small bowel, bone and brain.
Demographic characteristics by cohort
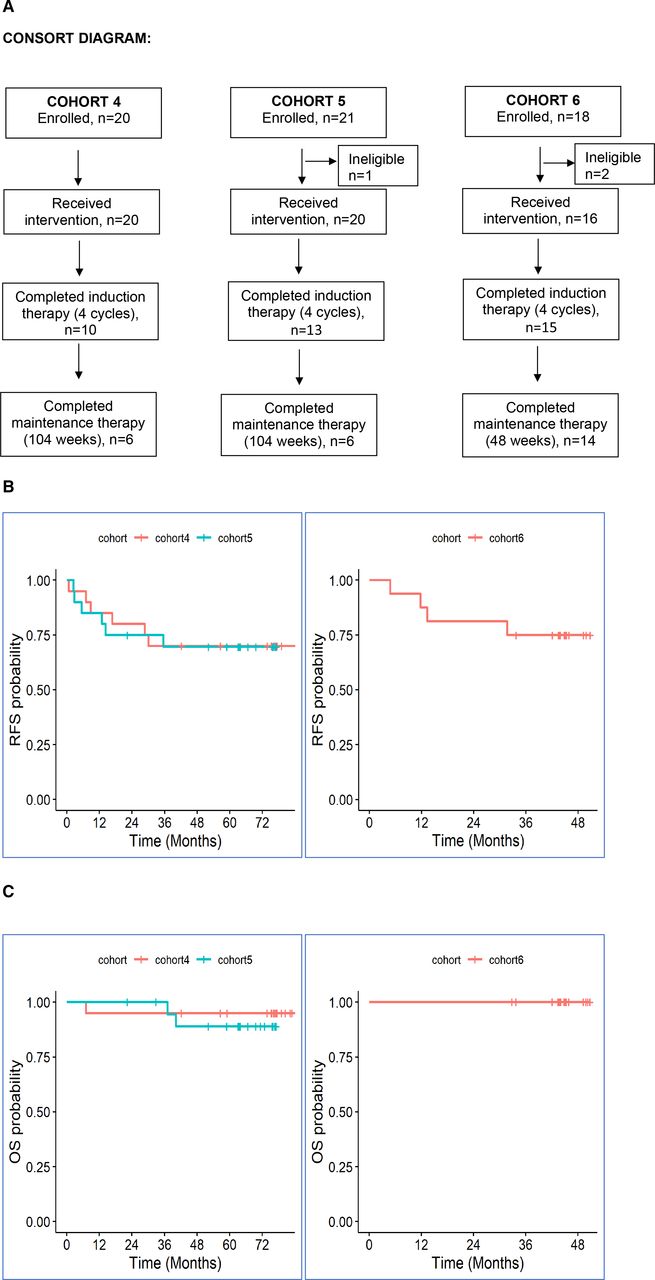
(A) Consolidated Standards of Reporting Trials diagram. (B) Kaplan-Meier estimates of relapse-free survival; left panel (cohorts 4 (red) and 5 (blue)), right panel (cohort 6, red). (C) Kaplan-Meier estimates of overall survival; left panel (cohorts 4 (red) and 5 (blue)), right panel (cohort 6, red). OS, overall survival; RFS, relapse-free survival.
In cohort 4, only 10/20 (50%) patients were able to complete the planned induction with four doses of NIVO plus IPI secondary to toxicity, while 6/20 (30%) completed all maintenance adjuvant therapy. In cohort 5, 13/20 (65%) and 6/20 (30%) patients completed induction and maintenance adjuvant therapy, respectively. In cohort 6, these numbers were 15/16 (93%), and 14/16 (87%), respectively. All patients have completed planned protocol therapy or discontinued it secondary to adverse effects or relapse and are in follow-up.
Safety
Toxicity related to therapy was assessed separately for the induction phase of combination immunotherapy and maintenance phase of NIVO alone. There were no treatment-related deaths in this study. Any grade adverse events were reported in all enrolled patients (100%). A summary of the grade 3–4 treatment-related toxicities is provided in table 3. Eighteen patients (90%) in cohort 4, 14 patients (70%) in cohort 5, and 5 patients (31%) in cohort 6 developed treatment-related grade 3 and 4 adverse events during induction or maintenance therapy. The most common toxicities (all grades; greater than 30% incidence) observed during induction treatment in cohorts 4, 5 and 6 are summarized in table 3(A). Similar toxicities were observed during the maintenance phase of treatment across all cohorts with fatigue, rash, pruritus, diarrhea, nausea, arthralgia/myalgia, and elevated serum lipase and/or amylase being the most commonly reported as related to study treatment.
(A) Numbers of patients with grade 3–4 treatment-related toxicity during induction phase (cycles 1–4). (B) Numbers of patients with most common grade 3–4 treatment-related toxicity during maintenance phase (cycle 5 and beyond)
Efficacy
In cohorts 4 and 5, 6/20 or 30% in each cohort had relapse of disease. In cohort 6, 4/16 (25%) patients relapsed. The median RFS and median OS for all three cohorts were not reached at the time of analysis. One patient in cohort 4, and two patients in cohort 5 died from disease after relapse with progressive melanoma. The 5-year RFS and OS were 71% (95% CI: 60 to 84) and 94% (95% CI: 88 to 100), respectively. The individual KM survival curves for RFS and OS are shown in figure 1B and C.
Immune correlates
Increased pSTAT2-expressing and pSTAT5-expressing T cells were associated with relapse
Previously, we showed that increases in T cells expressing pSTAT3(S727) correlated with non-relapse in patients receiving adjuvant NIVO with a peptide vaccine.10 In this study, we used an expanded flow cytometry panel that was optimized to investigate seven additional pSTAT residues as additional exploratory biomarkers.11 Paired baseline and on-treatment (week 10 or 13) patient PBMC samples were evaluated by intracellular flow cytometry for expression of pSTATs.
In contrast to what we previously demonstrated with NIVO monotherapy, peripheral blood CD4+ T cells from relapsing patients had significantly increased expression of pSTAT3(S727) while on-treatment relative to patients with NED (p=0.0488, online supplemental figure1A). A similar trend was seen for CD8+ T cells (p=0.0514, online supplemental figure1B).
Supplemental material
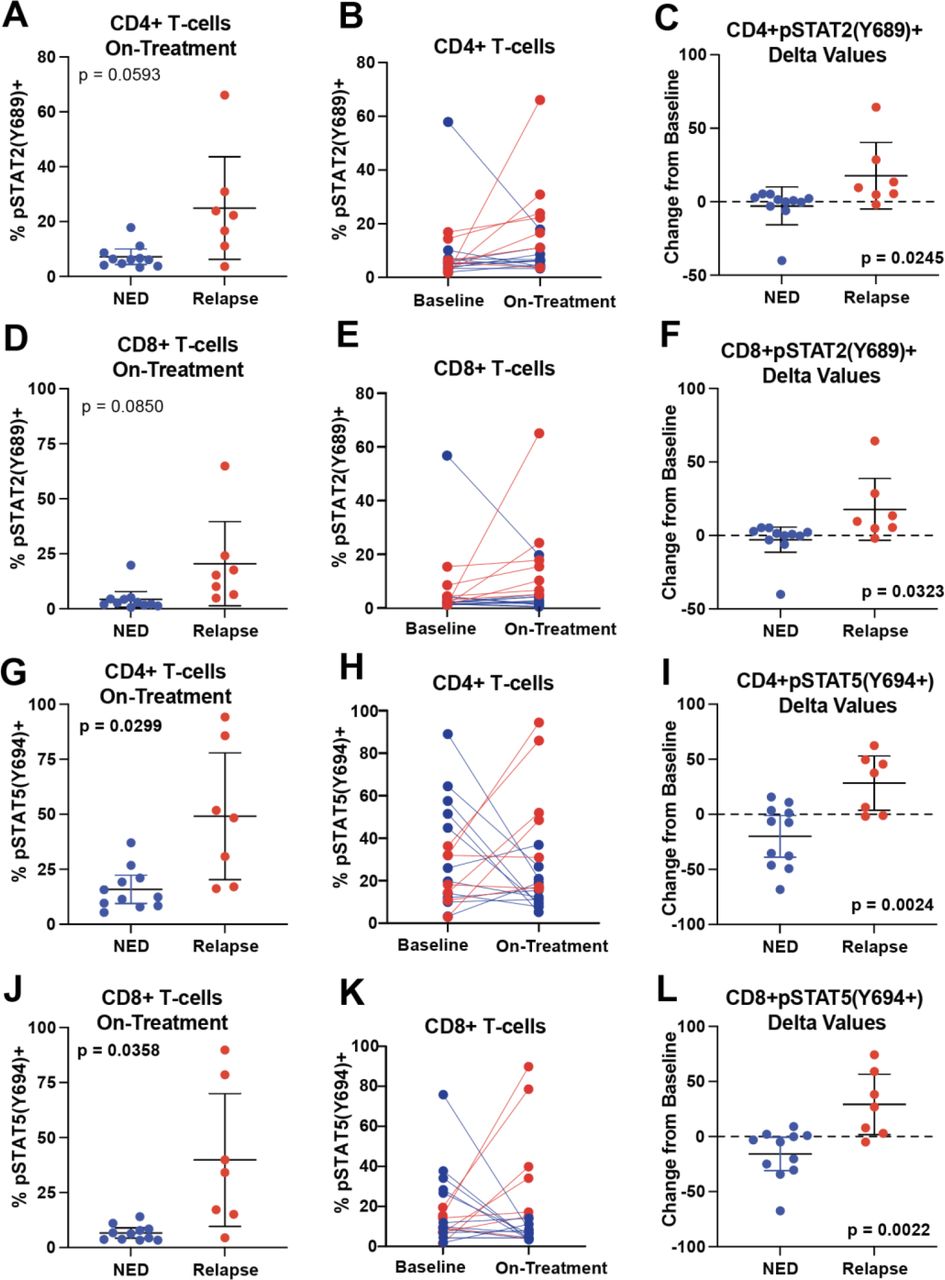
We also observed that on-treatment frequencies of pSTAT2(Y689)-expressing peripheral blood CD4+ and CD8+ T cells trended to be increased in relapsed patients relative to NED patients (p=0.0593 and p=0.0850; figure 2A and D) and pSTAT5a(Y694) was significantly increased (p=0.0299 and p=0.0358; figure 2G and J). Both pSTAT2(Y689) and pSTAT5a(Y694) increased on-treatment in relapsing patients and decreased in NED patients (figure 2B, E, H and K). Absolute changes from baseline to on-treatment were calculated for NED and relapsed patients for CD4+ and CD8+ T cells expressing pSTAT2(Y689) and pSTAT5(Y694). Significant differences in the delta values (paired on-treatment frequencies minus baseline) were seen for all four comparisons (p=0.0245, p=0.0323, p=0.0024, and p=0.0022; figure 2C, F, I and L). No baseline differences in expression of these pSTATs were observed (data not shown).

Increased frequencies of pSTAT2(Y689) and pSTAT5(Y694) expressing T cells are associated with relapse. Baseline and on-treatment patient peripheral blood mononuclear cells samples were assessed by flow cytometry for expression of pSTATs in CD3+CD4+ and CD3+CD8+ T cells. (A) The on-treatment frequency of pSTAT2 expressing CD4+ T cells in NED and relapsed patients are plotted. The corresponding p value was determined by Welch’s t-test. (B) The paired (pretreatment and on-treatment) expression frequency of pSTAT2+CD4+ T cells is shown. NED patients are colored blue and relapsing patients are colored red. Lines connect paired samples. (C) The delta values (post-treatment minus pretreatment frequency) for each patient sample are plotted. The corresponding p values were determined by an unpaired t-test. (D) The on-treatment frequency of pSTAT2 expressing CD8+ T cells is likewise shown. (E) Paired plots and (F) delta values for CD8+ T cells are also shown. (G–L) Similar plots are shown for T-cell expression of pSTAT5. Error bars shown are mean±95% CI. Sample sizes were NED n=11 and relapse=7. NED, no evidence of disease; pSTAT, phosphorylated signal-transducer-and-activator-of-transcription.
Association of circulating Treg frequencies with relapse
In prior published data for patients that received NIVO with a peptide vaccine, we observed an association of increased frequency of circulating Treg with NED status. Therefore, we evaluated the frequency of Treg by flow cytometry in patients from current cohorts 4 to 6. Online supplemental figure 2A shows that no associations were observed between Treg frequencies and relapse/NED at baseline. Likewise, no significant changes were seen in on-treatment frequencies (online supplemental figure 2B), in paired analyses (online supplemental figure 2C) or in delta values for Treg (online supplemental figure 2D).
Supplemental material
Increased ectoenzyme-expressing T cells was associated with relapse
We recently demonstrated that increased frequencies of a novel T-cell population was associated with resistance to NIVO in active disease, patients with metastatic melanoma.12 This population is referred to as Teee (T cells expressing ectoenzymes). We evaluated frequencies of Teee by flow cytometry in baseline and on-treatment PBMC samples from cohorts 4, 5, and 6. While no differences in frequency were observed at baseline (figure 3A), elevated frequencies (as a percentage of the parent CD3+CD4+ population) were found in relapsed patients compared with NED patients in on-treatment samples (p=0.0213) (figure 3B). Paired analysis showed an increase during treatment in relapsed patients but not NED patients (figure 3C), resulting in absolute changes in frequencies being significantly higher in relapsed versus NED patients (p=0.0198) (figure 3D).

Increases in frequency of a CD3+CD4+CD38+CD39+CD127−GARP− population is associated with relapse. Baseline and on-treatment patient peripheral blood mononuclear cells samples were assessed by flow cytometry for expression of regulatory markers on T cells. Viable CD3+CD4+ cells were gated. Samples were then assessed for CD38+CD39+CD127–GARP– (Teee cells) as a percentage of the parent CD3+CD4+ population. (A) Pretreatment frequencies are shown for NED and relapsed patients. The corresponding p value was determined by an unpaired t-test. (B) On-treatment frequencies of Teee cells are plotted. The corresponding p values were determined by Welch’s t-test. (C) The paired (pretreatment and on-treatment) expression frequency of this population is also shown. (D) The change from baseline (post-treatment minus pretreatment expression frequency) for each patient sample is plotted. The corresponding p values were determined by Welch’s t-test. Error bars shown are mean±95% CI. Samples sizes were as follows: baseline: NED n=11, relapse n=9; on-treatment NED n=11, relapse n=7; paired and delta values: NED n=11, relapse n=7. (I) A representative plot of CD38 (x-axis) and CD39 (y-axis) expression in CD3+CD4+ T cells is shown. (F) Cells expressing either CD127 or GARP are colored in blue and cells with expression of neither are shown in red. (G) The expression of CD25 (x-axis) and FOXP3 (y-axis) is shown with the total CD3+CD4+ shown in dark gray and the Teee cell population shown in red. (H) The expression of CD38 (x-axis) and CD39 (y-axis) is shown with the total CD3+CD4+ shown in dark gray and the Tregs (CD127−CD25+FOXP3+) cell population shown in red. (I) The expression of pSTAT2(Y689) was evaluated in CD38±CD39±populations within the parent CD3+CD4+CD127–GARP– population in nine samples. The percentage of cells expressing pSTAT2 in each population are plotted. Dots are colored by sample. (J) pSTAT5(Y694) was likewise evaluated. NED, no evidence of disease; pSTAT, phosphorylated signal-transducer-and-activator-of-transcription; Tregs, regulatory T cells.
A representative bivariate flow cytometry plot of CD38 and CD39 to visualize the Teee population is shown in figure 3E and the same plot colored by expression of either CD127 or GARP (blue dots) or lacking expression of both markers (red dots) is shown in figure 3F. To determine if these cells were related to a Treg phenotype, we overlaid the Teee population on a bivariate plot of CD25 and FOXP3 (figure 3G). The Teee population, represented by red dots, was found to be spread throughout the CD25±FOXP3±quadrants, suggesting that this phenotype was independent of Tregs. Likewise, we overlayed the Treg phenotype (C3+CD4+CD127 CD25+FOXP3+) on a bivariate plot of CD38 and CD39 (figure 3H). Tregs, shown in red dots, were primarily represented in the CD38−CD39+quadrant, further supporting that these two phenotypes were independent.
We also evaluated the relationship of individual markers from this phenotype (ie, CD38, CD39, CD127 and GARP) with patient outcomes (online supplemental figure 3). No significant differences in baseline frequencies between NED and relapsed patients were seen for any of these single markers in CD4+ or CD8+ T cells, except for CD39 expression in CD8+ T cells, which were elevated in NED patients relative to relapsed (p=0.0013, online supplemental figure 3F). On-treatment, significant differences were observed in frequencies for CD8+CD38+ (p=0.0095; online supplemental figure 3D), CD4+CD39+ (p=0.0297; online supplemental figure 3E), CD4+GARP+ (p=0.0203; online supplemental figure 3G), CD8+GARP+ (p=0.0177; online supplemental figure 3G); all of which were increased in relapsed patients. CD8+CD39+ also trended towards higher on-treatment frequencies in relapsed patients (p=0.0607; online supplemental figure 3F). Paired analysis and delta values showed similar increases/elevations in relapsed patients. No significant differences were seen for CD4+CD127+, CD8+CD127+ or CD4+CD38+ populations (online supplemental figure 3A,B,C).
Supplemental material
Ectoenzyme-expressing T cells had increased expression of pSTAT2 and pSTAT5
pSTAT5 expression in T cells regulates polarization, directing T cells towards Treg phenotypes.13 Given our observation that increased T-cell pSTAT5 expression was associated with patient relapse, we evaluated correlations between expression of pSTAT5 and other pSTATs with Treg and Teee frequencies (online supplemental file 4). At baseline, a significant correlation in CD4+pSTAT5(Y694)+ frequencies and Teee frequencies was observed (online supplemental file 4A,B; R2=0.33, p=0.008). CD4+pSTAT5(Y694)+ frequencies were also positively correlated with Treg frequencies (R2=0.22, p=0.036). Teee and Treg frequencies were also correlated (R2=0.36 p=0.005). In evaluation of on-treatment frequencies, significant correlations of the frequency of Teee cells with levels of CD4+pSTAT5(Y694)+ (R2=0.800, p<0.0001) and CD4+pSTAT2(Y689)+ (R2=0.660, p<0.0001) were seen (online supplemental file 4A,C). No significant correlations were observed for the on-treatment Treg frequencies. Similar results were seen for correlations of on-treatment relative to baseline changes in frequencies (online supplemental file 4A, rightmost panel).
Supplemental material
Given the correlations of CD4 T-cell pSTAT5 and pSTAT2 with frequencies of the Teee population, we hypothesized that Teee population had elevated expression of these transcription factors. To address this, we evaluated the expression of the two pSTATs in CD38±CD39±expressing CD3+CD4+CD127–GARP– T cells. The CD38+CD39+ T cells (Teee population) had the highest levels of both pSTAT2(Y689) (figure 3I) and pSTAT5(Y694) (figure 3J) relative to the other CD38/CD39 phenotypes. Based on limited availability of samples, the samples evaluated (n=9) were a mix of baseline and on-treatment. Consequently, we were unable to make comparisons based on patient relapse/NED.
Transcriptional upregulation of CD39 expression in CD8+ T cells was associated with relapse
To assess differences in immune cell gene expression associated with relapse, we performed whole exome RNA-Seq on paired baseline and on-treatment peripheral blood CD8+ T cells from five NED and five relapsing patients.
At baseline, only one gene was found to be differentially expressed with a q<0.05 threshold between NED and relapsed patient samples. HBB, hemoglobulin subunit beta, was increased in NED relative to relapsing patient samples (figure 4A) (q=0.001, –7.90 log2 fold). Figure 4B shows the top 77 genes that were differentially expressed between NED and relapsed patients on-treatment samples. A volcano plot illustrating these differences is shown in figure 4C. There were 17 transcripts with a q value<0.05, which are shown in red. The top 56 transcripts differentially expressed between relapsed and NED patient samples are shown in figure 4D. We also calculated the intrapatient gene changes, baseline minus on-treatment values (delta values) and compared these values in NED and relapse patient samples. Figure 4E shows the 62 genes with the highest difference in changes between NED and relapse.

ENTPD1 expression increases on-treatment in CD8+ T cells of relapsed patients. Paired baseline and on-treatment CD8+ T cells from five NED and five relapsed patient peripheral blood samples were assessed by RNA sequencing. (A) Gene expression was compared in baseline NED versus relapsed patient samples. Relative log2 fold change of transcripts is represented on the x-axis and corresponding false discovery rate adjusted p value (q value) on the y-axis. Transcripts below a q<0.05 threshold are colored red and those above the threshold in gray. (B) The top 77 baseline transcripts differentially expressed between NED and relapse patient samples are plotted in the heatmap. Each sample is represented by a separate row and labeled by patient outcome. Columns (transcripts) are grouped by hierarchal clustering. (C) As in panel A gene expression comparisons are shown for on-treatment samples. (D) A heatmap of the top 56 differentially expressed transcripts in on-treatment samples is shown, similar to panel B. (E) On-treatment minus baseline transcript values (delta values) were compared in NED versus relapsed patient samples. A heatmap of normalized transcript expression values from the top 62 genes is shown. Each column is an individual patient sample. Rows (transcripts) are grouped by hierarchal clustering. (F) The baseline log2 expression values of ENTPD1 in NED versus relapse patient samples is graphed. (G) The on-treatment values are likewise graphed. (H) The paired values (pretreatment and on-treatment) are shown. (I) The change from baseline (post-treatment expression minus pretreatment frequency) for each patient sample is plotted. The p values accompanying panels F, G, and I were determined by an unpaired t-test. Panel H was determined by a paired t-test. Error bars shown are mean±95% CI. FDR, Food and Drug Administration; NED, no evidence of disease.
To identify biological processes associated with patient relapse/NED, we performed Gene Set Enrichment Analysis using the hallmark collection. In baseline NED samples, 15 hallmark gene sets were significantly enriched at a q value cut-off of <0.05 (online supplemental table 2). In on-treatment NED samples, 35 gene sets were significantly enriched (online supplemental table 3). Only one gene set was significantly enriched in relapsed patient baseline samples, UV_RESPONSE_DN (online supplemental table 4), and none were significantly enriched in on-treatment samples from relapsed patients.
Based on the data from flow cytometry experiments showing on-treatment increases in expression of CD38, CD39 and GARP being associated with relapse, we evaluated these genes specifically in the RNA-Seq data. No differences at baseline, on-treatment or in paired analyses were seen for CD38 or LRRC32 (GARP) (data not shown). However, elevated expression of ENTPD1 (CD39) was observed in relapsed relative to NED on-treatment patient samples (unadjusted p value: 0.0424; difference of means 95% CI: 0.084 to 3.77) (figure 4G). Paired analysis showed upregulation of ENTPD1 on-treatment relative to baseline in relapsing patient sample (mean change in frequency of 5.379%) and a decrease in NED patient samples (mean change in frequency of −4.495%), resulting in a significant difference in delta values between NED and relapse patient samples (unadjusted p value: 0.0116; difference of means 95% CI: 0.7076 to 4.145; figure 4I). No significant differences in ENTPD1 were observed at baseline (figure 4F).
Discussion
In this non-randomized study we showed promising long-term RPS and OS with adjuvant combination immune checkpoint inhibition using NIVO plus IPI in patients with resected high-risk stage IIIB/C and stage IV melanoma. Immune correlate analyses demonstrated expansion of a CD3+CD4+CD38+CD39+CD127–GARP– T-cell population, termed Teee, and indicated that expression of pSTAT2(Y689) and pSTAT5(Y694) in T cells was associated with patient relapse. We also observed that increases in CD39 transcript and protein expression in CD8+ T cells were associated with relapse. Limitations in the interpretation of these exploratory biomarkers are discussed below.
This cohort of patients had a high risk of relapse with surgery alone. In stage IIIC melanoma, the 5-year RFS after surgery alone was 11% within a retrospective single institution cohort with most recurrences occurring within 2 years,14 and 29% for patients in the placebo arm of the COMBI-A/D trial at 5 years of follow-up. The Southwest Oncology Group examined outcomes for patients following complete resection of oligometastatic stage IV disease. In this study of 64 patients, the median RFS was 5 months and the 4-year RFS was estimated to be 13%.15 In contrast, 5-year RFS for patients with stage IIIB/C and IV melanoma who received adjuvant NIVO on CheckMate-238 was 50%,4 and in the KEYNOTE-054 study, 42-month RFS was 55%. In the IMMUNED trial, the 2-year RFS in the patients who received adjuvant NIVO monotherapy for resected stage IV disease was 46% compared with 14% for placebo.7 These data suggest improved outcomes for adjuvant anti-PD-1 therapy compared with no treatment in these high-risk subgroups, yet highlight the need for further study of anti-PD-1-based combination therapy to enhance outcomes.
The high rate of toxicity observed in cohort 4 using the standard dose of 3 mg/kg IPI is consistent with prior data from trials of metastatic disease. In the CheckMate-067 phase III study, the incidence of grade 3 and 4 treatment-related adverse events for combination NIVO plus IPI in advanced melanoma was 59%.16 Given the high rate of toxicity observed during the induction phase in cohort 4 with 9 of the initial 18 enrolled patients unable to complete all four doses of combination therapy, cohort 5 was opened using a lower dose of IPI. This ‘flipped’ dosing regimen has been shown to be better tolerated in the advanced setting in a randomized trial without apparent compromise of progression-free or OS, although that study was not powered for a comparison of efficacy (CheckMate-511).17 In that trial, treatment-related adverse events caused discontinuation of therapy in 34% treated with IPI 3 mg/kg plus NIVO 1 mg/kg versus 24% with IPI 1 mg/kg plus NIVO 3 mg/kg, corresponding to cohorts 4 and 5/6, respectively, in our study. Similarly, the incidence of severe side effects (grades 3–5) was significantly lower when a lower dose of IPI was used. Although the current study is small, the results do not appear to suggest any compromise in outcomes using the IPI 1 mg/kg plus NIVO 3 mg/kg every 3-week induction regimen compared with the converse.
A different schedule and dosing of IPI was used in CM-915, which is the largest randomized adjuvant trial in resected melanoma to date. In this trial, 1844 patients with resected stage III B/C/D or stage IV melanoma by the AJCC eighth edition were randomized to receive up to 1 year of adjuvant NIVO (480 mg every 4 weeks) or combination NIVO (240 mg every 2 weeks) plus IPI (1 mg/kg every 6 weeks). This trial failed to demonstrate any statistically significant improvement in RFS for the entire cohort or within the subset of patients with low PD-L1 expressing tumors, with 2-year RFS of 64% and 65% in the overall combination and single agent arms, respectively. The combination regimen had higher toxicity with 33% grade 3–4 adverse events with 19% of patients discontinuing therapy secondary to toxicity. It is difficult to compare CM-915 and the current smaller pilot trial described herein, especially with alternate schedules and differing dose intensity of IPI within the combination arm. In our study, the standard 12-week period of induction IPI given with NIVO administered over 12 weeks was used with NIVO alone administered during the maintenance phase of therapy.
Given the high efficacy of combination NIVO plus IPI as neoadjuvant therapy for macroscopic stage III disease,18 19 there may still be a role for combination adjuvant IPI and NIVO as administered within cohorts 5 and 6 in our trial. For patients with a lower anticipated risk of relapse (AJCC stage IIIA–B), adjuvant αPD-1 monotherapy may be optimal based on the balance of documented efficacy and toxicity. For patients with a higher risk of relapse including those with stages IIIC/D and IV, a combination immunotherapy approach for adjuvant therapy may still have a role. Further investigation in larger trials, preferably biomarker-based, may assist in rationalizing these choices for patients.
The biomarker results from the current study demonstrate that increases in an ectoenzyme-expressing T-cell phenotype, CD4+CD38+CD39+GARP−CD127−, on-treatment was associated with relapse. This population was previously shown to be associated at baseline with resistance to checkpoint inhibition and poor OS in patients with metastatic melanoma.12 In that study, elevated baseline levels of this population were associated with disease progression. In the current study, no baseline association was observed. In contrast, on-treatment increases were associated with relapse. This difference may reflect the diverse patient populations in the two studies, metastatic versus resected disease. Ongoing studies are evaluating the presence and role(s) of the Teee population in tumor samples.
Several-related single marker phenotypes commonly associated with T-cell suppression (ie, GARP, CD38, CD39)20–22 were also associated with a higher risk of relapse on this trial. RNA-Seq data likewise showed elevated expression of ENTPD1 (CD39) in relapsing on-treatment patient PBMC. None of these markers differentiated patient outcomes at baseline, but they support testing CD38 and CD39 modulating antibodies that are already FDA-approved or in trials, in combination with checkpoint inhibition. Blocking the canonical (CD39/CD73) and alternative (CD38/CD203a) pathways for adenosine production may augment the clinical efficacy of checkpoint inhibition, as has been shown in animal models.23
In addition to an association of the Teee population on-treatment with relapse, our results demonstrate that on-treatment increases in pSTAT2(Y689) and pSTAT5(Y694) in T cells are also associated with relapse. These two pSTATs were also upregulated in the Teee population, suggesting potential involvement in its formation and/or function. It is also possible that the augmentation of these pSTATs in T cells results from upregulation of cytokines associated with immunosuppression and relapse. Interestingly, we also found on-treatment increases in T cells expressing pSTAT3(S727) in relapsing relative to non-relapsing patients. This is in opposition to our observations in NIVO monotherapy-treated patients in the adjuvant and active disease setting.10 The reason(s) for these contradictory findings are unclear but may be the result of combination IPI and NIVO compared with NIVO monotherapy. This hypothesis is supported by studies demonstrating distinct biomarkers for IPI and NIVO.12 24 Alternatively, given the small number of samples assessed, these results may be a type III error.
The results from the immune correlates assessed in this study should be interpreted with caution. While guided by biomarkers identified in previous studies, the immune correlates assessed were not part of a prospective design in this trial. Additionally, the patient samples assessed were an amalgamation of cohorts and were evaluated based on limited sample availability. Therefore, the number of patient samples evaluated was small and may not be a representative sampling of the patient population. Finally, multiple comparison corrections were not performed, inflating the probability of type I errors. Consequently, these immune correlates identified should be interpreted as exploratory, necessitating future validation in independent, larger trials.
In summary, we have shown in a small phase II pilot study that IPI combined with NIVO at doses that are effective in metastatic melanoma result in excellent RFS when given as adjuvant therapy to patients with resected high-risk stages IIIB/C and IV melanoma. The RFS data in the current trial compare favorably to the results observed in the recent CM-915 trial in which less frequent administration of IPI at 1 mg/kg in combination with NIVO did not result in superior RFS to NIVO alone. The small size of our trial limits any comparison to that study, but the dose intensity in our trial was higher than the combination arm of CM-915.
Data availability statement
Data are available upon reasonable request. NA.
Ethics statements
Patient consent for publication
Ethics approval
This study involves human participants and was approved by H Lee Moffitt Cancer Center IRB and New York University IRB Participants gave informed consent to participate in the study before taking part.
References
Supplementary materials
Supplementary Data
This web only file has been produced by the BMJ Publishing Group from an electronic file supplied by the author(s) and has not been edited for content.
Footnotes
Contributors NIK: treated patients, interpreted clinical data, wrote manuscript. ZE: treated patients. YK: carried out statistical analyses on clinical parameters. BC: carried out statistical analyses on clinical parameters. JDG: carried out statistical analyses on clinical and correlative parameters. MV: conducted immune correlate assays. RF: conducted RNA sequencing (RNA-Seq) assay. KM: conducted RNA-Seq assay. TK: oversaw conducting of RNA-Seq assay. PB: analyzed RNA-Seq data. AS: analyzed RNA-Seq data. EM: analyzed RNA-Seq data. CMA: analyzed RNA-Seq data. GTG: treated patients. RK: treated patients. JM: treated patients. ASB: treated patients. AP: treated patients. AR: data management and research coordination of treated patients. DMW: supervised, designed, conducted, analyzed, and interpreted immune correlate assays. Assembled manuscript. JW: conceived trial, led the trial, treated patients, oversaw the conduct of correlative assays, wrote and edited manuscript and is the guarantor for this manuscript.
Competing interests Conflicts of Interest Disclosures: NIK: Advisory Board (Bristol Myers Squibb, Regeneron, Merck, Jounce Therapeutics, Iovance Biotherapeutics, Genzyme, Novartis, Castle Biosciences, Nektar, Instill Bio); Steering or Scientific Committee Member (Nektar, Regeneron, Replimmune, Bristol Myers Squibb, National Comprehensive Cancer Network via Pfizer); Data Safety Monitoring Committee (AstraZeneca, Incyte); Research support (all to institution—Bristol Myers Squibb, Merck, Celgene, Regeneron, Replimmune, Novartis, HUYA Bioscience, GlaxoSmithKline); Common stock (Bellicum, Amarin, Asensus Surgical). ZE: Advisory Board (Pfizer, Array, OncoSec, Regeneron, Genentech, Novartis, Eisai, Natera); Research funding (Novartis, Pfizer). YK: No disclosures to report. BC: No disclosures to report. JDG: President, Statistical Science and Technology Associates; Consultant (Tizona); BMS retirement W2 income; Pfizer pension. MV: No disclosures to report. RF: No disclosures to report. KM: No disclosures to report. TK: No disclosures to report. PB: No disclosures to report. AS: No disclosures to report. EM: No disclosures to report. CMA: No disclosures to report. GTG: Consulting fees from Bristol Myers Squibb, Merck, Regeneron, Esai, Genentech, Novartis, Sapience Therapeutics and Exicure; Institutional research support from Exelixis and Lucerno Dynamics. RK: Advisory Board (Bristol Myers Squibb, Regeneron, Merck, InstilBio, Novartis, Pfizer); Research funding from Bristol Myers Squibb, Regeneron, Merck). JM: Support by NIH/NCI K08CA252164; Research support to Moffitt Cancer Center from Microba Life Science, Morphogenesis, Dr Miriam and Sheldon Adelson Medical Research Foundation, and The Jackson Laboratory. ASB: Advisory board (Deciphera, Bayer). AP: Consultant for BMS, Merck and Regeneron. AR: No disclosures to report. DMW: Owns stocks in BMS (less than $1000). JW: Received less than $10,000 dollars per annum from Merck, Genentech, AstraZeneca, GSK, Novartis, Nektar, Celldex, Incyte, Biond, ImCheck, Sellas, Evaxion and EMD Serono and $10,000–$25,000 dollars from BMS for membership on Advisory Boards; Equity in Biond, Evaxion, OncoC4, Instil Bio and Neximmune; on scientific advisory boards for CytoMx, Incyte, ImCheck, Biond, Sellas, Instil Bio OncoC4 and Neximmune and was remunerated between $10,000–$75,000 dollars; NYU, but not me personally, received research support from BMS, Merck, GSK, Moderna, Pfizer, Novartis and AstraZeneca; Moffitt Cancer Center filed a patent on an IPILIMUMAB biomarker and on TIL preparation that I am named on, and Biodesix filed a PD-1 patent that I was named on; I receive less than $6000 yearly in royalties.
Provenance and peer review Not commissioned; externally peer reviewed.
Supplemental material This content has been supplied by the author(s). It has not been vetted by BMJ Publishing Group Limited (BMJ) and may not have been peer-reviewed. Any opinions or recommendations discussed are solely those of the author(s) and are not endorsed by BMJ. BMJ disclaims all liability and responsibility arising from any reliance placed on the content. Where the content includes any translated material, BMJ does not warrant the accuracy and reliability of the translations (including but not limited to local regulations, clinical guidelines, terminology, drug names and drug dosages), and is not responsible for any error and/or omissions arising from translation and adaptation or otherwise.