Article Text

Abstract
Background Antibody–drug conjugates (ADCs) that deliver cytotoxic drugs to tumor cells have emerged as an effective and safe anticancer therapy. ADCs may induce immunogenic cell death (ICD) to promote additional endogenous antitumor immune responses. Here, we characterized the immunomodulatory properties of D3-GPC2-PBD, a pyrrolobenzodiazepine (PBD) dimer-bearing ADC that targets glypican 2 (GPC2), a cell surface oncoprotein highly differentially expressed in neuroblastoma.
Methods ADC-mediated induction of ICD was studied in GPC2-expressing murine neuroblastomas in vitro and in vivo. ADC reprogramming of the neuroblastoma tumor microenvironment was profiled by RNA sequencing, cytokine arrays, cytometry by time of flight and flow cytometry. ADC efficacy was tested in combination with macrophage-driven immunoregulators in neuroblastoma syngeneic allografts and human patient-derived xenografts.
Results The D3-GPC2-PBD ADC induced biomarkers of ICD, including neuroblastoma cell membrane translocation of calreticulin and heat shock proteins (HSP70/90) and release of high-mobility group box 1 and ATP. Vaccination of immunocompetent mice with ADC-treated murine neuroblastoma cells promoted T cell-mediated immune responses that protected animals against tumor rechallenge. ADC treatment also reprogrammed the tumor immune microenvironment to a proinflammatory state in these syngeneic neuroblastoma models, with increased tumor trafficking of activated macrophages and T cells. In turn, macrophage or T-cell inhibition impaired ADC efficacy in vivo, which was alternatively enhanced by both CD40 agonist and CD47 antagonist antibodies. In human neuroblastomas, the D3-GPC2-PBD ADC also induced ICD and promoted tumor phagocytosis by macrophages, which was further enhanced when blocking CD47 signaling in vitro and in vivo.
Conclusions We elucidated the immunoregulatory properties of a GPC2-targeted ADC and showed robust efficacy of combination immunotherapies in diverse neuroblastoma preclinical models.
- Neuroblastoma
- Macrophages
- Pediatrics
- Antigens
- Immunotherapy
Data availability statement
All data relevant to the study are included in the article or uploaded as supplementary information.
This is an open access article distributed in accordance with the Creative Commons Attribution Non Commercial (CC BY-NC 4.0) license, which permits others to distribute, remix, adapt, build upon this work non-commercially, and license their derivative works on different terms, provided the original work is properly cited, appropriate credit is given, any changes made indicated, and the use is non-commercial. See http://creativecommons.org/licenses/by-nc/4.0/.
Statistics from Altmetric.com
WHAT IS ALREADY KNOWN ON THIS TOPIC
Neuroblastoma tumors express glypican 2 (GPC2) on their cell surface that can be targeted with GPC2-directed antibody–drug conjugates (ADCs).
WHAT THIS STUDY ADDS
In preclinical models of neuroblastoma, a GPC2 ADC induces immunogenic cell death, reprograms the tumor immune microenvironment and enhances antitumor activity of macrophage-driven immunoregulators.
HOW THIS STUDY MIGHT AFFECT RESEARCH, PRACTICE OR POLICY
Our study supports clinical translation of ADC-based combination immunotherapies for children with neuroblastoma.
Background
Survival outcomes for patients with high-risk neuroblastoma remain dismal despite use of intense multimodal therapies.1 Neuroblastoma tumors express cell surface molecules that are suitable for targeting with immune-based strategies,2 as shown by the clinical efficacy of monoclonal antibodies (mAbs) targeting the membrane disialoganglioside GD2.3 However, GD2 immunotherapy is usually accompanied with off-tumor, on-target toxicities due to GD2 expression in some mature human tissues.4 Furthermore, some tumors progress despite anti-GD2 immunotherapy,5 together highlighting the need to identify additional tumor-restricted targets and develop combinatorial immunotherapeutic approaches with improved clinical efficacy and safety profiles.
Recently, our group identified glypican 2 (GPC2) as a novel immunotherapeutic target differentially expressed in neuroblastomas compared with normal tissues.6 GPC2 is a signaling coreceptor heparan sulfate proteoglycan that promotes neuroblastoma oncogenesis and is transcriptionally regulated by N-myc proto-oncogene protein (MYCN).6 To therapeutically target GPC2, we engineered an antibody–drug conjugate (ADC) by conjugating an anti-GPC2 antibody (D3-GPC2-IgG1) to pyrrolobenzodiazepine (PBD) dimers, obtaining a drug:antibody ratio (DAR) of 2.6 and resulting in robust antitumor effects in human neuroblastoma patient-derived xenograft (PDX) models.6 7 We additionally demonstrated that D3-GPC2-PBD induced apoptosis and bystander cytotoxicity by binding a highly tumor-specific conformational epitope of the core GPC2 protein completely shared by humans and mice.7 The equivalent binding of this ADC to both human and murine GPC2 enables studying its effects on the host immune system in immunocompetent syngeneic murine models, using the identical drug that would be used for human clinical testing.
The concept of immunogenic cell death (ICD) relies on the activation of immune responses initiated as dying cells release damage-associated signals to stimulate innate and adaptive immunity.8 Chemotherapy and radiotherapy have been shown to induce ICD and enhance the antitumor activity of diverse immunotherapies.9 10 ADCs are also an attractive platform to selectively induce ICD and modulate the tumor immune microenvironment (TIME), as they can selectively deliver immunogenic payloads to the tumor bed.11 12 In turn, ADCs bearing DNA-damaging (eg, PBD) or tubulin-targeting (eg, maytansine, mertansine, or monomethyl auristatin F) payloads have previously been shown to induce potent antitumor immune responses and potentiate the efficacy of several immunoregulators.13–17 However, these combination immunotherapies have focused on exploiting the antitumor properties of T cells, whereas therapeutically combining ADCs with immunomodulators enhancing the antitumor properties of macrophages remains poorly explored.18
Here, using both GPC2-expressing murine and human neuroblastoma preclinical models, we demonstrate that the D3-GPC2-PBD ADC induces ICD, modulates the neuroblastoma TIME and enhances the efficacy of macrophage-stimulating therapies including anti-CD40 agonist and anti-CD47 antagonist mAbs, setting the stage for the potential clinical translation of GPC2 ADCs in combination with other immunomodulators.
Materials and methods
Cell lines
Human neuroblastoma NB-EbC1, SMS-SAN, NB-SD, and NB69 cell lines were obtained from the Children’s Hospital of Philadelphia (CHOP) repository, and the HEK293T cell line was obtained from the American Type Culture Collection (ATCC, catalog number CRL-3216). Murine neuroblastoma cells 9464D and NXS2 were kindly provided by Dr Paul Sondel and previously characterized in detail.19 All tumor cell lines were cultured in Roswell Park Memorial Institute (RPMI) medium containing 10% fetal bovine serum (FBS), 2 mM L-glutamine and 1% streptomycin/penicillin (RPMI complete; RPMIc) at 37°C under 5% CO2. Cell lines were routinely tested to confirm lack of mycoplasma contamination via the MycoAlert Mycoplasma Detection Kit prior to use in experiments.
Constructs, DNA transfection, lentiviral production, and transduction
Lentiviral plasmid pLEX_307 containing murine Gpc2 cDNA was cloned and characterized as previously described.7 Addgene vectors pLenti PGK V5-LUC Neo (w623-2) and pLenti CMV green fluorescent protein (GFP) Puro (658-5) were a gift from Campeau et al20 and were used to tag neuroblastoma cells with firefly-luciferase and GFP, respectively. DNA transfections, lentiviral production and transduction were performed as previously described.7 21
Preparation of antibodies and ADCs
A naïve human Fab phage display library was used for selection of Fabs against purified recombinant GPC2 ectodomain6 or the SARS-CoV-2 spike protein to use as an isogenic control antibody.22 The best binders were selected to be used for conversion to full-length human IgG1 format. CHO or Expi293 stable cell lines were generated for antibody production. Two PBD-payload ADCs were developed, each with a maximum theoretical DAR of 4. The two variants delivered the same PBD warhead; however, they employed different conjugation chemistries, and the antibody conjugation sites were two amino acids apart. In the first ADC preparation, we produced a Y289L mutant β4Gal-T1 enzyme which was used to conjugate GalNaz to terminal biantennary N-acetylglucosamines followed by click-reaction conjugation of a dibenzocyclooctyne (DBCO)-activated PBD-payload (Levena Biopharma). Antibodies with terminal biantennary N-acetylglucosamines were expressed in CHO cells with knocked-down uridine diphosphate galactose transporter UGT1.23 The UGT1(−) CHO cell line was generated using CRISPR/Cas9. In the second ADC variant, antibody glycans were removed using PNGase F and amino-PEG6-bis-PEG5-azide (ConjuProbe) and conjugated to Q295 using bacterial transglutaminase.24 DBCO-activated PBD payload was conjugated in a follow-up click reaction. The efficiency of GlcNaz and amino-PEG6-bis-PEG5-azide conjugation was evaluated with liquid chromatography/mass spectometry (LC/MS) and was more than 95% efficient. Excessive payload conjugation induced antibody aggregation; therefore, payload was added to the reaction mixture in small amounts and the reaction was monitored using LC/MS. The reaction was stopped when the appearance of molecular aggregates was detected. This resulted in a maximal amount of conjugated payload for a given ADC variant. Enzyme-mediated conjugation steps were performed at 37°C in phosphate-buffered saline (PBS). PBD-payload conjugation was performed using a mixture of 60% PBS and 40% propylene glycol at room temperature.
D3-GPC2-IgG internalization and D3-GPC2-PBD cytotoxicity
Internalization studies were performed on an Incucyte ZOOM live-cell monitoring system (Essen Bioscience) using 5 µg/mL of red-labeled D3-GPC2-IgG1 antibody, as previously detailed.21 Cytotoxicity of D3-GPC2-PBD, AB1-SARS-CoV-2-PBD, and free PBD (Levena Biopharma) was measured using Cell Titer-Glo V.2.0 Cell Viability Assay (Promega).21
Evaluation of ICD
ICD markers including calreticulin, HSP70 and HSP90 membrane translocation, and HMGB1 and ATP release were measured after GPC2 ADC treatment (150 ng/mL) in GPC2 and empty-vector NXS2 and 9464D murine cell lines and in human neuroblastoma cell lines NB-EbC1, SMS-SAN, NB69, and NB-SD. ICD was also evaluated after treatment with control ADC (AB1-SARS-CoV-2-PBD, 150 ng/mL), free PBD at ADC equimolar concentrations and doxorubicin (50 and 500 nM for NXS2 and 9464D cell lines, respectively), a well-known ICD inducer and used as a positive control for these experiments.25 At 72 hours, cells were collected, stained with Annexin-V-APC (1:50, 422201; BioLegend), calreticulin-PE (1:50, D3E6; Cell Signaling), HSP70-Alexa Fluor488 (1:20, 648003; BioLegend), HSP90-APC (1:100, NB110-61640APC; Novusbio) and Dapi (1:3000, 422801; BioLegend) and processed by flow cytometry. Percentages of apoptotic cells were defined as Annexin-V+/Dapi− cells. Mean fluorescence intensity (MFI) of calreticulin, HSP70, and HSP90 was determined in Annexin-V+/Dapi− cells. Secretion of HMGB1 in the extracellular media was measured using an IBL International’s HMGB1 ELISA kit (Tecan). Secretion of ATP in the extracellular media was measured using an ENLITEN ATP Assay System (Promega).
In vitro macrophage-mediated phagocytosis
To generate macrophages, human monocytes were obtained from the Immunology Core at University of Pennsylvania and cultured at 1×10⁶ cell/mL density in 75 cm2 flasks with RPMIc with human recombinant macrophage colony-stimulating factor (M-CSF, 25 ng/mL; Peprotech, 300–25) for 7 days.
For phagocytosis assays, GFP-labeled NB-EbC1, SMS-SAN, NB69, and NB-SD cells were plated in 6-well plates overnight (50,000 cells/well) and treated with D3-GPC2-PBD (0.15 ng/mL), AB1-SARS-CoV-2-PBD (0.15 ng/mL), and D3-GPC2-PBD (0.15 ng/mL) added 4 hours after addition of D3-GPC2-Fab (×1000 equimolar excess), free PBD at ADC equimolar concentrations or vehicle for 72 hours. Then, macrophages were added in a tumor:macrophage ratio of 1:1 together with anti-CD47 (MIAP-410, 10 µg/mL) or IgG1 isotype (MOPC-21, 10 µg/mL). After 24 hours, cells were stained with human CD11b-PE (#301306, BioLegend) and CD40-APC (#334309, BioLegend) antibodies and were analyzed on a Beckman CytoFLEX S (Beckman Coulter). Percentage of phagocytosis was determined by quantifying live GFP-FITC and CD11b-PE-positive macrophages. MFI of CD40 was determined in GFP/CD11b-expressing cells. All phagocytosis assays were repeated with macrophage cultures derived from at least two different donors.
Murine models
To generate syngeneic neuroblastoma allografts, GPC2 or empty-vector 9464D or NXS2 cells (2×10⁶) were injected subcutaneously with matrigel (Corning, 100 µL) in the flanks of 6-week-old C57BL/6 or A/J female mice, respectively (Jackson Laboratory, Bar Harbor, Maine, USA). To generate neuroblastoma PDXs, 3×3 mm3 fresh tumor fragments of COG-N-421x tumor (characterized in Bosse et al6) were engrafted subcutaneously in the flanks of 6-week-old immunodeficient female NSG mice.
In vivo vaccination/rechallenge studies
To study ADC-induced ICD in vivo, we performed different vaccination/rechallenge experiments as reviewed in Galluzzi et al.26 First, A/J mice were subcutaneously vaccinated with 2×10⁶ NXS2-GPC2 cells previously treated with ADC at 30 ng/mL for 96 hours (n=7–8). As non-immunogenic controls, a group of seven mice were vaccinated with necrotic cells obtained on three freeze–thaw cycles. After 7 days, all animals were rechallenged subcutaneously in the contralateral flank with 2×10⁶ naïve NXS2-GPC2 cells. To evaluate immunological memory against GPC2 negative cells, a similar study was performed, rechallenging mice with NXS2 empty-vector cells.
Second, A/J mice were vaccinated subcutaneously with NXS2-GPC2 cells treated with ADC (30 ng/mL for 96 hours) or necrotic control cells (n=8–9 per group), and animals were rechallenged intravenously with 1×10⁶ luciferase-tagged NXS2-GPC2 cells 7 days later. Disseminated tumor growth was followed by bioluminescence imaging two times per week using a Xenogen IVIS-Spectrum system. The experimental endpoint was when the total body bioluminescence reached 1×10⁸ total flux (p/s) or when animals died secondary to progressive disease (PD).
Third, C57BL/6 mice were vaccinated subcutaneously with 2×10⁶ 9464D-GPC2 cells treated with ADC (30 ng/mL for 96 hours) or necrotic cell controls (n=10 per group) and rechallenged subcutaneously in the contralateral flank 7 days layer with 2×10⁶ naïve 9464D-GPC2 cells.
Evaluation of systemic CD8+ T-cell activation after vaccination
We also studied CD8 T-cell activation during vaccination experiments. First, A/J mice were vaccinated subcutaneously with ADC-treated (30 ng/mL for 96 hours) or necrotic NXS2-GPC2 cells (n=9 per group), rechallenged with naïve cells 7 days later and sacrificed at 1, 3 and 7 days post rechallenge to collect spleens (n=3 per timepoint). Splenocytes were then stained with CD8-APC and CD69-PE antibodies and analyzed by flow cytometry. Percentage of CD69+ cells gated in CD8+ populations were defined as systemically activated cytotoxic T cells.
In a second experiment, A/J mice were vaccinated as described previously (n=3 per group) and sacrificed 7 days later prior to tumor rechallenge. Spleens were harvested, processed to obtain single-cell suspensions, and CD8+ T cells were isolated using the Dynabeads FlowComp Mouse CD8 Kit (Thermo Fisher). NXS2-GPC2 cells were cultured in six-well plates overnight (50,000 cells/well) and cocultured with mouse CD8+ T cells in a T-cell:tumor ratio of 5:1 for 24 hours. All cells were collected, stained with CD8-APC and CD69-PE antibodies, and analyzed by flow cytometry.
In vivo efficacy studies
For single-agent ADC in vivo efficacy studies, A/J mice bearing 0.10–0.50 cm3 NXS2-GPC2 allografts were randomized to four treatment groups and received a single intraperitoneal dose of D3-GPC2-PBD (1 mg/kg×1), AB1-SARS-CoV-2-PBD (1 mg/kg×1), free PBD at ADC equimolar dose or vehicle (PBS×1) (n=5–10 per group). At day 7 post treatment, five animals from the ADC or vehicle groups were sacrificed to perform TIME analyses, and five animals were monitored for tumor growth and total body weights.
We also evaluated ADC efficacy when blocking either cytotoxic T cells (anti-CD8) or phagocytic macrophages (anti-CSF1R plus clodronate27). For this experiment, A/J mice bearing 0.10–0.50 cm3 NXS2-GPC2 allografts were randomized to four treatment groups: group 1, D3-GPC2-PBD (0.1 mg/kg×1, intraperitoneal); group 2, D3-GPC2-PBD (0.1 mg/kg×1, intraperitoneal, day 1) plus anti-CD8 antibody (clone 2.43; BioXCell; 400 µg per mouse, intraperitoneal; days −1, 1, and 7); group 3, D3-GPC2-PBD (0.1 mg/kg×1, intraperitoneal, day 1) plus anti-CSF1R (clone AFS98, BioXCell; 400 µg per mouse, intraperitoneal; days 1 and 7) and clodrosome (Encapsula NanoSciences; 500 µg per mouse intravenous, day −1); and group 4, vehicle (PBS×1) (n=4–8 per group).
For ADC plus CD40 agonist combination studies, A/J mice bearing NXS2-GPC2 allografts were randomized to four treatment groups (n=12–15 per group) and treated with D3-GPC2-PBD (intraperitoneal, 0.1 mg/kg×1) or vehicle. Seven days later, one dose of anti-mouse CD40 agonist antibody (100 µg, intraperitoneal; FKG4.5) or IgG2 isotype antibody (100 µg, intraperitoneal; 2A3) was administered. Animals that displayed maintained complete response (MCR) were rechallenged with NXS2 empty-vector transduced cells (2×10⁶ in matrigel) at day 60 in the contralateral flank. On the day of rechallenge, 10 naive A/J mice were also injected with NXS2 empty-vector transduced cells as controls. Mice were monitored for an additional 40 days after tumor rechallenge. At day 4 post-IgG2 or CD40 dosing, five animals were sacrificed to perform TIME analyses.
For ADC plus CD47 antagonist combination studies, we used both syngeneic and PDX models of neuroblastoma. First, A/J mice bearing NXS2-GPC2 allografts were randomized to four groups (n=5–7 per group) and treated with D3-GPC2-PBD (intraperitoneal, 0.1 mg/kg x1) or vehicle. Anti-mouse CD47 (100 µg, intraperitoneal; MIAP-410) or IgG1 isotype (100 µg, intraperitoneal; MOPC-21) antibodies were administered at days 7, 9, and 11 to both ADC and vehicle groups. In a second study, NSG mice bearing 0.2–0.5 cm3 human COG-N-421x PDXs were randomized to four groups (n=8–9 per group) and treated with D3-GPC2-PBD (intraperitoneal, 0.25 mg/kg×1) or vehicle. Human anti-CD47 (400 µg, intraperitoneal; B6.H12) or human IgG1 isotype (400 µg, intraperitoneal; BE0297) antibodies were administered using the same schedule as in the syngeneic models.
Tumor growth responses were evaluated 7 days after the last dose of mAbs. In all combination studies, tumors that reached 2 cm3 before receiving any dose of antibody injection (day 7) were excluded from the study. Anti-CD40 and anti-CD47 antibodies used in vivo, and the corresponding IgG isotypes were obtained from BioXCell (NH, USA).
Immunohistochemistry (IHC)
Tumors and/or normal murine tissues were collected from euthanized animals, fixed with 10% formalin for a minimum of 24 hours and embedded in paraffin. Five-micrometre slides were stained on a Bond Max automated staining system using the Bond Refine polymer staining kit (Leica Biosystems) according to the standard protocol. Rabbit primary antibodies reacting against human and mouse histone H3 (phospho S10, ab5176, 1:500), Cleaved PARP1 (ab32064, 1:100) and HMGB1 (ab18256, 1:1000) were obtained from Abcam. Stained slides were then digitally scanned at ×20 magnification on an Aperio CS-O slide scanner (Leica Biosystems) and representative pictures were taken with the Aperio ImageScope program V.12.2.2.5015.
RNA sequencing
Total RNA from excised tumors was isolated using TRIzol (Life Technologies) and RNA quality was determined using the TapeStation 2200 (Agilent Technologies). Samples of optimal quality were sequenced using Chemistry Development Kit V.2, 2×150 bp, and run on one high-output flow cell of an Illumina NextSeq 500 instrument. Libraries were demultiplexed; Illumina adapters were trimmed; and FASTQ file was generated using the Illumina NextSeq Control Software V.2.02. The quality of the raw fastq data (average sequencing depth of 70 million reads) was assessed using FastQ Screen and FastQC. The files were aligned to GENCODE V.GRCm38.p4 M10 mouse reference using STAR 2-pass mode, and reads were mapped to the reference genome. Differential expression analysis was completed in R using the DESeq2 package. A gene was considered differentially expressed with an adjusted p value of <0.01 and fold change of >4 between ADC-treated and control groups. The list of differentially expressed genes was fed into PathfindR to define upregulated and downregulated pathways. RNA-sequencing data for SMS-SAN and NB-EbC1 cells were obtained from Harenza et al.28 Genes involved in phagocytosis regulation (n=4829) and with an Fragments Per Kilobase Million (FPKM) of >10 were included in the final analysis.
Flow cytometry
Single-cell suspensions from murine and human tumor cell lines, PDXs, or mouse allografts were stained with LIVE/DEAD Fixable Violet Dead Cell Stain (Invitrogen), incubated with the indicated primary antibody, and run on a Beckman CytoFLEX S cytometer (Beckman Coulter). PE mouse antihuman CD47 (B6H12, BD Bioscience) and PE rat anti-mouse CD47 (miap301, BioLegend) antibodies were used to measure CD47 surface expression in human and mouse neuroblastoma cells, respectively. Cell surface molecules of GPC2 and CD47 were determined using the BD Quantibrite Beads PE Fluorescence Quantitation Kit (BD Bioscience). Intratumoral immune infiltrates from tumor allografts were characterized using CD3-APC (100235), CD8-APC (100431), CD69-PE (104507), PD1-FITC (135213), CD11b-PerCP (101229), CD11c-APC (107339), MHCII-PE (107607), and F4-80-APC (123115) antibodies obtained from BioLegend. Results were analyzed using FlowJo software.
Cytometry by time of flight (CyTOF)
A total of 3 million cells from tumor allografts were resuspended in Maxpar Cell Staining Buffer (Fluidigm), incubated with Fc-receptor block (Miltenyi Biotec), and stained with 24 metal-conjugated antibodies. Maxpar antibodies CD45-89Y, Gr1-141, CD11c-142, CD69-143Nd, CD115-144Nd, CD4-145, F4-80-146, CD11b-148, CD19-149, CD25-151, CD3-152-Sm, CD14-156Gd, PD1-159Tb, CD40-161Dy, Tim3-162Dy, CD49b-164Dy, CD8a-168, CD206-169Tm, Nk1.1–170, CD80-171Yb, CD86-172Yb, and IA/IE-174Yb were used to detect and cluster immune cells (Fluidigm). Tumor-targeting antibodies D3-GPC2-IgG (GPC2) and dinutuximab (GD2) were conjugated with 153Eu and 154Sm using metal conjugation kits (Abcam). Cell-ID Intercalator-Ir (125 nM) was used to distinguish live versus dead cells and events were acquired using CyTOF2 mass cytometer (Fluidigm). Results were analyzed using FlowJo software.
Cytokine profiling array
Tumor protein lysates were obtained after tissue homogenization with PBS, protease inhibitors, and 1% Triton X-100 (Sigma-Aldrich). Samples were then examined for the presence of 115 mouse cytokines using a Mouse XL Cytokine Array Kit (R&D). Array membranes were scanned by conventional chemiluminescence and spot pixel density measured using HLImage++ software (Western Vision). Differential cytokine expression (fold-change cytokine expression >3, ADC vs vehicle) was determined using the mean of those cytokines with a spot pixel density higher than 500 arbitrary units.
Statistics
All statistical analyses were performed using GraphPad software except for the RNA-sequencing analyses, which were performed using R software. Student’s t-test and Mann-Whitney t-test (for non-normally distributed data) were used for non-paired comparisons of two groups. Wilcoxon signed-rank test was used to compare paired groups. One-way analyses of variance (ANOVAs) and Tukey’s, Dunn’s or Holm-Šídák’s multiple comparisons test were applied to determine differences between multiple groups with one independent variable. Two-way ANOVA and Šídák’s multiple comparison test were applied to determine differences between multiple groups with two or more independent variables. χ2 tests was used to compare proportions. Median survival rates were calculated using the Kaplan-Meier method, and curves were compared using the log-rank test. The threshold for significance (α) was set at 0.05 unless otherwise specified.
Results
D3-GPC2-PBD ADC induces ICD in murine neuroblastoma cells
Syngeneic models of neuroblastoma resemble immunological properties of human neuroblastomas and thus are suitable for evaluating the immune modulating effects of the D3-GPC2-PBD ADC.19 30 Since murine neuroblastoma cells NXS2 and 9464D express low endogenous GPC2,7 we stably overexpressed GPC2 (NXS2-GPC2 and 9464D-GPC2) and obtained high cell surface expression by flow cytometry (figure 1A). Overexpression was maintained after NXS2-GPC2 and 9464D-GPC2 in vivo tumor engraftment in immunocompetent syngeneic A/J and C57BL/6 mice, respectively (figure 1B), with GPC2 cell surface levels comparable to those in human neuroblastoma cell lines and PDXs (figure 1C),21 recapitulating the antigen expression of human disease. We next evaluated whether NXS2-GPC2 and 9464D-GPC2 cells would be suitable for ADC functional studies. We first demonstrated that the anti-GPC2 D3-GPC2-IgG antibody conjugated to a pH-sensitive red dye showed a time-dependent internalization selectively in GPC2-transduced murine cells (figure 1D). Treatment with GPC2 ADC decreased cell viability in a concentration-dependent manner in GPC2-transduced murine neuroblastoma cells but not in those transduced with empty-vector (mean half-maximal inhibitory concentration (IC50) values of 7.12 for GPC2 vs >150 ng/mL for empty-vector transduced cells; figure 1E). This cytotoxicity was specific, as these murine neuroblastoma cell lines were not efficiently killed by a control non-targeting ADC (AB1-SARS-CoV-2-PBD) (figure 1F), and cytotoxicity of free PBD was independent of antigen expression (figure 1G). In GPC2-expressing cells, GPC2 ADC was 82.7±10.3-fold more potent than free PBD at equimolar PBD concentrations (figure 1H), correlating with the robust D3-GPC2-IgG1 antibody internalization we observed in GPC2-expressing cells (figure 1D) and suggesting increased, target-dependent intracellular payload accumulation. Further, GPC2 ADC treatment increased percentage of Annexin-V+/Dapi− cells in GPC2-expressing but not in empty-vector murine neuroblastoma cells (online supplemental figure 1). Finally, we observed that treatment with 150 ng/mL of GPC2 ADC (but not control ADC or free PBD at equimolar concentrations) increased membrane expression of calreticulin (figure 1I), HSP70 (figure 1J) and HSP90 (figure 1K), and secretion of HMGB1 (figure 1L) and ATP (figure 1M) in GPC2-expressing murine neuroblastoma cells, whereas this effect was not observed in empty-vector transduced cells. Doxorubicin given at concentrations that induced similar levels of apoptosis to 150 ng/mL of GPC2 ADC (50 and 500 nM for NXS2 and 9464D, respectively; online supplemental figure 1) increased markers of ICD independently of GPC2 expression (figure 1I–M).
Supplemental material

The D3-GPC2-PBD ADC is cytotoxic and induces biomarkers of immunogenic cell death in GPC2-expressing murine neuroblastoma cells. (A) GPC2 flow cytometry histograms of GPC2 isogenic murine neuroblastoma cell lines 9464D and NXS2 versus paired empty-vector transduced cells. (B) GPC2 flow cytometry histograms of GPC2 isogenic 9464D and NXS2 allografts in C57BL/6 and A/J mice, respectively. (C) GPC2 flow cytometry histograms (left) and quantification of cell surface molecules (right) of NXS2-GPC2 allografts compared with human neuroblastoma cell lines and PDXs (one-way analysis of variance plus Holm-Šídák’s multiple comparisons test). (D) Internalization kinetics of D3-GPC2-IgG antibody in GPC2 isogenic murine neuroblastoma cell lines 9464D and NXS2 versus paired empty-vector transduced cells (left panel) and corresponding AUC plot (right panel). Means and SDs are represented (n=3). *P=0.0021, **P=0.0007 (unpaired Student t-test). (E) Concentration-dependent cytotoxicity of D3-GPC2-PBD ADC (concentration range of 0.0019–150 ng/mL) in GPC2 isogenic murine cell lines 9464D and NXS2 versus paired empty-vector transduced cells. Means and SDs are represented (n=4 from two different D3-GPC2-PBD batches). (F) Concentration-dependent cytotoxicity of AB1-SARS-CoV-2-PBD ADC (concentration range of 0.0019–150 ng/mL) in GPC2 isogenic murine neuroblastoma cell lines 9464D and NXS2 versus paired empty-vector transduced cells. Means and SDs are represented (n=2). (G) Concentration-dependent cytotoxicity of free PBD (concentration range of 9×10⁻⁶-30.62 ng/mL) in GPC2 isogenic murine cell lines 9464D and NXS2 versus paired empty-vector transduced cells. Means and SDs are represented. (H) Comparison of ADC versus free PBD cytotoxicity against GPC2 isogenic murine neuroblastoma cells at equimolar concentrations. (E–H) Means and SDs of IC50 values. (I–M) Cell surface translocation of (I) calreticulin, (J) HSP70 and (K) HSP90, and extracellular release of (L) HMGB1 and (M) ATP in GPC2 isogenic and paired empty-vector transduced 9464D and NXS2 cells after 72 hours of GPC2 or control ADC treatment (150 ng/mL), or equimolar free PBD or doxorubicin (50 nM for NXS2 and 500 nM for 9464D, respectively) treatment compared with vehicle-treated controls. Each heatmap spot represents the mean fold change from vehicle-treated cells of two to four replicates. Data in E, H and I–M represent the mean±SD of data from two to four experiments performed with different batches of the D3-GPC2-PBD ADC. ADC, antibody–drug conjugate; AUC, area under the curve; GPC2, glypican 2; IC50, half-maximal inhibitory concentration; n.s. not signficant; PBD, pyrrolobenzodiazepine; PDX, patient-derived xenograft; ROA, red objective area; uns., unstained.
Vaccination with D3-GPC2-PBD-treated cells induces endogenous T cell-dependent immune responses
We next studied GPC2 ADC-mediated ICD in vivo using vaccination/rechallenge experiments,26 summarized in figure 2A. Prophylactic subcutaneous vaccination of A/J mice with NXS2-GPC2 cells treated with ADC prevented growth of subsequent subcutaneous tumor rechallenge with naïve NXS2-GPC2 cells in 72% of mice and significantly increased survival compared with controls (figure 2B, left). Notably, such immunological memory was also observed after rechallenging with GPC2-low NXS2 empty-vector cells, where vaccination with ADC-treated GPC2-expressing cells prevented subcutaneous NXS2 empty-vector cell growth in 70% of mice, again significantly extending animal survival (figure 2B, right). No changes in GPC2 expression were observed in GPC2 or empty-vector rechallenged NXS2 tumors that relapsed after vaccination (online supplemental figure 2A). In addition, vaccination with ADC-treated cells decreased disseminated tumor growth and increased murine survival on intravenous rechallenge with naïve luciferase-tagged NXS2-GPC2 cells (figure 2C and online supplemental figure 2B,C), in part by likely preventing metastatic lesions, which were observed in the livers of mice vaccinated with control freeze–thawed NXS2 cells (figure 2D).
Supplemental material
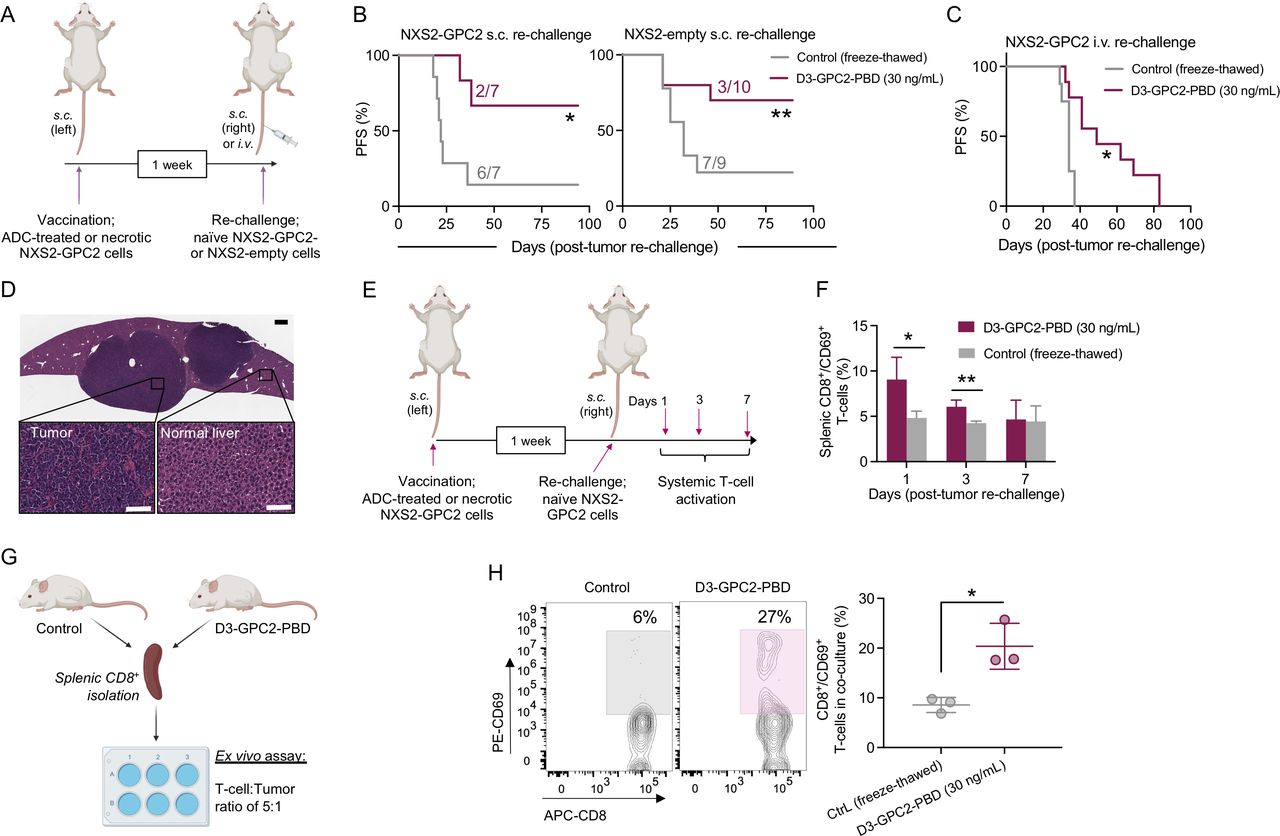
Vaccination with D3-GPC2-PBD-treated neuroblastoma cells induces T cell-dependent immunological memory. (A) Schematic representation of the different vaccination/rechallenge approaches. (B) PFS in animals subcutaneously vaccinated with ADC-treated (30 ng/mL for 96 hours) (maroon) or freeze–thawed NXS2-GPC2 cells (gray) followed by subcutaneous rechallenge with NXS2-GPC2 (left panel) or NXS2-empty-vector (right panel) naïve cells 7 days after vaccination (n=7–10 mice per group). Number of engrafted tumors in each group is indicated. *P=0.009, **P=0.042 (log-rank test). (C) PFS in animals subcutaneously vaccinated with ADC-treated (30 ng/mL for 96 hours) or freeze–thawed NXS2-GPC2 cells and intravenously rechallenged with luciferase-expressing NXS2-GPC2 cells 7 days after vaccination (n=9–10 per group). *P=0.007 (log-rank test). (D) H&E staining of a tumor-infiltrated liver from a control cell (freeze–thawed NXS2-GPC2) vaccinated mouse rechallenged intravenously with luciferase-expressing NXS2-GPC2 cells. Scale bars represent 500 µm (top) and 100 µm (bottom). (E) Schematic representation of the evaluation of systemic T-cell activation kinetics after vaccination (freeze–thaw Ctrl vs ADC (30 ng/mL), n=3 for each timepoint). (F) Time-dependent systemic activation of cytotoxic T cells (splenic CD8+/CD69+ cells) after tumor rechallenge in vaccinated mice (control vs ADC (30 ng/mL)). Means and SDs are represented. *P=0.046, **P=0.015 (unpaired Student t-test). (G) Schematic representation of the ex-vivo naïve NXS2-GPC2 cells/isolated CD8+ T-cell coculture assay from vaccinated mice (control vs ADC (30 ng/mL), n=3 each group). (H) Representative flow cytometry plots showing CD8+ and CD69+ T-cell populations in cocultures (left) from G. Quantified percentage of CD8+ and CD69+ coexpressing T cells in cocultures (right) from G. *P=0.038 (unpaired Student t-test). Means and SDs are represented. ADC, antibody–drug conjugate; Ctrl, control; GPC2, glypican 2; PBD, pyrrolobenzodiazepine; PFS, progression-free survival.
To elucidate whether these antitumor effects were regulated in part by T cells, we first determined the total amount of systemic activated CD8+ T cells at different timepoints after tumor rechallenge with naïve NXS2-GPC2 cells (figure 2E). Activated splenic T cells (coexpressing CD8 and CD69) increased at days 1 and 3 after tumor rechallenge in ADC-vaccinated mice compared with controls (figure 2F). Second, we studied whether isolated CD8+ T cells from vaccinated animals could undergo potent reactivation on ex vivo priming with naïve NXS2-GPC2 cells (figure 2G). We observed a significantly higher percentage of CD8+ and CD69+ T cells in cocultures derived from ADC-vaccinated animals compared with controls (figure 2H). Finally, we also performed a vaccination experiment using the less immunogenic 9464D-GPC2 cell line.19 Vaccination with 9464D-GPC2-ADC-treated cells neither prevented subcutaneous rechallenge nor improved survival compared with controls (online supplemental figure 2D), correlating with prior evidence of 9464D cells producing immunologically cold neuroblastoma tumors.31
D3-GPC2-PBD reprograms the neuroblastoma immune microenvironment to a proinflammatory state
We next studied whether direct GPC2 ADC treatment of NXS2-GPC2-bearing mice could result in tumor regressions and modify the neuroblastoma TIME. First, we observed that GPC2 ADC alone given at 1 mg/kg led to MCRs in 100% of NXS2-GPC2-bearing animals (figure 3A and online supplemental figure 3A), whereas mice treated with vehicle, control ADC (AB1-SARS-CoV-2-PBD) (figure 3A), or free PBD at equimolar concentrations (online supplemental figure 3A) displayed rapidly PD, confirming target-mediated ADC antitumor effects. Histologically, ADC treatment induced extensive areas of necrosis and differentiation and diminished tumor proliferation rates measured by pH3 IHC (figure 3B and online supplemental figure 3B), along with increased levels of cleaved PARP1 and HMGB1 (figure 3C and online supplemental figure 3C), confirming robust levels of apoptosis and ICD in vivo, respectively. By bulk RNA sequencing, ADC treatment resulted in differential expression of 1950 genes, most of which were upregulated (93%, 1816/1950; figure 3D). Genes related to monocyte recruitment (eg, Cxcl16, Ccl7, and Ccl2), innate immune cell activation (eg, Cd40, Cd80, and Siglec-1), or T-cell priming and activation (eg, Batf, Il2ra, and Cd69) were significantly upregulated, suggesting an ADC-mediated induction of a proinflammatory TIME. In contrast, genes related to neuroblastoma oncogenesis (eg, Foxr2 and Ascl1) were downregulated.32 33 Further, gene ontology analysis showed that 5 of the top-10 upregulated pathways after ADC treatment were directly associated with the immune system (figure 3E). Next, in paired cytokine arrays, ADC-treated tumors showed increased expression of proteins associated with myeloid cell recruitment and/or activation (CXCL16, ICAM1, CD40, and CCL12; figure 3F and online supplemental figure 3D).34–36
Supplemental material

The D3-GPC2-PBD ADC reshapes the neuroblastoma immune microenvironment to a proinflammatory antitumor state. (A) NXS2-GPC2 tumor growth curves after treatment with D3-GPC2-PBD or control AB1-SARS-CoV-2-PBD ADC at 1 mg/kg, or vehicle control. Means and SEMs are represented (n=4–5 mice per group). (B) H&E and pH3 IHC staining in NXS2-GPC2 tumors 7 days after ADC (1 mg/kg) or vehicle treatments. Scale bars represent 200 µm. (C) Cleaved-PARP1 and HMGB1 IHC staining in NXS2-GPC2 tumors 7 days after ADC (1 mg/kg) or vehicle treatments. Scale bars represent 200 µm. (D) Volcano plot of differentially expressed genes (log2 fold-change >2 in ADC (1 mg/kg) versus vehicle-treated tumors shown in maroon) 7 days after ADC treatment (n=3 per group). Upregulated genes involved in innate immune cell activation as well as T-cell recruitment, and downregulated genes involved in neuroblastoma tumorigenesis are labeled and highlighted in red. (E) Top 10 upregulated Kyoto Encyclopedia of Genes and Genomes (KEGG) pathways after ADC treatment. Immune-related pathways (n=5) are highlighted in maroon. (F) Summary of differential cytokine expression (fold-change ADC vs vehicle) in NXS2-GPC2 tumor homogenates. Black dot indicates reference spots (controls). Dotted line represents fold change of 1. (G) t-SNE plots generated from cytometry by time of flight data. Left panels show CD45+ (immune) versus GD2+/GPC2+ (tumor) populations in vehicle versus ADC-treated animals. Right panels show paired clustered immune populations gated on CD45+ cells, expanded for vehicle treated cells. (H) Intratumoral immune infiltrates in vehicle versus ADC-treated animals (n=4–5 tumors per group) quantified by flow cytometry. *P=0.007, **P=0.015 (Mann-Whitney t-test). (I) Quantification of cytotoxic T cells in an activated (CD69+) or exhausted (PD1+) state. *P=0.007 (Mann-Whitney t-test). (H,I) Individual tumor data, along with means and SDs, are represented for each immune cell subset. (J) Individual NXS2-GPC2 tumor growth curves after treatment with (1) the D3-GPC2-PBD ADC (0.1 mg/kg) alone or (2) combined with either anti-CD8 antibodies (T-cell inhibition) or (3) clodronate liposomes plus anti-CSF1R antibodies (macrophage inhibition) (n=4–8 mice per group). (K) Tumor volumes on day 10 after ADC treatment in groups indicated in J. *P=0.043, **P=0.020 (one-way analysis of variance plus Tukey’s comparisons test). ADC, antibody–drug conjugate; DC, dendritic cell; GPC2, glypican 2; MDSC, myeloid-derived suppressor cell; NK, natural killer; PBD, pyrrolobenzodiazepine; pH3, phosphohistone 3; t-SNE, t-distributed stochastic neighbor embedding.
We next studied ADC-mediated TIME modifications at a single-cell level using CyTOF to generate a comprehensive map of the ADC-induced intratumoral immune cell infiltrates (figure 3G). After 7 days of ADC treatment, we observed a significant enrichment of CD45+ cells and depletion of neuroblastoma cells in ADC-treated tumors, most notable for the robust infiltration of lymphocytes (CD4 and CD8 T, B, and natural killer (NK) cells), monocytes, proinflammatory CD40+ MHCII+ macrophages and myeloid-derived suppressor cells (online supplemental figure 3E). These data were validated with paired-flow cytometry studies where we also found a significant increase in macrophages and both total (CD3+) and cytotoxic (CD8+) T cells in ADC-treated tumors (figure 3H). Notably, cytotoxic CD8+ T cells from ADC-treated tumors were more activated (CD69+) and less exhausted (PD1+) than T cells isolated from vehicle-treated tumors (figure 3I). Finally, to further validate the functional relevance of this robust macrophage and T-cell tumor infiltration to ADC efficacy, we blocked the effects of either phagocytic macrophages (with anti-CSF1R plus clodronate27) or cytotoxic T cells (with anti-CD8 antibodies), respectively, both of which resulted in significantly impaired in vivo ADC efficacy (figure 3J,K).
D3-GPC2-PBD ADC enhances efficacy of macrophage-targeted immunoregulators
Considering the contribution of macrophage infiltration to the efficacy of this GPC2 ADC, we next asked whether lower ADC doses (0.1 mg/kg) would enhance antitumor activity of macrophage-associated immunoregulators in these syngeneic neuroblastoma models. We first selected CD40 agonism for ADC combination studies because (1) CD40 expression was upregulated after ADC treatment (figure 3D,F); (2) ADC treatment increased intratumoral infiltration of CD40-expressing immune cells (online supplemental figure 3E,F); and (3) ADC promoted T cell-mediated responses (figure 2E–H and figure 3G–K) that could potentially be boosted by CD40 ligation similar to that observed with TLR agonists, chemotherapy or radiation therapy.37 Second, we combined the ADC with CD47 blockade because (1) ADC increased infiltration of activated macrophages (figure 3G,H); (2) syngeneic neuroblastomas express high levels of CD47 (online supplemental figure 4A); and (3) CD47 antagonists are in preclinical and clinical development for neuroblastoma. Our CD40 and CD47 combination treatment schedules are shown in online supplemental figure 4B,C, respectively.
Supplemental material
First, in the GPC2 ADC/CD40 preclinical trial all animals treated with vehicle plus control IgG2 or CD40 antibody (FKG4.5) displayed PD (figure 4A), as did four of nine animals treated with ADC plus control IgG2 isotype treated mice. However, the combination of ADC with CD40 antibody induced 100% MCRs, significantly reducing tumor burden at the end of treatment (day 14, figure 4B) and significantly increasing mouse survival (figure 4C) compared with ADC plus control IgG2 antibody. Correlating with this robust antitumor efficacy, tumor infiltrating total and activated cytotoxic T cells were significantly increased 4 days after CD40 dosing in ADC-treated mice (figure 4D,E). Furthermore, there was an increase in CD4 T cells, macrophages and dendritic cells (DCs) in mice receiving ADC (either with IgG2 or CD40 agonist) compared with the vehicle+IgG2 control group (online supplemental figure 4D). Combination of ADC and CD40 ligation was well tolerated with mice maintaining normal body weights (online supplemental figure 4E). Finally, we also found that ADC alone or combined with anti-CD40 antibody induced long-term immunological memory protecting animals from tumor rechallenge with GPC2-low NXS2 cells in the contralateral flank after 60 days (figure 4F), a protective effect that was prolonged up to >10 weeks after tumor rechallenge (figure 4G).
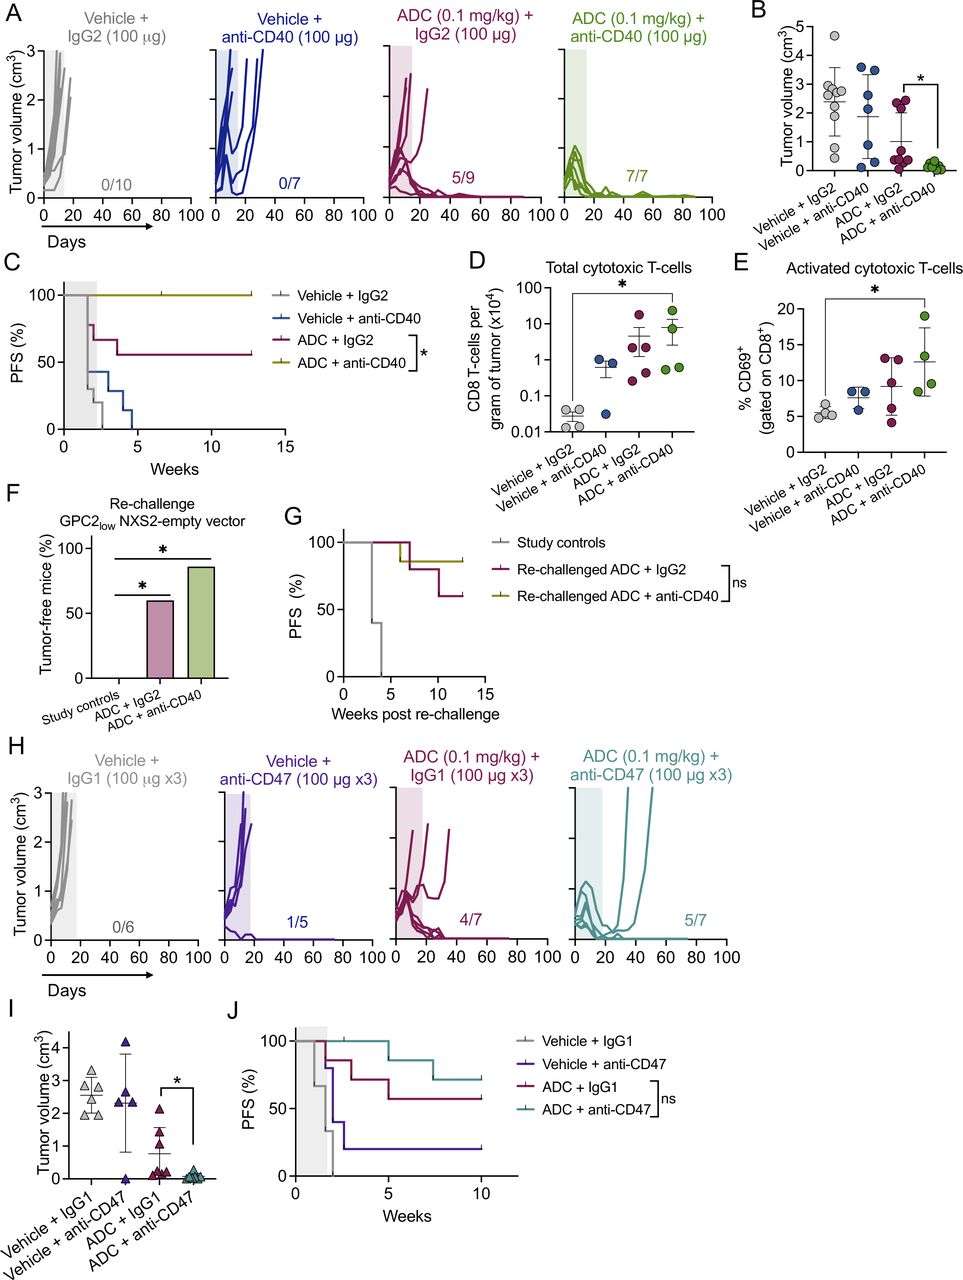
The D3-GPC2-PBD ADC enhances efficacy of macrophage-associated immunoregulators. (A) Individual tumor growth curves for the different treatment groups included in the CD40 combination study (n=7–10 mice per group). The number of MCRs is indicated. Period of antibody treatment is indicated in color frames. (B) Tumor volumes at the end of CD40 antibody treatment (day 14) for the treatment groups shown in A. Means and SDs are indicated. *P=0.0034 (Mann-Whitney t-test). (C) PFS for the different CD40 antibody study treatment cohorts shown in A. *P=0.0369 (log-rank test). (D) Total amounts of tumor-infiltrating cytotoxic T cells from ADC/CD40 treatment groups. Tumors were collected 4 days after CD40 or IgG2 dosing. Means and SDs are indicated (n=3–5 tumors per group). *P=0.028 (one-way ANOVA plus Dunn’s comparison test).(E) Percentage of activated cytotoxic T cells (CD8+/CD69+) from D. *P=0.028 (one-way ANOVA plus Dunn’s comparison test). (F) Percentage of tumor-free animals after rechallenge with GPC2-low NXS2 empty-vector cells (n=5–7 mice per group). Ten naïve A/J mice were also injected at the same time with NXS2 empty-vector cells as a control. *P=0.0012 for both (χ2 test). (G) PFS for rechallenged animals shown in F. (H) Individual tumor growth curves for the different groups included in the CD47 combination study (n=5–7 mice per group). The number of MCRs is indicated. Period of treatment is indicated in color frames. (I) Tumor volumes at the end of CD47 antibody treatment (day 18) for the treatment groups shown in H. Means and SDs are indicated. *P=0.0064 (Mann-Whitney t-test). (J) PFS of the different treatment groups shown in H. ADC, antibody–drug conjugate; ANOVA, analysis of variance; GPC2, glypican 2; MCR, maintained complete response; ns, not significant; PFS, progression-free survival.
In the GPC2 ADC/CD47 preclinical trial, almost all animals treated with vehicle plus control IgG1 or CD47 antagonist (MIAP-410) displayed PD (figure 4H). Similar to what was observed in the CD40 study, three of seven animals treated with ADC plus control IgG1 antibody also showed PD. However, the addition of CD47 blockade to ADC significantly decreased tumor burden at the end of treatment compared with ADC plus control IgG1 antibody (day 18, figure 4I), although long-term survival was similar between both ADC groups (figure 4J). Combination of ADC and CD47 antibody treatment was again well tolerated (online supplemental figure 4F).
D3-GPC2-PBD induces ICD in human neuroblastoma models and promotes tumor cell phagocytosis by macrophages
To validate our findings in syngeneic neuroblastoma tumors, we next explored the D3-GPC2-PBD ADC’s immunogenic effects in human neuroblastoma models.38 First, we used the high-GPC2 expressing human neuroblastoma cell lines NB-EbC1 and SMS-SAN that are susceptible to this ADC (IC50s=6.07±1.46 and 4.18±1.06 pM, respectively; mean±SD).6 Similar to the murine neuroblastoma cells, treatment with the D3-GPC2-PBD ADC induced markers of ICD including translocation of calreticulin to the cell surface and HMGB1 release in both human cell lines (figure 5A and online supplemental figure 5A), notably with more robust cell surface translocation of calreticulin in NB-EbC1 cells. However, in the ADC-resistant NB69 and NB-SD neuroblastoma cells,21 ADC treatment showed no increased translocation of calreticulin to the cell surface (online supplemental figure 5B).
Supplemental material

The D3-GPC2-PBD ADC induces human neuroblastoma cell immunogenicity and promotes macrophage-driven tumor cell phagocytosis. (A) Membrane expression of calreticulin in NB-EbC1 and SMS-SAN cells after treatment with vehicle or GPC2 ADC (6–150 ng/mL) for 72–96 hours. Means and SDs of calreticulin MFI are indicated from two different experiments. *P=0.020, **P=0.049 (two-way ANOVA plus Šídák’s multiple comparisons test). (B) Representative contour plots of flow cytometry-based phagocytosis assay for NB-EbC1-GFP and SMS-SAN-GFP cells treated with vehicle or GPC2 ADC (0.15 ng/mL) and cocultured with macrophages for 24 hours. Box indicates GFP+/CD11b+ macrophages. (C) Quantification of GPC2 ADC and vehicle-treated NB-EbC1-GFP and SMS-SAN-GFP cell phagocytosis using two different macrophage donors. Means and SDs are indicated (n=5–6 per experimental condition). *P=0.004 (Mann-Whitney t-test). (D) (left, donor 3) Quantification of NB-EbC1-GFP cell phagocytosis after treatment with GPC2 ADC (0.15 ng/mL), GPC2-Fab (×1000 equimolar excess)+GPC2 ADC (0.15 ng/mL), equimolar free PBD or vehicle. Means and SDs are indicated (n=6 per experimental condition). *P<0.0001 (one-way ANOVA plus Tukey’s comparisons test). (Right, donor 4) Quantification of NB-EbC1-GFP cell phagocytosis after treatment with GPC2 or control ADC (0.15 ng/mL). Means and SDs are indicated (n=6 per experimental condition). *P=0.026 (Mann-Whitney t-test). (E) Representative CD40 flow cytometry histograms of GFP-positive macrophages cultured alone or with ADC or vehicle-treated neuroblastoma cells (NB-EbC1 and SMS-SAN, left) with CD40 MFI quantification plot (right, n=5–6). CD40 MFI is represented with means and SDs.*P=0.007 (Mann-Whitney t-test). (F) RNA-sequencing data of negative regulators of phagocytosis in SMS-SAN and NB-EbC1 neuroblastoma cells.28 *P=0.0003 (Wilcoxon paired t-test). CD47 indicated in maroon. MΦ, macrophage; ADC, antibody–drug conjugate; ANOVA, analysis of variance; GPC2, glypican 2; MFI, mean fluorescence intensity; ns, not significant; PBD, pyrrolobenzodiazepine.
Considering that cell surface translocation of calreticulin can act as an ‘eat-me signal’ for phagocytes,39 we next studied whether ADC treatment of these human neuroblastoma cells might enhance tumor phagocytosis by macrophages. Treatment of NB-EbC1 cells with 0.15 ng/mL of ADC for 96 hours significantly increased phagocytosis versus vehicle-treated cells (figure 5B,C, and online supplemental figure 5C). However, ADC treatment did not increase phagocytic clearance of SMS-SAN cells, which also showed dramatically lower levels of basal phagocytosis compared with NB-EbC1 cells across two unique macrophage donors (figure 5C), correlating with the lower level of calreticulin translocation in these cells. To further validate the GPC2 and ADC dependence of this enhanced phagocytosis in NB-EbC1 cells, we next showed that macrophage engulfment was impaired when (1) GPC2 was blocked with incubation with a D3-GPC2-Fab before ADC treatment; (2) free PBD was used at ADC equimolar concentrations; or (3) cells were treated with control ADC AB1-SARS-CoV-2-PBD (figure 5D). Next, to determine whether phagocyting GFP+ macrophages were polarized to a proinflammatory antitumor state, we also quantified macrophage CD40 expression from these cocultures and found that the macrophages cocultured with ADC-treated NB-EbC1 cells (but not SMS-SAN cells) had a significantly higher level of CD40 expression compared with cocultures with vehicle-treated cells (figure 5E). Finally, to further explain differences in phagocytosis between these neuroblastoma cell lines, we analyzed RNA expression28 of previously identified ‘antiphagocytosis’ genes29 and observed significantly higher expression of this gene panel in SMS-SAN compared with NB-EbC1 cells (figure 5F), including the macrophage inhibitory checkpoint gene CD47.40
CD47 blockade enhances D3-GPC2-PBD-mediated phagocytosis and leads to potent antitumor effects in neuroblastoma PDX models
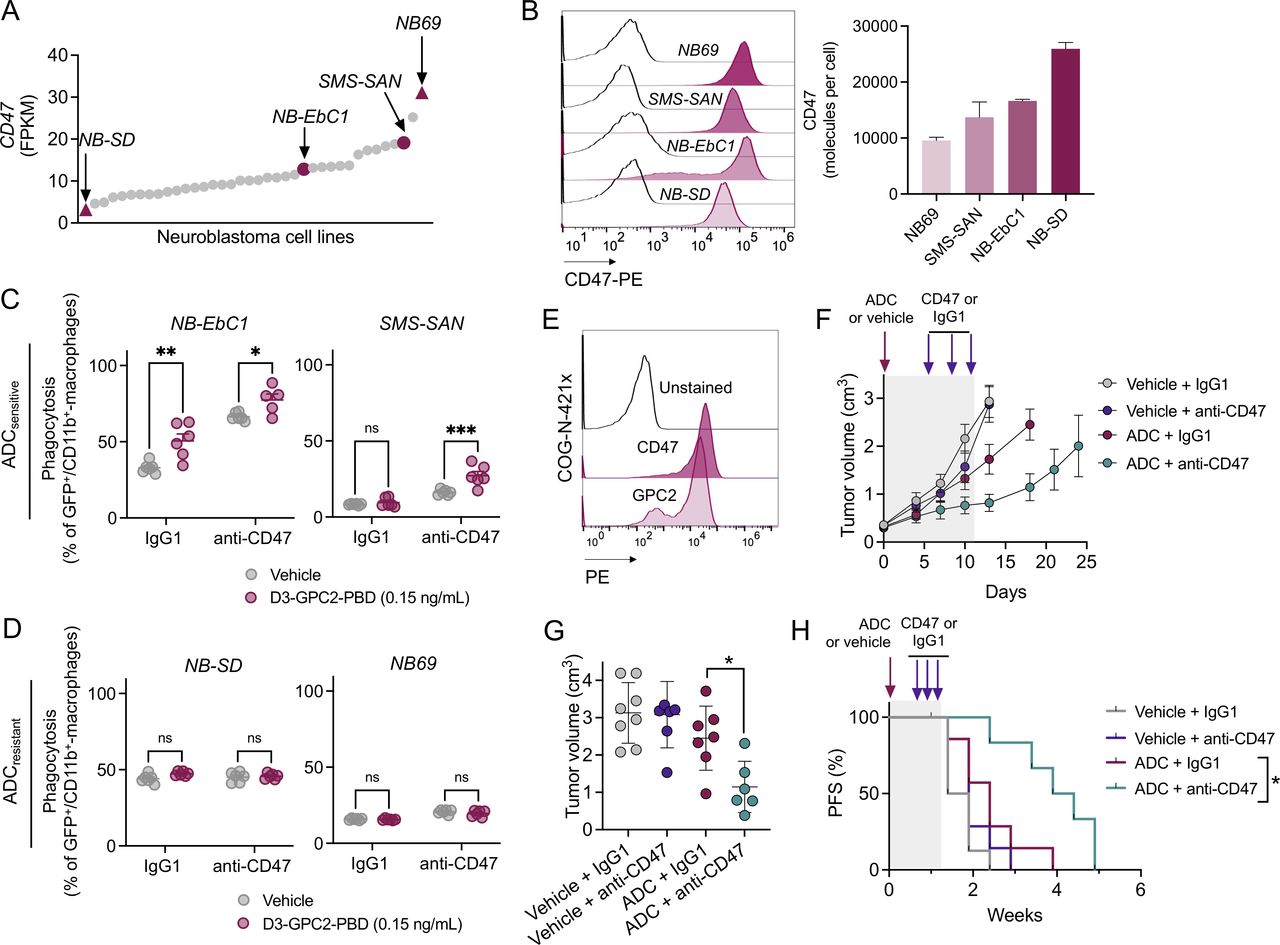
CD47 is broadly expressed in human neuroblastoma cell lines (11.5±0.7 FPKM, mean±SD; figure 6A) and RNA levels correlate with cell surface abundance (figure 6B). Thus, we next explored whether CD47 blockade could enhance ADC-mediated phagocytosis in human neuroblastoma cells with (1) different levels of CD47 expression (figure 6A,B) and (2) different GPC2 ADC susceptibility (NB-Ebc1 and SMS-SAN cells (GPC2 ADCsensitive), and NB-SD and NB69 (GPC2 ADCresistant)).21 Treatment with the D3-GPC2-PBD ADC significantly increased NB-EbC1 phagocytosis in both IgG1 and CD47 antibody cohorts, whereas in SMS-SAN cells, only cotreatment with ADC plus CD47 blockade promoted any substantial phagocytosis using two different macrophage donors (figure 6C and online supplemental figure 6A). However, no changes in ADC-induced phagocytosis were observed in the GPC2 ADCresistant NB-SD or NB69 cell lines, with or without concurrent CD47 blockade (figure 6D).
Supplemental material
CD47 blockade enhances D3-GPC2-PBD-mediated tumor cell phagocytosis in vitro and antitumor efficacy in vivo. (A) CD47 expression in neuroblastoma cell lines.28 ADC-resistant (NB-SD and NB69) and ADC-sensitive (SMS-SAN and NB-EbC1) cell lines are highlighted with maroon triangles and circles, respectively. (B) Representative CD47 flow cytometry histograms of the four representative neuroblastoma cell lines (left) and relative quantification of cell surface CD47 (molecules per cell, right). CD47 surface expression was measured in two independent experiments (means and SDs are shown). (C, D) Percentage of phagocytosis in NB-EbC1 and SMS-SAN (ADCsensitive, C), and NB69 and NB-SD (ADCresistant, D) cell lines after vehicle or ADC treatment and coculturing with macrophages (donor 1) and either control IgG1 or anti-CD47 antibodies. *P=0.048, **P=0.001, ***P=0.0001 (2-way ANOVA plus Šídák’s multiple comparisons test). (E) CD47 and GPC2 cell surface expression in the neuroblastoma COG-N-421x PDX. (F) PDX tumor growth after treatment with the GPC2 ADC versus vehicle combined with either control IgG1 or CD47 antibody. Means and SEMs are represented (n=7–8 mice per group). Period of treatment is indicated in gray frame. (G) Tumor volumes for treatment groups in F 1 week after the end of antibody treatment (day 18). Means and SDs are represented. *P=0.0140 (Mann-Whitney t-test). (H) PFS for the different treatment groups shown in F. Period of treatment is indicated in gray frame. *P=0.0121 (log-rank test). ADC, antibody–drug conjugate; GPC2, glypican 2; ns, not significant; PFS, progression-free survival.
Finally, we evaluated whether the D3-GPC2-PBD ADC could also enhance efficacy of CD47 blockade in vivo using the neuroblastoma PDX model COG-N-421x that expresses high levels of cell surface GPC2 and CD47 (figure 6E). We used 0.25 mg/kg of ADC based on our previous data indicating modest antitumor effects at this dose as a single agent7 in NSG mice, which lack functional B, T and NK cells but preserve macrophages with intact phagocytic properties.41 Treatment with D3-GPC2-PBD ADC plus CD47 antibody (B6.H12) showed increased tumor control and significantly decreased tumor burden compared with ADC plus control IgG1 at the end of antibody treatment (day 18; figure 6F,G, and online supplemental figure 6B) and significantly extended animal survival compared with GPC2 ADC treatment alone (figure 6H), without any measurable changes in mice body weights (online supplemental figure 6C).
Discussion
In this study, we explored the immune-related therapeutic properties of the D3-GPC2-PBD ADC by (1) elucidating its induction of ICD in vitro and in vivo in both human and syngeneic neuroblastoma models, (2) identifying critical components of the host immune system that are activated and infiltrate GPC2 ADC-treated tumors to enable (3) testing of rationally designed ADC-based combination therapeutic strategies.
While PBD containing ADCs have shown robust efficacy in preclinical studies, their therapeutic index in humans may be narrow.42 Thus, one of the main objectives of this work was to examine the effects of clinically achievable doses of the D3-GPC2-PBD ADC on neuroblastoma immunogenicity. Our vaccination studies demonstrate that subcutaneous injection of NXS2-GPC2 cells pretreated with very low ADC concentrations was able to protect hosts from tumor rechallenge. This experimental approach could simulate a clinical scenario in which lower intratumoral drug concentrations of ADC would be sufficient to prompt the development of host adaptive antitumor immunity protecting patients against subsequent tumor relapses. This may be analogous to other in situ vaccine approaches,43 including the induction of adaptive immunity by localized radiotherapy.44 Notably, vaccination with ADC-treated GPC2-expressing NXS2 cells protected mice from subsequent tumor rechallenge, even with GPC2-low NXS2 cells. A similar level of protection occurred when GPC2-low NXS2 cells were used to rechallenge mice that completely responded to systemic therapy with low doses of ADC. This adaptive immunity primed against neuroblastoma cell targets other than GPC2 has the capability to overcome the development of immune escape mechanisms such as target downregulation or antigen heterogeneity, which are common predictors of ADC failure in the clinical setting.45
The characterization of the neuroblastoma TIME after ADC treatment also provided insight into the immunomodulatory properties of the D3-GPC2-PBD ADC relying on the activation of a diverse array of antitumor immune cascades. For example, in our cytokine and chemokine profiling study, the T cell-recruiting CXCL16 cytokine was the most upregulated protein after GPC2 ADC treatment, likely explaining the enhanced infiltration of activated cytotoxic T cells observed in ADC-treated tumors.46 These data were further validated with the impaired GPC2 ADC antitumor efficacy we observed when blocking cytotoxic T cells in vivo. Furthermore, by using CyTOF, we found that the GPC2 ADC increased tumor infiltration of a diverse set of CD40-expressing immune cells, including activated macrophages, mature DCs, and B cells. These findings, taken together with the ADC-induced CD40 upregulation observed in our bulk RNA and protein analyses, suggested that CD40 agonism might increase the potency of this GPC2 ADC. Thus, it was not surprising that we observed that ADC plus the FKG4.5 agonistic CD40 antibody induced maintained complete tumor responses in all treated mice. Mechanistically, CD40 agonism has been shown to redirect bone marrow CCR2+ monocytes into tumors through secretion of CCL2.47 These data may be relevant to understand the potent antitumor effects of the D3-GPC2-PBD GPC2 ADC combined with CD40 agonists in our studies, as murine cytokines CCL2 and CCL12 (a more potent ligand of CCR2 with higher homology to human CCL2)36 48 were significantly upregulated after a single dose of GPC2 ADC and likely mobilized proinflammatory monocytes into the tumor bed even before CD40 ligation.
The role of macrophages in cancer is dichotomous; they can promote tumor proliferation but also act as potent antitumor immune effector cells on proper stimulation.49 Antitumor properties of activated macrophages rely on their phagocytic properties that can also enhance antigen cross-presentation that results in more efficient antitumor T-cell priming.40 50 Previous studies have shown that neuroblastoma cells can be effectively phagocytosed when treated with GM-CSF51 or by blocking the macrophage immune checkpoint (or ‘don’t-eat-me’ signal) CD47 and its ligand SIRPα.52 53 In our study, differences in ADC-mediated phagocytosis between human cellular models occurred. NB-EbC1 cells, which highly upregulated cell surface calreticulin after ADC exposure, were efficiently phagocyted after treatment with ADC; however, this effect was not observed in SMS-SAN cells, which had more modest ADC-induced calreticulin translocation. These differences could also be in part explained by the differential expression of a panel of inhibitory macrophage checkpoint genes29 between these cell lines, including the macrophage checkpoint CD47. Considering these data, it was not surprising that adding CD47 blockade made ADC-treated SMS-SAN cells more sensitive to macrophage-induced phagocytosis. In contrast, neuroblastoma cells resistant to ADC, either due to low GPC2 expression (NB69) or intrinsic resistance to the PBD payload (NB-SD),21 were not differentially phagocytosed, suggesting that both immunogenic stimuli and CD47 blockade are required to enhance tumor macrophage engulfment. Most importantly, CD47 blockade with high-affinity antihuman CD47 antagonists also increased the antitumor effects of low doses of ADC in clinically relevant human PDX models in NSG mice, which lack B, T and NK cells but preserve functional phagocytic cells.41
We previously reported PBD along with other DNA binding payloads (eg, PNU-159682) as the most effective warheads against neuroblastoma cells in a large in vitro drug screen.21 Thus, future studies should address whether other GPC2-targeted ADCs prioritized based on these data could similarly modulate the TIME and enhance efficacy of other immunoregulators. Importantly, since CD40 agonists and CD47 antagonists have shown some clinically relevant adverse effects in recent clinical trials,54 55 careful and rigorous monitoring of potential toxicities such as severe anemias (with ADC/CD47) and cytokine release syndrome (with ADC/CD40) will be important in both additional preclinical studies using the required animal species and early-phase human clinical trials testing these respective drug combinations.
In summary, we demonstrated that the D3-GPC2-PBD ADC induces ICD in GPC2-expressing neuroblastoma cells susceptible to ADC cytotoxicity, resulting in reprograming of the neuroblastoma TIME that facilitates potent and sustained antitumor effects when rationally combined with macrophage-stimulating immunotherapies.
Supplemental material
Data availability statement
All data relevant to the study are included in the article or uploaded as supplementary information.
Ethics statements
Patient consent for publication
Ethics approval
Not applicable.
Acknowledgments
We thank the DNA sequencing, human immunology, and cytometry by time of flight (CyTOF) core laboratory facilities at the University of Pennsylvania for their work on plasmid verification, human monocyte isolation, and mass spectrometry analysis, respectively. We also thank the pathology and small animal imaging facility cores at the Children’s Hospital of Philadelphia. Additionally, we appreciate the Cancer Genomics Laboratory at Sidney Kimmel Cancer Center (Thomas Jefferson University) for their work on RNA-sequencing. Finally, we thank Drs Takuya Ohtani, Allie Greenplate, and Divij Mathew for their technical advice on CyTOF studies.
References
Supplementary materials
Supplementary Data
This web only file has been produced by the BMJ Publishing Group from an electronic file supplied by the author(s) and has not been edited for content.
Footnotes
BM, RS and SNB contributed equally.
Contributors Conceptualization, funding acquisition and writing (original draft): GP-P and KRB. Methodology: GP-P, DVZ, SS, AKE, DSD, PMS, and KRB. Investigation: GP-P, SNB, BM, AMG, and KRB. Formal analysis: GP-P, RS, LG-G, and KRB. Visualization: GP-P, PMS, and KRB. Resources: DM, DSD, PMS, and KRB. Supervision: KRB. Writing (review and editing): all authors. Guarantor: KRB.
Funding KRB is a Damon Runyon physician-scientist supported (in part) by the Damon Runyon Cancer Research Foundation (PST-07-16). This work was supported in part by a St. Baldrick’s-Stand Up to Cancer Dream Team Translational Research Grant (SU2C-AACR-DT 27-17). Stand Up to Cancer is a division of the Entertainment Industry Foundation. Research grants were administered by the American Association for Cancer Research, the Scientific Partner of SU2C (DSD, PMS, and KRB). This work was also supported by the Alex's Lemonade Stand Foundation (GPP and KRB), by National Cancer Institute K08 CA230223 (KRB) and U54 CA232568 (PMS and KRB), the EVAN Foundation (KRB), Solving Kids' Cancer (KRB), Fishin’ For The Cure (KRB), Pierce Phillips Charity (KRB), Catherine Elizabeth Blair Memorial Foundation (KRB), and the Ronan Thompson Foundation (KRB).
Competing interests GPP, DVZ, DSD, and KRB hold patents for the discovery and development of immunotherapies for cancer, including patents related to GPC2-directed immunotherapies. KRB received research funding from Tmunity for research on GPC2-directed immunotherapies. The other authors declare no potential conflicts of interest.
Provenance and peer review Not commissioned; externally peer reviewed.
Supplemental material This content has been supplied by the author(s). It has not been vetted by BMJ Publishing Group Limited (BMJ) and may not have been peer-reviewed. Any opinions or recommendations discussed are solely those of the author(s) and are not endorsed by BMJ. BMJ disclaims all liability and responsibility arising from any reliance placed on the content. Where the content includes any translated material, BMJ does not warrant the accuracy and reliability of the translations (including but not limited to local regulations, clinical guidelines, terminology, drug names and drug dosages), and is not responsible for any error and/or omissions arising from translation and adaptation or otherwise.