Article Text

Abstract
Background Leukemia-associated macrophages (LAMs) represent an important cell population within the tumor microenvironment, but little is known about the phenotype, function, and plasticity of these cells. The present study provides an extensive characterization of macrophages in patients with acute myeloid leukemia (AML).
Methods The phenotype and expression of coregulatory markers were assessed on bone marrow (BM)-derived LAM populations, using multiparametric flow cytometry. BM and blood aspirates were obtained from patients with newly diagnosed acute myeloid leukemia (pAML, n=59), patients in long-term remission (lrAML, n=8), patients with relapsed acute myeloid leukemia (rAML, n=7) and monocyte-derived macrophages of the blood from healthy donors (HD, n=17). LAM subpopulations were correlated with clinical parameters. Using a blocking anti-T-cell immunoreceptor with Ig and ITIM domains (TIGIT) antibody or mouse IgG2α isotype control, we investigated polarization, secretion of cytokines, and phagocytosis on LAMs and healthy monocyte-derived macrophages in vitro.
Results In pAML and rAML, M1 LAMs were reduced and the predominant macrophage population consisted of immunosuppressive M2 LAMs defined by expression of CD163, CD204, CD206, and CD86. M2 LAMs in active AML highly expressed inhibitory receptors such as TIGIT, T-cell immunoglobulin and mucin-domain containing-3 protein (TIM-3), and lymphocyte-activation gene 3 (LAG-3). High expression of CD163 was associated with a poor overall survival (OS). In addition, increased frequencies of TIGIT+ M2 LAMs were associated with an intermediate or adverse risk according to the European Leukemia Network criteria and the FLT3 ITD mutation. In vitro blockade of TIGIT shifted the polarization of primary LAMs or peripheral blood-derived M2 macrophages toward the M1 phenotype and increased secretion of M1-associated cytokines and chemokines. Moreover, the blockade of TIGIT augmented the anti-CD47-mediated phagocytosis of AML cell lines and primary AML cells.
Conclusion Our findings suggest that immunosuppressive TIGIT+ M2 LAMs can be redirected into an efficient effector population that may be of direct clinical relevance in the near future.
- Tumor Escape
- Macrophages
- Costimulatory and Inhibitory T-Cell Receptors
- Hematologic Neoplasms
- Metabolic Networks and Pathways
Data availability statement
Data are available on reasonable request. The datasets used and/or analyzed during the current study are available from the corresponding authors on reasonable request (f.brauneck{at}uke.de).
This is an open access article distributed in accordance with the Creative Commons Attribution Non Commercial (CC BY-NC 4.0) license, which permits others to distribute, remix, adapt, build upon this work non-commercially, and license their derivative works on different terms, provided the original work is properly cited, appropriate credit is given, any changes made indicated, and the use is non-commercial. See http://creativecommons.org/licenses/by-nc/4.0/.
Statistics from Altmetric.com
- Tumor Escape
- Macrophages
- Costimulatory and Inhibitory T-Cell Receptors
- Hematologic Neoplasms
- Metabolic Networks and Pathways
WHAT IS ALREADY KNOWN ON THIS TOPIC
M2 macrophages are associated with an unfavorable prognosis in different solid tumor entities.
WHAT THIS STUDY ADDS
This study revealed an increased frequency of bone marrow-infiltrating immunosuppressive M2 macrophages expressing T-cell immunoreceptor with Ig and ITIM domains (TIGIT), T-cell immunoglobulin and mucin-domain containing-3 protein (TIM-3), and lymphocyte-activation gene 3 (LAG-3) in newly diagnosed and relapsed acute myeloid leukemia (AML). Blockade of TIGIT repolarized M2 into inflammatory M1 macrophages and increased cytokine secretion and CD47-mediated phagocytosis.
HOW THIS STUDY MIGHT AFFECT RESEARCH, PRACTICE OR POLICY
As blocking antibodies against CD47 and TIGIT are already tested in clinical studies, combined blockade for patients with AML could be investigated in clinical trials.
Background
Macrophage-directed immunotherapy has entered the clinical arena of acute myeloid leukemia (AML).1 2 Inhibition of the ‘don’t eat me’ receptor signal regulatory protein α (SIRPα) on macrophages or its ligand cluster of differentiation (CD) 47 expressed by AML cells induced antileukemic phagocytosis in preclinical and clinical studies.2–4 In this study, we performed a phenotypical characterization and expression analyses of inhibitory receptors expressed by macrophages with the aim to identify further suitable targets for boosting macrophage-mediated cytotoxicity in AML.
Basically, macrophages can be divided into two major subgroups: classically activated (M1) macrophages that are stimulated by interferon gamma (IFN-γ), tumor necrosis factor alpha (TNF-α), and granulocyte–macrophage colony-stimulating factor (GM-CSF).5 Due to their capacity for antigen presentation, phagocytosis, cytotoxicity, and elicitation of T-helper 1 responses by secretion of interleukin (IL)-12, IL-1β, IL-6, TNF-α, and C-X-C motif chemokine 10, M1 macrophages are considered as antitumoral effectors.6–9 Alternatively activated (M2) macrophages are induced by IL-4 and IL-13. This subpopulation secretes high levels of anti-inflammatory molecules including IL-10, IL-4, arginase, and transforming growth factor-β (TGF-β), as well as vascular endothelial growth factor (VEGF)-C and VEGF-A, thereby protecting tumor cells from apoptosis and promoting angiogenesis and lymphangiogenesis.10–12
Following the recent discovery of T-cell immunoglobulin and mucin-domain containing-3 protein (TIM-3) expression also on macrophages, we wondered whether other coinhibitory receptors (CIRs) that have shown relevance for immunosuppression of patients with AML are also expressed on leukemia-associated macrophages (LAMs). Beside TIM-3, we and others showed that the T-cell immunoreceptor with Ig and ITIM domains (TIGIT), its counter-receptor CD226, and the lymphocyte-activation gene 3 (LAG-3) are involved in the regulation of anti-AML immunity.13–16
Due to the macrophage plasticity in response to environmental stimuli, a variety of M1 and M2 subtypes have been described.17 This study aims to characterize the two ends of the spectrum: the inflammatory and anti-inflammatory bone marrow (BM)-derived LAMs in newly diagnosed acute myeloid leukemia (pAML), relapsed acute myeloid leukemia (rAML) and AML in long-term remission (lrAML). In addition, the effects induced by a TIGIT blockade on phenotype, cytokine secretion, and phagocytosis are assessed.
Methods
Clinical cohorts
Peripheral blood (PB) and BM aspirates were collected from patients with newly diagnosed non-acute promyelocytic leukemia (pAML, n=59), acute myeloid leukemia in long-term remission (lrAML, n=8) and from patients with an AML relapse (rAML, n=7) and compared with PB specimens from age-matched healthy donors (HDs, n=17). Details of the clinical parameters are listed in online supplemental table 2.
Supplemental material
To evaluate the prognostic impact of CD163, CD204, or CD206, three additional AML patient cohorts from The Cancer Genome Atlas (TCGA LAML), and the Gene Expression Omnibus Series (GSE37642, and GSE12417) were analyzed. Further details and the statistical applications used are described in the online supplemental methods 2.
Multiparametric flow cytometry (MFC)
For MFC, cryopreserved or fresh mononuclear cells of patients with CD117+CD34+ AML and PB-derived mononuclear cells from HDs were used. Cells were stained with the LIVE/DEAD Fixable Near-IR dye (Thermo Fisher) for exclusion of dead cells and incubated with appropriate fluorochrome-conjugated antibodies (online supplemental table 1). For intracellular staining, the cells were permeabilized using the FOXP3 Fixation/Permeabilization Buffer Set (eBioscience) according to the manufacturer’s instructions. Compensation controls were measured using single-stained Comp Beads (BD Biosciences). All samples were run on a BD FACSymphony V.A3 with FACS Diva V.8 (BD Biosciences). Statistical analyses are described in the online supplemental methods 3.
T-distributed stochastic neighbor embedding (tSNE) analyses
As previously described,18 a subset of 3000 cells was selected for each donor at random and merged into a single expression matrix prior to tSNE analysis. Intensities for markers of interest were analyzed plotting each event by its tSNE dimensions (see detailed description in online supplemental methods 4).
TIGIT-dependent repolarization of CD14+CD68+ LAMs
The TIGIT-dependent phenotype repolarization was performed using PB-derived cells from HDs (n=4). At day 0, after control staining via MFC for baseline distribution of monocyte subpopulations, differentiation of isolated CD14+ monocytes to macrophages was initiated by addition of 50 ng/mL M-CSF, 20 ng/mL IL-4, and 10 ng/mL IL-10 (all R&D Systems). After 6 days, PB-derived macrophages were stained with 19 nM CellTracker red CMFDA Dye (CTred, ThermoFisher), and the viability and frequency of M1 and M2 CD68+CD14+ macrophages were verified by MFC. Cells were plated in 96-well plates (1×10⁶ cells/mL) in cell culture medium and incubated with 50 µg/mL anti-TIGIT antibody (Ultra-LEAF-Purified anti-human-TIGIT, Clone: A15153G; BioLegend) or isotype control (Ultra-LEAF-Purified mouse IgG2a, k Isotype Control, Clone: MOPC-173; BioLegend). After 24 hours, viability, repolarization, and coregulatory receptor expression were assessed by MFC.
In addition, fresh mononuclear cells were isolated from the PB of patients with newly diagnosed CD117+CD34+ AML (n=7), plated (1×10⁶ cells/mL) and incubated with 50 µg/mL anti-TIGIT antibody or IgG2α isotype control. The differentiation of LAMs was assessed over 72 hours by MFC using the panels described in online supplemental table 1 and online supplemental methods 3.
Cytokine detection
Bead-based multiplex analyses (Legendplex, BioLegend) were applied to measure the cytokines of macrophages supernatants. Using the previously described negative bead isolation kit, CD14+ macrophages derived from the BM of patients with pAML (n=10) were isolated and plated (1×10⁶ cells/mL) in triplicates. After 24 hours of treatment with either 50 µg/mL anti-TIGIT antibody or isotype control, cytokine profiles were stained and analyzed using MFC and LEGENDplex Data Analyses Software.
Allogeneic cellular phagocytosis in vitro
The phagocytosis assay was performed using fresh mononuclear cells isolated from the PB of HDs. Monocytes were cultured for polarization into M2 macrophages according to the protocol described above. CTred stained M2 cells were incubated with 50 µg/mL blocking anti-TIGIT or isotype control. After 24 hours treatment, M2 status was rechecked and macrophages were co-cultured with heat shock pretreated apoptotic AML cells (online supplemental methods 1). These cells expressed CD47 (online supplemental methods 1) and were previously labeled with 140 nM CellTracker green CMFDA (CTgreen, ThermoFisher) at a 1:1 E:T ratio. After 4 hours at 37°C in the presence or absence of 10 µg/mL anti-CD47 antibody (Ultra-LEAF-Purified anti-human-CD47, Clone: CC2C6, BioLegend) or IgG1α control monoclonal antibody (mAb) (Ultra-LEAF-Purified Mouse IgG1, k Isotype Control, Clone: MOPC-21, BioLegend) phagocytosis was calculated as the frequency of double positive (CTgreen and CTred) cells by MFC. Additionally, in an independent phagocytosis assay, macrophages (n=4) and AML cells (MOLM-13, MV4-11) were plated in chamber slides, and phagocytosis was analyzed after 4 hours by microscopy via the pappenheim method or using epifluorescence microscopy images.
Autologous cellular phagocytosis in vitro
To further test the phagocytosis of primary AML specimens, BM-derived mononuclear cells from CD117+CD14− patients with AML were stained at day 0 for the M2/M1 distribution and CD117+ expression. Mononuclear cells with a high frequency of M2 LAMs were incubated with 50 µg/mL blocking anti-TIGIT mAb or isotype control for 24 hours, followed by the addition of 10 µg/mL of the anti-CD47 antibody or the IgG1α control for another 4 hours. Phagocytosis was calculated as the frequency of double-positive CD117 and CD14 cells.
Results
BM LAMs display a shift toward an immunosuppressive M2 phenotype in AML
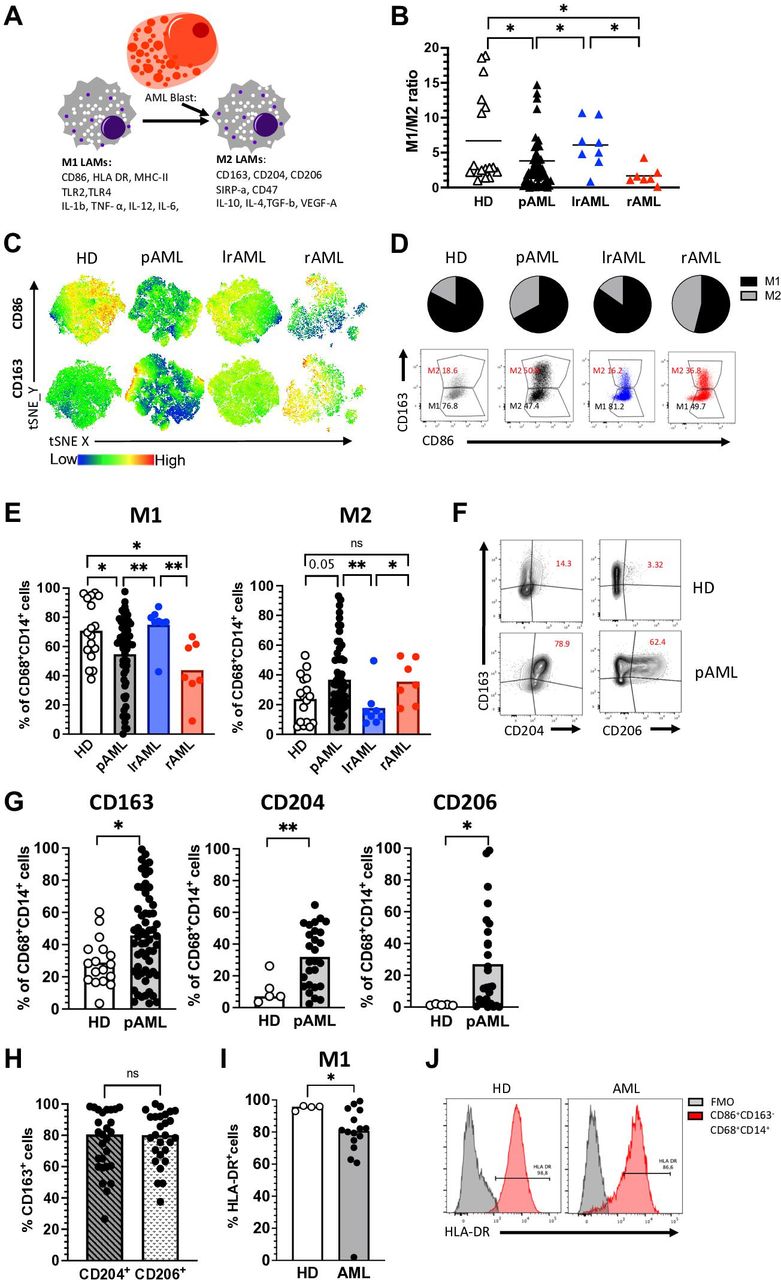
Tumor-associated macrophages can be categorized into functional subtypes. Classical M1 macrophages mediate antitumor cytotoxicity, whereas immunosuppressive M2 macrophages cause inhibition of T-cell cytotoxicity and promotion of angiogenesis (figure 1A). We therefore investigated the phenotype of BM-infiltrating LAMs from patients with pAML (n=59) and rAML (rAML n=7) before the start of intensive chemotherapy. In addition, we examined macrophages and monocyte-derived macrophages from the BM of patients with AML in long-term remission (lrAML n=8) and from the PB of age-matched HDs (n=17). Details of the clinical parameters are listed in online supplemental table 2. In line with published data,17 CD86, CD68 and CD14 coexpressing macrophages were classified into M1 (CD86+CD163−) phenotype and CD163, CD86, CD68 and CD14 coexpressing cells as M2 (CD163+CD86+) phenotype (for detailed gating strategy, see online supplemental figure 1 and 211).

LAMs display a shift into an immunosuppressive M2 phenotype. (A) Characteristics of M1 and M2 LAMs. (B–H) Multiparametric flow cytometry of the coexpression of CD86 and CD163 on CD14+CD68+ LAMS was performed for BM aspirates from patients with pAML (n=59), patients in lrAML (n=8), patients with rAML (n=7) and PB-derived macrophages from HDs (n=17). (B) The M1:M2 ratio is depicted for each donor. (C) tSNE analyses showing the distribution of CD86+ and CD163+ cells within the total CD14+CD68+ macrophages in BM aspirates from five patients with pAML, lrAML, rAML and PB-derived CD14+CD68+ macrophages of HDs, respectively. (D) Pie charts and exemplary flow plots illustrate the distribution of M1 and M2 macrophages in all four cohorts. (E) Summary data show the frequency of CD86+CD163− (M1) and CD163+CD86+ (M2) cells among CD14+CD68+ macrophages from patients with pAML, lrAML, rAML and HDs. (F) Exemplary flow plots display the coexpression of CD204 and CD206 with CD163 in HDs and patients with pAML. (G) Summary data show the frequency of CD163, CD204 and CD206 in patients with pAML (n=27) and HDs (n=5). (H) Summary data demonstrate the coexpression of CD163 with CD204 and CD206 in pAML. (I) Summary data show the frequency of human leukocyte antigen (HLA)-DR on M1 (CD86+CD163−CD14+CD68+) macrophages from HDs (n=4) and patients with pAML (n=16). (J) Exemplary histograms show the coexpression of HLA-DR on M1 (CD86+CD163−CD14+CD68+) macrophages in comparison to the control. Frequencies are displayed with the means. P values were obtained by analysis of variance, Kruskal-Wallis test and Mann-Whitney test. *P<0.05, **P<0.01. AML, acute myeloid leukemia; BM, bone marrow; FMO, fluorescence minus one; HD, healthy donor; IL, interleukin; lrAML, acute myeloid leukemia in long-term remission; LAM, leukemia-associated macrophage; ns, not significant; pAML, newly diagnosed acute myeloid leukemia; PB, peripheral blood; rAML, relapsed acute myeloid leukemia; TNF-α, tumor necrosis factor alpha; tSNE, t-distributed stochastic neighbor embedding; VEGF-A, vascular endothelial growth factor A.
Our analyses revealed a significantly altered ratio of M1:M2 macrophages in the BM of patients with pAML or rAML in comparison to HDs (p=0.03, p=0.01) and patients in remission (p=0.01, p=0.01; figure 1B). As illustrated in the tSNE analysis (figure 1C), pie charts and exemplary flow plots (figure 1D), BM-derived M1 LAMs were found to be decreased, whereas the frequency of M2 LAMs was increased in the BM of patients with pAML compared with HDs (p=0.05) and also in pAML and rAML in comparison with lrAML (p=0.005, p=0.01; figure 1E).
Since additional receptors besides CD163 have been described for the phenotyping of M2 and M1 macrophages, we compared the expression of the scavenger receptor CD204 and the mannose receptor-1 CD206 with that of CD163 on CD68+CD14+ macrophages between HDs (n=5) and patients with pAML (n=27). All three receptors were more frequently expressed in pAML than in HDs (p=0.01, p=0.02, p=0.02; figure 1F, G). Subsequent analyses showed that the majority of CD204+ and CD206+ LAMs coexpressed CD163 (figure 1H). To further validate our phenotypical definition of M1 (CD86+CD163−) macrophages, we assessed the coexpression of the MHC class II surface receptor human leukocyte antigen (HLA)-DR as additional marker of inflammatory M1 macrophages.19 HLA-DR and CD86 were largely coexpressed by CD163−CD68+CD14+ macrophages from HDs (n=4) and patients with pAML (n=16) with a slightly reduced frequency in the AML group (figure 1I, J).
Furthermore, we compared the frequencies of M1/M2 LAMs in the PB and BM in five additional patients with pAML, rAML and in lrAML, respectively. For all three groups, we observed no significant difference of the M1 and M2 cell population size between paired specimens of the PB and BM (online supplemental figure 3A, B). Therefore, we used PB of HD as a control for AML samples. In summary, our analyses showed an increased frequency of M2 receptor-expressing (CD163, CD204, and CD206) LAMs in the BM of patients with active AML disease.
CIRs are upregulated on M2 LAMs in active AML
CIR expression is a characteristic feature of altered T-cell functionality.20 We and others previously showed that also cells of the innate immune system including natural killer (NK) cells highly express inhibitory receptors in the context of AML.18 Therefore, we assessed the expression of TIGIT, TIM-3 and LAG-3 on CD14+CD68+ LAMs from patients with pAML (n=53), lrAML (n=8), rAML (n=7) and HDs (n=17). CD226 expression analyses were performed on macrophages from patients with pAML (n=29), lrAML (n=8), rAML (n=7) and HDs (n=13). For the gating, see online supplemental figure 4. Using unbiased tSNE analyses and manual gating, our analyses revealed that the frequencies of TIGIT+ and LAG-3+ LAMs were significantly increased in pAML and rAML in comparison to monocyte-derived macrophages of HDs (p<0.0001, p=0.02 and p=0.0006, p=0.0003; figure 2A,B). In comparison with patients in remission, patients with pAML and rAML displayed higher frequencies of TIM-3+ and LAG-3+ LAMs (p=0.03, p=0.067 and p=0.08, p=0.047; figure 2A,B). The stimulatory receptor CD226 was less frequently expressed by LAMs from all three patient groups (pAML, rAML and lrAML) in comparison to HDs (figure 2A,B). Interestingly, TIM-3 and LAG-3 were more frequently and with a higher median fluorescence intensity (MFI) expressed by macrophages than by their corresponding CD3+ T cells in patient with active AML (online supplemental figure 5A, B). TIGIT was less frequently expressed by LAMs than by their corresponding CD3+ T cells but without any difference in the MFI (online supplemental figure 5A, B and C).
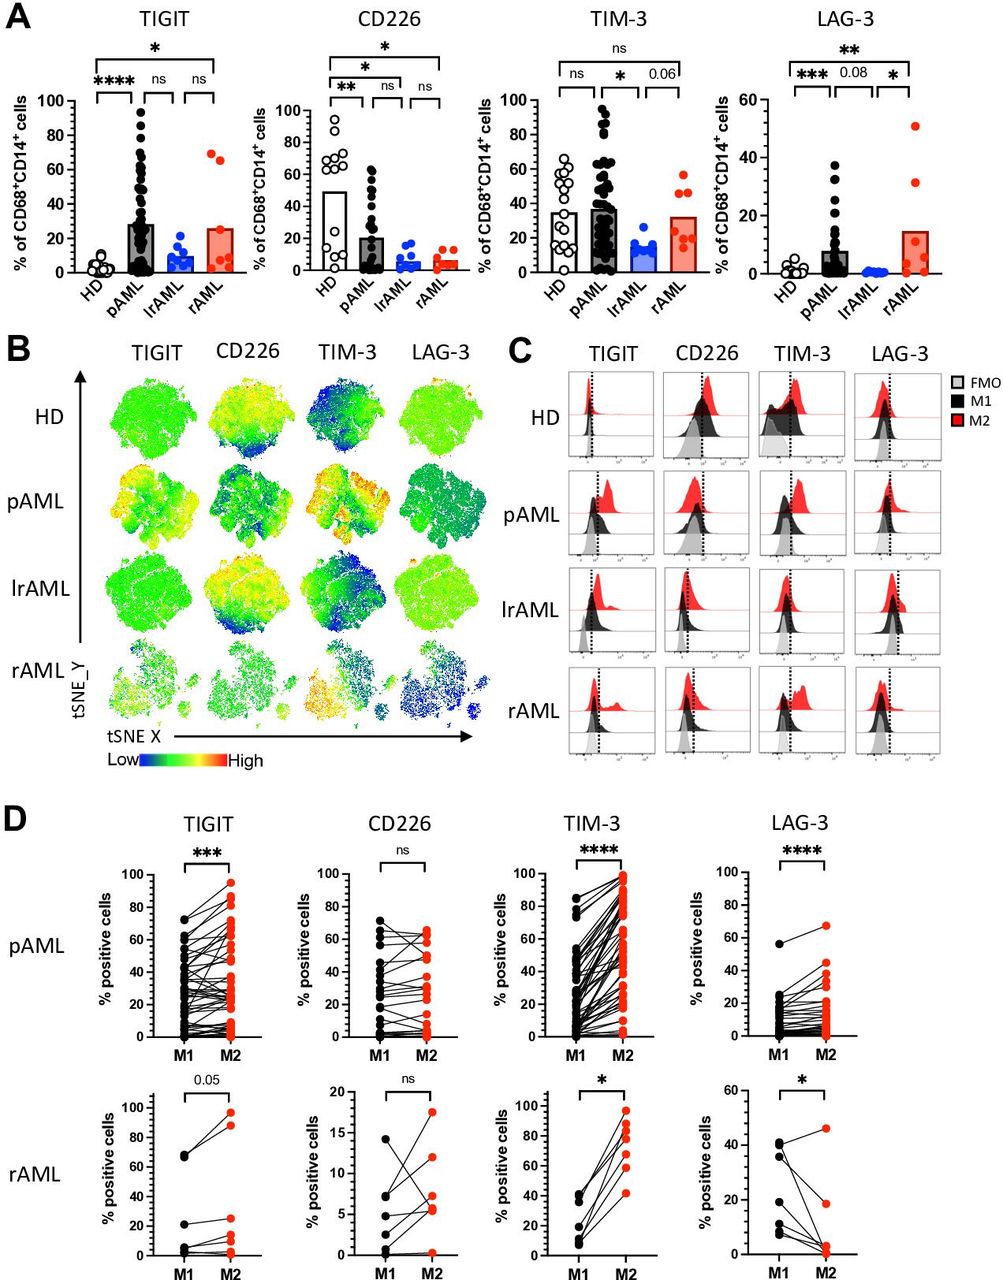
TIM-3 and LAG-3 are more frequently coexpressed by M2 LAMs in pAML and rAML. Expression analyses were assessed of the coregulatory receptors TIGIT, TIM-3 and LAG-3 on CD14+CD68+ LAMs from patients with pAML (n=53), patients in lrAML (n=8), patients with rAML (n=7) and HDs (n=17). CD226 expression analyses were performed on macrophages from patients with pAML (n=29), lrAML (n=8), rAML (n=7) and HDs (n=13) using multiparametric flow cytometry. (A) Summary data showing the expression of TIGIT, CD226, TIM-3 and LAG-3 on CD14+CD68+ macrophages. (B) tSNE heat maps illustrate the expression of the coregulatory receptors on CD14+CD68+ LAMs from five PB samples of HDs (upper row), from BM aspirates of five patients with pAML (second row), BM aspirates of five patients with lrAML (third row) and five BM samples of patients with rAML (lowest row). (C) Representative histograms illustrate M2 macrophages (red histograms) and M1 macrophages (dark histograms) with their expression of TIGIT, CD226, TIM-3 and LAG-3 in comparison to the FMO controls (gray histograms), respectively. (D) The expression of coregulatory receptors was compared between paired M1 and M2 LAMs in pAML (upper panel) and rAML (lower panel). Frequencies are displayed with the means. P values were obtained by the analysis of variance and Kruskal-Wallis test and the Wilcoxon matched-pairs signed-rank test. *P<0.05, **P<0.01, ***P<0.001, ****P<0.0001. AML, acute myeloid leukemia; FMO, fluorescence minus one; HD, healthy donor; lrAML, acute myeloid leukemia in long-term remission; LAG-3, lymphocyte-activation gene 3; LAM, leukemia-associated macrophage; ns, not significant; pAML, newly diagnosed acute myeloid leukemia; PB, peripheral blood; rAML, relapsed acute myeloid leukemia; TIGIT, T-cell immunoreceptor with Ig and ITIM domains; TIM-3, T-cell immunoglobulin and mucin-domain containing-3 protein; tSNE, t-distributed stochastic neighbor embedding.
Because M2 macrophages have been described as immunosuppressive, and our analyses had revealed an increased infiltration of M2 LAMs in the BM of patients with active AML, we hypothesized that expression of the CIRs would be higher on the M2 than on the corresponding M1 LAMs. Comparative analyses were performed on BM-derived LAMs from patients with pAML and rAML. Illustrated in the histograms for patients with pAML (figure 2C), in both disease phases of AML, the TIGIT and TIM-3 expressing LAMs were more frequently related to the M2 than to the M1 subpopulation (figure 2D). Only patients with rAML-derived M2 LAMs displayed a higher frequency of LAG-3+ cells (figure 2D), whereas no differences in expression were detected for the CD226 receptor between the two LAM populations.
Next, we compared the expression of TIGIT, TIM-3, and LAG-3 between CD163+ and CD204+ and CD206+ LAMs (n=27). No significant differences were found within the three groups for the expression of TIGIT. TIM-3 was more frequently expressed by CD163+CD206− versus CD163−CD206+ LAMs, while LAG-3 was more frequently expressed by CD163+CD204− LAMs versus CD163−CD204+ LAMs (online supplemental figure 6A, B). Furthermore, CD163+ LAMs that coexpressed CD206 or CD204 showed no difference in the expression of TIGIT and LAG-3 in comparison to LAMs only expressing CD163 (online supplemental figure 6A, B). Only the frequency of TIM-3+ cells was increased within the CD163+CD204+ and the CD163+CD206+ LAMs in comparison to LAMs only expressing CD163 (online supplemental figure 6A, B). In addition, we verified that the expression of CIRs does not differ between HLA-DR+ and HLA-DR- M1 (CD86+CD163−) LAMs in pAML (n=16). Our analyses revealed no difference of the TIGIT, TIM-3 and LAG-3 expression between the two M1 phenotypes (online supplemental figure 6C). These data indicate that in active AML, the frequency of TIGIT, TIM-3, and LAG-3 are expressed on (M2) macrophages. The expression pattern seems to be reversible, as we found comparably low frequencies in remission as in the HD cohort.
TIGIT, TIM-3, and LAG-3 are more frequently coexpressed on M2 LAMs in AML
Coexpression of multiple CIRs is an important feature of T-cell exhaustion.21 Therefore, we next analyzed the coexpression of TIGIT, TIM-3 and LAG-3. In comparison to HDs, LAMs from patients with pAML and rAML contained elevated frequencies of cells coexpressing TIGIT, TIM-3 or LAG-3 together (figure 3A). The comparison of LAMs derived from patients with AML in remission with those from patients under active disease (pAML and rAML) revealed significantly higher percentages of TIGIT+TIM-3+ (p=0.0006 and p=0.07), TIGIT+LAG-3+ (p=0.002 and p=0.0002) and of TIM-3+LAG-3+ (p=0.0002 and p=0.0034) LAMs in the active disease than in patients in remission (figure 3A). As illustrated in the exemplary FACS plots (figure 3B) across all four cohorts, M2 macrophages showed a higher coexpression of TIGIT with TIM-3 in comparison to their corresponding M1 macrophages (figure 3B–D). Additionally, the coexpression pattern of TIGIT with LAG-3 and of TIM-3 with LAG-3 was only significant in patients with pAML (figure 3C). In contrast, M1 macrophages of HDs showed an increased population of CD226-expressing cells within the TIGIT− M1 subpopulation in comparison to patients with pAML and lrAML (figure 3E). In summary, the coexpression of CIRs was related to the M2 phenotype in AML, whereas CD226-expressing cells were more frequently found within the TIGIT− M1 subpopulation in the HDs.
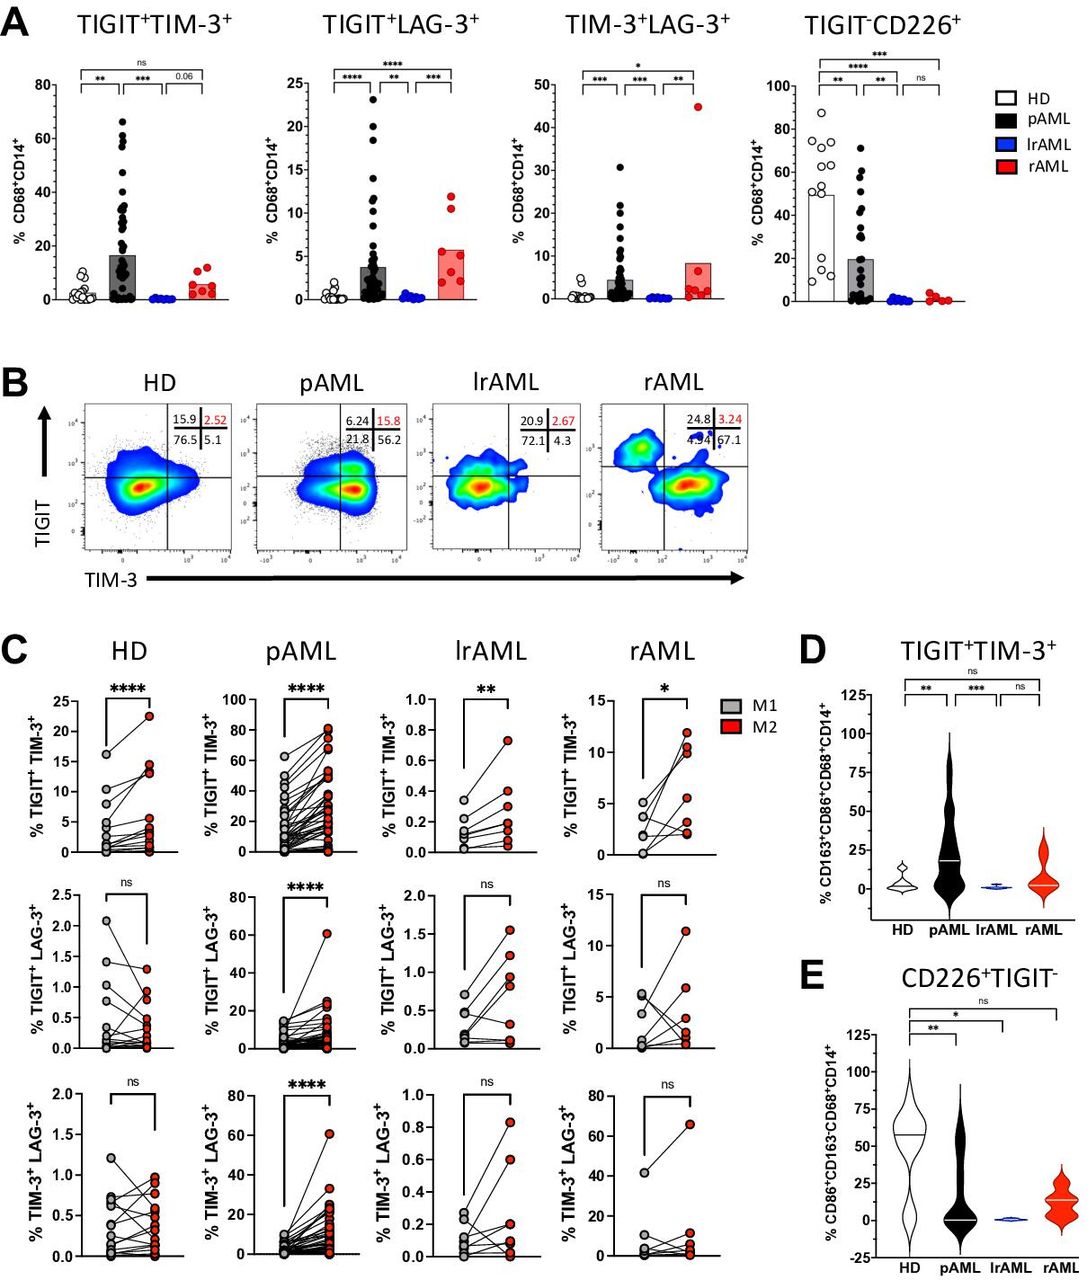
TIGIT, TIM-3 and LAG-3 are more frequently coexpressed with each other by M2 macrophages. Coexpression of coinhibitory receptors by CD14+CD68+ cells was analyzed for HDs (n=17), patients with pAML (n=53), patients in lrAML (n=8) and with rAML (n=7). (A) Coexpression of TIGIT, CD226, TIM-3 and LAG-3 is depicted on CD14+CD68+cells. (B) Exemplary flow plots illustrate coexpression of TIGIT with TIM-3. (C) Coexpression of coregulatory markers is compared between M1 and M2 LAMs. (D) M2 LAMS coexpressing TIGIT and TIM-3 are compared between different patient cohorts. (E) Expression of CD226 within the TIGIT-negative M1 population is demonstrated for the different patient cohorts. Frequencies are depicted with the means. P values were obtained by the analysis of variance and Kruskal-Wallis test and by the Wilcoxon matched-pairs signed-rank test. *P<0.05, **P<0.01, ***P<0.001, ****P<0.0001. AML, acute myeloid leukemia; HD, healthy donor; lrAML, acute myeloid leukemia in long-term remission; LAG-3, lymphocyte-activation gene 3; LAM, leukemia-associated macrophage; ns, not significant; pAML, newly diagnosed acute myeloid leukemia; rAML, relapsed acute myeloid leukemia; TIGIT, T-cell immunoreceptor with Ig and ITIM domains; TIM-3, T-cell immunoglobulin and mucin-domain containing-3 protein.
High expression of TIGIT+CD163+ M2 LAMs confers a negative prognosis to patients with pAML
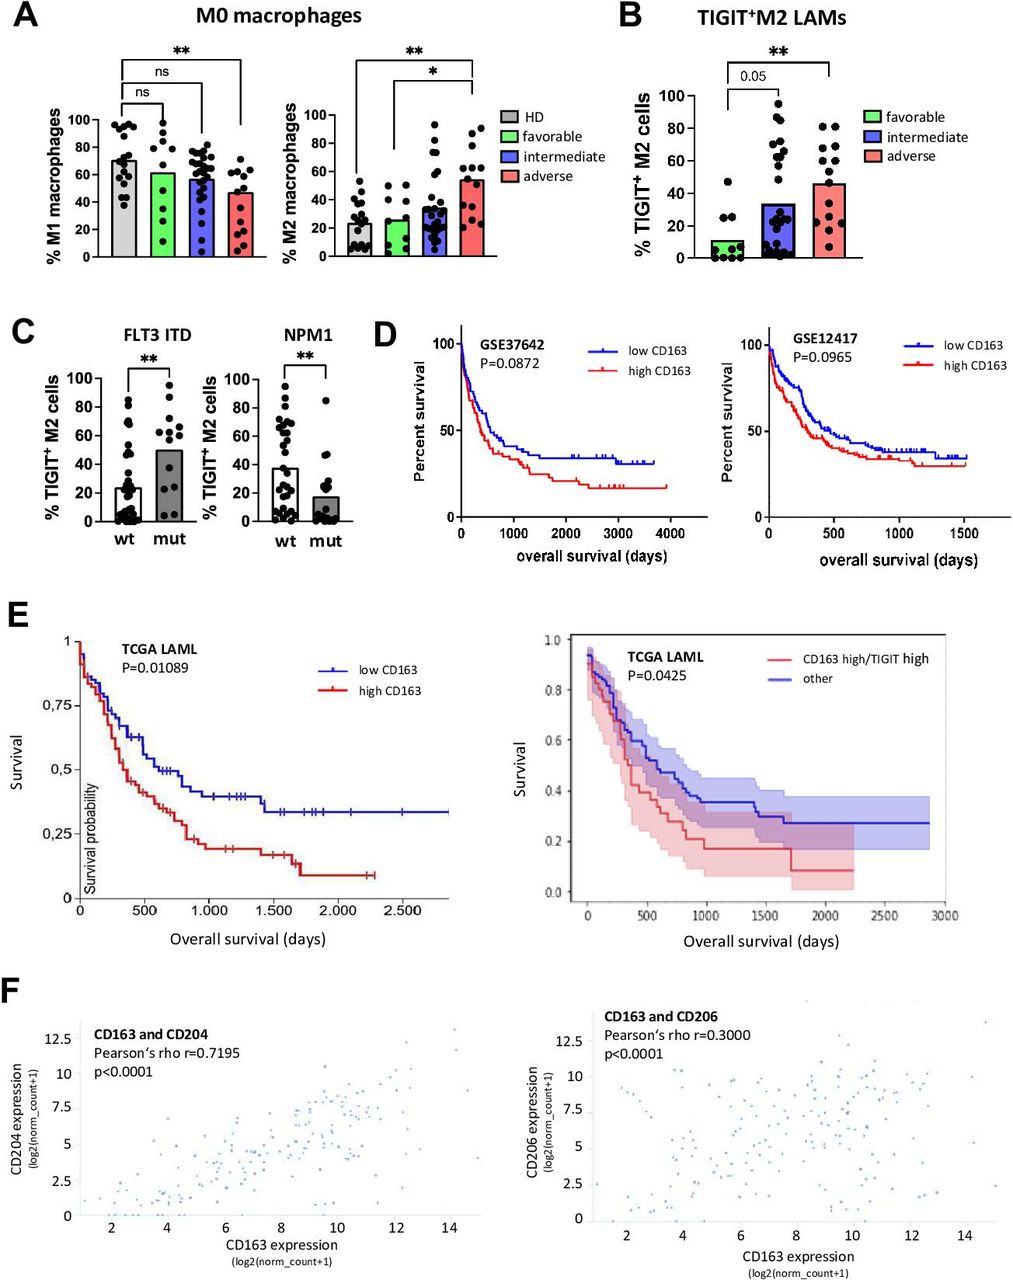
Next, we correlated the phenotype and receptor expression of LAMs with clinical parameters from patients with pAML (n=50). Details of the clinical parameters are listed in online supplemental table 2. To evaluate the prognostic relevance of M2 infiltration in the BM, we stratified the patients with pAML according to their European Leukemia Network (ELN) risk groups (favorable n=10, intermediate n=27 or adverse n=13). Patients with an adverse ELN risk showed the lowest frequency of M1 macrophages (p=0.004 vs HD; figure 4A). Consequently, the frequency of M2 LAMs was highest in the group of patients with an adverse ELN risk (p=0.0045 vs HD and p=0.03 vs favorable; figure 4A). Furthermore, M2 LAMs from patients with an intermediate and/or high risk contained a higher frequency of cells expressing TIGIT than patients in the favorable group (p=0.05 and p=0.0041, respectively; figure 4B).

LAMs expressing TIGIT are associated with adverse risk in AML. The phenotype and receptor expression of LAMs was correlated with clinical parameters from patients with pAML (n=50). (A) The distribution of M1 and M2 LAMs is depicted according to the ELN risk classification. (B) The proportion of TIGIT+ M2 LAMs is presented according to the ELN risk classification. (C) Comparison of the frequencies of TIGIT+ M2 LAMs from patients with different molecular aberrations (FLT3 ITD mutated n=13 vs FLT3 WT n=37 and NPM1 mutated n=20 vs WT n=30). (D) Kaplan-Meier curves for high versus low CD163 expressors from GSE37642 and GSE12417 datasets (n=137 and n=240 patients, respectively). (E) Kaplan-Meier curve for CD163 high versus low expressors (left panel) and the subgroup of CD163 high/TIGIT high expressors compared with the subgroup that included all CD163 high/TIGIT low, CD163 low/TIGIT high and CD163 low/TIGIT low cases (referred to as ‘other’, right panel) in the TCGA LAML cohort. (F) Expression of CD163 correlated to the expression of CD204 and CD206 in the TCGA AML cohort. For further statistical analyses including multivariate analyses of the TCGA LAML cohort, please refer to the online supplemental 7 and online supplemental table 3A,B. P values were obtained by analysis of variance, Kruskal-Wallis test and Mann-Whitney test. Pearson test was used to test for correlations. *P<0.05, **P<0.01, ***P<0.001, ****P<0.0001. TIGIT, T-cell immunoreceptor with Ig and ITIM domains. AML, acute myeloid leukemia; ELN, European Leukemia Network; LAM, leukemia-associated macrophage; ns, not significant; pAML, newly diagnosed acute myeloid leukemia; TIGIT, T-cell immunoreceptor with Ig and ITIM domains; WT, wild type.
We then correlated the marker profiles with molecular aberrations in the leukemic cells. The mutation status of 50 patients in the pAML cohort was known (see online supplemental table 2). TIGIT+ M2 LAMs were significantly increased in patients with a FLT3-ITD (figure 4C), and their frequency was decreased in cases with an NPM1 mutation (figure 4C). Taken together, patients with an intermediate or adverse ELN risk (in particular with a FLT3 ITD mutation) displayed a higher BM infiltration of TIGIT+ M2 LAMs.
The association between TIGIT expressed by M2 LAMs and the patients’ risk profile could be confirmed in several independent AML patient cohorts. The GSE37642 and GSE12417 databases, both containing microarray-based gene expression data of patients with AML (n=136 and n=240 patients) showed that high CD163 expression was associated with poor prognosis, although the significance level reached only borderline significance (figure 4D). High CD163 expression was also associated with a poor outcome in the TCGA LAML cohort containing RNA sequencing data of 161 patients with AML (p=0.01089, figure 4E). Furthermore, when we stratified the CD163 expression for high versus low TIGIT expression in this cohort, the subgroup of patients with high CD163 and high TIGIT expression had the poorest OS (p=0.0425, figure 4E). Additionally, the expression of CD163 correlated with the expression of CD204 and CD206 (figure 4F), which was in line with our observations (figure 1H). For further statistical analysis including multivariate analysis of the TCGA LAML cohort, please refer to online supplemental file 7 and online supplemental table 3A, B.
Blockade of TIGIT reprograms M2 LAMs into an M1 phenotype
Next, we set out to analyze the therapeutic potential of blocking TIGIT by examining its effects on the polarization of PB monocyte-derived macrophages in vitro. To exclude that anti-TIGIT treatment of macrophages was influenced by T cell or NK-cell cytotoxicity, we used differentiated monocyte-derived M2-like macrophages of HDs (n=5). Purified CD14+ cells were differentiated into M2-like (CD163+CD68+CD14+) macrophages in vitro for 6 days. After verification of the phenotype and TIGIT expression (online supplemental figure 8A, B), cells were treated with an anti-TIGIT antibody or isotype control mAb for 24 hours. As demonstrated in the flow plots (figure 5A), TIGIT blockade decreased the frequency of CD163+ M2-like macrophages and increased the proportion of CD86+ M1-like (CD163−CD68+CD14+) macrophages (figure 5B) without affecting the viability of macrophages (online supplemental figure 8C). Interestingly, we observed also a reduction of CD68+CD14+ macrophages expressing TIM-3, whereas CD226 was more frequently expressed by cells treated with the blocking TIGIT mAb (figure 5C).
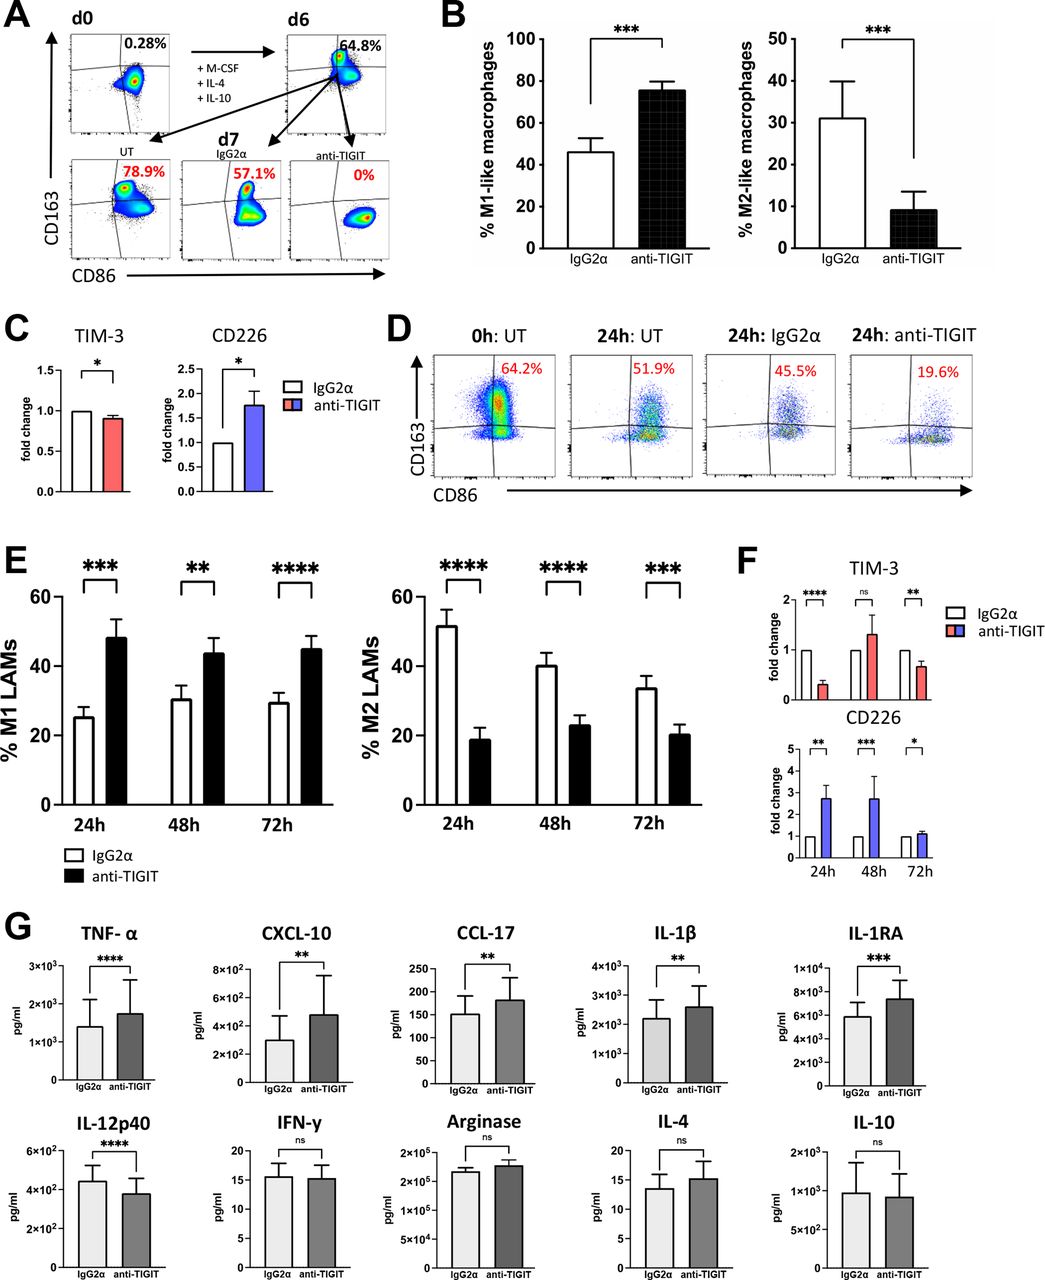
Blockade of TIGIT reprograms TIGIT+ M2 LAMs into M1 LAMs and increases cytokine secretion in vitro. The effect of blocking TIGIT on M2+ macrophages was examined on the polarization and cytokine secretion of PB monocyte-derived macrophages and BM-derived LAMs in vitro. (A) Exemplary FACS plots of M2-like macrophages gained by 6 days in vitro differentiation from CD14+ monocytes of HDs (n=5) that were treated with anti-TIGIT antibodies (mAb) or controls for additional 24 hours. (B) The percentages of M1-like (CD86+CD163−CD68+CD14+) macrophages (left panel) or M2-like (CD163+CD86+CD68+CD14+, right panel) macrophages are depicted as the median frequency±SD. (C) Expression of TIM-3 and CD226 was compared between anti-TIGIT treated and control mAb treated M0-like (CD68+CD14+) macrophages. (D) Exemplary FACS plots of primary LAMS from patients with pAML. (E) The percentages of M1 (left panel) and M2 LAMS (right panel) are depicted as the median frequency±SD. (F) Illustration of the frequency of TIM-3+ and CD226+ LAMs after treatment with the anti-TIGIT antibody or control mAb. (G) Cytokine levels (pg/mL) were compared between the supernatants of anti-TIGIT or control mAb treated LAMs using the BioLegend Legendplex kit (n=10). P values were obtained by the Wilcoxon matched-pairs signed-rank test. *P<0.05, **P<0.01, ***P<0.001, ****P<0.0001. BM, bone marrow; HD, healthy donor; IL, interleukin; LAM, leukemia-associated macrophage; M-CSF, macrophage colony-stimulating factor; pAML, newly diagnosed acute myeloid leukemia; PB, peripheral blood; TIGIT, T-cell immunoreceptor with Ig and ITIM domains; TIM-3, T-cell immunoglobulin and mucin-domain containing-3 protein.
To investigate this effect on primary LAMs, we cultured PB mononuclear cells (PBMCs) from seven patients diagnosed with untreated CD117+CD34+ AML in the presence of a blocking TIGIT antibody or its isotype control for up to 72 hours and reassessed the M2-like (CD163+CD86+) and M1-like (CD163−CD86+) phenotype. The viability and proportion of CD68+CD14+ LAMs in the total cell culture showed no change comparing no versus isotype versus anti-TIGIT treatment (online supplemental figure 8D, E and F), indicating that anti-TIGIT treatment had no cytotoxic effect on LAMs. TIGIT blockade significantly reduced the frequency of M2-like LAMs, while it increased the frequency of inflammatory M1-like LAMs in comparison to the control (figure 5D,E). Repolarization into M1-like LAMs under TIGIT blockade was observed in all seven tested primary AML samples, indicating the importance of the TIGIT axis for LAM polarization. Again, anti-TIGIT treated LAMs displayed increased frequencies and MFIs of CD226, whereas TIM-3 showed reduced expression (figure 5F). In conclusion, blockade of TIGIT was able to induce a phenotypical shift from M2 into M1 in in vitro differentiated M2-like macrophages as well as in primary M2-like LAMs.
Blockade of TIGIT increases secretion of inflammatory cytokines by LAMs
In addition to the phenotypical analyses, we investigated the effect of the TIGIT blockade on LAM’s cytokine production. For this purpose, negative magnetic bead isolation was performed to isolate BM-derived CD163+ LAMs from 10 patients with AML. The M2 LAM fraction was first analyzed regarding the ratio of M2:M1 LAMs. With a mean frequency of M2 LAMs of 38.03±23.53%, this patient cohort had a dominant proportion of M2 LAMs. Cells were cultured for 24 hours with an anti-TIGIT antibody or the corresponding isotype control antibody. Legendplex analyses (BioLegend) of the supernatants were performed for the evaluation of cytokine levels. Summarized data are presented in figure 5G. The amount of proinflammatory TNF-α (p<0.0001), IL-1β (p=0.0029), IL-1RA (p=0.0006), CXCL-10 (p=0.0021) and CCL-17 (p=0.002) increased in the anti-TIGIT treated conditions. Contrarily, IL-12p40 concentration was decreased in anti-TIGIT treated cultures (p<0.0001). The remaining cytokines measured by Legendplex showed no significant changes after incubation with anti-TIGIT. These data indicate that the TIGIT blockade not only leads to a repolarization of the phenotype but also increases the secretion of inflammatory cytokines and chemokines in LAMs.
Blockade of TIGIT increases CD47-dependent cellular phagocytosis
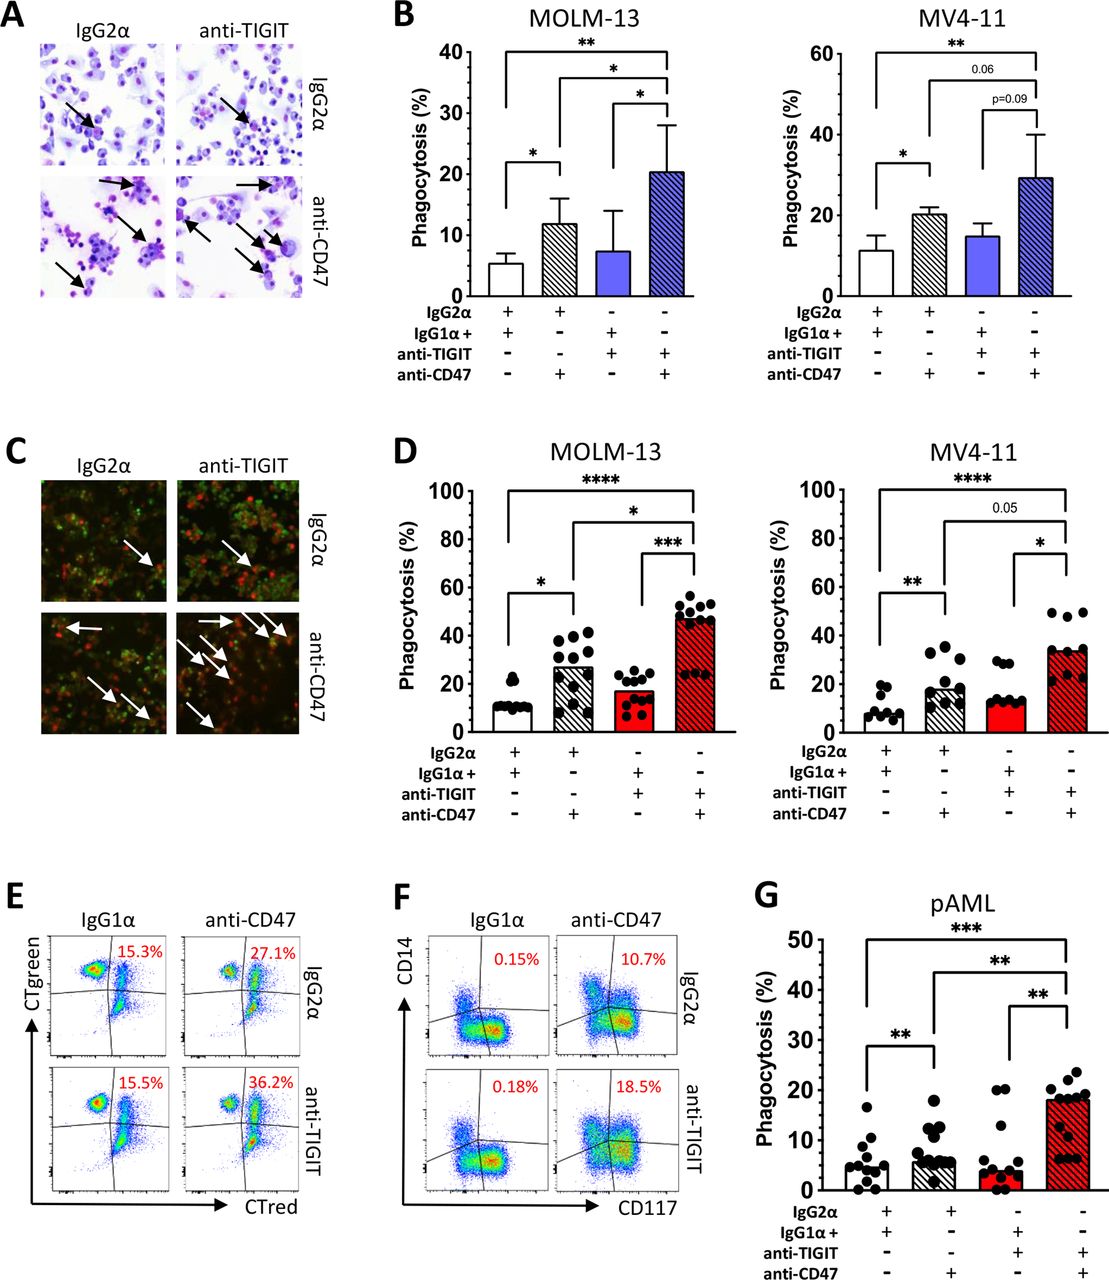
Recently, it has been shown that phagocytosis of AML cells by macrophages can be induced by the blockade of the 'don’t eat me' ligand CD47.22 We hypothesized that blockade of TIGIT could stimulate phagocytosis by repolarizing M2 into M1 macrophages. Therefore, we investigated whether combined blockade of TIGIT and CD47 could augment phagocytosis compared with CD47 monotherapy. Monocyte-derived macrophages from HDs (n=4) were differentiated into M2-like macrophages over 6 days in vitro and treated with an anti-TIGIT antibody or isotype control mAb for 24 hours. After evaluating the successful repolarization into M1 macrophages, the macrophages were cocultured for 4 hours with CD47+ AML cell lines in the presence of an anti-CD47 mAb or isotype control mAb. We observed significantly increased phagocytosis by the sequential blockade of the TIGIT and CD47 receptors for MOLM-13 and MV4-11 AML cells in comparison to single blockade of CD47 as measured by light microscopy and epifluorescence microscopy (measured by light microscopy: mean phagocytosis (%) for MOLM-13 combined blockade vs CD47 blockade alone: 20.7±5.7 vs 12.2±2.9, p=0.02; and for MV4-11: combined blockade vs CD47 blockade alone 29.7±8.4 vs 19.5±3.1, p=0.05; figure 6A–C).

Blockade of TIGIT increases CD47-dependent phagocytosis of AML cell lines and primary AML cells in vitro. To assess antibody-mediated phagocytosis, monocyte-derived M2 macrophages from HDs were incubated for 24 hours with a blocking anti-TIGIT or isotype control antibody and then cocultured for 4 hours with AML cells (MOLM-13 n=4 and MV4-11 n=4) in the presence or absence of an anti-CD47 antibody or an IgG1α isotype control mAb. (A) Phagocytosis analyzed by light microscopy following Pappenheim staining. (B) Summary data show the cellular phagocytosis of AML cells measured by light microscopy. (C) In addition, phagocytosis is displayed by epifluorescence microscopy following CTgreen and CT red staining. (D) Antibody-mediated phagocytosis of CTgreen labeled AML cell lines MOLM-13 (n=4) and MV4-11 (n=3) and CT red-labeled PB-derived macrophages analyzed by multiparametric flow cytometry (% phagocytosis was defined by CT green+ and CT red+ cells). (E) Representative flow cytometry plots showing phagocytosis of AML cells by PB-derived macrophages (double-positive cells in the right upper quadrants). (F) Phagocytosis of primary bone marrow-derived CD117+CD14− AML cells by autologous CD117−CD14+ macrophages is illustrated in exemplary FACS plots (indicated by double positivity for CD14 and CD117). (G) Antibody-mediated phagocytosis of primary AML cells is demonstrated (% phagocytosis was defined by CD14+ and CD117+ cells). Measurements were performed in technical triplicates. P values were obtained by analysis of variance and Friedman test. *P<0.05, **P<0.01, ***P<0.001, ****P<0.0001. AML, acute myeloid leukemia; HD, healthy donor; pAML, newly diagnosed acute myeloid leukemia; PB, peripheral blood; TIGIT, T-cell immunoreceptor with Ig and ITIM domains.
To confirm these data, four independent phagocytosis experiments were conducted with the same experimental setup but using multiparameter flow cytometry to assess phagocytosis. Again, blockade of TIGIT significantly augmented the anti-CD47-mediated phagocytosis of the AML cell lines in comparison to single CD47 blockade (mean phagocytosis (%) of MOLM-13: combined blockade vs CD47 blockade 43.4±12.2 vs 25.5±11.9, p=0.0005; and for MV4-11: combined blockade vs single blockade 35.1±11.4 vs 21.0±9.5, p=0.0039; figure 6D,E).
Next we assessed the effect of a combined blockade of TIGIT and CD47 on phagocytosis in primary patients’ samples. Mononuclear cells were obtained from the BM of 4 patients with newly diagnosed CD117+CD14− AML. After 24 hours of treatment with either anti-TIGIT or the isotype control antibody, incubation with anti-CD47 or its isotype control was sequentially performed for an additional 4 hours. The combined blockade of TIGIT and CD47 significantly increased phagocytosis of primary blasts by autologous macrophages (defined by double positive CD117 and CD14 cells) in comparison to a blockade with CD47 alone or the isotype control. Compared with CD47 monotherapy, combined blockade achieved almost a doubling of phagocytosis activity (mean phagocytosis (%) of combined blockade vs CD47 blockade 15.2±6.4 vs 8.0±4.5, p=0.0023; figure 6F,G). Taken together, blockade of TIGIT on M2 macrophages not only led to a repolarization of the phenotype and altered cytokine secretion but also ultimately resulted in a significant augmentation of the anti-CD47-mediated leukemic phagocytosis.
Discussion
The present study demonstrates that M2 LAMs represent the predominant macrophage population in the BM of patients with active AML. These M2 LAMs displayed a characteristic coexpression pattern of the inhibitory receptors TIGIT, TIM-3, or LAG-3. In our cohort of patients with pAML, the increased frequency of TIGIT+ M2 LAMs was associated with an intermediate or adverse prognosis according to the ELN criteria. TIGIT+ M2 LAMs were increased in patients with the FLT3 ITD mutation. Furthermore, we found that high expression of CD163 is associated with a poor OS. Blockade of TIGIT resulted in in vitro differentiated M2 macrophages and primary LAMs of patients with AML in a phenotypical polarization change of M2 LAMs into M1 LAMs, augmented effector cytokine secretion and increased anti-CD47-mediated phagocytosis.
Tumor-associated macrophages can polarize into various phenotypes including immunosuppressive subtypes, depending on external stimuli.11 17 In AML for instance, growth factor independence 1 and arginase produced by leukemic cells were described as regulators of the macrophages polarization.11 23 Protumorigenic M2 macrophages have been implicated in the induction of angiogenesis by secretion of VEGF-C or VEGF-A,24 25 induction of resistance to antiangiogenic therapy,26 27 and reduced apoptosis of tumor cells and immunosuppressive activity.28 29 In line with our findings, it was reported that M2 LAMs represent a major component of the BM microenvironment in AML.11 Our study showed a significantly altered M2:M1 ratio due to a significantly higher frequency of M2 macrophages in the BM of patients with active AML (pAML and rAML) versus patients in remission or HDs. We used CD163 as M2 marker since CD204 and CD206 were in the majority coexpressed by CD163 LAMs. Additionally, our analysis did not show a significantly altered expression profile of TIGIT and LAG-3 on CD204+, CD206+ M2 macrophages compared with CD163+ macrophages only. Regarding the M1 phenotype, CIR expression did not differ between HLA-DR-positive or HLA-DR-negative M1 (CD86+CD163−CD68+CD14+) macrophages. For simplicity, we restricted the phenotyping on CD163, CD86, CD68, and CD14.17 30 31
The CIR TIGIT has gained increasing attention as a feedback control mechanism of immune activation. Its expression has been described by us and others on T cells in AML.14 15 Our present study reveals that TIGIT is also expressed on LAMs, particularly on M2 LAMs, with a significant coexpression of TIM-3 and LAG-3. The impact of this pathway on macrophages has recently been shown by Chen et al in a mouse model that TIGIT/PVR signaling suppressed xenogeneic M1 polarization and suppressed c-Maf-regulated proinflammatory cytokines production.32
Consistent with data in the literature, we found the costimulatory receptor CD226 to be expressed by TIGIT− inflammatory M1 LAMs in AML.33 34 It has been reported that CD226 on macrophages plays a costimulatory role in antigen presentation.34 Notably, our present study provides further evidence that CD226 is downregulated on M2 macrophages and upregulated after TIGIT blockade.
TIM-3 was originally discovered on activated T-effector cells but lately also described as a regulator of innate immune cells.35 36 Our study confirmed that TIM-3 expression is related to the M2 LAM population. Similar to our findings, Jiang et al detected an upregulation of TIM-3 on M2 macrophages in colon cancer.35 The authors showed in a mouse model of colorectal cancer that TIM-3 overexpression on M2 macrophages promoted tumor growth, while blockade of the TIM-3 pathway inhibited the cancer cell growth and led to a proinflammatory immune milieu.
Recent studies have described LAG-3 on tumor-associated macrophages. Our data confirmed these observations. In cutaneous melanoma, LAG-3 expression also clustered with CD163 on tumor- associated macrophages(TAMs) and was associated with a poor prognosis and survival.37 38
Even if the studied coregulatory markers have been described mainly on T cells, our comparison of LAMs with paired T cells from patients with AML revealed a higher frequency of TIM-3+ and LAG-3+ cells within the macrophage population. Datar et al found similar results for TIM-3 in human non–small cell lung cancer.39
Regarding the prognostic impact of LAMs for patients with AML, this study revealed that increased frequencies of (TIGIT+) M2 LAMs were associated with an intermediate or adverse ELN risk and an FLT3 ITD mutation. In line with Xu et al and Yang et al, we showed that macrophages are of clinical importance.40 41 High CD163 expression, age, FLT3 mutational status, and unfavorable cytogenetic risk had an impact on patients’ OS. Our results indicate that repolarization of TIGIT+ M2 macrophages may be therapeutically relevant, particularly for high-risk patients for whom satisfactory and durable treatment options are still lacking.
Macrophages are highly plastic cells that change the phenotype and function in direct response to microenvironmental stimuli. Therapeutically, our data reveal that M2 LAMs in AML can be repolarized toward the M1 phenotype on TIGIT blockade in vitro, demonstrating that the immunosuppressive plasticity of LAMs may be mediated by immune checkpoints. To our knowledge, there are no comparable studies for TIGIT; however Liang et al performed a TIM-3 gene silencing which induced macrophages repolarization to classically activated macrophages (M1) and found that overexpression of the TIM-3 gene induced M2 macrophage repolarization.42 These findings are in line with data reported by Jiang et al showing a switch from M2 to M1 macrophages by a downregulation of TIM-3.35
Furthermore, blockade of TIGIT showed increased secretions of TNF-α, IL-1β, IL-1RA, CXCL-10, and CCL-17. TNF-α, IL-1β and CXCL-10 are defined inflammatory cytokines and chemokines involved in the induction of inflammation, apoptosis, and regulation of angiogenesis.43–46 IL-1RA and CCL17 have been controversially described as indicators of inflammation but also of suppression via inhibition of IL-1β signaling, regulation of angiogenesis and favoring migration of immune-inhibitory cells such as regulatory T cells into the tumor microenvironment.12 47 48 Orecchioni et al recently described different gene signatures for in vivo M1 macrophages versus M2 macrophages with an overlap of chemokines and cytokines that were expressed by in vitro activated M1 and in vivo M2 macrophages.49
Finally, this study shows that combined blockade of CD47 and TIGIT leads to increased antileukemic phagocytosis in vitro. We were able to show the benefit of a combined blockade in an allogeneic assay with AML cell lines as well as for autologous primary mononuclear cells from patients with AML. These findings can be directly translated into clinical trials, since latest studies discovered macrophages and the CD47/SIRPα pathway as potent immunotherapeutic targets in cancer.1 Preclinical and early clinical trials demonstrated impressive benefits from the blockade of CD47 especially in combination with hypomethylating agents for patients with AML.50
In conclusion, the study shows that the combinatorial blockade of TIGIT and CD47 represents a promising strategy to boost anti-CD47-mediated phagocytosis. This observation may have direct clinical relevance since studies with anti-CD47 antibodies are ongoing in AML, and anti-TIGIT antibodies are readily available. Therefore, studies on their combined use could be initiated in the near future.
Data availability statement
Data are available on reasonable request. The datasets used and/or analyzed during the current study are available from the corresponding authors on reasonable request (f.brauneck{at}uke.de).
Ethics statements
Patient consent for publication
Ethics approval
All aspirates were obtained from all patients before treatment and after written informed consent was obtained in accordance with the Declaration of Helsinki and approval by the local ethics board (PV3469 and PV4780).
Acknowledgments
We thank all our patients for their trust, understanding and willingness to provide their blood samples for our research. We also thank our FACS core and Carsten Wiethe for supporting this work. FB thanks Elias Brauneck for proofreading and correcting the manuscript.
References
Supplementary materials
Supplementary Data
This web only file has been produced by the BMJ Publishing Group from an electronic file supplied by the author(s) and has not been edited for content.
Footnotes
CA, JW, FH and WF contributed equally.
Contributors FB designed the research study, performed the experiments, analyzed the data, and wrote the manuscript. BF, MW, JM, ES, and JO performed the experiments. DJS and CB reviewed the manuscript. PHdCA, ST, and LB provided the acute myeloid leukemia databases or helped to perform the statistical analyses. JW, FH, CA, and WF conceived the concept, oversaw the interpretation and presentation of the data, and reviewed the manuscript. WF is responsible for the overall content as the guarantor. All authors read and approved the final manuscript.
Funding This work was supported by the Mildred Scheel Nachwuchszentrum (HaTriCS program, not applicable (N/A) to FB). The project was funded by the Carsten Bender Leukämie Stiftung (N/A to FB), and by the German Research Agency (SFB841 project A6 to AC and SFB1328 project A12 to FH).
Competing interests FB: travel grant from Daiichi Sankyo, Servier, and Novartis; advisory board by Jazz, GmbH, Daiichi Sankyo. WF: personal fees and non-financial support from AbbVie; grants, personal fees, and non-financial support from Amgen and Pfizer; and personal fees from Jazz Pharmaceuticals, Celgene, Morphosys, Ariad/Incyte, Stemline Therapeutics, Daiichi Sankyo, and Servier outside the submitted work; in addition, WF has a patent for Amgen issued; and support for medical writing: Amgen, Pfizer, and AbbVie. The remaining authors declare that they have no conflict of interest.
Provenance and peer review Not commissioned; externally peer reviewed.
Supplemental material This content has been supplied by the author(s). It has not been vetted by BMJ Publishing Group Limited (BMJ) and may not have been peer-reviewed. Any opinions or recommendations discussed are solely those of the author(s) and are not endorsed by BMJ. BMJ disclaims all liability and responsibility arising from any reliance placed on the content. Where the content includes any translated material, BMJ does not warrant the accuracy and reliability of the translations (including but not limited to local regulations, clinical guidelines, terminology, drug names and drug dosages), and is not responsible for any error and/or omissions arising from translation and adaptation or otherwise.