Article Text

Abstract
Purpose CD103, an integrin specifically expressed on the surface of cancer-reactive T cells, is significantly increased during successful immunotherapy across human malignancies. In this study, we describe the generation and zirconium-89 (89Zr) radiolabeling of monoclonal antibody (mAb) clones that specifically recognize human CD103 for non-invasive immune positron-emission tomography (PET) imaging of T cell infiltration as potential biomarker for effective anticancer immune responses.
Experimental design First, to determine the feasibility of anti-CD103 immuno-PET to visualize CD103-positive cells at physiologically and clinically relevant target densities, we developed an 89Zr-anti-murine CD103 PET tracer. Healthy, non-tumor bearing C57BL/6 mice underwent serial PET imaging after intravenous injection, followed by ex vivo biodistribution. Tracer specificity and macroscopic tissue distribution were studied using autoradiography combined with CD103 immunohistochemistry. Next, we generated and screened six unique mAbs that specifically target human CD103 positive cells. Optimal candidates were selected for 89Zr-anti-human CD103 PET development. Nude mice (BALB/cOlaHsd-Foxn1nu) with established CD103 expressing Chinese hamster ovary (CHO) or CHO wild-type xenografts were injected with 89Zr-anti-human CD103 mAbs and underwent serial PET imaging, followed by ex vivo biodistribution.
Results 89Zr-anti-murine CD103 PET imaging identified CD103-positive tissues at clinically relevant target densities. For human anti-human CD103 PET development two clones were selected based on strong binding to the CD103+ CD8+ T cell subpopulation in ovarian cancer tumor digests, non-overlapping binding epitopes and differential CD103 blocking properties. In vivo, both 89Zr-anti-human CD103 tracers showed high target-to-background ratios, high target site selectivity and a high sensitivity in human CD103 positive xenografts.
Conclusion CD103 immuno-PET tracers visualize CD103 T cells at relevant densities and are suitable for future non-invasive assessment of cancer reactive T cell infiltration.
- biomarkers, tumor
- lymphocytes, tumor-infiltrating
Data availability statement
All data relevant to the study are included in the article or uploaded as online supplemental information.
This is an open access article distributed in accordance with the Creative Commons Attribution Non Commercial (CC BY-NC 4.0) license, which permits others to distribute, remix, adapt, build upon this work non-commercially, and license their derivative works on different terms, provided the original work is properly cited, appropriate credit is given, any changes made indicated, and the use is non-commercial. See http://creativecommons.org/licenses/by-nc/4.0/.
Statistics from Altmetric.com
WHAT IS ALREADY KNOWN ON THIS TOPIC
CD103, as assessed on the gene and protein level in biopsies, has proven to be a promising biomarker for response to immunotherapy.
WHAT THIS STUDY ADDS
Here, we demonstrate that novel antibodies targeting CD103 can be leveraged for non-invasive imaging of CD103 using positron-emission tomography, paving the way for translation of CD103 as biomarker in patients.
HOW THIS STUDY MIGHT AFFECT RESEARCH, PRACTICE OR POLICY
Clinically, CD103 PET imaging could have the potential to select patients more likely to benefit from immunotherapy and thereby spare patients unlikely to respond to unnecessary immune-related side effects.
Introduction
A substantial number of cancer immunotherapy strategies rely on adaptive immune responses against antigens preferentially (tumor-associated antigens) or selectively (neoantigens) expressed in cancer cells.1 This mode of action is best exemplified by the exquisite responses of patients with a high mutation (and corresponding neoantigen) burden to treatment with monoclonal antibodies (mAbs) that block the immune checkpoint programmed death-1 (PD-1) or its ligand (PD-L1).2–4 Nevertheless, on average only ~15%–20% of patients fall into this category. In an effort to extend the promise of immunotherapy to more patients, approximately 2000 (combination) immunotherapy trials have now been initiated across malignancies. Considering this plethora of treatment options, early response biomarkers that can guide treatment decision making are urgently needed.5–10
A hallmark of successful immunotherapy across tumor types is an increase in the number of T cells within the tumor (tumor infiltrating lymphocytes, TILs).4 8 11–13 TIL ‘load’ in tumor lesions therefore represents an attractive biomarker for monitoring immunotherapy. However, not every T cell within a tumor is involved in the anti-cancer immune response.14–19 For example, tumors are frequently enriched for virus-specific bystander T cells that have no contributing effect to the anti-cancer activity.20 In recent years, we and others have refined the definition of cancer-reactive TIL. Based on this work, TILs of a tissue-resident memory-like phenotype (TRM-like cell) have come forward as a promising subset across malignancies.14–19 21–30 TRM-like cells are associated with an integrated immune response31 and outcome of immune checkpoint blockade therapy in patients.32 One of the main cell surface markers of CD8+TRM like cells is the integrin CD103, also known as the αE subunit of the αEβ7 integrin complex.15 19 33 34 Accordingly, recent work has shown that in melanoma, lung and esophageal cancer patients, the number of CD103+ TILs was significantly increased during immunotherapy in responding lesions compared with lesions of treatment-naive patients and those not responding.25–27 35–37 Thus, CD103 is an interesting TIL load biomarker to investigate.
The current standard for assessing CD103+ cell infiltration is immunohistochemistry (IHC) on tissue biopsies. However, there are several obstacles known to be associated with biopsy-based techniques, such as poor accessibility of lesions, tumor heterogeneity within and between lesions and sampling errors. In order to sidestep these obstacles associated with biopsies and obtain information about CD103+ TRM load in all tumor lesions, noninvasive whole-body imaging techniques can be applied. Positron emission tomography (PET) is a molecular imaging technique that allows repeated and non-invasive clinical assessment.38–46 PET is characterized by a high spatial resolution, sensitivity, and possibility to quantify the imaging signal and thus ideally suited for determining whole-body TRM load using radiolabeled mAbs. The PET isotope zirconium-89 (89Zr; t1/2=78.4 hours) is favorable for radiolabeling mAbs, as its physical half-life matches the time mAbs require for optimal target-to-background signals.47 Recently, a first-in-human PET imaging study with 89Zr-labeled atezolizumab (anti-PD-L1) showed that tracer uptake appeared to be a predictor of response to atezolizumab treatment.48 Non-invasive PET imaging of T cells has been described in mouse models and clinical trials using markers such as CD3, CD8 and PD-1.49–52 Thus, the concept of visualizing T cells is feasible. Imaging CD103 may have advantages over these currently pursued strategies such as a peripherally restricted biodistribution and increased specificity for cancer-reactive TILs.
Here, we generated and radiolabeled mAb clones that specifically recognize human CD103 for non-invasive immune imaging of T cell infiltration in human cancers as potential biomarker for effective anti-cancer immune responses.
Materials and methods
Recombinant molecules and antibodies
The details of reagents and antibodies used for our study are provided in online supplemental table 1.
Supplemental material
Primary material and cell lines,
Chinese hamster ovary (CHO)-K1 cells the human non-small cell lung cancer cell line A549 and the breast cancer cell line MCF7 were obtained from the American Type Culture Collection (ATCC). Cells were quarantined until screening for microbial contamination and mycoplasma was performed and proven to be negative. Cells were grown in DMEM/F-12, GlutaMAX Supplement+5% FCS + 25 mM HEPES for CHO-K1, RPMI+10% FCS for A549, and Dulbecco’s Modified Eagle Medium +10% FCS for MCF7 and incubated in a humidified atmosphere with 5% CO2 at 37°C.
CD103/β7 expressing CHO clones were generated by nonliposomal transfection (Fugene) of custom-based synthesized pcDNA3.1+_Hygro.ITGB7_HUMAN and pCI-neo.ITGAE_HUMAN plasmids (GeneArt/ThermoFisher Regensburg, Germany). The A549 cell line was subjected to CRISPR/Cas9-mediated knockout of CDH1 (E-cadherin) by nonliposomal transfection using plasmid encoding guide RNAs, a fully functional CAS9 cassette and GFP (plasmid pSpCas9(BB)-2A-GFP (PX458) was a gift from Feng Zhang (Addgene plasmid # 48138; http://n2t.net/addgene:48138;RRID:Addgene_48138)) as described previously.53 GFP-positive single-cell clones were isolated using a Moflo Astrios sorter (Beckman Coulter). Disruption was confirmed by Sanger sequencing with tracking of indels and flow cytometry.
CD103 positive T cells were generated as follows. Human peripheral blood mononuclear cells were isolated via Ficoll-Paque density gradient centrifugation (Ficoll-Paque PLUS, GE Healthcare Life Sciences, Marlborough, Massachusetts, USA) of buffy coats from healthy volunteers after informed consent (Sanquin). Next, CD8 positive T cells were negatively selected using a MagniSortHuman CD8 T cell Enrichment Kit according to standard protocol (Thermo Fisher Scientific). Subsequently, cells were stimulated with 10 µg/mL PHA, 6000 U/mL IL-2 and 10 ng/mL recombinant TGFβ, and cultivated in RPMI supplemented with 10% fetal calf serum (FCS) and penicillin/streptomycin (100 U/mL). Cells were cultured for at least 10 days to obtain >80% CD103 positive CD8 cells.
Fresh tumor material was obtained from ovarian cancer patients undergoing cytoreductive surgery. With a scalpel, tumor pieces of approximately 1 mm3 were cut, and subjected to enzymatic digestion (RPMI supplemented with 1 mg/mL collagenase type IV (Life Technologies), 31 U/mL rhDNase (Pulmozyme, Genentech, California, USA) and 10% FCS) for 30 min at 37°C or overnight at room temperature. Subsequently, the digestion medium containing remaining tumor pieces was filtered over a 70 µm cell strainer (Corning, Amsterdam, The Netherlands). For flow cytometric analyses, cells were pelleted, washed, and cryopreserved until further use.
Spleens from C57/BL6 mice were harvested, followed by mincing of the tissue on a 70 µm strainer with a plunger. Red blood cells were removed using Red Blood Cell Lysis Buffer (Biolegend). Cells were pelleted, washed, and cryopreserved until further use.
mAb generation
To generate human CD103 antibodies, mice were immunized with the cDNA plasmid constructs encoding full length open reading frames of human CD103 (integrin alpha-E) and human integrin beta-7. The pCI-neo and pcDNA3.1(+) were custom-based synthesized and obtained from GeneArt/ThermoFisher (Regensburg, Germany). Mice were immunized by gene gun immunization using a Helios Gene gun (BioRad, Hercules, California, USA) and DNA coated gold bullets (BioRad) following manufacturer’s instructions at Envigo (Horst, The Netherlands). Briefly, 1 µm gold particles were coated with pCI-neo-hCD103 and pcDNA3.1(+)-hBeta7 cDNA and commercial expression vectors for mouse Flt3L and mouse GM-CSF (both from Aldevron) in a 1:1:1:1 ratio. A total of 50 µg of plasmid DNA was used to coat 25 mg of gold particles. Specifically, 7–8 weeks old female BALB/C mice (Harlan) were immunized in the ears with a gene gun, receiving three administration cycles in both ears.
Antibody titer was assessed by cell-based ELISA), using a CHO.hCD103/hBeta7 stable cell line. Cells were seeded into 96-well flat-bottom tissue culture plates at 8×10⁴ cells/well and cultured at 37°C, 5% CO2 and 95% humidity until cell layers were confluent. Cells were incubated with each sample of the diluted mouse sera for 1 hour at 37°C, 5% CO2 and 95% humidity. Next, cells were washed with phosphate buffered saline (PBS)/0.05% Tween-20 (PBS-T) and incubated with goat-anti-mouse IgG-HRP conjugate (Southern Biotech) for 1 hour at 37°C, 5% CO2 and 95% humidity. Subsequently, cells were washed three times with PBS-T and anti-hCD103/hBeta7 immunoreactivity was visualized with TMB Stabilized Chromogen (Invitrogen). Reactions were stopped with 0.5 M H2SO4 and absorbance was read at 450 and 610 nm. The anti-hCD103/hBeta7 titer was higher than 1:2500 in each individual mouse serum sample as detected after two DNA immunizations. All mice were immunized for a final, third time and sacrificed 4 days later. Erythrocyte-depleted spleen and lymph-node cell populations were prepared according to published protocols.
To select anti-hCD103 antibody producing B-cells, a selection strategy was designed and developed that preferentially bound B-cells expressing antibodies that bind specifically to hCD103. Splenocytes and lymphocytes from the hCD103/hBeta7 immunized mice were incubated with hCD103 negative MCF-7 that were seeded into T25 culture flasks and irradiated at 30 Gray. After 1 hour unbound cells were gently removed by moving the flask back and forth. Medium containing unbound cells was then transferred to a new T25 flask containing irradiated CHO.hAlpha4/hBeta7 cells (transient transfection). This procedure was repeated one more time on ice in order to negatively select hBeta7-reactive B-cells. Next, medium containing unbound B-cells was incubated with CHO.hCD103/hBeta7 cells that were irradiated with 30 Gy. After 1.5 hours incubation on ice unbound cells were removed with multiple wash steps using culture medium. Subsequently, T25 flasks containing CHO.hCD103/hBeta7 cells with bound lymphocytes were harvested with Trypsin-EDTA (Sigma). Selected B-cells were mixed with 10% (v/v) T-cell supernatant and 50,000 irradiated (25 Gy) EL-4 B5 feeder cells in a final volume of 200 µL medium in 96-well flat-bottom tissue culture plates. On day 4, cell culture medium was refreshed. On day 8, supernatants were screened for hCD103/hBeta7 reactivity by cell ELISA as described below. CHO.hCD103/hBeta7 and CHO-K1.hAlpha4/hBeta7 (transient transfection) were seeded in culture medium (DMEM-F12 (Gibco) supplemented with 10% Fetal Bovine Serum (Hyclone) and 80 U Pen/Strep (Gibco)) in 96-well flat-bottom tissue culture plates and cultured at 37°C, 5% CO2 and 95% humidity until they were confluent. Subsequently, culture medium was removed and cells were incubated for 1 hour at 37°C, 5% CO2 and 95% humidity with supernatants from the B-cell cultures. Next, cells were washed with PBS-T and incubated for 1 hour at 37°C, 5% CO2 and 95% humidity with goat-anti-mouse IgG-HRP conjugate (Southern Biotech). Subsequently, cells were washed three times with PBS-T and anti-hCD103/hBeta7, and anti-hAlpha4/hBeta7 immunoreactivity was visualized with TMB Stabilized Chromogen (Invitrogen). Reactions were stopped with 0.5 M H2SO4 and absorbance was read at 450 and 610 nm.
B-cell clones from the hCD103/hBeta7 reactive supernatants, which were not or which were minimally reactive to hAlpha4/hBeta7 were immortalized by mini-electrofusion following a published procedure54 with some minor deviations. Briefly, B-cells were mixed with 106 Sp2/0-Ag14 murine myelomah cells (ATCC CRL-1581) in Electrofusion Isomolar Buffer (Eppendorf). Electrofusions were performed in a 50 µL fusion chamber by an alternating electric field of 15 s, 1 MHz, 23 Vrms AC followed by a square, high field DC pulse of 10 as, 180 Volt DC and again by an alternating electric field of 15 s, 1 MHz, 23 Vrms AC. Content of the chamber was transferred to hybridoma selective medium and plated in a 96-well plate under limiting dilution conditions. On day 8 following the electrofusion, hybridoma supernatants were screened for hCD103/hBeta7and hAlpha4/hBeta7 binding activity by cell ELISA as described above. Hybridomas that secreted antibodies in the supernatant that specifically bound CD103 subcloned by limited dilution to safeguard their integrity and stability and were frozen at −180°C. Selected stable hybridomas were cultured in serum-free media for 7 days; supernatants were harvested and antibodies were purified using MabSelect Sure Protein A resin according to the manufacturer’s instructions (GE Healthcare). Antibody concentrations were quantified using spectrophotometry. Antibody monomericity was assessed by SEC-HPLC. Supernatants of the hybridoma cultures were used to isotype the hybridomas. In short, isotyping was done using a mouse mAb isotyping kit (BioRad) based on a dipstick with immobilized goat-anti-mouse antibody bands to each of the common mouse isotypes and light chains. Recovered antibodies were all identified as mouse IgG1. Antibody sequences were elucidated by sequencing of variable regions of the mouse IgG 1 hybridoma material performed at LakePharma (California, USA), using the following method: the total RNA of the hybridoma cells was extracted, which allowed cDNA synthesis. Rapid Amplification of cDNA Ends (RACE) was performed that allowed cloning of positive fragments in a TOPO (Thermo Fisher Scientific) vector. TOPO clones were sequenced and sequences were annotated using VBASE2.
Flow cytometry analysis
For binding assays of anti-hCD103 mAbs in tumor digests, samples were divided in multiple aliquots and stained using either a live/dead marker and commercial antibodies against human CD3, CD8α, CD33, and CD103, or commercial antibodies against CD3, CD8α, CD33 and our anti-CD103 mAbs with secondary detection reagent. For binding assays of anti-hCD103 and anti-mCD103 with murine CD103 positive splenocytes, single cells suspensions were divided in multiple aliquots and stained using either a live/dead marker and commercial antibodies against murine CD8 and CD103. Additional aliquots were stained with relevant isotype controls or as fluorescence minus one controls. Percentage binding of fluorescently labeled mAbs was determined using flow cytometry. Maximum binding was set at 100%. Measurement was performed on a BD FACSVerse (BD Biosciences). Data analysis was performed with FlowJo V.10 (Tree Star) and surface receptor levels were expressed as mean fluorescent intensity (MFI).
Internalization and dissociation of anti-hCD103 mAbs and membranous turnover of CD103 were determined using a previously described protocol.55 Briefly, CHO.CD103 tumor cells or CD103 positive T cells were stained on ice with the anti-CD103 mAbs (20 µg/mL final concentration). After staining; (1) cells were washed with ice-cold FACS buffer and incubated with secondary antibody diluted 1:50 in FACS medium for 1 hour at 4 °C to measure surface expression. (2) Cells were washed with ice-cold FACS buffer, incubated in culture medium at 37 °C for 4 hours and subsequently incubated with secondary antibody for 1 hour at 4 °C to measure non-internalized CD103-antibody complexes since the secondary antibodies only bind to surface bound CD103 mAbs. (3) Cells were washed with ice-cold FACS buffer, incubated in culture medium at 37 °C for 4 hours and subsequently re-incubated with the CD103 mAbs, followed by secondary antibody to measure non-internalized, reappeared receptors and possible de novo synthesis of receptors. Duplicate samples were measured for each treatment condition, and corrected for background fluorescence and unspecific binding of the secondary antibody. Measurement was performed on a BD FACSVerse or BD Accuri C6 (BD Biosciences). Data analysis was performed with FlowJo V.10 (Tree Star) and surface receptor expression was expressed as MFI.
To study differences in affinity and competition between the mAbs, CD103+ CD8+ T cells were preincubated with our anti-CD103 mAbs or the commercial anti-CD103 mAbs in FACS medium for 1 hour at 4°C and subsequently incubated with their fluorescently labeled counterparts for 1 hour at 4°C. Percentage binding of fluorescently labeled mAbs was determined using flow cytometry. Maximum binding was set at 100%.
Autoradiography and IHC
For autoradiography, formalin-fixed, paraffin-embedded (FFPE) tissue slices (4 µm) were exposed to a phosphor plate for 96 hours at room temperature. Exposures were captured using a phosphor imager (Cyclone).
For murine CD103 IHC, previously autoradiographed formalin-fixed, paraffin-embedded tissue slices were deparaffinized in xylene and rehydrated. Heat-induced antigen retrieval was performed in 10 mM TRIS/EDTA (pH 9.0) at 100 °C for 15 min, endogenous peroxidase was blocked by 10 min incubation with 3% H2O2 in PBS and non-specific binding of antibodies was blocked using 1% human serum albumin+1% bovine serum albumin (BSA) in PBS for 30 min. Next slides were incubated with rabbit anti-mouse CD103 antibody (1:500, ab224202, Abcam) for 60 min at room temperature. Incubation with secondary antibody (EnVision System, Dako HRP; Dako) was performed for 30 min, followed by application of diaminobenzidine chromogen for 10 min. Hematoxylin counterstaining was applied routinely.
For murine CD3 IHC, serial sections, were deparaffinized in xylene and rehydrated. Heat-induced antigen retrieval was performed in 10 mM citrate buffer (pH 6.0) at 100 °C for 15 min, endogenous peroxidase was blocked by 10 min incubation with 3% H2O2 in PBS. Next slides were incubated with rabbit anti-mouse CD3 antibody (1:100, ab16669, Abcam) overnight at 4°C. Incubation with secondary antibody (EnVision System, Dako HRP; Dako) was performed for 30 min, followed by application of diaminobenzidine chromogen for 10 min. Hematoxylin counterstaining was applied routinely.
Digital scans of slides were acquired by a NanoZoomer 2.0-HT multi slide scanner (Hamamatsu) and analyzed with NanoZoomer Digital Pathology viewer software.
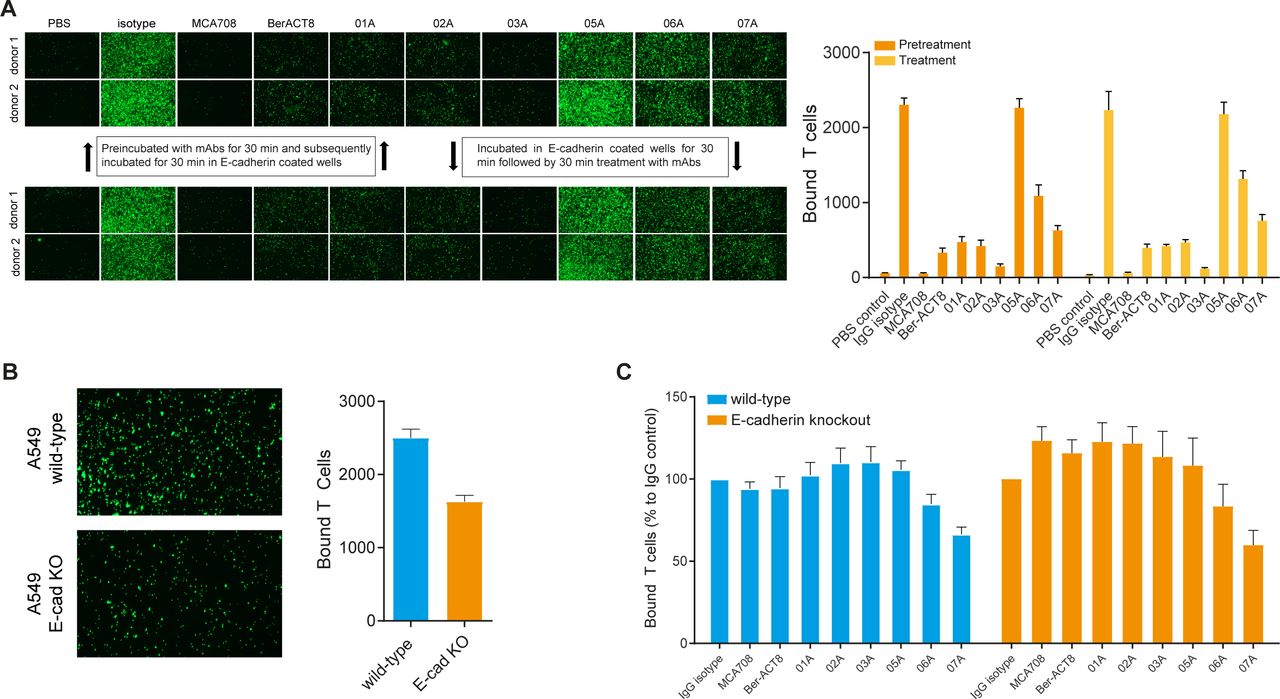
CD103+ T cell adhesion assays
CD103+ T cell adhesion assays were performed as follows. One day before the experiment, 96 wells plates were coated overnight at 4°C with 100 µL recombinant E-cadherin at 2 µg/mL in Dulbecco’s PBS (DPBS) containing 1 mM Ca2+ and Mg2+. Next, wells were blocked for at least 1 hour using 1% BSA in DPBS. CD103+ T cells were labeled with carboxyfluorescein diacetate succinimidyl ester (CFSE) (Thermo Fisher Scientific) as described earlier56 and resuspended in RPMI+10% FCS + 1 mM Mn2+. CFSE labeled cells were either preincubated with 10 µg/mL antibody for 30 min on ice followed by incubation in E-cadherin coated wells (50,000 cells/well) for 30 min at 37°C or cells were directly transferred to E-cadherin coated wells for 30 min at 37°C followed by 10 µg/mL antibody treatment for 30 min at 37°C.
For adhesion assays using A549 wild-type and E-cadherin knock-out cells, 1 day before the experiment, tumor cells (30,000 cells/well) were seeded in 96 wells plates. Next, CFSE labeled CD103+T cells were preincubated with 10 µg/mL antibody for 30 min on ice, followed by incubation in tumor cell seeded wells for 60 min at 37°C.
After incubation, unbound cells were removed by inverting the plate and washing with DPBS. Finally, cells were fixed using 3.7% formalin in DPBS. Images were captured using a conventional fluorescent microscope (Invitrogen EVOS FL Imaging System). Bound T cells were quantified using Image J software analysis (V.1.50).
Cell based ELISA
One day before the experiment, CD103/β7 transfected CHO cells (30,000 cells/well) were seeded in 96 wells plates. Subsequently, serial dilutions of CD103 mAbs and isotype controls were added to each well of a 96-well plate and incubated for 1 hour at 37°C. Wells were washed with PBS and incubated with Rabbit anti-Mouse/IgG-HRP (1:4000, Dako) for 1 hour at 37°C. Next wells were washed with PBS and TMB substrate (KPL) was added. The color reaction was stopped by adding 1M HCl solution and the absorbance was measured by a microplate reader (Thermo Scientific).
89Zr-mCD103, 89Zr-hCD103.01A, and 89Zr-hCD103.05A tracer development and quality control
Anti-mCD103 M290 (BioXCell; #BE0026), IgG2a isotype control (BioXCell; #BE0089), hCD103.01A and hCD103.05A were incubated with a sevenfold, fivefold, fourfold, and fourfold molar excess of TFP-N-Suc-desferal-Fe (Df, ABX, Hamburg, Germany), respectively. Subsequent 89Zr-labeling was performed as described earlier (53) using clinical grade 89Zr (Perkin Elmer, Groningen, The Netherlands).
Maximal attainable specific activity was determined using varying amounts of 89Zr per mg antibody ranging between 250 and 1000 MBq/mg. Radiochemical purity (RCP) was assessed by trichloroacetic acid precipitation test. Df-mAb conjugates were checked for aggregation and fragmentation by size exclusion ultraperformance liquid chromatography (SE-UPLC). The Waters SE-UPLC system was equipped with a dual wavelength absorbance detector, in-line radioactivity detector and TSK-GEL G3000SWXL column (JSB, Eindhoven, The Netherlands).
Animal studies
For mCD103 PET imaging male healthy C57BL/6JOlaHsd mice (Envigo, The Netherlands) were used. For microPET imaging, mice (n=3 per group) were injected intravenously via the penile vein with 89Zr-mCD103 or 89Zr-isotype control (For hCD103 PET imaging male nude mice (BALB/cOlaHsd-Foxn1nu, Envigo, The Netherlands) were subcutaneously (sc) inoculated with CHO.K1 or CHO.CD103 (5*106 in 300 µL 1:1 PBS and high growth factor Matrigel (BD Biosciences, Breda, The Netherlands)). Xenografts were allowed to grow to at least 200 mm3. For microPET imaging, mice (n=3 per group) were injected iv via the penile vein with 89Zr-CD103.01A or 89Zr-CD103.05A. MicroPET scans were made 1, 3 and 6 days post injection (pi) using a Focus 220 PET scanner (CTI Siemens), followed by ex vivo biodistribution analysis after the final scan.
Scans were reconstructed and in vivo quantification was performed using AMIDE (V.1.0.4, Stanford University, Stanford, California, USA). MicroPET data are presented as mean standardized uptake value (SUVmean). Region of interests (ROI) were drawn for tumor based on ex vivo weight, assuming 1 g/mL tissue density. For blood pool measurements, a fixed-sized sphere was drawn in the center of the heart, for liver and spleen a fixed-sized ellipsoid ROI was drawn in representative parts of the organs. After the final scan, mice were sacrificed and organs of interest collected for biodistribution studies. Organs and standards of the injected tracer were counted in a calibrated well type LKB-1282-Compu-gamma system (LKB WALLAC) and weighed. After decay correction, ex vivo tissue activity was expressed as the percentage of injected dose per gram tissue (%ID/g).
Statistics
Data are expressed as mean±SD unless otherwise stated. Statistical analyses were performed in GraphPad Prism V.7.0 (GraphPad Software) using the Mann-Whitney U test (two groups, non-parametric) or a Kruskal-Wallis test followed by Dunn’s multiple comparison test (>2 groups, non-parametric).
Results
89Zr-mCD103 PET imaging identifies CD103-positive tissues at clinically relevant target densities
In order to demonstrate the feasibility of anti-CD103 immuno-PET to visualize CD103-postive cells at physiologically and clinically relevant target densities, we performed PET imaging in healthy, non-tumor bearing C57BL/6 mice. For this purpose, the anti-murine CD103 mAb M290 (mCD103) and an unspecific IgG2a control molecule were conjugated using the chelator TFP-N-Suc-desferal-Fe (Df) according to previously reported methods.57 Immunoreactivity of the Df-conjugated mCD103 was determined by flow cytometry using CD103-positive murine splenocytes, which showed a slight decrease compared with its unmodified counterpart (EC50: 63.9 ng/mL for M290.wt, 109.4 ng/mL for df-M290) (online supplemental figure 1). Furthermore, a specific activity of 500 MBq 89Zr/mg at a RCP of >95% was achieved without further purification and high molecular weight species were below 5%. Next, to determine tracer specificity and distribution, healthy C57BL/6 mice (n=3 per group) were injected iv with either 9.7±0.3 µg 89Zr-anti-mCD103 or 10.1±0.2 µg 89Zr-isotype control (labeled with 5 MBq 89Zr) followed by ex vivo biodistribution analysis after 6 days. PET scans at day 1, 3 and 6 showed that 89Zr-mCD103 localized to organs of the abdominal cavity, which was mainly attributed to high CD103 specific tracer uptake in in the small intestines (median: 48.3 %ID/g vs 2.6 %ID/g for isotype control), spleen (16.6 %ID/g vs 5.6 %ID/g) and mesenteric lymph nodes (112.2 %ID/g vs 6.1 %ID/g) (figure 1A,B). Analysis of ex vivo macroscopic tracer distribution in FFPE tumor tissue slices using autoradiography and IHC confirmed that 89Zr-mCD103 localized to CD103-positive tissues (figure 1C,D). Furthermore, 89Zr-mCD103 tracer uptake correlated with CD103-positive cell density.
Supplemental material

In vivo anti-mCD103 mAb microPET imaging. (A) Representative coronal 89Zr-anti-M290 and 89Zr-isotype control PET scans, 1, 3 and 6 days post tracer injection in non-tumor bearing C57BL/6 mice. (B) Ex vivo tissue biodistribution of 89Zr-anti-M290 and 89Zr-isotype control in non-tumor bearing C57BL/6 mice, 6 days post-tracer injection (median, n=3). (C) Analysis of ex vivo macroscopic tracer distribution in FFPE tumor tissue slices using autoradiography. (D) immunohistochemical CD103 staining of the small intestine, mesenteric lymph node (left) and colon (right). ALN, axillary lymph node; BLN, brachial lymph node; MLN, mesenteric lymph node.
By analyzing the density of CD103+ cells, we found that the density in mesenteric lymph nodes is around 2.20–14.53% (4.49%±2.15%), in small intestine is around 0.7–1.80% (1.10%±0.40%), and in spleen is around 0.17%–0.94% (0.60%±0.27%). By using the same method to analyze the CD103 positive cell density ratio in immunohistochemical human tumor tissues (n=120), we found that CD103+ cell density in 104 cases is over 0.6% which corresponds to the average ratio of spleen among the murine organs. In addition, the spleen seems to have the lowest density of all CD103+ organs. In circa 60% of human tumors the CD103 positive cell density is over 1.1%, which corresponds to average ratio of the murine small intestine. Taken together, 89Zr-mCD103 PET imaging identifies CD103-positive tissues at clinically relevant target densities.
Generation of human CD103 specific mAbs
The above results prompted us to generate mAbs that specifically target human CD103-positive cells to establish proof-of-concept for human CD103 PET imaging. The mAb discovery campaign yielded six different mAb candidates which were produced from hybridomas and purified. Selected hybridomas (clone 1–3 and clone 5–7) were sequenced and a phylogenetic tree was built (online supplemental figure 3), showing that amino acid sequences for all variable regions, both light (VL) and heavy variable domains (VH), are unique with different degrees of similarity. Binding characteristics were determined in CHO-K1 cell transfected with human CD103 in complex with integrin human Beta-7 and integrin Alpha-4 in complex with integrin human Beta-7. Expression of the integrin heterodimers was confirmed by commercial mAbs against human integrin CD103 (hCD103), integrin Alpha-4, and integrin Beta-7. Of note, CD103 expression in these transfectants was comparable to that observed for CD103+immune cells from mice (online supplemental figure 2). Importantly, hCD103 mAbs showed specific binding to the human CD103 domain of the integrin heterodimer hCD103/hBeta7, but no binding to hAlpha4/hBeta7 (figure 2A). Flow cytometry was used to determine whether the hCD103 mAbs cross-react with murine CD103-positive cells. Single cell suspensions of CD103 positive mouse splenocytes, were examined for expression of CD103 using a commercial anti-mouse CD103 mAb. However, the anti-human CD103 mAb clones showed no specific binding to murine CD103 (online supplemental figure 4).

Validation of novel anti-hCD103 antibodies for PET imaging. (A) Binding of anti-hCD103 mAbs to CHO cells expressing CD103/beta7 or Alpha4/beta7 integrins. (B) Gating strategy used to identify CD8+CD103+ T cells in ovarian cancer digests. (C) Binding of our anti-hCD103 mAb clones in 10 ovarian tumor digests. Cells were gated as in (B) and binding was evaluated in CD8+T cells. Each symbol represents an ovarian tumor digest. black bars indicate mean values. (D) Tumor digest was preincubated with our anti-CD103 mAbs or an isotype control mAb and subsequently incubated with a commercial fluorescently labeled anti-CD103 mAb (clone BerACT-8). (E) CD103+CD8+ T cells were preincubated with our anti-CD103 mAbs or the commercial anti-CD103 mAb (clone BerACT-8) and subsequently incubated with their fluorescently labeled counterparts to study differences in affinity and competition between the mAbs. Percentage binding of fluorescently labeled mAbs was determined using flow cytometry. Maximum binding was set at 100%. note, hCD103.02A was not fluorescently labeled and therefore not taken into account. (F) Internalization of mAb panel using indirect fluorescent staining with a secondary fluorescentlylabeled mouse anti-human antibody. (G) Internalization of mAb clone 01A and 07A after direct fluorescent labeling. mAb, monoclonal antibody; PET, positron-emission tomography.
Differential hCD103 mAb binding in tumor digests from patients with ovarian cancer
To confirm the specificity and sensitivity of hCD103 mAbs in human tissue, binding was assessed against a benchmark fluorescent commercial anti-CD103 mAb (clone BerACT8) routinely used in flow cytometry using 10 independent ex vivo human tumor digests from ovarian cancer patients. hCD103 mAbs readily identified the CD103+ CD8+ T cell subpopulation at frequencies comparable to that observed for the commercial anti-CD103 mAb (figure 2B,C, (online supplemental figure 5). In line with published data, no binding to CD33+ (myeloid) cells and low binding to CD4+ T cells was detected in these digests, mAb binding to the CD103+ CD8+ T cell subpopulation was highest for clone 01A, whereas clone 03A showed the lowest binding (online supplemental figures 5 and 6).
CD103 mAb competition assays
Competition assays revealed that binding of most hCD103 mAbs, except clone 06A, inhibited binding of the commercial anti-CD103 mAb BerACT8 and vice-versa, indicating binding to the same target (figure 2D,E). Nevertheless, differences in binding characteristics were observed. Clone 01A and 02A blocked binding of most other mAb clones, whereas clone 05A, 06A, and 07A did not, suggesting distinct binding epitopes. In addition, fluorescently labeled 05A, 06A, and 07A even showed binding after presaturation with the same clone, indicating lower binding affinities. Considering the lower binding ability of clone 03A, it was not included in the binding analysis. Clone02 could not be directly fluorescently labeled, and was therefore only used in blocking experiments.
CD103 mAb internalization and dissociation experiments
Flow cytometry was used to determine the amount of internalization and dissociation of the hCD103 mAbs. Ex vivo expanded CD103+CD8+ T cells were preloaded with hCD103 mAbs on ice and subsequently incubated for 4 hours incubation at 37°C. After 4 hours, clone 01A, 02A, and 05A showed high levels of remaining mAbs at the cell surface, whereas clone 06A and 07A showed a strong decrease (figure 2F). A decrease could indicate internalized CD103-mAb complexes or dissociated mAb. Performing the same experiment using fluorescently labeled 01A and 07A clones showed that the strong decrease in remaining 07A mAb at the cells surface was due to dissociation (figure 2G). Of note, CD103 cells surface levels were only marginally changed by the incubation with mAbs.
Effects of anti-CD103 mAbs on CD103+ T cell adhesion
CD103 binds E-cadherin expressed on epithelial cells, thereby promoting retention of TRM cells in epithelial tissues.58 To determine whether our hCD103 mAbs interfere with the E-cadherin-CD103 interaction we assessed binding of ex vivo expanded CD103+ T cells to plate bound recombinant E-cadherin. CFSE labeled CD103+ T cells were either; (1) pretreated with mAbs for 30 min and subsequently incubated for 30 min in E-cadherin coated wells to determine whether mAbs interfere with de novo interactions or (2) incubated in E-cadherin coated wells for 30 min followed by 30 min treatment with mAbs to determine whether the mAbs could interfere with existing interactions. The commercial CD103 mAb clones BerACT8 and MCA708, which are known to block the E-cadherin-CD103 interaction, strongly inhibited T cell adhesion under both treatment conditions (figure 3A). From our mAb panel, hCD103 mAb clone 01A, 02A, 03A and 07A showed the strongest inhibition of T cell binding, whereas 06A partially inhibited the binding to E-cadherin. Interestingly, clone 05A was the only clone that did not interfere with CD103 mediated T cell adhesion. As described above, clone 03A showed the weakest binding to CD103 but was still capable of inducing a strong inhibition of T cell adhesion.

CD103+T cell adhesion assays. (A) CD103+T cells were labeled with CFSE either preincubated with 10 µg/mL antibody for 30 min on ice followed by incubation in E-cadherin coated wells for 30 min at 37°C (upper panel) or cells were directly transferred to E-cadherin coated wells for 30 min at 37°C followed by 10 µg/mL antibody treatment for 30 min at 37°C (lower panel). (B) Binding of CFSE labeled CD103+T cells to A549 wild-type and E-cadherin knock-out cells after 60 min incubation at 37°C. ****p<0.0001. (C) CFSE labeled CD103+T cells were preincubated with 10 µg/mL antibody for 30 min on ice followed by incubation in A549 wild-type and E-cadherin knock-out cell seeded wells for 60 min at 37°C. Bound T cells were quantified using Image J software analysis. CFSE, carboxyfluorescein diacetate succinimidyl ester.
Next, we wondered whether our anti-CD103 mAbs interfere with the binding of CD103+ T cells to tumor cells. To test the influence of hCD103 mAbs on T cell binding in the absence of E-cadherin, CDH1 (encoding E-cadherin) was knocked out in A549 via CRISPR/Cas9-mediated mutagenesis. E-cadherin KO resulted in a significant reduction in CD103+ T cell adhesion (p<0.0001), however only hCD103 07A slightly reduced T cell adhesion to A549 wild-type as well as E-cadherin-knockout cells (p=0.2562) (figure 3B,C). Taken together, these results indicate that our hCD103 antibodies have differential effects on the E-cadherin-CD103 interaction without major effects on binding of CD103+ T cells to tumor cells.
89Zr-hCD103.01A and89Zr-hCD103.05A tracer development and in vivo hCD103 microPET imaging
For further tracer development, we selected clone 01A and 05A based on strong binding to the CD103+ CD8+ T cell subpopulation in tumor digests, non-overlapping binding epitopes and differential CD103 blocking properties (table 1). Similar to the murine CD103 PET tracer, radiolabeling of hCD103.01A and hCD103.05A was achieved using the Df chelator with a final protein-to-chelator ratio of 1:2.4 for both mAbs (figure 4A). CD103 binding affinity of the two Df-conjugated anti-CD103 mAbs was similar to their unmodified counterparts (figure 4B). In addition, both the Df-conjugated mAbs achieved a specific activity of 500 MBq 89Zr/mg at a RCP of >95%, without further purification (figure 4C). In vitro, 89Zr-hCD103.01A and 89Zr-hCD103.05A showed specific binding to a CD103 transfected CHO-K1 model cell line (CHO.CD103), but not to CHO-K1 wild type cells (CHO.WT) (figure 4D).
Summary of hCD103.mAb properties used as clone selection criteria

Quality control of 89Zr-anti-CD103 mAbs for in vivo imaging. (A) SE-UPLC chromatograms of hCD103.01A and hCD103.05A conjugated with the chelator TFP-N-Suc-desferal-Fe using ultraviolet detection at 280 nm (protein) and 430 nm (Fe3+). Left panel shows chromatograms of Unpurified reaction mixtures (mAb and TFP-N-Suc-desferal-Fe chelator) and right panel—purified mAb by vivaspin concentrators. (B) Binding of Df-conjugated anti-CD103 mAbs to the CD103 transfected CHO-K1 cell line was assessed using cell-based ELISA. (C) Radiochemical purity of 89Zr-anti-CD103 mAbs was determined by 30% trichloroacetic acid (TCA) precipitation. Radioactivity was measured using a gamma-counter. (D) Binding of 89Zr-anti-CD103 mAbs to CD103 transfected CHO-K1 cells and CHO-K1 wild-type cells. Radioactivity was measured using a gamma-counter. mAb, monoclonal antibody; SE-UPLC, size exclusion ultraperformance liquid chromatography.
Next, to study whether 89Zr-hCD103 mAb PET imaging can visualize CD103 in vivo, male nude mice (BALB/cOlaHsd-Foxn1nu) were sc inoculated with CHO.CD103 or CHO.WT. CD103 membrane expression in our CHO.CD103 is comparable to CD103 expression in human CD3+CD8+ cells. (online supplemental figure 7). Xenografts were allowed to grow to at least 200 mm3. For microPET imaging, xenograft-bearing mice (n=3 per group) were injected intravenously via the penile vein with 10.4±0.5 µg 89Zr-hCD103.01A or 10.1±0.5 µg 89Zr-hCD103.05A (labeled with 5 MBq 89Zr). MicroPET scans were made 1, 3 and 6 days postinjection using a Focus 220 PET scanner, followed by ex vivo biodistribution analysis after the final scan. PET scans of CHO.CD103 tumor bearing mice showed that both 89Zr-hCD103.01A and 89Zr-hCD103.05A tumor uptake increased over time, with highest tumor and least background tissue uptake observed at day 6 postinjection (median of the group in which SUVmean was assessed per animal tumor: 2.7, median SUVmean blood: 0.9 for 89Zr-hCD103.01A and median SUVmean tumor: 3.0, median SUVmean blood: 0.9 for 89Zr-hCD103.05A) (figure 5A). 89Zr-hCD103.01A showed no accumulation in CHO.WT xenografts (median SUVmean tumor: 1.5, median SUVmean blood: 1.4), which was used as an unspecific control group. Tumor-to-blood ratios of 89Zr-hCD103.01A and 89Zr-hCD103.05A increased over time at similar levels and were significantly higher than the unspecific control group (p<0.0001 at day 6) (figure 5B). Similarly, ex vivo biodistribution analysis on day 6 showed high CD103 specific 89Zr-hCD103.01A and 89Zr-hCD103.05A tumor uptake for CHO.CD103 (17.0% and 32.8% of injected dose per gram tissue (%ID/g), respectively) vs 7.8 %ID/g for 89Zr-hCD103.01A in CHO.WT) (figure 5C). Tumor-to-blood ratios of 89Zr-hCD103.01A and 89Zr-hCD103.05A were comparable and were significantly higher than the unspecific control group (89Zr-hCD103.01A: p<0.01, 89Zr-hCD103.05A; p<0.05) and no major sink organs were observed (figure 5C,D).

In vivo 89Zr-anti-hCD103.01A and 89Zr-anti-hCD103.05A microPET imaging. (A) Representative coronal 89Zr-anti-hCD103.01A and 89Zr-anti-hCD103.05A PET scans, 1, 3 and 6 days post-tracer injection in CHO.CD103. CHO.WT xenografted mice were injected with 89Zr-anti-CD103.01A as an unspecific control group (left). In vivo 89Zr-anti-hCD103.01A and 89Zr-anti-hCD103.05A tumor and blood pool levels, 1, 3 and 6 days post-tracer injection, are expressed as SUVmean(right). Data points are mean±SD (n≥3). (B) Corresponding tumor-to-blood ratios based on SUVmean. *p<0.05, **p<0.01, ****p<0.0001 compared with CHO.wt. (C) Ex vivo tumor uptake in %ID/g and tumor-to-blood ratios of 89Zr-anti-hCD103.01A and 89Zr-anti-hCD103.05A in CHO.CD103 and CHO.WT xenografted mice (median, n=3). *p<0.05, **p<0.01 compared with CHO.wt. (D) Ex vivo tissue uptake in %ID/g (left) and tissue-to-blood ratios (right) of 89Zr-anti-hCD103.01A and 89Zr-anti-hCD103.05A in CHO.CD103 and CHO.WT xenografted mice (median, n=3). PET, positron-emission tomography; SUVmean, mean standardized uptake value.
Discussion
This study establishes proof of concept of CD103 PET for potential non-invasive assessment of cancer-reactive TILs. We demonstrated the feasibility of anti-CD103 immuno-PET to visualize CD103-postive cells at physiologically and clinically relevant target densities. In vitro, by screening a panel of six unique in-house developed anti-hCD103 mAb clones we selected two clones as most optimal tracer candidates for hCD103 PET imaging development. In vivo, both 89Zr-hCD103.01A and 89Zr-hCD103.05A showed high target-to-background ratios, high target site selectivity and a high sensitivity in hCD103-positive xenografts.
Using an 89Zr-labeled mCD103 antibody, we found remarkable high specific tracer uptake in the abdominal cavity of healthy C57BL/6 mice, which was mainly attributed to the small intestine and mesenteric lymph nodes. Comparing autoradiography and mCD103 IHC revealed that mCD103 tissue tracer uptake correlated with CD103 density. This shows that CD103 PET imaging can discriminate between low and high CD103 expressing tissues and, as such, might be able to visualize CD103+ TIL load at a wide range of cell densities important to sensitively assess lesion heterogeneity and cancer immunotherapy response in patients.
In the human setting, CD103 is mainly found on CD8+ TRM in mucosal tissues such as the lower gastrointestinal tract and lungs.59 Although CD103 is expressed on several subset of T cells and in dendritic cells, the majority of CD103+T cells in tumors have been shown to be CD8+T cells.60 61 Using pan T cell (CD3) IHC on tissue sections from healthy C57BL/6 mice we observed that CD103 mainly colocalized with T cells in the spleen and lymph nodes, in line with previous studies.62 However, in the small intestines, CD103 was highly abundant, whereas T cells were mostly absent, indicating that these CD103-positive cells are not TRM, but most likely dendritic cells.63 The absence of TRM cells in intestinal tissues shows that these mice do not reflect all relevant aspects of the human immune system, mainly due to the fact that inbred laboratory mice do not recapitulate exposures to pathogens as in humans. Indeed, outbred ‘dirty’ mice more closely resemble adult humans by having abundant TRM populations in lymphoid and nonlymphoid tissues.64 Therefore, it might be of interest to further explore mCD103 PET imaging in outbred models.
Radiotracers are administered at small dose which might not noticeably influence the pharmacodynamics or pharmacokinetics of the process being imaged. However, antibodies targeting T cell markers should be used with caution for diagnostic imaging purposes. Recent preclinical studies have demonstrated the impairment of T-cell functions when using antibodies for T-cell imaging.50 65 Due to their bivalent properties and interaction with specific Fc receptors, these molecules can potentially trigger antigen crosslinking or cell-mediated cytotoxic effector functions. To minimize the risk of depleting T cells, IgG Fc optimization that silences FcγR binding, or antibody derivatives such as Fab fragments and F(ab')2 fragment can be chosen.
Even without depleting properties, antibodies might still impair T cell function by inhibiting ligand-receptor interactions. The only known ligand for CD103 is the epithelial surface molecule E-cadherin. This interaction is thought to be responsible for retention of tumor reactive cytotoxic T cells and might promote CTL activity.66 Because it is currently unknown whether a tracer dose would have an impact on CD103+ T cell functionality we investigated whether our human mAb clones interfered with this interaction. From our mAb panel, hCD103.05A was the only clone that did not interfere with the recombinant E-cadherin-CD103 interaction, but was still capable of strong binding to CD103 and as PET tracer showed high specific binding to hCD103 positive xenografts. This makes 89Zr-hCD103.05A the preferred candidate for future human CD103 PET imaging. Interestingly, using E-cadherin positive tumor cell-CD103+ T cell co-cultures we showed that none of our hCD103 mAb panel had major effects on CD103+ T cell binding to tumor cells. In addition, in patients, no clear correlations have been found between tumor E-cadherin expression on IHC and CD103+ TIL infiltration.67 This, together with our findings, indicates that retention of CD103+ TILs is possibly determined by factors other than E-cadherin.
Preclinically, the applicability of monitoring TIL infiltration with PET imaging has already been described in preclinical models using tracers targeting the T cell surface markers CD3, CD4 and CD8. These tracers were able to predict response to immunotherapy.49 68 69 Interestingly, a comparative evaluation of 89Zr-DFO-CD4 vs 89Zr-DFO-CD8 PET imaging showed that 89Zr-DFO-CD4 was more effective in stratifying mice into PD-1 checkpoint inhibitor responders and non-responders.69 This indicates that it will still require considerable effort in the near future to determine the most optimal TIL PET imaging biomarker for future clinical use. Currently, anti-CD8 imaging agents are investigated in patients before and during treatment with checkpoint inhibitors (NCT04029181, NCT03802123). Such studies will provide information on whether TIL PET imaging is a feasible strategy in humans to monitor cancer immunotherapy. Due to limited CD103 expression on circulating immune cells and high specificity to cancer reactive TILs, CD103 PET imaging might have superior qualities in determining response to immunotherapy than the above-mentioned PET tracers.
In conclusion, the highly sensitive murine CD103 imaging approach described here might be a useful tool for determining CD103+ status in preclinical syngeneic tumor models and aid in designing new treatment strategies with immunotherapy. Furthermore, we developed and validated the specificity of two novel hCD103 immuno-PET tracers, 89Zr-hCD103.01A, and 89Zr-hCD103.05A, for future non-invasive assessment of cancer reactive T cell infiltration. Clinically, CD103 PET imaging has the potential to select patients more likely to benefit from immunotherapy and thereby spare patients unlikely to respond from unnecessary immune-related side effects.
Data availability statement
All data relevant to the study are included in the article or uploaded as online supplemental information.
Ethics statements
Patient consent for publication
Ethics approval
Animal experiments were approved by the Institutional Animal Care and Use Committee of the University of Groningen (IvD-16395-01-011).
References
Supplementary materials
Supplementary Data
This web only file has been produced by the BMJ Publishing Group from an electronic file supplied by the author(s) and has not been edited for content.
Footnotes
AK and XF contributed equally.
Contributors MdB, HWN, PHE and HVE conceived the project. AK, SMJvD, HVE and MdB designed all the experiments. AK, XF, MAW, SMJvD, DG and AP performed the in vitro experiments. AK, XF and MAW performed the animal experiments. AK, XF and MdB performed data analyses. AK, XF and MdB wrote the manuscript with input from MAW, HVE, PHE and HVE. MdB acts as guarantor for the work. All authors reviewed and approved the manuscript.
Funding The collaboration project is financed by the Ministry of Economic Affairs by means of the PPP Allowance made available by the Top Sector Life Sciences & Health to stimulate public-private partnerships (LSHM18073).
Competing interests AK, SMJvD, HVE, HWN and MdB are coinventors on a patent owned by Aduro Biotech and University Medical Center Groningen that describes antibodies targeting CD103, with a focus on potential imaging applications (patent no. 62/704,258).
Provenance and peer review Not commissioned; externally peer reviewed.
Supplemental material This content has been supplied by the author(s). It has not been vetted by BMJ Publishing Group Limited (BMJ) and may not have been peer-reviewed. Any opinions or recommendations discussed are solely those of the author(s) and are not endorsed by BMJ. BMJ disclaims all liability and responsibility arising from any reliance placed on the content. Where the content includes any translated material, BMJ does not warrant the accuracy and reliability of the translations (including but not limited to local regulations, clinical guidelines, terminology, drug names and drug dosages), and is not responsible for any error and/or omissions arising from translation and adaptation or otherwise.