Article Text

Abstract
Background Immunotherapy in high-risk neuroblastoma (HR-NBL) does not live up to its full potential due to inadequate (adaptive) immune engagement caused by the extensive immunomodulatory capacity of HR-NBL. We aimed to tackle one of the most notable immunomodulatory processes in neuroblastoma (NBL), absence of major histocompatibility complex class I (MHC-I) surface expression, a process greatly limiting cytotoxic T cell engagement. We and others have previously shown that MHC-I expression can be induced by cytokine-driven immune modulation. Here, we aimed to identify tolerable pharmacological repurposing strategies to upregulate MHC-I expression and therewith enhance T cell immunogenicity in NBL.
Methods Drug repurposing libraries were screened to identify compounds enhancing MHC-I surface expression in NBL cells using high-throughput flow cytometry analyses optimized for adherent cells. The effect of positive hits was confirmed in a panel of NBL cell lines and patient-derived organoids. Compound-treated NBL cell lines and organoids were cocultured with preferentially expressed antigen of melanoma (PRAME)-reactive tumor-specific T cells and healthy-donor natural killer (NK) cells to determine the in vitro effect on T cell and NK cell cytotoxicity. Additional immunomodulatory effects of histone deacetylase inhibitors (HDACi) were identified by transcriptome and translatome analysis of treated organoids.
Results Drug library screening revealed MHC-I upregulation by inhibitor of apoptosis inhibitor (IAPi)- and HDACi drug classes. The effect of IAPi was limited due to repression of nuclear factor kappa B (NFκB) pathway activity in NBL, while the MHC-I-modulating effect of HDACi was widely translatable to a panel of NBL cell lines and patient-derived organoids. Pretreatment of NBL cells with the HDACi entinostat enhanced the cytotoxic capacity of tumor-specific T cells against NBL in vitro, which coincided with increased expression of additional players regulating T cell cytotoxicity (eg, TAP1/2 and immunoproteasome subunits). Moreover, MICA and MICB, important in NK cell cytotoxicity, were also increased by entinostat exposure. Intriguingly, this increase in immunogenicity was accompanied by a shift toward a more mesenchymal NBL cell lineage.
Conclusions This study indicates the potential of combining (immuno)therapy with HDACi to enhance both T cell-driven and NKcell-driven immune responses in patients with HR-NBL.
- Neuroblastoma
- Immunotherapy
- T-Lymphocytes
- Immunity, Cellular
- Killer Cells, Natural
Data availability statement
Data are available upon reasonable request. The data that support the findings of this study are available on request from the corresponding author (SN). The data are not publicly available due to privacy restrictions.
This is an open access article distributed in accordance with the Creative Commons Attribution Non Commercial (CC BY-NC 4.0) license, which permits others to distribute, remix, adapt, build upon this work non-commercially, and license their derivative works on different terms, provided the original work is properly cited, appropriate credit is given, any changes made indicated, and the use is non-commercial. See http://creativecommons.org/licenses/by-nc/4.0/.
Statistics from Altmetric.com
WHAT IS ALREADY KNOWN ON THIS TOPIC
Absence of major histocompatibility complex class I (MHC-I) surface expression on neuroblastoma (NBL) tumors is recognized as a major limitation in cytotoxic T cell-mediated cytotoxicity against the tumor. MHC-I expression can be induced by cytokine-driven immune modulation and has been shown to direct T cell cytotoxicity to NBL. The broad range of biological activities of these cytokines limits their therapeutic applicability due to severe toxicities.
WHAT THIS STUDY ADDS
Here we identified treatment with HDAC inhibitors (HDACi) as a pharmacological strategy to upregulate MHC-I expression in NBL. Increased antitumor immunity was observed via both T cell-mediated and natural killer cell-mediated effector mechanisms.
HOW THIS STUDY MIGHT AFFECT RESEARCH, PRACTICE OR POLICY
This study substantiates the combination of (immuno)therapy with HDACi as a potential strategy to enhance T cell-mediated antitumor cytotoxicity and induce immunological memory formation to prevent future relapse and improve outcome for children suffering from high-risk NBL.
Introduction
Immune surveillance by the immune system is essential to prevent the development and progression of neoplastic cells into cancer. Various innate and adaptive players are involved in this process, of which cytotoxic T cells are particularly well equipped.1 Cytotoxic T cells recognize their target in major histocompatibility complex class I (MHC-I), a protein expressed on all postembryonic nucleated cells. This way, cytotoxic T cells sense and act on intracellular changes, for example caused by viral infection or malignant transformation. However, tumor cells can escape recognition by and cytotoxicity of T cells via a range of mechanisms.
One well-known T cell escape mechanism of cancer cells is the dysregulation of surface expression of MHC-I, a process described in 40%–90% of human tumors and often correlated with poor prognosis.2 Lack of MHC-I expression can either result from MHC-I downregulation, which occurs through a survival advantage of cells lacking MHC-I, or an intrinsic lack of MHC-I expression due to tumor origin. MHC-I downregulation can often be found in adult tumors and can be caused by irreversible, genetic aberrations as well as by reversible, (post)transcriptional modifications.2 Intrinsic lack of MHC-I expression is often observed in pediatric tumors that arise from embryonic tissues lacking immunological features, of which neuroblastoma (NBL) is a well-known example.3 Intrinsic lack of MHC-I expression is mostly reversible and results from epigenetic and/or (post)transcriptional processes. The intrinsic reversible nature provides an opportunity to restore MHC-I expression and facilitate anti-tumor T cell cytotoxicity against NBL.4 5
NBL is an embryonal tumor derived from the sympathoadrenal progenitor cells of the developing sympathetic nervous system. It is the most common pediatric extracranial solid tumor and accounts for ~15% of all worldwide pediatric oncology deaths.6 NBL cells can either be of the mesenchymal cell lineage (defined by lineage markers including PRRX1, FOSL1, and FOSL2) or the adrenergic cell lineage (defined by lineage markers including PHOX2B, DBH, and TH).7 8 It has recently been shown that mesenchymal cells show more immunogenic features.9 Despite intense multimodal therapy, including maintenance immunotherapy consisting of anti-GD2 monoclonal antibody and isotretinoin, 5-year event-free survival of patients with high-risk neuroblastoma (HR-NBL) is still ~50%.6 10 The additive effect of the immunotherapy regimen,11 12 despite the low immunogenicity of HR-NBL,13 however, shows the potential of immunotherapy in NBL.
We hypothesize that the clue to further enhance (immuno)therapy efficacy in HR-NBL is to effectively engage T cells, thereby enhancing antitumor cytotoxicity and creating immunological memory to prevent future relapse. MHC-I unrestricted T cell engaging strategies, like chimeric antigen receptor (CAR) T cell therapy, are tested in NBL to bypass the need for tumoral MHC-I expression; however, the current observed clinical benefit is limited.13 We have previously shown that MHC-I expression on NBL cells can be readily upregulated by cytokine-driven immune modulation, thereby directing T cell cytotoxicity to NBL.4 5 14 Nonetheless, even though results from a pilot clinical trial administering interferon gamma (IFN-γ) to patients with HR-NBL were encouraging,14 15 the broad range of biological activities of these cytokines limits their therapeutic applicability due to severe toxicities.2 Therefore, we here aimed to identify pharmacological repurposing strategies to upregulate MHC-I expression and therewith enhance T cell immunogenicity in NBL.
Materials and methods
Cell culture
LAN5, SHEP21N, SK-N-SH, and IMR32 were obtained from the Princess Maxima Center for Pediatric Oncology, GIMEN via the Academic Medical Center of Amsterdam. GIMEN nuclear factor kappa B (NFκB) reporter cells and N4BP1 KO SK-N-SH were generated as described previously.16 GIMEN and IMR32 were maintained in DMEM, LAN5 and SHEP21N in RPMI, both supplemented with Glutamax, 10% FCS (Sigma-Aldrich), 1% penicillin/streptomycin (P/S) (50 U/mL), and 2% non-essential amino acids (both Life Technologies). LAN5, SK-N-SH, and IMR32 were previously identified as adrenergic, GIMEN and SHEP21N are from the mesenchymal cell lineage.9
Patient-derived NBL organoids were established as described previously.17 Organoids were maintained in DMEM low glucose, Glutamax-supplemented medium, supplemented with 25% HAM’s F-12 Nutrient Mix, 2% B-27 supplement minus vitamin A, 1% N-2 Supplement, 1% P/S (all Life Technologies), 20 ng/mL Animal-Free Recombinant Human-EGF, 40 ng/mL FGF-basic, 200 ng/mL IGF-I, 10 ng/mL PDGF-AA, and 10 ng/mL PDGF-BB (all Peprotech). Once a week, spheres were disrupted using Accutase (Sigma Aldrich) and pipetting and subcultured to avoid overcrowding and necrosis in the organoid cores. A half media change was performed biweekly. An overview of organoid characteristics can be found in table 1; all organoids reflect a more adrenergic cell lineage (online supplemental file 1).
Supplemental material
Genetic characteristics of the patient-derived organoids
Drug repurposing libraries screening
Two repurposing libraries were screened on their effect on MHC-I surface expression in NBL: the Center for Drug Design & Discovery (CD3) Repurposing Library, containing 3700 mainly Food and Drug Administration-approved drugs, and our Pediatric Cancer Library, comprising 194 drugs with implications in pediatric cancer treatment. The CD3 library is stored at −20°C in 384LDV plates (Labcyte), the pediatric cancer library in 384-well plates (Corning) at room temperature under N2 pressure.
Drug screening was performed using a GIMEN NFκB reporter line using a previously established high-throughput flow cytometry-based screening workflow.18 The Pediatric Cancer Library was screened at a concentration range between 0.01 μM and 10.0 μM, the CD3 repurposing library at 300 and 3 μM. The Pediatric Cancer library was added 4 hours after cell seeding using the Biomek i7 Hybrid (Beckman Coulter) and incubated for 48 hours before MHC-I expression analysis. The CD3 repurposing library was prespotted in empty 384-well plates using ECHO 520 acoustic droplet ejection (Labcyte). Reporter cells were added to these wells and incubated for 48 hours before MHC-I expression analysis. Vehicle-treated cells (DMSO) were used as a negative control, two cytokines with a known effect on MHC-I expression, IFN-γ (R&D, 1000 U/mL) and tumor necrosis factor alpha (TNF-α) (Miltenyi Biotec, 50 ng/μL), were used as positive controls. Conditions were omitted from analysis when single cell count was <500 to avoid false positivity due to toxicity. Unstained control cells of hits were analyzed to rule out false positivity due to autofluorescence. An incubation period of 48 hours was chosen based on experience of CD3; kinetics were later validated for positive hits (online supplemental figure 10). During this experiment, cells were incubated for 48 hours with indicated drug concentrations, after which media were refreshed. MHC-I expression was determined at indicated time points.
Validation of hits and determination of surface protein expression
Hits from the initial screen were diluted in DMSO (Sigma Aldrich) at a concentration of 10 mM and stored in aliquots at −80°C to avoid freeze–thaw cycles (all SelleckChem). Respective cells and organoids were cultured for 48 hours with indicated concentrations of the drugs, after which cell-surface expression of proteins of interest was determined by flow cytometry. Decreased expansion of cells was observed when cultured with entinostat, viability was not significantly affected. Assembled MHC-I complexes were determined with the pan HLA-ABC AF647/FITC antibody (W6/32); other used antibodies include anti- MICA/MICB PE/Cy7 (6D4), HLA-E APC (3D12), HLA-DP/DQ/DR FITC (Tu39), PVR PE (SKII.4) (all BioLegend), PD-L1 BV650 (MIH1, BD Biosciences), B7H3 PerCP/eFluor710 (7–517, Life Technologies), and Nectin-2 APC (R2.525, Ebioscience). Antibody panels were combined with 7-AAD (BD Biosciences) or the Fixable Viability eFluor 780 Dye (eBioscience) to select viable cells. Analysis was performed on a BD FACSCanto or LSRFortessa (BD Biosciences).
CS&T beads (BD Biosciences) were used to check the performance and verify the optical path and stream flow of the used flow cytometers. This procedure enables controlled standardized results and allows the determination of long-term drifts and incidental changes within the flow cytometer. No changes were observed which could affect the results.
Generation of PRAMESLLQHLIGL-directed T cells
The HLA-A2-restricted preferentially expressed antigen of melanoma (PRAME) HSS1 T cell clone (specific against SLLQHLIGL) was described previously19; the TCR sequence was derived from patent US20160263155A1. A furin cleavage site was inserted upstream of the T2A sequence linking the TCR beta and alpha chains. The gene was synthesized (Genscript) and cloned into the pCCL-cPPT-hPGK-ORF-bPRE4-SIN lentiviral transfer vector.20 Lentiviral particles were produced using standard calcium phosphate transfection (Clontech) of HEK-293T cells with the pMDL-g/pRRE, pMD2-VSVg, and pRSV-Rev plasmids.21 22 Transducing units per millilitre of concentrated vector batches were determined using serial dilution on Jurkat cells followed by flow cytometric analysis of Vβ1 expression (anti-Vβ1 FITC (REA662, Miltenyi)).
CD8+ T cells were separated from peripheral blood of healthy donors, stimulated, and transduced at a multiplicity of infection of 10 according to a previously described protocol.20 Following transduction, cells were FACS-sorted on Vβ1 expression (BD FACSAria II), after which they are stimulated once every other week using a rapid expansion protocol in cytotoxic T lymphocyte (CTL) medium.23
T cell activation assay
HLA-A2 haplotype confirmed NBL cells, GIMEN and 691b, were incubated for 48 hours with the indicated concentrations of compounds, after which cells were washed and cocultured with NBL-specific T cells. PRAMESLLQHLIGL-directed T cells were cocultured with NBL cells overnight at an effector-to-target ratio (E:T) of 1:1 to determine the effect of preincubation with compounds of interest on T cell activation. After overnight incubation, cells were spun down and supernatants were collected to determine cytokine levels (TNF-α and IFN-γ) using ELISA according to the manufacturer’s instructions (Life Technologies). T cells were subsequently stained with Fixable Viability Dye eFluor 780 (Life Technologies), anti-CD3 BV510 (OKT3, BioLegend), anti-CD8 FITC (G42-8, BD Biosciences), and anti-CD137 PE (4B4-1, BioLegend) as a marker for antigen-specific T cell activation. Flow cytometry analysis was performed on the BD Fortessa (BD Biosciences).
T cell and NK cell cytotoxicity assay
GIMEN cells were transduced with a lentiviral construct encoding for GFP and luciferase (pSLuc2-GFP), after which they were single cell sorted based on GFP expression. Luciferase-expressing 691b organoids were generated previously.24 Luciferase-expressing targets were seeded in organoid medium and incubated for 48 hours with indicated compound concentrations. PRAMESLLQHLIGL-directed T cells were added to the target cells (CTL medium:organoid medium ratio of 1:1) and were incubated overnight at an E:T of 1:1 to determine the effect of preincubation with compounds of interest on the cytotoxic capacity of T cells. D-Luciferin Firefly (Biosynth) (150 μg/mL) was added to the cocultures and incubated for 10 min at 37°C after which luminescence was measured using Spectramax M3 (Life Technologies). Cytotoxicity was calculated by comparing luminescence of cocultured cells with target only, treatment-matched controls. MHC-I dependence was studied by incubation with 10 μg/mL of HLA-ABC antibody (W6/32, Biotechne) for an hour prior to coculture; IgG isotype (Invitrogen) was used as a control.25
The cytotoxicity protocol was adjusted to be able to also address natural killer (NK) cell cytotoxicity. Healthy-donor NK cells were prestimulated overnight with 1000 U/mL IL-2 and 50 ng/mL IL-15, after which 691b cells were cocultured for 5 hours with healthy-donor NK cells at an E:T of 1:1. The presence of entinostat in the 5-hour coculture did not affect expression of common NK-related receptors on NK cells (online supplemental figure 11).
T cell proliferation assay
Healthy-donor CD3+ T cells were pretreated overnight with 2.5 µM entinostat+50 U/mL IL-2, controls were treated with 50 U/mL IL-2 only. Cells were subsequently labeled with CellTrace Violet (CTV) and stimulated with 2.5 mg/mL PHA (or left unstimulated). After 72 hours, proliferative capacity was determined by measuring CTV dilution using flow cytometry and additional staining with anti-CD3 AF700 (UCHT1, Sony), anti-CD4 PE (RPA-T4, BD Biosciences), and anti-CD8 (SK1, BD Biosciences) on the BD Fortessa.
RNA isolation and sequencing
Organoids (691b) were treated for 48 hours with 2.5 µM entinostat. Cells were harvested and snap frozen in liquid nitrogen. Total RNA was isolated from cell lysates using TRIzol LS reagent (Life Technologies). RNA was then purified using the RNA Clean and Concentrator-5 kit (Zymo Research) and treated with DNAse I. RNA concentrations were measured on a NanoDrop One spectrophotometer (Life Technologies). RIN values were determined on a BioAnalyzer 2100 using the RNA 6000 Nano kit (Agilent), with values ranging between 9.4 and 10.0. TruSeq mRNA-seq library preparation (Illumina) and strand-specific mRNA sequencing were performed by Genewiz. Briefly, mature mRNA was selected through PolyA enrichment, and RNA-seq was performed using the Illumina NovaSeq 6000 platform in a 2×150 bp configuration. Samples were sequenced to an average depth of 136 million reads. Adapter sequences were trimmed and low-quality reads were filtered using Trimgalore V.0.6.651, which invoked Cutadapt V.3.452 and FastQC V.0.11.953. Next, reads were aligned to the human transcriptome (hg38/GRCh38.p13, Ensembl Release 102 provided in GTF format55) using STAR V.2.7.8a54 in the two-pass mapping mode. We used the default STAR settings together with the following modified parameters: --outFilterType BySJout, --outSAMunmapped Within, --outSAMattributes NH HI AS nM NM MD jM jI MC ch XS, --outSAMtype BAM SortedByCoordinate, --outFilterMismatchNmax 6, --alignSJoverhangMin 10, --outFilterMultimapNmax 10, and --outFilterScoreMinOverLread 0.75. Reads were quantified using featureCounts from the Subread V.2.0.256 software package, provided with default settings and Ensembl Release 102 annotation information for gene-level read count summarization. DESeq2 V.1.32.057 was used for read count normalization.
Derivation of gene signature scores
Based on the immune pathway signature genes,9 26 27 IA scores for all replicates were determined. All immune signature genes were ranked based on their expression levels in each replicate. The ranking order was subsequently established for each gene and the percentiles were derived for each gene on the entire list of genes. All the IA signature genes in a sample were averaged to determine the IA score for each sample. Similarly, adrenergic (A) and mesenchymal (M) scores were calculated for each sample based on the gene signatures outlined by van Groningen and colleagues.7 In total, 6 IA genes were removed from the 485-gene mesenchymal signature genes in order to ensure that IA signature genes did not overlap with predefined adrenergic and mesenchymal signatures. To further identify a sample as either adrenergic or mesenchymal, the A-score was deducted from the M-score (mesenchymal minus adrenergic (M−A) score). Samples with low M−A scores were considered more adrenergic, whereas high M−A scores were considered mesenchymal. In addition, IFN-response signatures specific to HR-NBL were determined using the SEQC-498 tumor cohort and cell lines including SH-SY5Y, LDK-resistant SH-SY5Y, and SH-EP cells, as described by Sengupta et al.9
Quantitative real-time PCR analysis
To confirm the findings observed with RNA-seq, quantitative PCR (qPCR) analysis was performed. GIMEN and 691b cells were treated for 48 hours with 5 and 2.5 µM entinostat, respectively. Cells were pelleted, RNA was extracted with the RNeasy mini extraction kit (Qiagen), and cDNA was synthesized using the RevertAid H Minus First Strand cDNA Synthesis Kit with random hexamer primers (Life Technologies). mRNA expression was subsequently quantified using the TaqMan Human Antigen Processing and Presentation by MHCs Gene Expression Array on a ViiA7 RT-PCR system (both Life Technologies). All kits were used according manufacturer’s instructions.
Data analysis and statistics
Flow cytometry data analysis was performed with FlowJo V.10.7.1; flow cytometry data are presented as percent of cells, median fluorescent intensity (MFI), or fold change in MFI. ELISA data were analyzed using MicroPlate Manager V.6 (BioRad). Graphs for flow cytometry, ELISA, and luminescence data were generated and statistics were performed using GraphPad Prism V.8.3. Heatmaps were generated using the ComplexHeatmap V.2.8.0 and the ggplot2 package from RStudio V.3.3.3.28 29
Fold changes, reflecting differences in protein expression and qPCR analysis, were logarithmically transformed, after which a one-sample t-test was performed. Differences in MFI reflecting protein surface expression, T cell activation, cytokine secretion levels, and cytotoxic capacity of cells, and differences in expression of immune signature genes were analyzed with the non-parametric Mann-Whitney U test between separate groups. P values of <0.05 were considered significant.
Results
Screening drug repurposing libraries for their effect on MHC-I expression
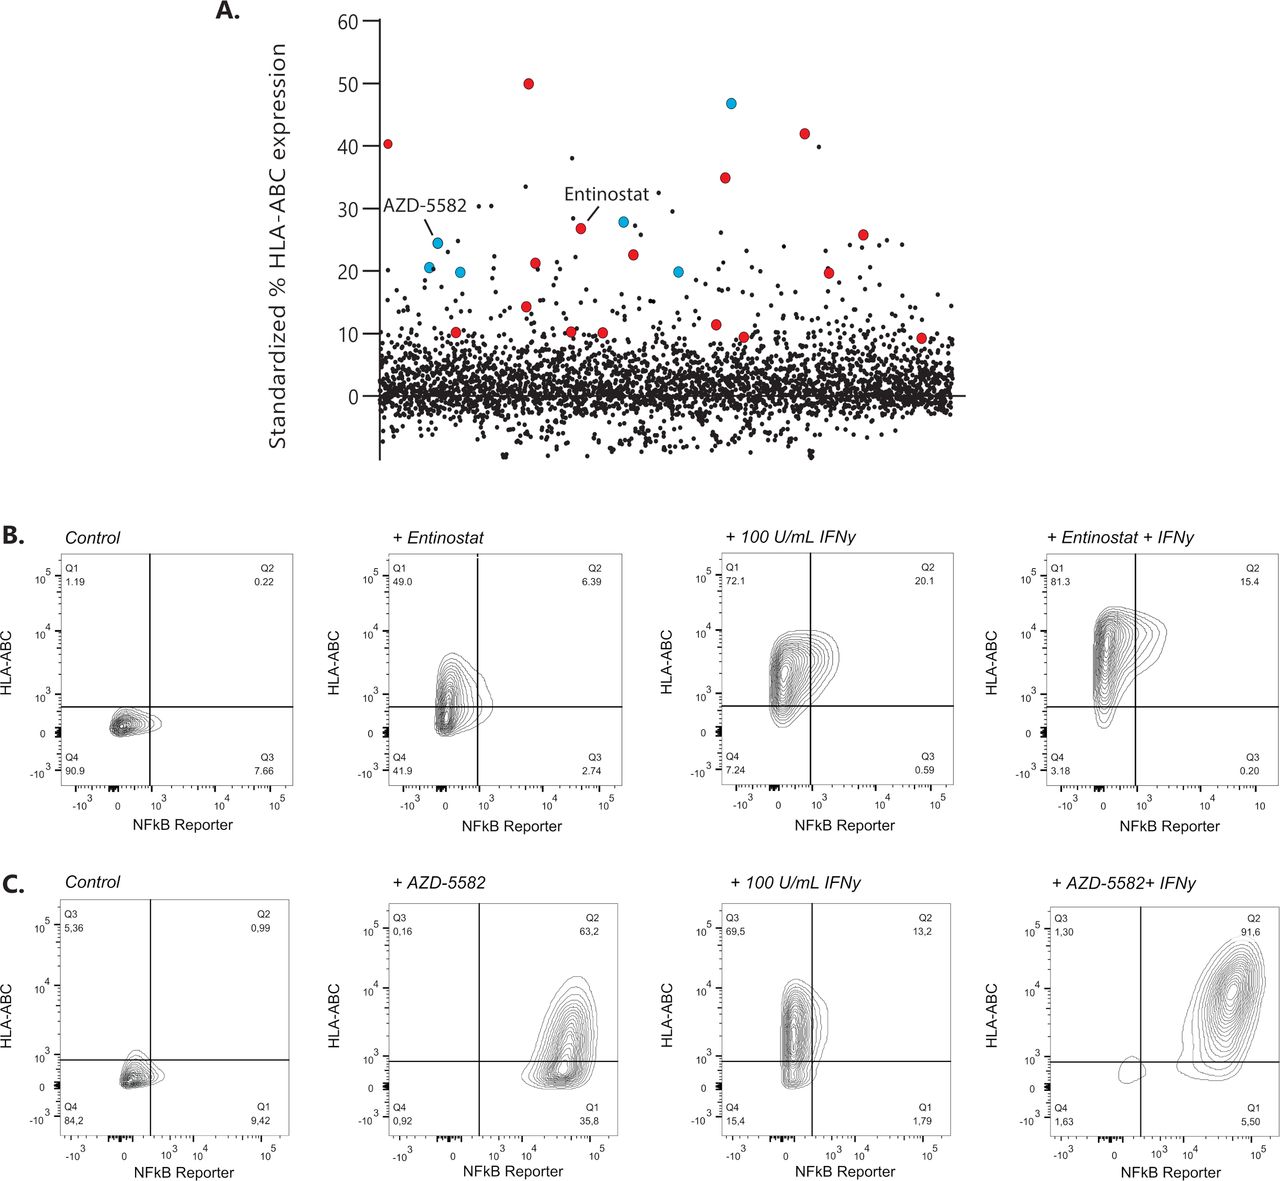
Drug repurposing libraries containing ~3800 unique compounds were tested for their ability to upregulate surface display of MHC-I in the GIMEN NBL cell line containing a NFκB reporter. The effect of compounds on MHC-I expression was evaluated after 48 hours of incubation using high-throughput flow cytometry18 (exemplary gating strategy in online supplemental figure 1). MHC-I expression of screened drugs standardized to untreated control cells is shown in figure 1A. Two groups of drugs, inhibitor of apoptosis inhibitors (IAPis) and histone deacetylase inhibitors (HDACis), were selected for further evaluation, as 16/29 HDACi (online supplemental table 1) and 6/6 screened IAPi (online supplemental table 2) increased MHC-I expression in our GIMEN NFκB reporter system.

Identification of MHC-I expression enhancing compounds in NBL. (A) Screening results of 3800 compounds are shown as standardized % of HLA-ABC expression compared with untreated control GIMEN NFκB reporter cells. Compounds marked in red are HDACis; compounds marked in blue reflect the IAPis. (B) MHC-I expression in GIMEN reporter cells treated with entinostat (5 µM) or IFN-γ (100 U/mL) as single agents and in combination (entinostat+IFN-γ). Control indicates untreated cells. (C) MHC-I expression in GIMEN reporter cells treated with AZD-5582 (250 nM) or IFN-γ (100 U/mL) as single agents and in combination (AZD-5582+IFN-γ). Control indicates untreated cells. HDACi, histone deacetylase inhibitor; IAPi, inhibitor of apoptosis inhibitor; IFN-γ, interferon gamma; MHC-I, major histocompatibility complex class I; NBL, neuroblastoma; NFκB, nuclear factor kappa B.
The data shown in this paper focus, but are not limited to (online supplemental data), the HDACi entinostat, currently tested in children with relapsed or refractory malignancies in combination with checkpoint inhibition (NCT03838042), and the IAPi AZD-5582. MHC-I upregulation by entinostat was not mediated by NFκB reporter activation (figure 1B), whereas the effect of AZD-5582 was mediated by induction of NFκB expression (figure 1C). Further increase in MHC-I expression was observed when the cells were cotreated with IFN-γ (figure 1B,C; right panels).
NFκB pathway repression inhibits the effect of IAPi on MHC-I expression in the majority of NBL models
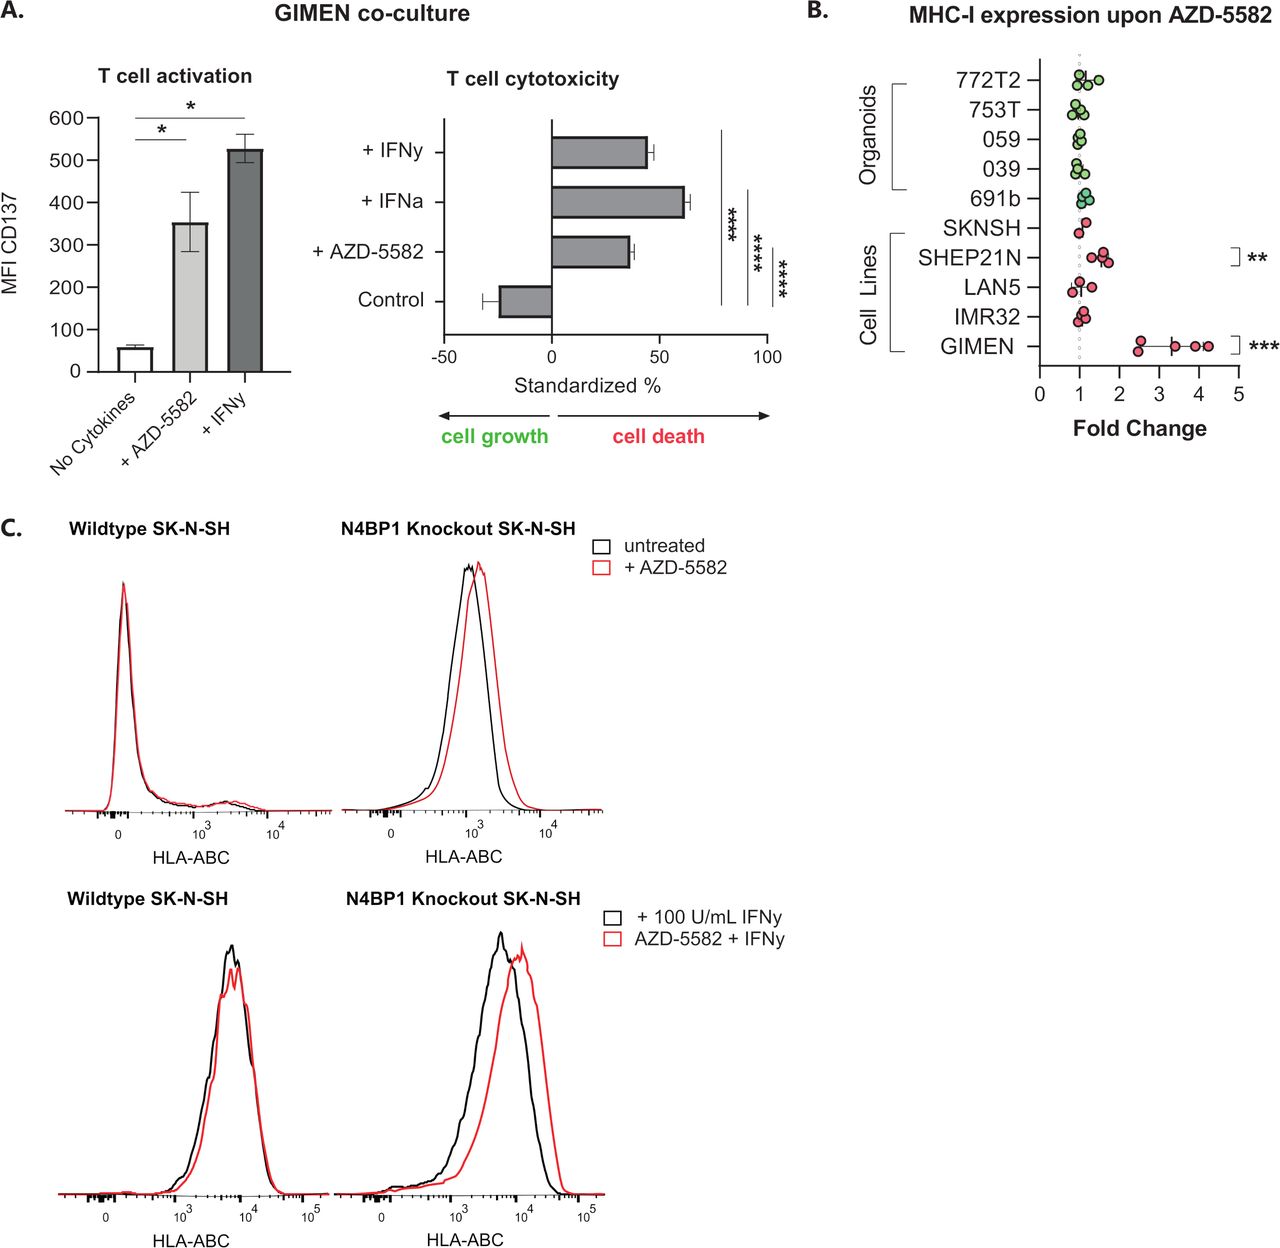
GIMEN cells were cocultured with T cells directed against the NBL-specific PRAME antigen (PRAMESLLQHLIGL) to address the effect of AZD-5582-induced MHC-I expression on T cell activation and cytotoxicity. GIMEN were preincubated for 48 hours with AZD-5582, the MHC-I enhancing cytokines interferon alpha (IFN-α) and/or IFN-γ acted as positive controls. Determination of CD137 expression, as a surrogate marker for antigen-specific T cell activation, and the cytotoxic capacity after overnight coculture with T cells revealed enhanced activation and cytotoxicity of T cells to a similar extent as cytokine pretreated controls (figure 2A).

Key regulators of NFκB signaling in NBL inhibit the effect of IAPi in the majority of cell lines and patient-derived organoids. (A) CD137 expression-based activation (left) and cytotoxic capacity (right) of PRAMESLLQHLIGL-directed T cells after coculture with GIMEN cells preincubated with 125 nM AZD-5582 for 48 hours (or respective controls, 100 U/mL IFN-γ or 1000 U/mL IFN-α). T cell activation and cytotoxicity were assessed after overnight coculture at an E:T of 1:1. Cytotoxicity was standardized to target only, treatment-matched controls (n=4). Data presented as mean±SEM. (B) Fold change in MHC-I expression on a panel of NBL cell lines and organoids after 48-hour incubation with 125 nM AZD-5582. Fold change reflects increases in HLA-ABC MFI relative to untreated control cells. Data presented as mean±SD. LAN5, n=3; GIMEN, n=5; rest: n=4, Statistical differences between log (fold changes) were calculated using a one-sample t-test. **P<0.01, ***P<0.001. (C) Histograms reflecting MHC-I expression on wild-type SK-N-SH (left) and SK-N-SH in which the NFκB pathway regulator N4BP1 is knocked out (right) after 48 hours of incubation with 125 nM AZD-5582. Control histograms are shown in black; histograms of AZD-5582 treated cells are shown in red. The top panel reflects cells without coincubation with MHC-I-enhancing cytokines; the lower panel shows expression of cells pretreated with 100 U/mL IFN-γ. Statistical differences were calculated using the Mann-Whitney U test. *P<0.05, ****P<0.0001. E:T, effector-to-target ratio; IAPi, inhibitor of apoptosis inhibitor; IFN-α, interferon alpha; IFN-γ, interferon gamma; MFI, median fluorescent intensity; MHC-I, major histocompatibility complex class I; NBL, neuroblastoma; NFκB, nuclear factor kappa B.
We subsequently assessed the effect of AZD-5582 (figure 2B) and two other IAPi, birinapant and xevinapant (online supplemental figure 2), on a panel of NBL cell lines and patient-derived organoids. The significant induction of MHC-I expression in the GIMEN line could, however, only be translated to the MHC-I-expressing SHEP21N line and was not observed in other NBL cell lines and patient-derived organoids. We noticed that all adrenergic models (all but GIMEN and SHEP21N), insensitive to TNF-α-mediated MHC-I induction, did not respond to IAPi (online supplemental figure 3) and therefore hypothesized that IAPis target upstream of previously identified key negative regulators of NFκB signaling in NBL, N4BP1, and TNIP1.16 To test this hypothesis, we determined the effect of AZD-5582 on the adrenergic N4BP1 knock-out (KO) SK-N-SH cell line.9 16 KO of N4BP1 by itself already increased MHC-I levels (figure 2C). Nevertheless, we did observe a further increase in MHC-I expression after AZD-5582 pretreatment in N4BP1 KO in SK-N-SH cells. In addition, this effect was amplified by coincubation with IFN-γ (figure 2C, lower panel). These data indicate that IAPi enhance NFκB expression, and therewith MHC-I expression, upstream of these key negative regulators of NFκB signaling in NBL.
Entinostat increases MHC-I expression in a panel of in vitro NBL models
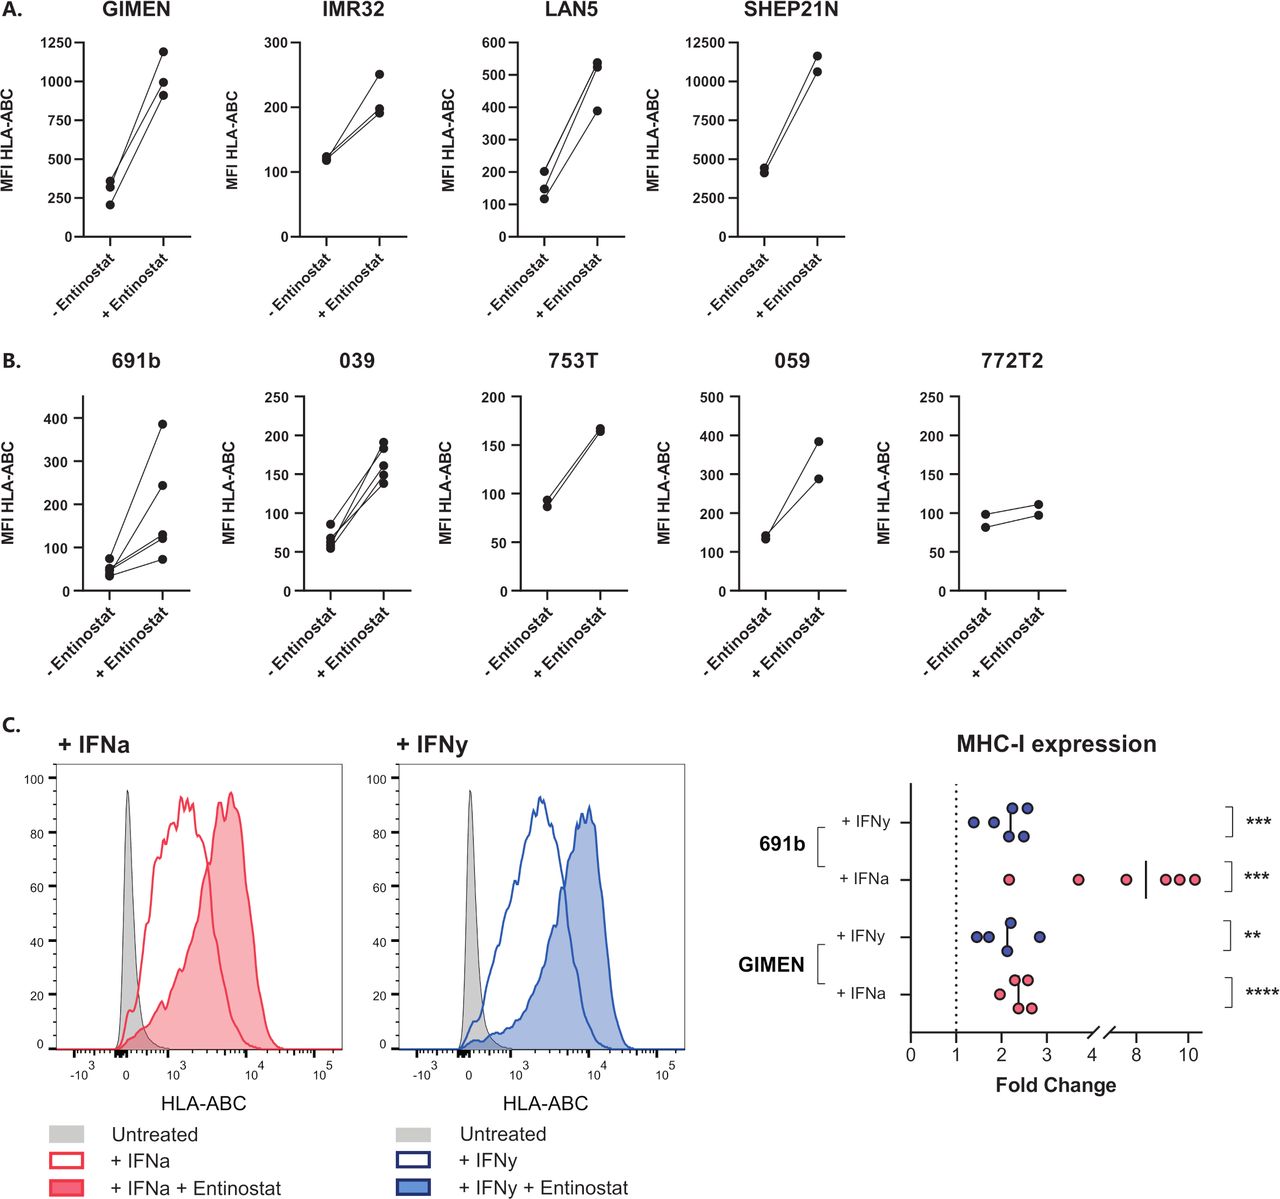
The lack of NFκB reporter activity in entinostat-treated GIMEN (figure 1A) suggests that the repressed NFκB pathway activity in many NBL models does not limit MHC-I upregulation by HDACi via entinostat. To this end, we determined the effect of HDACi in a panel of NBL cell lines as well as in patient-derived organoids representing the diverse spectrum of genomic aberrations associated with NBL (ie, MYCN amplification, TERT activation, ATRX inactivation, loss of 1 p/11q/17q/3 p/6q, and 17q gain) (table 1). Indeed, we observed increases in MHC-I expression in all screened NBL lines (figure 3A) and all but one of the patient-derived organoids (figure 3B). Interestingly, a marked upregulation was observed even in the MHC-I+SHEP21 N cell line, indicating that the effect of HDAC inhibition is not limited to NBL models lacking MHC-I expression. Moreover, coincubation of entinostat with cytokines known to affect MHC-I expression, IFN-α and IFN-γ, further augments this upregulation (figure 3C). Together, these findings demonstrate that entinostat induces expression of the main prerequisite for cytotoxic T cell recognition of NBL cells: surface expression of MHC-I. Not only entinostat, but also two other screened HDACi, tucidinostat and fimepinostat, showed similar effects on MHC-I upregulation in a panel of NBL lines (online supplemental figure 4).

Entinostat increases MHC-I expression in a panel of NBL cell lines and patient-derived organoids. (A,B) MHC-I expression after 48 hours of incubation with entinostat in cell lines (A) or patient-derived organoids (B). Entinostat concentrations: GIMEN and LAN5, 039, 772T2 : 5 µM (n=3, n=3, n=5, and n=2, respectively), 691b: 2.5 µM (n=5), IMR32, SHEP21N, 753T and 059: 1.25 µM (IMR32 n=3, rest n=2). Untreated cells (− entinostat in graph) served as control. Paired data of separate experiments are shown. (C) MHC-I expression after 48 hours of incubation with entinostat, combined with the MHC-I-enhancing cytokine IFN-α (1000 U/mL) or IFN-γ (100 U/mL). Left: flow cytometry histograms of GIMEN cells, right: fold changes of entinostat+cytokine-treated cells compared with cytokine-treated controls. Statistical differences between log (fold changes) were calculated using a one-sample t-test. IFN-α, interferon alpha; IFN-γ, interferon gamma; MFI, median fluorescent intensity; MHC-I, major histocompatibility complex class I; NBL, neuroblastoma; NFκB, nuclear factor kappa B.
Entinostat sensitizes NBL cells to T cell-mediated cytotoxicity
Next, we determined whether entinostat-induced MHC-I upregulation results in enhanced activation and cytotoxicity of PRAMESLLQHLIGL-directed T cells.19 GIMEN and patient-derived 691b organoid cells, both MHC-I negative, were selected for these assays based on the presence of both the HLA-A2 haplotype as well as endogenous PRAME expression. Activation and cytotoxic capacity of T cells were assessed by CD137 expression on T cells, TNF-α and IFN-γ secretion by T cells, and cytotoxicity in an overnight assay.
CD137 expression significantly increased after pretreatment of target cells with entinostat, which was magnified by cotreatment with MHC-I-enhancing cytokines IFN-α and IFN-γ (figure 4A). Analysis of the supernatants of these cultures for the presence of T cell activation-related cytokines IFN-γ and TNF-α revealed that the increase in CD137 expression conjointly results in a significant increase in secretion of these cytokines (figure 4B). This suggests a self-perpetuating positive feedback loop once T cells become activated as a result of entinostat-mediated immunogenicity of NBL cells.

Entinostat treatment increases the activation and cytotoxic capacity of antigen-specific T cells. (A) CD137 expression based activation of NBL-specific PRAMESLLQHLIGL-directed T cells after 48 hours of preincubation of GIMEN cells (left) or the patient-derived organoid 691b (right)±entinostat after overnight coculture at an E:T of 1:1. Entinostat concentration in GIMEN and no cytokine 691b condition was 5 µM; concentration in remaining 691b conditions was 2.5 µM. 100 U/mL IFN-γ or 1000 U/mL IFN-α was added to the indicated conditions. Data are shown from five replicates of three individual experiments. (B) IFN-γ (left) and TNF-α (right) secretions (pg/mL) in the supernatants of the overnight coculture between 691b organoids and PRAMESLLQHLIGL-directed T cells from (A) were determined by ELISA. Five replicates are shown from three individual experiments. (C) Luminescence-based cytotoxicity against luciferase-transduced 691b organoids after 48 hours of preincubation with 2.5 µM entinostat, 1000 U/mL IFN-α, or 100 U/mL IFN-γ. Cells were cocultured overnight at an E:T of 1:1. Data are shown from three individual experiments. Data are shown as mean±SEM. Statistical differences were calculated using the Mann-Whitney U test. **P<0.01, ****P<0.0001. E:T, effector-to-target ratio; IFN-α, interferon alpha; IFN-γ, interferon gamma; MFI, median fluorescent intensity; MHC-I, major histocompatibility complex class I; NBL, neuroblastoma; TNF-α, tumor necrosis factor alpha.
Finally, the cytotoxic capacity of the T cells was determined in an overnight luminescence-based cytotoxicity assay with luciferase transduced 691b cells. Entinostat pretreatment resulted in a similar increase in cytotoxic capacity of T cells as pretreatment with MHC-I-enhancing cytokines (figure 4C). MHC-I dependence was confirmed by MHC-I blocking experiments (online supplemental figure 5). The coculture experiment was performed in the presence of entinostat, indicating that entinostat did not affect the cytotoxic capacity of the T cells. T cell functionality in the presence of entinostat was further confirmed in a proliferation assay with entinostat pretreated healthy-donor CD3+ T cells (online supplemental figure 6). Collectively, these data indicate that entinostat increases T cell immunogenicity of NBL cells via upregulation of MHC-I antigen presentation.
The immunogenic effect of entinostat reaches beyond MHC-I antigen presentation
HDACs are important transcriptional regulators with a broad mechanism of action. So far, we focused on MHC-I-mediated antigen presentation. Nevertheless, the degree of immune engagement depends on the balance between a wide variety of inhibitory and stimulatory signals and immune cells.13 Therefore, RNA sequencing (RNA-seq) was performed to compare expression of these molecules between untreated and entinostat-treated 691b organoids.
Unsupervised clustering of replicates resulted in complete separation between untreated and entinostat-treated organoid replicates (figure 5A). Based on the relative expression of a curated set of 41 genes known to have major roles in tumor cell-intrinsic immune functions,9 an immune activation (IA) score was calculated for untreated and entinostat-treated 691b organoids, which revealed a significant increase in IA score after entinostat treatment (figure 5B). Besides the significant increases in expression of genes involved in MHC-I antigen presentation (ie, HLA-A/B/C, TAP1/2, ERAP2, and B2M), we also noted significant upregulation of expression of genes encoding NK-related receptor ligands (ie, HLA-E/F, MICA/B, and ULBP2/3) and immunoproteasome (IP) subunits (PSMB8/9). These increases were confirmed with qPCR analysis of GIMEN and 691b organoids (online supplemental figure 7). Additionally, RNA-seq revealed a significant increase in the expression of transcripts encoding the immune checkpoint ligands CD274 (PD-L1) and NECTIN2. Nevertheless, subsequent flow cytometric analysis did not reveal any differences in cell surface protein expression of these checkpoint receptor ligands (figure 5C).
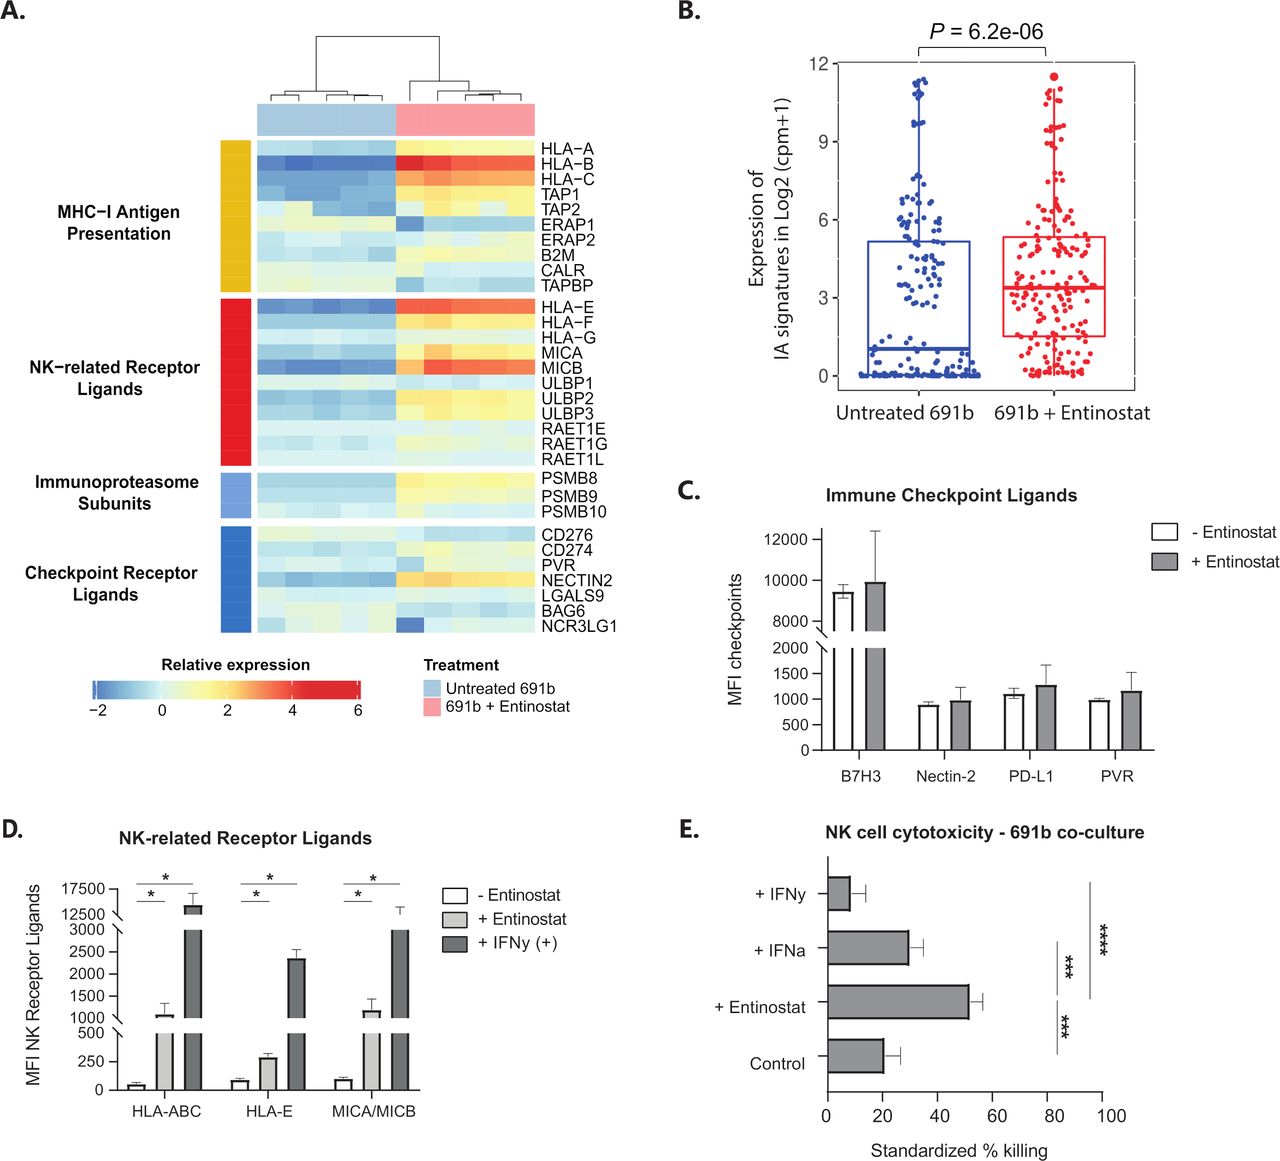
The proimmunogenic effect of entinostat goes beyond MHC-I antigen presentation. (A) Unsupervised clustering of RNA-seq data of untreated 691b organoids (blue) and entinostat-treated organoids (pink). Data are depicted as log2 (fold change). (B) IA signature (IA score) based on relative expression of 41 genes with major roles in tumor-cell intrinsic immune functions, such as regulation of MHC expression, antigen processing and presentation, NK cell immunogenicity, and T cell and NK cell infiltration.9 Score is compared between untreated (blue) and entinostat-treated (red) organoids. Expression of IA signatures in log2 (cpm+1) is shown as median±25th and 75th percentiles; whiskers reflect minima and maxima. Data are normalized to cpm; log2 value is shown. (A,B) Cells were treated for 48 hours with 2.5 µM entinostat or vehicle control. Both groups: n=5. (C,D) Flow cytometric analysis of surface expression of known immune checkpoint receptor ligands (C) or NK-receptor ligands (D) after 48 hours of incubation with 2.5 µM entinostat (or 1000 U/mL IFN-γ as a positive control in the NK-receptor ligand panel). Data are shown as MFI±SEM and reflect minimally three individual experiments. Statistical differences were calculated using the Mann-Whitney U test. *P<0.05. (E) Luminescence-based NK cell cytotoxicity against luciferase-transduced 691b organoids after 48 hours of preincubation with 2.5 µM entinostat, 1000 U/mL IFN-α, or 100 U/mL IFN-γ. NK cells were preactivated overnight with 1000 U/mL IL-2 and 50 ng/mL IL-15. Cells were cocultured for 5 hours at an E:T of 1:1. Data are shown from four different donors analyzed in three individual experiments and are standardized to target only, treatment-matched control cells. Data are shown as mean±SEM. Statistical differences were calculated using the Mann-Whitney U test. ***P<0.001, ****P<0.0001. E:T, effector-to-target ratio; IA, immune activation; IFN-α, interferon alpha; IFN-γ, interferon gamma; IL, interleukin; MFI, median fluorescent intensity; MHC-I, major histocompatibility complex class I; NK, natural killer; RNA-seq, RNA sequencing.
The enhanced levels of NK cell stimulatory (ie, MICA/B and ULBP2/3) and inhibitory ligands (HLA-A/B/C/E/F) prompted the question whether the effect of entinostat would tip the balance toward a proimmunogenic or anti-immunogenic effect on NK cells. First, we determined whether the observed increase in transcript levels could be translated to cell surface protein expression. Indeed, besides the known increase in surface display in HLA-A/B/C, we observe a significant entinostat-induced increase in cell surface expression of HLA-E and MICA/MICB (figure 5D). The cytotoxic capacity of NK cells was subsequently determined in a 5-hour luminescence-based cytotoxicity assay with luciferase transduced 691b. Entinostat pretreatment of 691b, but not pretreatment with MHC-I-enhancing cytokines IFN-α and IFN-γ, resulted in a significant increase in cytotoxic capacity of healthy-donor NK cells (figure 5E). Together, these data show that the entinostat-mediated increase in immunogenicity of NBL tumors is not limited to increased immunogenicity of cytotoxic T cells, but also to other immune subsets like NK cells.
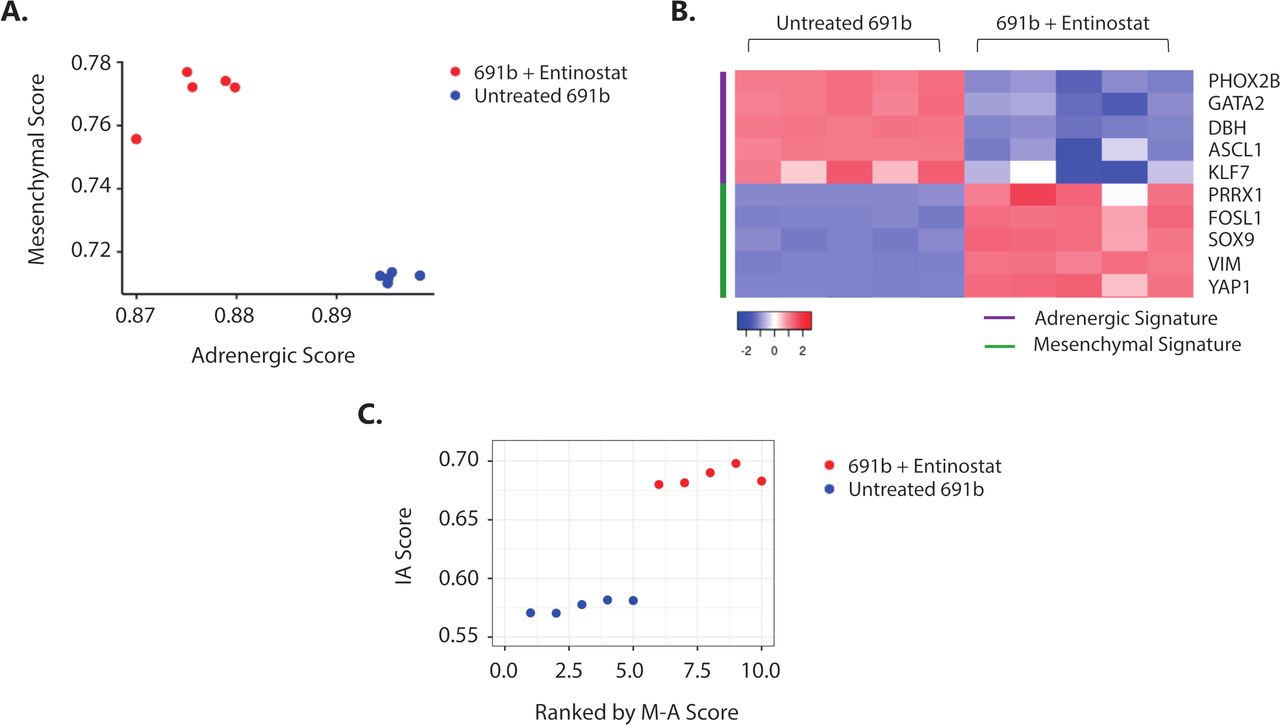
Entinostat-induced immunogenicity is accompanied by an NBL tumor-cell lineage switch
It was recently shown that NBL tumor-cell lineage, defined by a well-established 485-gene mesenchymal signature,7 is linked to the propensity of eliciting an immune response.9 Plasticity between the less immunogenic, adrenergic and immunogenic, mesenchymal cell lineages was shown, which was demonstrated to be regulated by epigenetic imprinting.9 30 Based on these data, we investigated whether the observed entinostat-induced immunogenicity is accompanied by a switch toward a more immunogenic, mesenchymal cell lineage phenotype. Indeed, transcriptome analysis revealed that entinostat treatment of 691b organoids induced an adrenergic to mesenchymal cell lineage switch (figure 6A,B, and online supplemental figure 8A). This cell lineage switch was accompanied by increase in IA score (figure 6C) and IFN-response signature (online supplemental figure 8B). Taken together, this suggests that entinostat-mediated epigenetic modulation results in a tumor-cell lineage switch that is accompanied by increased immunogenic properties of NBL tumors.
Entinostat induces an adrenergic-to-mesenchymal cell lineage shift which is accompanied by increased immunogenicity. (A) Cell lineage score of untreated (blue) and entinostat-treated (red) 691b organoids. Adrenergic (A) and mesenchymal (M) scores were calculated for each sample based on the gene signatures outlined by van Groningen and colleagues.7 (B) Expression of representative adrenergic (purple) and mesenchymal (green) signature genes in untreated and entinostat-treated 691b organoids. Log2 gene expression values were z-score transformed for heatmap visualization. (C) Correlation plot between mesenchymal minus adrenergic score (M−A score) and IA score in untreated (blue) and entinostat-treated 691b organoids (red). X-axis denotes organoids ranked in increasing order of (M–A) score. Cells were treated for 48 hours with 2.5 µM entinostat or vehicle control. Both groups: n=5. IA, immune activation; M−A, mesenchymal minus adrenergic.
Discussion
Immunotherapy against NBL currently does not live up to its full potential, likely due to inadequate adaptive immune cell engagement, circumventing antitumor cytotoxicity and induction of immunological memory to prevent future relapse. We here show that treatment of NBL cells with the HDACi entinostat results in induction of expression of the most important prerequisite for cytotoxic T cell activation: surface expression of MHC-I.
MHC-I expression is controlled by multiple pathways, including the type I and II IFN pathways, as well as the (non-)canonical NFκB pathway.2 We previously reported NFκB pathway repression in NBL, which is a result of high expression of two key negative regulators of NFκB signaling: N4BP1 and TNIP1.16 Targeting these regulators markedly sensitizes cells to NFκB-mediated MHC-I upregulation. Consequently, we hypothesize that compounds enhancing MHC-I expression in NBL should either enhance MHC-I expression via bypassing NFκB pathway activation or repress or function downstream of these NFκB pathway regulators. NFκB reporter activity in our GIMEN reporter system revealed that IAPi induces MHC-I expression via NFκB pathway activation, while MHC-I expression by most HDACi is independent of NFκB pathway activation.
As the MHC-I expression-enhancing effect of IAPi could not be translated to most of our in vitro NBL models, together with the confirmed insensitivity to NFκB-mediated MHC-I upregulation, we decided to study the effect of IAPi on KO of one of these key negative regulators, N4BP1. Indeed, N4BP1 KO resulted in sensitization to MHC-I upregulation by the IAPi AZD-5582. We thus conclude that IAPis act upstream of N4BP1/TNIP1 and therefore do not induce MHC-I expression in the majority of NBL tumors, as most exert repressed NFκB pathway activity. Notwithstanding, preclinically, the synergistic effect of IAPi with checkpoint inhibition in glioblastoma31 and enhanced radiation-induced immunological cell death in head and neck cancer32 does show the potential of the immunomodulatory effect of IAPi in cancer; however, intact NFκB signaling seems to be a prerequisite for this.
During embryogenesis, neural crest cells (NCCs) gain multipotent differentiation potential to be able to differentiate into a wide variety of tissues of epithelial, mesenchymal, and endothelial origins.33 Differentiation of these NCCs is an intricate process regulated via a complex transcriptional/epigenetic regulatory scheme. Dysregulation of these regulatory schemes may result in inhibition of this maturation process, which may predispose multipotent NCCs to malignant transformation and NBL development. This is supported by studies that found increased HDAC expression in HR-NBL.34 We show that HDACi resulted in increased expression in genes involved in antigen processing and presentation, without IFN/NFκB pathway activation, indicating that the poor immunogenic properties of NBL are indeed a derivate of a differentiational halt during embryogenesis. In other words, HDACi merely creates a more accessible epigenetic landscape of loci involved in antigen presentation, thereby increasing responsiveness to IFN/NFκB pathway activation. This is underlined by the observation that MHC-I upregulation and T cell activation are magnified when cells are cotreated with entinostat and MHC-I-enhancing cytokines. A recent study by Seier and colleagues showing that inhibition of histone methyltransferases in NBL cell lines results in increased immunogenic properties, which underlines that this effect is not restricted to epigenetic modeling by HDACi.35 36 As other embryonal cell-derived pediatric tumors, including malignant rhabdoid tumors and medulloblastoma, also display low levels of immunogenic markers and have been shown to also result from differentiational halt during embryogenesis,37–40 we expect that the potential of HDACi to induce immunogenicity is translatable to other embryonal cell-derived tumors.
MHC-I expression is the most important, but not the only prerequisite for NBL-induced cytotoxic T cell engagement. Pediatric tumors display a low mutational burden,13 causing a narrow repertoire of T cells that specifically recognize and target NBL. We here observe entinostat-mediated induction of IP subunits PSMB8 and PSMB9. IP activation induces more efficient and differential proteasome-mediated peptide processing,41 which may result in a broader and more efficient NBL-specific T cell response after entinostat treatment. In addition, clinical studies in melanoma and preclinical studies in bladder cancer reported induction of expression of several neoantigens after entinostat treatment,42 43 which is accompanied by an increase in CD8+ effector memory T cells at the tumor site. Moreover, increased expression of known NBL-associated antigens, cancer germline genes and GD2 expression, respectively, was reported after epigenetic modulation in NBL.44–46 These data may imply that entinostat increases NBL T cell immunogenicity at multiple layers. Nonetheless, systemic T cell dysfunction,47 expression of immune checkpoint molecules, presence of immunosuppressive stromal and myeloid cells, as well as secretion of immunoregulatory mediators by NBL are remaining factors to be tackled to maximize T cell immunogenicity.13
Most studies evaluate the effect of HDACi on tumor cells, but much less is known about the systemic and local effect on immune cell subsets. The effect of HDACi on leukocyte function is debated on in literature, as studies report both immunosuppressive48 and immune enhancing effects.42 45 46 49–52 It is suggested that the effect of HDACi on immune cells is highly dependent on the class(es) of targeted HDAC(s).52 Consequently, one should be careful translating results from one class of HDACi to the other. We studied the effect of entinostat on T cell and NK cell cytotoxicity in the presence of entinostat and observed a clear enhanced cytotoxic capacity. This is underlined by the observation that T cell proliferation was still observed in presence of a high dose of entinostat. Two NBL mouse models showed that vorinostat, another class I HDACi, decreased abundance and immunosuppression of myeloid-derived suppressor cells and tumor-associated macrophages, which may decrease immunoregulatory signals in the tumor microenvironment affecting T cell engagement.45 46 In addition, besides other studies showing entinostat-induced upregulation of stimulatory NK-receptor ligands in other cancer types,49 50 increased expression of natural cytotoxicity receptors (ie, NKG2D and NKp30) was reported on NK cells themselves, suggesting that NK function might even be enhanced.50 51
Several preclinical studies have shown an antitumor effect of HDACi in HR-NBL, generally highlighting their potency to inhibit cell proliferation, promoting cell cycle arrest, differentiation, and apoptosis, as reviewed by Phimmachanh and colleagues.53 Nonetheless, the increase in immunogenicity accompanying this HDACi-induced differentiation of NBL tumors we observe in our study is largely unreported. Several clinical trials are being conducted to investigate the potential of HDACi in NBL.53 Three of these trials (NCT02559778, NCT03332667, and NCT03838042) combine HDACi with immunotherapy (with dinutuximab/granulocyte-macrophage colony-stimulating factor (GM-CSF)/interleukin (IL)-2 and isotretinoin, meta-iodobenzylguanidine (MIBG)/dinutuximab/vorinostat, and checkpoint inhibition, respectively), studying the synergistic potential of these combinations.
Two clinical studies in various advanced adult cancers report improved outcome when combining immunotherapy with entinostat.54 55 Preclinical studies have revealed that this is a result of increased adaptive immune engagement, of which reversion of MHC-I expression is one of the described mechanisms.52 56–59 Nevertheless, one should be careful translating immunogenic effects of drugs in adult tumors to pediatric tumors, and even more so to embryonal cell derived pediatric tumors, as the essential difference in tumorigenesis should be taken into account.
Taken together, this study shows that epigenetic modulation by entinostat results in a tumor-cell lineage switch which is accompanied by increased T cell and NK cell immunogenicity against NBL via expression induction of several antigen-presenting machinery players, including MHC-I, MICA/B, and IP subunits. These results substantiate the combination of (immuno)therapy with HDACi as a potential strategy to enhance T cell engagement and therewith immunogenicity to improve outcome for children suffering from HR-NBL.
Data availability statement
Data are available upon reasonable request. The data that support the findings of this study are available on request from the corresponding author (SN). The data are not publicly available due to privacy restrictions.
Ethics statements
Patient consent for publication
Ethics approval
Not applicable.
Acknowledgments
The pSLuc-GFP plasmid was kindly provided by Dr Christian Buchholz (Paul-Ehrlich-Institut, Langen, Germany). The authors thank the Center for Drug Design & Discovery for providing the CD3 repurposing library.
References
Supplementary materials
Supplementary Data
This web only file has been produced by the BMJ Publishing Group from an electronic file supplied by the author(s) and has not been edited for content.
Footnotes
Contributors SN and AMC designed the study. AMC wrote the manuscript. FvdH, JGMS, JW, and JJM provided tumor-derived organoids and advised in setting up luminescence-based cytotoxicity assays. AMC, ED, DAMHvdB, DAH, SAGE, AHWE, BK, CSS, and VLP performed experiments. AMC, DAH, SD, and SS analyzed the data with support from SvH, RG, MPD, and SN. SN acts as the guarantor of the manuscript. All authors read and approved the manuscript.
Funding This work was supported by the Villa Joep Foundation (IWOV-Actief.51391.180034).
Competing interests None declared.
Provenance and peer review Not commissioned; externally peer reviewed.
Supplemental material This content has been supplied by the author(s). It has not been vetted by BMJ Publishing Group Limited (BMJ) and may not have been peer-reviewed. Any opinions or recommendations discussed are solely those of the author(s) and are not endorsed by BMJ. BMJ disclaims all liability and responsibility arising from any reliance placed on the content. Where the content includes any translated material, BMJ does not warrant the accuracy and reliability of the translations (including but not limited to local regulations, clinical guidelines, terminology, drug names and drug dosages), and is not responsible for any error and/or omissions arising from translation and adaptation or otherwise.