Article Text

Abstract
Background Despite the growing interest in immunotherapeutic interventions for endometrial cancer (EC), the prevalence, phenotype, specificity and prognostic value of tumor infiltrating lymphocytes (TILs) in this tumor type remains unclear.
Methods To better understand the role of TILs in EC, we analyzed the phenotypic traits of CD8+ and CD4+ EC-resident T cells from 47 primary tumors by high-dimensional flow cytometry. In addition, CD8+ and CD4+ TIL subpopulations were isolated based on the differential expression of programmed cell death protein-1 (PD-1) (negative, dim and high) and CD39 (positive or negative) by fluorescence activated cell sorting (FACS), expanded in vitro, and screened for autologous tumor recognition. We further investigated whether phenotypic markers preferentially expressed on CD8+ and CD4+ tumor-reactive TIL subsets were associated with the four distinct molecular subtypes of EC, tumor mutational burden and patient survival.
Results We found that CD8+TILs expressing high levels of PD-1 (PD-1hi) co-expressed CD39, TIM-3, HLA-DR and CXCL13, as compared with TILs lacking or displaying intermediate levels of PD-1 expression (PD-1− and PD-1dim, respectively). Autologous tumor reactivity of sorted and in vitro expanded CD8+ TILs demonstrated that the CD8+PD-1dimCD39+ and PD-1hiCD39+ T cell subsets both contained tumor-reactive TILs and that a higher level of PD-1 expression was associated with increased CD39 and a superior frequency of tumor reactivity. With respect to CD4+ T conventional (Tconv) TILs, co-expression of inhibitory and activation markers was more apparent on PD-1hi compared with PD-1− or PD-1dim T cells, and in fact, it was the CD4+PD-1hi subpopulation that accumulated the antitumor T cells irrespective of CD39 expression. Most importantly, detection of CD8+PD-1hiCD39+ and CD4+PD-1hi tumor-reactive T-cell subsets, but also markers specifically expressed by these subpopulations of TILs, that is, PD-1hi, CD39, CXCL13 and CD103 by CD8+ TILs and PD-1hi and CXCL13 by CD4+ Tconv TILs, correlated with prolonged survival of patients with EC.
Conclusions Our results demonstrate that EC are frequently infiltrated by tumor-reactive TILs, and that expression of PD-1hi and CD39 or PD-1hi can be used to select and expand CD8+ and CD4+ tumor-reactive TILs, respectively. In addition, biomarkers preferentially expressed on tumor-reactive TILs, rather than the frequency of CD3+, CD8+ and CD4+ lymphocytes, hold prognostic value suggesting their protective role in antitumor immunity.
- Biomarkers, Tumor
- Genital Neoplasms, Female
- Lymphocytes, Tumor-Infiltrating
- T-Lymphocytes
- Immunotherapy, Adoptive
Data availability statement
Data are available upon reasonable request. All data relevant to the study are included in the article or uploaded as supplementary information.
This is an open access article distributed in accordance with the Creative Commons Attribution Non Commercial (CC BY-NC 4.0) license, which permits others to distribute, remix, adapt, build upon this work non-commercially, and license their derivative works on different terms, provided the original work is properly cited, appropriate credit is given, any changes made indicated, and the use is non-commercial. See http://creativecommons.org/licenses/by-nc/4.0/.
Statistics from Altmetric.com
- Biomarkers, Tumor
- Genital Neoplasms, Female
- Lymphocytes, Tumor-Infiltrating
- T-Lymphocytes
- Immunotherapy, Adoptive
WHAT IS ALREADY KNOWN ON THIS TOPIC
The ability of endometrial cancer (EC) to elicit T-cell responses remains largely unexplored and the role of tumor infiltrating lymphocytes (TILs) is controversial.
Specific biomarkers such as PD-1, CD39 and CD103 have been reported to identify tumor-reactive CD8+T cells. However, there is still extensive debate over which combination of markers best defines antitumor CD8+ and CD4+ lymphocytes residing at the tumor.
WHAT THIS STUDY ADDS
PD-1hi, CD39, CXCL13 and CD103 or PD-1hi and CXCL13 expression marks the presence of tumor-reactive CD8+ or CD4+ TILs, respectively, and correlates with improved survival in EC.
CD8+ and CD4+ T cell subsets containing tumor-reactive lymphocytes display a distinct and convergent functional state in the tumor microenvironment consistent with exhaustion and marked by the expression of CXCL13, a B cell chemoattractant.
Our data revealed heterogeneity within CD8+ tumor-reactive TILs, since CD8+PD-1+CD39+ TILs, including both cells expressing intermediate and high levels of PD-1, are preferentially enriched in tumor-reactive lymphocytes.
Both high and low mutational burden tumors are able to elicit T-cell responses and are infiltrated with tumor-reactive CD8+ lymphocytes subsets that protect patients from recurrence after surgery. CD4+ tumor-reactive TILs are preferentially expanded in hypermutated EC and correlate with an outstanding survival.
HOW THIS STUDY MIGHT AFFECT RESEARCH, PRACTICE OR POLICY
The lack of detection of the identified biomarkers, preferentially expressed on tumor-reactive TIL subsets, is associated with poor patient survival and could be used to prioritize patients for receiving adjuvant therapy following resection of the primary tumor.
Beyond the contribution of CD8+ cells, our work highlights the importance of CD4+ tumor-reactive TILs.
The identified CD8+ and CD4+ tumor-reactive specific subpopulations can be used to develop more effective adoptive cell therapies for EC as well as other tumor types.
Background
Endometrial cancer (EC) is the most common gynecologic malignancy in developed countries and the second most common in developing countries.1 EC can be stratified according to genetic alterations, gene expression, methylation profile and clinicopathological features into four groups with prognostic value: (1) Polymerase-ε (POLE) ultramutated, (2) mismatch repair deficient or microsatellite instable (MMRd/MSI) hypermutated, (3) copy-number low (CNL)/endometrioid with normal p53 (p53wt) and (4) copy-number high (CNH)/serous-like lacking expression of p53 (p53abn). POLE-mutated patients display an improved survival, followed by MMRd/MSI, CNL and CNH.2 Moreover, POLE-mutated and MMRd/MSI EC harbor a high mutational load, which can render tumors immunogenic through the accumulation of neoantigens, peptides derived from mutated gene products presented on the human leukocyte antigen (HLA) molecules.
Immunotherapeutic agents have become increasingly important for the treatment of patients with EC. In 2017, pembrolizumab was approved for patients with unresectable or metastatic MSI-high or MMRd solid tumors, including EC.3–5 More recently, dostarlimab anti-PD-1 monoclonal antibody demonstrated durable antitumor activity in both MMRd and MMR proficient tumors with an overall response rate (ORR) of 43.5% and 14.1%, respectively.6 Furthermore, the combination of pembrolizumab with the anti-angiogenic lenvatinib, a multiple tyrosine kinase inhibitor (TKI), has been approved by the Food and Drug Administration based on the results of the phase III clinical trial Keynote-775.7 This combination demonstrated significant improvement of progression free survival (PFS), overall survival (OS) and ORR versus second-line chemotherapy for advanced EC irrespective of MMR status.
Despite the enthusiasm and relative success of immunotherapy in EC, there is a limited understanding of the T-cell response to EC tumor cells. Because of the high tumor mutation burden (TMB) of POLE-mutated and MMRd/MSI, EC represents an ideal model to study the differences in T-cell responses between high (POLE-mutated and MMRd/MSI) and low (CNL and CNH) TMB tumors, that could be extrapolated to other tumor histologies. Some studies have described that POLE-mutated and MMRd/MSI EC molecular subclasses are characterized by high CD3+/CD8+TILs and an overexpression of PD-1 and PD-L1 (programmed death-ligand 1).8 9 Computational analysis of RNA-sequencing (RNA-seq) data derived from EC suggests that T cells infiltrating POLE-mutated and MMRd/MSI are more cytolytic and display an exhaustion-like phenotype, suggesting a more complex lymphocyte-rich inflamed microenvironment compared with CNL and CNH.10 This is consistent with the hypothesis that neoantigens drive a specific antitumor T-cell response. However, a study showed that CNL and CNH EC, typically thought to be less immunogenic, also contain dense T and B cell infiltrates, although less frequently.11 Further, the prognostic value of tumor-infiltrating lymphocytes (TILs) in EC remains controversial. Some studies have shown a favorable prognosis in patients with tumors with greater CD8+, CD45RO+ or CD103+ infiltrates,12 13 while others support that tumor-associated molecular traits rather than the immune infiltrate drives outcome in EC.11 A more detailed phenotypic and functional characterization of the EC-resident T cells, particularly focused on defining populations of tumor-reactive CD4+ and CD8+ TILs is lacking, but could be highly valuable to mine for prognostic and predictive biomarkers of response to immunotherapy in EC and could be extrapolated to other tumor types. Here, we studied the T-cell infiltrate of 47 primary EC to characterize their phenotype and function and evaluated the antitumor specificity of CD8+ and CD4+ TIL subpopulations to identify biomarkers associated with improved survival that could guide patient treatment.
Methods
Tissue acquisition and processing
Between 2017 and 2019, primary tumors of 47 patients with treatment-naïve EC were surgically resected at Bellvitge University Hospital. Patients’ clinical features and median follow-up are displayed in table 1. A biopsy from the fresh specimen was processed for routine histopathology, molecular profiling,and to establish tumor derived cell lines (TCLs) and generate a tumor single-cell suspension.
Demographics, baseline characteristics, median follow-up and percentage of tumor relapse of the patients at the time of the analyses
Molecular classification of EC
To classify the tumors similarly to the The Cancer Genome Atlas (TCGA) subgroups, POLE hotspot mutational and immunohistochemistry (IHC) for MMR genes (MSH6, PMS2, MSH-2, MLH-1) and p53 status were performed. DNA was extracted from ten 15 µm sections of optimal cutting temperature (OCT)-embedded tumor sections using the Maxwell 16 Tissue DNA Purification Kit (AS1030, Promega) and sequenced in a HiSeq2500 (Illumina) using a custom designed gene panel including POLE (online supplemental table 1). The derived somatic mutations were identified by a pipeline that makes use of the two variants callers Varscan2 and Mutect2. IHC staining for p53 and MMR proteins was performed on 4 µm whole slides. Tissue sections were incubated with primary antibodies for 20–30 min (MSH6 or PMS2 and p53, respectively, expanded to MSH-2 and MLH-1 when MSH-6 or PMS-2 expression was lost, respectively; antibody details on online supplemental table 2). IHC for p53 was scored abnormal if (1) over 80% of the tumor cells showed a strong positive staining, (2) staining was completely absent or (3) there was a significant cytoplasmic staining. Tumors were considered MMRd/MSI if more than 10% of the tumoral cell nuclei were negative, for at least one of the MMR proteins with positive internal control.
Supplemental material
Briefly, if mutations on POLE were detected by targeted sequencing, the tumor was classified as POLE-mutated. If no mutations on POLE but deficiencies on MMR genes were observed, the tumor was classified as MMRd/MSI. If no mutations on POLE nor deficiencies on MMR genes were detected but there were mutations in TP53 the tumor was classified as CNH. If no alterations on POLE, MMR genes nor TP53, the tumor was classified as CNL (online supplemental figure 1).
Primary tumor cell line establishment
To generate a TCL, a 2–4 mm tumor fragment was incubated in TC medium PRO at 37°C, 5% CO2, that was replaced by TC medium 20% fetal bovine serum (FBS) Hyclone after 4 weeks. When evidence of tumor colonies was observed, cell cultures were passaged when confluent. Established TCLs were maintained in T2 medium and cryopreserved until further use. Media composition is detailed in online supplemental table 3.
Tumor single-cell suspension generation
To obtain a tumor single-cell suspension, 2–4 mm tumor fragments were mechanically and enzymatically dissociated using the gentleMACS Dissociator and medium containing enzymes (online supplemental table 4). The gentleMACS dissociator was run three times, and after each run the tumor digest was incubated for 30 min at 37°C. The single-cell suspension was filtered using a 70 µm cell strainer, counted and cryopreserved in FBS (Gibco)+10% DMSO (Sigma-Aldrich) in liquid N2 until further use.
TCR-β sequencing of EC-resident lymphocytes
T-cell receptor (TCR)-β sequencing was performed using ImmunoSeq hsTCR-β kit (Adaptive Biotechnologies) according to manufacturer’s instructions. Briefly, 1.44 µg DNA OCT-embedded tumor sections were used as template to generate TCR-β libraries. Following PCR amplification, the products were pooled and sequenced using NextSeq 500, Mid Output Kit V.2.5. The sequencing output was uploaded to the immunoSEQ Analyzer for data analysis.
Flow cytometry, cell sorting, and in vitro expansion of lymphocyte subpopulations
To phenotype the lymphocytic infiltrate in EC by flow cytometry, one extracellular and two intracellular (IC; IC1 and IC2) panels of human-specific antibodies were designed (online supplemental table 2). Specifically, CD8+TILs were phenotyped with the extracellular and IC2 panels whereas CD4+TILs were analyzed with IC1 and IC2 panels in order to distinguish Tconv (FoxP3−) from T regulatory (Treg) (FoxP3+) cells.
Briefly, tumor single-cell suspensions were thawed and rested overnight in the absence of cytokines. For detection of intracellular cytokine expression, cells were incubated with brefeldin A and monensin (Sigma-Aldrich) for at least 4 hours at 37°C since optimization experiments showed that these conditions led to higher expression of CXCL13. Fc receptors were blocked with FcR blocking reagent (Miltenyi) for 15 min at 4°C. Cells were stained with LIVE/DEAD Fixable Yellow (Thermo Fisher) for 30 min and washed in phosphate-buffered saline (Biowest) before staining with surface marker antibodies. For intracellular staining, the Foxp3/Transcription Factor Staining Buffer Set (eBioscience) was used following manufacturer’s recommendations. Cells were acquired in a BD LSRFortessa Cell Analyzer.
T-distributed stochastic neighbor embedding (t-SNE) analyses were performed using FlowJo software by concatenating 10 or 15 samples, as indicated on the corresponding figure legends, acquired on the same day and downsampling to 10,000–20,000 CD3+ cells. 1000 iterations, a perplexity parameter of 30, and a trade-off θ of 0.5 were used for applying the dimensionality reduction algorithm.
To isolate CD8+ and CD4+ subpopulations based on the expression of PD-1 and/or CD39 from tumor single-cell suspensions by cell sorting, samples were thawed and rested overnight in the absence of cytokines. Cells were washed and stained with the corresponding antibody mix (online supplemental table 2) at 4°C for 30 min. Single-stain controls for each marker, fluorescence minus one controls and isotype controls for PD-1 and CD39 were also included. Cells were isolated using the BD FACSAria.
FACS-sorted cell populations were expanded using a rapid expansion protocol in T25 flasks in T-cell medium (online supplemental table 5) containing anti-CD3 (OKT3, Miltenyi), 3000 IU/mL recombinant human Interleukin 2 (rhIL-2) (Novartis), and irradiated peripheral blood mononuclear cells (PBMCs) pooled from three allogeneic donors. At day 14, cells were harvested and either used in co-culture experiments or cryopreserved until further analysis.
Detection of MHC-I or MHC-II expression in tumor cell lines
Overall, 100,000 tumor cells were cultured in T2 medium containing the specified stimulation agents. For MHC-I upregulation, cells were treated with 10 ng/mL recombinant human Interferon Gamma (rhIFN)-γ (Peprotech) for 24 hours. For MHC-II induction, cells were incubated with 30 ng/mL rhIFN-γ for 3 days or transduced with human Class II Major Histocompatibility Complex Transactivator (hCIITA)+/- lentiviral vectors. The appropriate controls of unstimulated and untransduced cells were also included in the experiments. MHC-I and/or MHC-II expression was detected by flow cytometry using the antibodies specified on online supplemental table 2.
hCIITA was cloned into pHIV-Luc-ZsGreen (Addgene) backbone and DNA was isolated using EndoFree Plasmid Kit (Qiagen). hCIITA-expressing lentiviral particles were produced by co-transfecting HEK293T cells with the pHIV-CIITA-ZsGreen plasmid, the pMD2.G envelope plasmid and the psPAX2 packaging plasmid. Virus-containing supernatants were concentrated by ultracentrifugation and TCLs were transduced by spinoculation with hCIITA-expressing lentiviral particles.
Assessment of autologous tumor recognition
In order to screen for tumor-reactivity, 20,000 effector T cells were co-cultured with 100,000 tumor cells for 20 hours. As previously reported,14 15 T-cell recognition was assessed via upregulation of 4-1BB and OX40 on CD8+ and CD4+ cells, respectively, by flow cytometry, and interferon (IFN)-γ secretion by IFN-γ ELISpot. Briefly, co-cultured cells were stained with the corresponding antibodies for 30 min at 4°C (online supplemental table 2) and acquired on a BD LSRFortessa. In parallel, IFN-γ secretion was detected using IFN-γ capture and detection antibodies assessed by ELISpot following manufacturer’s recommendations (online supplemental table 6). Co-culture experiments were performed in duplicate. Reactivity was considered positive when the readout values were two times higher than the background control (T cells alone without stimulation) both in flow cytometry and ELISpot, and more than 40 spots were detected by ELISpot. Moreover, these criteria had to be reproduced in both replicates of the experiment. A positive control was included by stimulating the T cells with anti-CD3. An irrelevant TCL was included to determine the specificity of the recognition. In some co-culture experiments, anti-MHC-I or anti-MHC-II blocking antibodies were included at a final concentration of 100 µg/mL or 50 µg/mL, respectively (online supplemental table 2). For anti-MHC-II blocking experiments, we used the IVA12 antibody, an anti-panHLA-II (ATCC HB-145 hybridoma, anti-HLA-DP/DQ/DR antibody). The irrelevant TCLs used in some of the co-cultures can share HLA-I and HLA-II haplotypes with the autologous one being tested. Hence, recognition of the irrelevant TCL by some of the sorted CD8+ or CD4+ T cell populations could be due to recognition of shared antigens, although non-specific reactivity cannot be ruled out.
Kaplan-Meier curves
For Kaplan-Meier curves, tumors were separated into high (HI) or low (LO) frequency groups using Z-score as a cut-off value, and significance was evaluated using the Mantel-Cox method. Survival analyses were performed with GraphPad Prism software V.6 using patient survival data acquired up until October 30, 2021.
Correlation and statistical analyses
Correlation analyses were performed by the non-parametric Spearman rank-order correlation test. For statistical analyses, D’Agostino and Pearson omnibus normality test was performed, and significance was evaluated using parametric Tukey’s, non-parametric Mann-Whitney, Wilcoxon or Dunn’s multiple comparisons test, as indicated. Significance was set at p≤0.05. All analyses were performed using GraphPad Prism software V.6.
Results
T cell infiltration is greater in POLE-mutated EC but is not prognostic
We obtained tumor samples from the surgical resection of 47 patients with treatment-naïve EC that were classified into POLE-mutated, MMRd/MSI, CNH and CNL based on molecular and pathological traits (online supplemental figure 1). Patient characteristics and median follow-up are displayed in table 1.
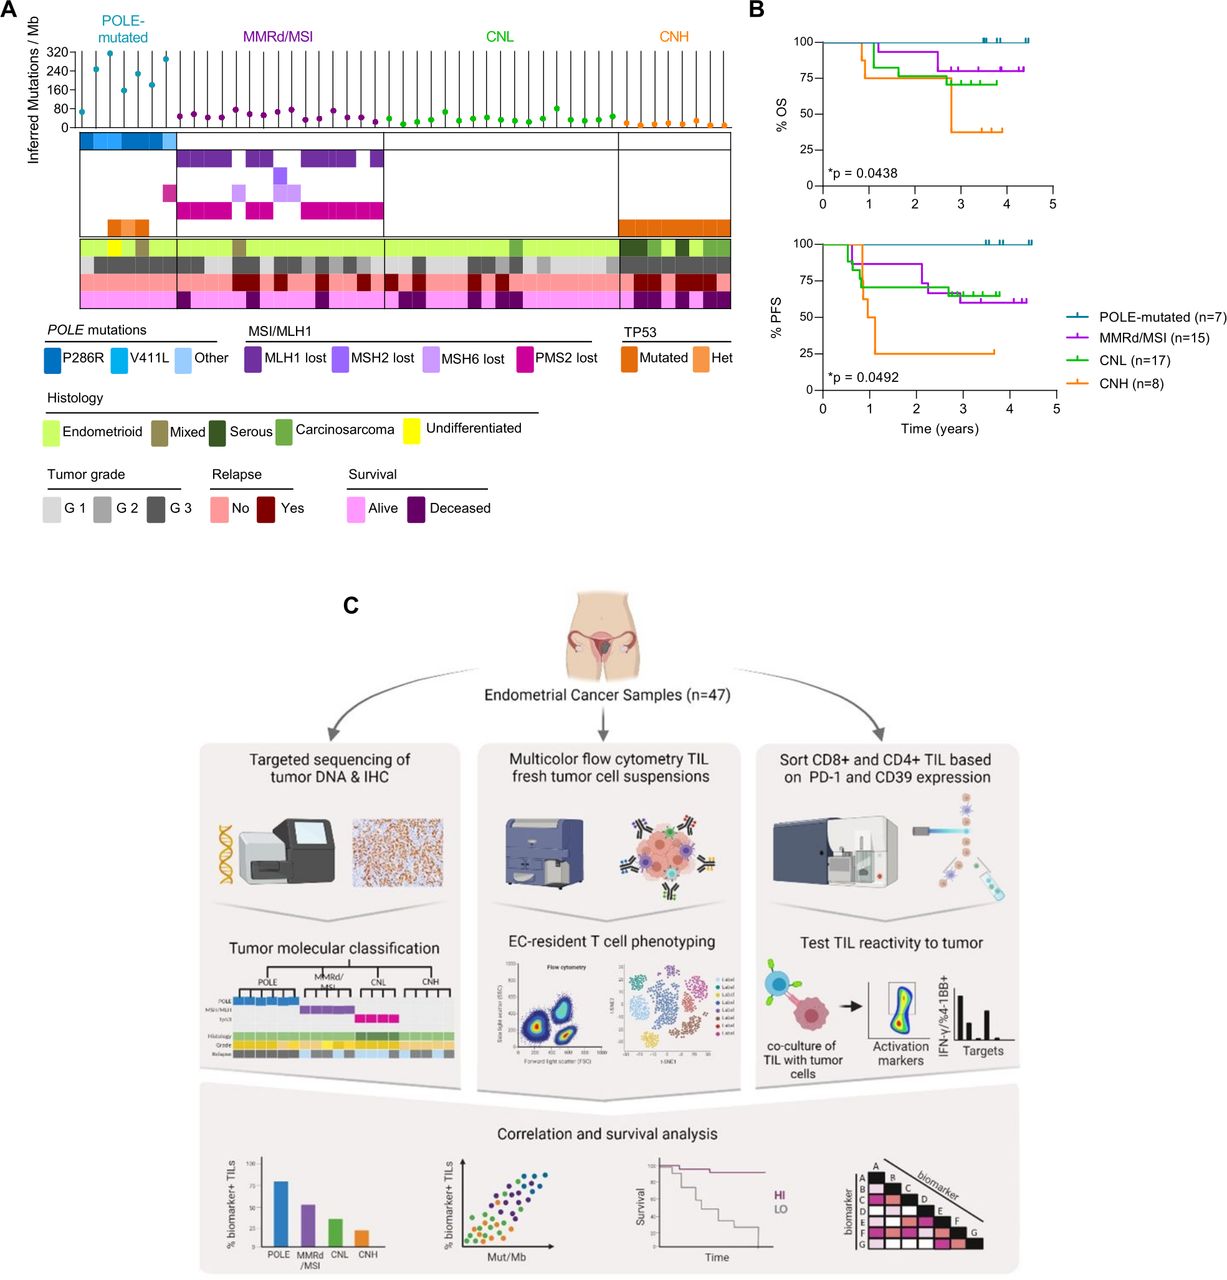
Our cohort consisted mainly of CNL and MMRd/MSI (36% and 32%, respectively), whereas CNH and POLE-mutated tumors were less frequent (17% and 15%, respectively). Most tumors were of endometrioid origin although a few cases corresponded to mixed, carcinosarcoma, undifferentiated or serous histology (figure 1A and table 1). Importantly, patients with POLE-mutated tumors had the best survival, followed by MMRd/MSI, CNL followed by CNH which had the worst survival (figure 1B). Of note, our cohort of 47 patients with primary EC is comparable to the TCGA and other cohorts.2 10

EC patient cohort characterization and workflow of the study. (A) Characterization of each tumor from the cohort of patients included in the study (n=47) into the four molecular subgroups of the disease, analogous to the TCGA (POLE-mutated, blue; MMRd/MSI, purple; CNL, green; CNH, orange). Upper panel depicts the inferred number of mutations/Megabase (Mb) determined by targeted sequencing (each dot represents a tumor). Middle panel shows the mutations detected by targeted sequencing of POLE (blue) and immunohistochemistry (IHC) analysis of mismatch repair (MMR) proteins (PMS2, MLH-1, MSH-6 and MSH-2; purple) and TP53 (orange). Lower panel indicates the histological tumor type and grade, and the outcome for each patient. (B) Kaplan-Meier curves show the overall survival (OS) and progression-free survival (PFS) of the tumors included in the cohort. Significance of survival analyses was evaluated using the log-rank (Mantel-Cox) method. (C) Workflow of the study. Patients in the cohort were classified into four categories (POLE-mutated, MMRd/MSI, CNL and CNH) analogous to the TCGA subgroups (left panel); see A for details. A fragment of the EC primary tumor was digested and stained with specific antibodies to characterize the phenotype of EC-resident lymphocytes (EC-TILs) by flow cytometry (middle panel). CD8 and CD4 TILs were isolated from tumor single-cell suspensions based on the differential expression of PD-1 and CD39 by cell sorting, and the isolated CD8 and CD4 subpopulations were expanded ex vivo. These expanded subpopulations were subsequently assayed for tumor recognition in co-cultures with their autologous tumor cell line measuring IFN-γ production by ELISpot and upregulation of the activation markers 4-1BB on CD8+ or OX-40 on CD4+T cells, by flow cytometry (right panel). Phenotypic markers on CD8 and CD4 TILs were investigated as possible biomarkers by analyzing their association with survival, molecular subtypes and tumor mutational burden (lower panel). CNH, copy-number high; CNL, copy-number low; EC, endometrial cancer; IFN, interferon; MMRd/MSI, mismatch repair deficient or microsatellite instable; PD-1, programmed cell death protein-1; POLE, polymerase-ε; TCGA, The Cancer Genome Atlas; TIL, tumor-infiltrating lymphocyte.
The sequence of tissue collection, processing, experimental data generation and integrative analyses of this study is depicted in figure 1C. We first analyzed by flow cytometry the frequency of CD3+, CD8+ and CD4+ T cells in the tumor single-cell suspensions of EC to investigate whether infiltration was associated with specific EC molecular subtypes or correlated with survival. We observed a variable proportion of CD3+, CD8+ and CD4+ (figure 2A, B), with a predominance of CD4+ lymphocytes (figure 2B). POLE-mutated tumors contained a higher number of CD3+ cells compared with MMRd/MSI, CNL, and CNH (figure 2C). However, the ratio of CD4+ to CD8+ cells and the intensity of the infiltration was highly variable within and among the four EC molecular subtypes.

A general characterization of EC-TIL infiltrate is insufficient to predict patient survival. Tumor single-cell suspensions (n=47) were rested overnight in culture without cytokines and assayed for the infiltration of CD3, CD4 and CD8 lymphocytes. (A, B) Scatter dot plots depict the frequency of CD3+ among total viable cells in tumor single cell suspensions from n=47 tumors (A), and the frequency of CD8+ and CD4+ of CD3+ lymphocytes (B). (C) Frequency of CD3+ (left panel), CD8+ (central panel) and CD4+ (right panel) among each of the four categories of EC. Each dot represents a tumor. (D, E) Kaplan-Meier curves displaying the OS (D) and PFS (E) of the whole cohort of studied EC (n=47) by frequency of CD3+, CD8+ or CD4+ TILs. Z-score was used as a cut-off to divide the patients into high (HI) or low (LO) frequency groups. Tick marks indicate censored data. Statistical significance was analyzed by unpaired non-parametric Mann-Whitney test (B) or Tukey’s multiple comparisons test (C). Significance of survival analyses was evaluated using the log-rank (Mantel-Cox) method; *p<0.05, **p<0.001, ***p<0.0001. n.s, not significant. Data are expressed as mean±SEM. CNH, copy-number high; CNL, copy-number low; EC, endometrial cancer; MMRd/MSI, mismatch repair deficient or microsatellite instable; OS, overall survival; PFS, progression free survival; POLE, polymerase-ε; TIL, tumor-infiltrating lymphocyte.
Given that EC tumors harbor a wide range of somatic non-synonymous mutations (figure 1A), we investigated whether the frequency of the lymphocyte subpopulations correlated with TMB. Consistent with the increased prevalence of CD3+ infiltration in POLE-mutated tumors (figure 2C), which harbor a higher mutational load, a higher frequency of CD3+ infiltrate moderately correlated with TMB (online supplemental figure 2A). However, this correlation was dependent on POLE-mutated EC as there was no correlation between the frequency of CD3+ cells and TMB when POLE-mutated tumors were not included in the analyses (online supplemental figure 2B).
Next, we investigated whether tumors infiltrated with HI or LO frequencies of CD3+, CD8+ or CD4+ showed survival differences. Although POLE-mutated EC were infiltrated by more CD3+ cells (figure 2C) and these patients had the best survival in our cohort (figure 1B), a higher frequency of CD3+ cells did not correlate with survival (figure 2D,E). Consistent with this, a more prominent infiltration by CD8+ or CD4+ cells was not prognostic in our cohort (figure 2D,E).
In addition, we also studied intratumoral TCR-β repertoire diversity and observed no differences in the number of unique CDR3-β rearrangements, clonality or cumulative frequency of the 30 most dominant clonotypes among the four EC molecular subgroups (online supplemental figure 3). Overall, our data are consistent with previous reports and show that the basic phenotypic characterization of EC-TILs does not help predict patient survival.11
POLE-mutated and MMRd/MSI EC and mutational burden are associated with a greater frequency of CD8+ TILs expressing PD-1hi, CD39, TIM-3 and CXCL13
We reasoned that the prevalence of tumor-reactive lymphocytes, rather than the frequency of CD3+, CD8+ or CD4+ infiltration, could predict patient survival. In order to identify EC-TIL subpopulations enriched in EC-reactive CD8+ T cells, we performed an extended phenotypic and functional characterization by measuring by multicolor flow cytometry the expression of markers of inhibitory immune checkpoints (PD-1, LAG-3 and TIM-3), costimulatory receptors (ICOS, CD27 and CD28), ATP metabolism (CD39), activation (HLA-DR and CD38), proliferation (Ki67), functionality (IFN-γ, CXCL13, BCL6, CXCR5, FoxP3 and CD25) and tissue resident memory T cells (CD103) (figure 3A,B and online supplemental figure 4A). Although 4-1BB has been reported to be expressed on a fraction of tumor-reactive CD8+TILs,16 17 preliminary analysis of CD8+ T cells in EC did not consistently display a distinct 4-1BB+ population (data not shown) and this marker was not further analyzed.

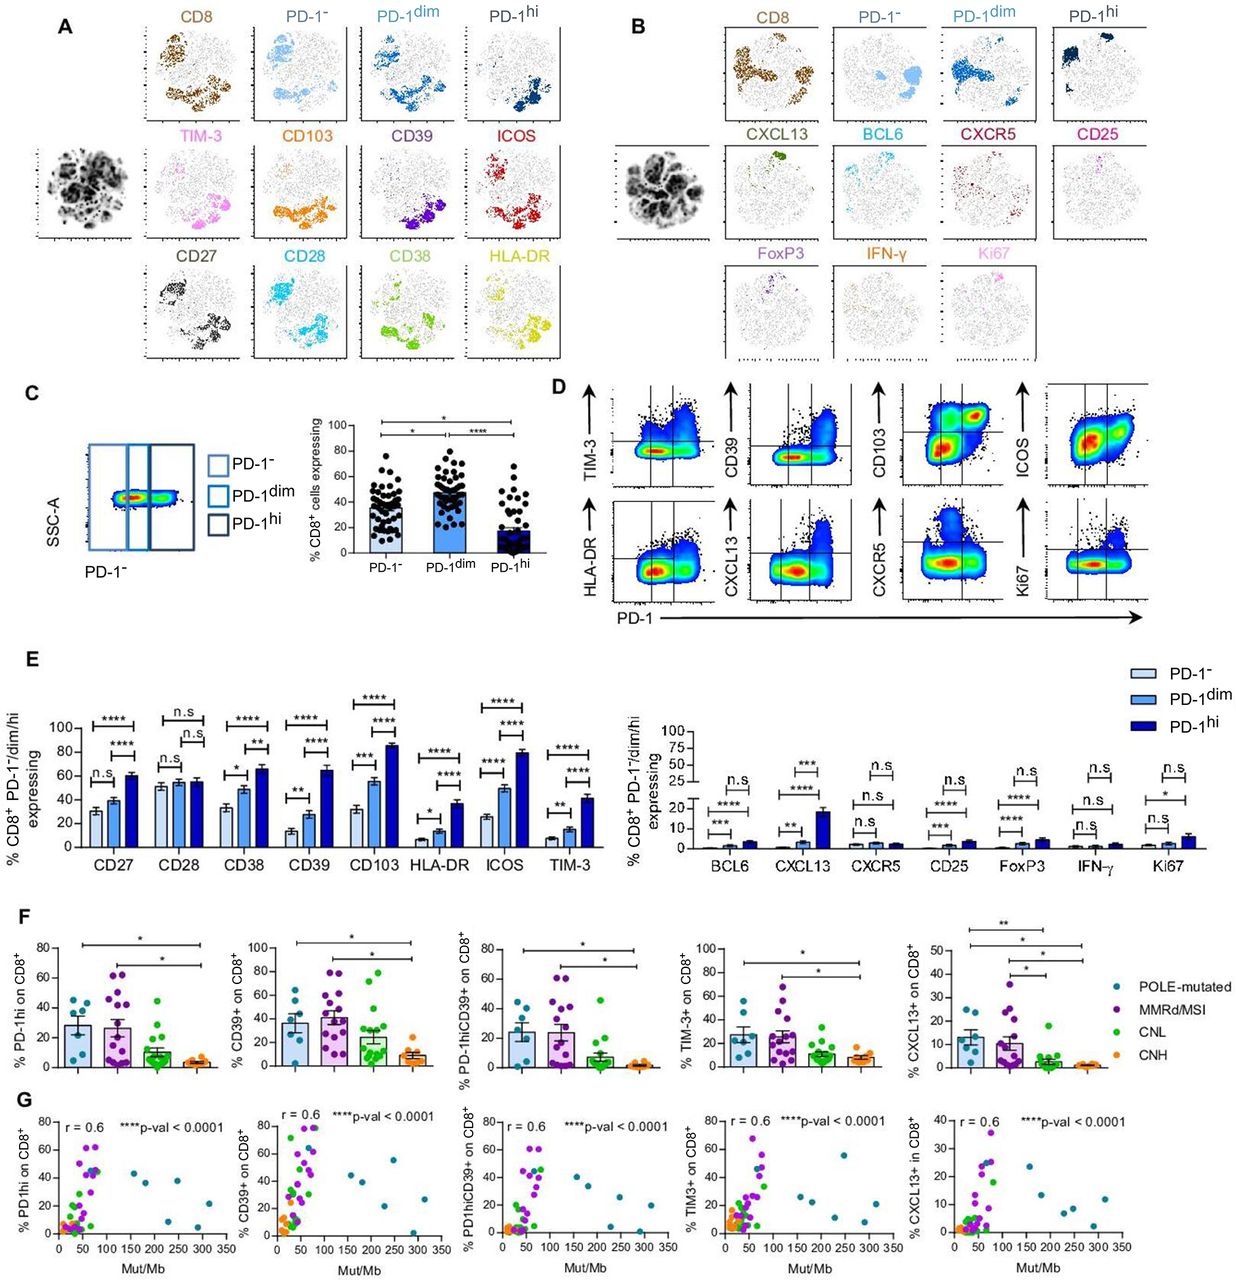
PD-1hi, CD39, TIM-3 and CXCL13 expression on CD8+EC-resident cells associate with POLE-mutated and MMRd/MSI-EC and TMB. Tumor single-cell suspensions (n=47) were rested overnight in culture without cytokines and assayed for the expression of cell surface receptors (A and B), intracellular cytokines or transcription factors (B) by flow cytometry. (A–B) T-SNE visualization of CD8 TILs expressing no PD-1 (PD-1−), intermediate (PD-1dim) or high (PD-1hi) levels of PD-1, and the rest of the investigated markers. T-SNE analyses were performed using 10 concatenated tumor single-cell suspensions (2 POLE-mutated; 2 MMRd/MSI, 4 CNL, and 2 CNH). (C) Representative dot plot showing the gates used to define the different levels of PD-1 expression (PD-1−, PD-1dim or PD-1hi) (left panel) and scatter plot with the frequency of each PD-1 subpopulation in all patients analyzed on CD8+TILs (right panel). (D) Representative flow plots displaying expression of PD-1 and different cell surface or intracellular markers for one tumor sample. (E) Frequency of CD8+PD-1−, PD-1dim or PD-1hi TILs expressing the extracellular (left and right panel) or intracellular (right panel) markers specified. (F) Frequency of CD8+TILs expressing PD-1hi, CD39, PD-1hiCD39, TIM-3 or CXCL13 among the four molecular subtypes of EC (CNL, green; CNH, orange; MMRd/MSI, violet; POLE-mutated, blue). Statistical significance was analyzed by unpaired non-parametric Dunn’s multiple comparisons test (E–F); *p<0.05, **p<0.001, ***p<0.0001; n.s, not significant. (G) Non-parametric Spearman correlation analyses between the frequency of CD8+TILs expressing PD-1hi, CD39, PD-1hiCD39, TIM-3 or CXCL13 and the Mut/Mb of each tumor; r, correlation coefficient. For C, F–G, each dot represents a tumor. Data are expressed as mean±SEM. SSC-A, side scatter area, CNH, copy-number high; CNL, copy-number low; EC, endometrial cancer; IFN, interferon; Mb, Megabase; MMRd/MSI, mismatch repair deficient or microsatellite instable; PD-1, programmed cell death protein-1; POLE, polymerase-ε; t-SNE, T-distributed stochastic neighbor embedding.
EC CD8+ TILs expressed variable levels of PD-1, some lacking PD-1 expression, expressing intermediate or high levels of PD-1, hereafter referred to as PD-1−, PD-1dim and PD-1hi, respectively. Although the frequency of PD-1−, PD-1dim and PD-1hi was very heterogeneous among tumors, EC were more frequently infiltrated by CD8+PD-1dim, followed by PD-1− and, lastly, by PD-1hi TILs (figure 3C). The proportion of CD8+ cells expressing PD-1, CD39, TIM-3, HLA-DR, ICOS, CD103, CD27, CD28 and CXCL13 was highly variable, ranging from low to very high. In contrast, most CD8+EC-resident T cells expressed low levels of BCL6, CXCR5, CD25, FoxP3 and IFN-γ in absence of stimulation (online supplemental figure 4A). The frequencies of Ki67+ lymphocytes, particularly in the PD-1hi subset, were unexpectedly low, although this could be influenced by the overnight rest prior to phenotyping. We further examined the co-expression pattern of the cell surface and intracellular markers analyzed with PD-1 on CD8+ EC TIL (figure 3D). T-SNE analyses evidenced that CD103, ICOS and CD27 were variably expressed, irrespective of PD-1 expression (figure 3A,B). On the other hand, CD28 and CD38 expression was preferentially detected on PD-1− or PD-1dim cells. CD39, TIM-3, HLA-DR and CXCL13 were mostly expressed on the CD8+PD-1hi TILs. Moreover, we observed that CD8+PD-1hi cells co-expressed higher levels of CD27, CD38, CD39, CD103, HLA-DR, ICOS, TIM-3 and CXCL13 compared with PD-1− and PD-1dim cells (figure 3E).
To investigate the potential of the T-cell subsets to help stratify and guide EC patient management, we analyzed their association with the different molecular subtypes of EC and TMB. POLE-mutated and MMRd/MSI EC, which have a better prognosis (figure 1B), exhibited a higher frequency of CD8+ TILs expressing PD-1hi, CD39, PD-1hiCD39 or TIM-3, compared with CNH EC, which displayed a poor prognosis (figure 3F, online supplemental figure 7B). In addition, POLE-mutated and MMRd/MSI also had a higher proportion of CD8+CXCL13+ cells than CNL and CNH. No further differences were detected among the four molecular subgroups (online supplemental figure 5). The fraction of CD8+ cells expressing PD-1hi, CD39, PD-1hiCD39, TIM-3 or CXCL13, correlated positively with TMB (figure 3G). Moreover, when POLE-mutated tumors were removed from the analyses, the correlations were maintained (online supplemental figure 6A), supporting that they were not only relevant in hypermutated tumors.
Overall, our results suggest that the infiltration of CD8+ subsets expressing PD-1hi, CD39, TIM-3 and CXCL13, which are more prevalent in tumors with improved survival, could guide the identification of tumor-reactive lymphocytes and help predict patient survival.
PD-1 and CD39 co-expression defines the CD8+ tumor-reactive lymphocytes infiltrating EC and this population positively associates with improved survival
PD-1, CD39, CD103 and 4-1BB have been previously described as markers expressed on CD8+ tumor-reactive lymphocytes.16–21 Despite reports describing CD103 expression as a prognostic marker in EC,13 we did not further study CD103 as a candidate marker expressed on tumor-reactive lymphocytes, since CD103 was poorly expressed on CD4+EC TILs and our goal was to dissect the antitumor reactivity of both CD8+ and CD4+ lymphocytes (online supplemental figure 4B). Instead, we focused on studying the significance of PD-1 and CD39 expression by TILs with regards to their ability to recognize tumor. We first investigated which of the subpopulations of CD8 TILs expressing different combinations of these cell surface receptors, that is, PD-1−, PD-1dim, PD-1hi, CD39−, CD39+, PD-1-CD39, PD-1-CD39+, PD-1dimCD39−, PD-1dimCD39+, PD-1hiCD39−, PD-1hiCD39+, contained tumor-reactive CD8+ lymphocytes (figure 4A, online supplemental figure 7A, table 7). To this end, we tested the sorted and ex vivo expanded CD8+ subsets from four EC for recognition of their autologous TCLs, all of which expressed MHC-I at basal levels and more intensely after IFN-γ incubation (online supplemental figure 8A).

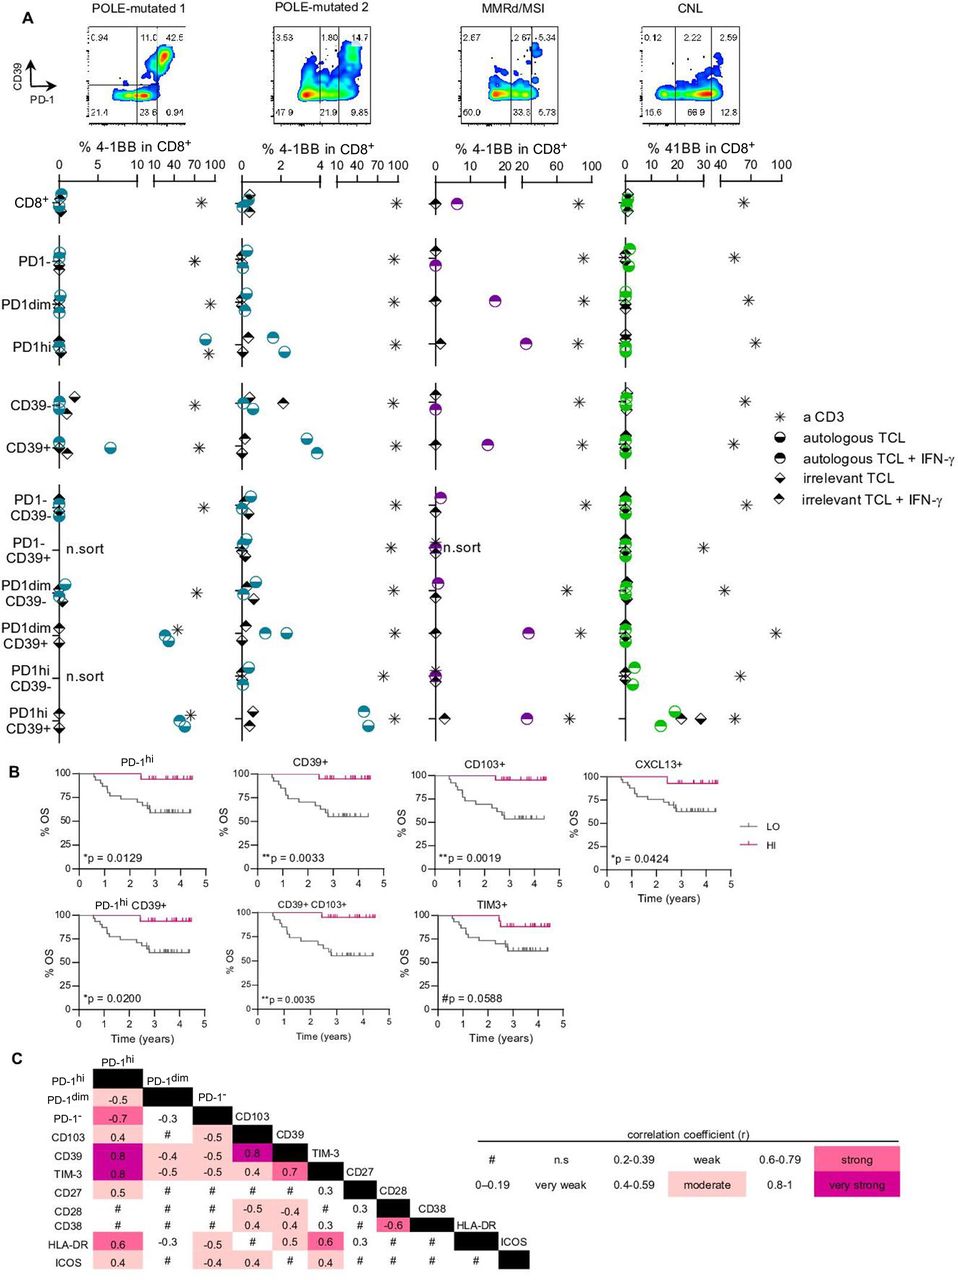
Expression of PD-1hi and CD39 on CD8 TILs enriches tumor recognition and associates with improved survival. (A) Specific CD8 subpopulations from four tumor single-cell suspensions (POLE-mutated 1, POLE-mutated 2, MMRd/MSI and CNL) were isolated based on the differential expression of PD-1 and CD39 (flow cytometry plots in the four upper panels) and expanded in vitro for 14 days. After expansion, all the isolated and expanded subpopulations were co-cultured with the corresponding autologous tumor cell line (TCL) to screen for tumor recognition; recognition was assessed by the upregulation of the activation marker 4-1BB on CD8+ cells. Cultures stimulated with anti-CD3 (a CD3) provided the positive control and T cells cultured without the TCL, the negative (background) control. Co-cultures with an irrelevant TCL provided the specificity control (irrelevant TCL). Both the autologous and the irrelevant TCLs were pre-cultured with IFN-γ (autologous TCL+IFN-γ and irrelevant TCL+IFN-γ) to up-regulate MHC-I expression and ensure that low expression of MHC-I did not preclude recognition. For each specific CD8+ subpopulation, the background values of 4-1BB upregulation were subtracted from all other conditions. For each patient screened, representative results of two independent experiments are shown in the four bottom panels. n.sort, not sorted. (B) Kaplan-Meier survival curves according to the frequency of PD-1hi, CD39+, CD103+, CXCL13+, PD-1hiCD39+, CD39+CD103+ or TIM-3+ cells on CD8+TILs using the z-score as a cut-off to divide the patients into high (HI) or low (LO) frequency groups. Significance was evaluated using the log-rank (Mantel-Cox) method. Tick marks indicate censored data (n=47). (C) Heatmap matrix depicting the correlation coefficients between the frequency of CD8+ cells expressing a given marker and the frequency of CD8+ cells expressing the remaining markers included in the extracellular flow cytometry panel. Data were analyzed by the Spearman non-parametric correlation test. All correlations were statistically significant except for the ones indicated with the # symbol (n.s, not significant). The color code denotes significant correlations irrespective of being negative or positive. CNL, copy-number low; IFN, interferon; MMRd/MSI, mismatch repair deficient or microsatellite instable; OS, overall survival; PD-1, programmed cell death protein-1; POLE, polymerase-ε; TIL, tumor-infiltrating lymphocyte.
Tumor-reactive TILs were only detected in CD8+ T cell subsets expressing both PD-1 and CD39, but not in PD-1− or CD39− fractions, as shown by 4-1BB upregulation and IFN-γ secretion (figure 4A, online supplemental figures 9,10). While the isolation of PD-1 alone (dim or high) or CD39 alone enriched for tumor-reactive cells in one MMRd/MSI and two POLE-mutated cases, respectively, the co-expression of PD-1hi and CD39 was uniquely capable of capturing tumor-reactive cells in all four EC tested. Moreover, CD8+ cells expressing PD-1hi, but lacking CD39 expression did not recognize tumor cells (figure 4A, online supplemental figure 10, table 8). In the case of the MMRd/MSI EC, tumor-reactivity of CD8+PD-1dim, PD-1hi, CD39+, PD-1dimCD39+ and PD-1hiCD39+ subpopulations were confirmed to be MHC-I restricted since antibody-mediated MHC-I blockade abrogated tumor recognition (online supplemental figure 10C,D). Our data demonstrates that both PD-1 and CD39 are co-expressed on EC-reactive T cells.
As previously reported in other solid malignancies,20 21 we found that CD39 expression on CD8+PD-1+ lymphocytes more specifically distinguished the tumor-reactive TILs from bystander CD8+PD-1+CD39− lymphocytes. In addition, we found that a higher expression of PD-1 within the CD39+ lymphocytes was associated with a greater mean fluorescence intensity (MFI) of CD39 expression and higher frequency of tumor-reactive lymphocytes (online supplemental figure 4C, figure 4A, online supplemental table 8).
Despite their ability to secrete IFN-γ following ex vivo expansion, CD8+T cells expressing high levels of PD-1 and CD39 detected in tumor single cell suspensions, containing the vast majority of tumor-reactive lymphocytes, rarely expressed IFN-γ in absence of stimulation (figure 3B,E). Instead, CD8+PD-1hi (figure 3B,E, online supplemental figure 4D) and CD8+CD39+ lymphocytes frequently expressed the CXCL13 chemokine, a B-cell chemoattractant reported to be critical for the formation of germinal centers, including tumor-associated tertiary lymphoid structures (TLS).22 23 Of note, detection of CXCL13 expression by CD8+PD-1hi TILs did not require exogenous stimulation, suggesting that tumor-reactive cells exist in a distinct functional state at the tumor.
To investigate the potential of the T-cell subsets enriched in tumor-reactive cells as EC prognostic biomarkers that could contribute to guide patient management, we analyzed the association of these subsets with patient survival. OS analyses showed that patients bearing tumors with a high content of CD8 TILs expressing PD-1hi, CD39, CD103, CXCL13, PD-1hiCD39+ or CD103+CD39+ phenotype had a significantly longer survival (borderline longer also for TIM-3) (figure 4B). Interestingly, the frequency of CD8+TILs expressing these biomarkers also correlated with POLE-mutated and MMRd/MSI-EC and TMB (figure 3F,G). None of the remaining markers correlated with survival in EC (data not shown).
Since none of the POLE-mutated cases relapsed (figure 1A,B, table 1), we repeated the survival analyses removing POLE-mutated cases to exclude the possibility that the dominant effect of this type of tumor was biasing the analysis. Indeed, survival remained associated with TILs expressing the above markers also in the cohort of patients including the three other molecular categories of EC tumors (online supplemental figure 6B). Interestingly, the proportion of PD-1hi, CD39+ and CD103+ cells were mutually correlated (figure 4C).
Altogether, our results show that co-expression of PD-1hi and CD39, as well as expression of CXCL13 and CD103 which are highly co-expressed with PD-1hi or CD39 (online supplemental figure 6C and figure 4C) are features of CD8+ tumor-reactive lymphocytes, suggesting that they mark CD8 T cells that protect against EC recurrence, underscoring their potential as prognostic biomarkers for patients with EC.
CD4+ PD-1hi and CXCL13+ Tconv cells are associated with POLE-mutated EC and tumor mutational burden
Accumulating evidence supports an important role for CD4+ antitumor responses in cancer immunotherapy.24–26 However, the identification of specific tumor-reactive subpopulations contributing to tumor clearance or improved patient survival warrants further investigation. Similar to CD8+ EC-resident cells, we detected CD4+T cells with a range of PD-1 expression (PD-1−, PD-1dim or PD-1hi cells) (figure 5A,B). Since CD4+T cells contain Treg cells, characterized by expression of FoxP3, and these can display a phenotype similar to activated conventional CD4+T cells (Tconv), we aimed to analyze the expression patterns of the studied markers on Treg and Tconv TILs (n=15 for extracellular or n=47 for intracellular markers; figure 5A,B, online supplemental figure 11A).

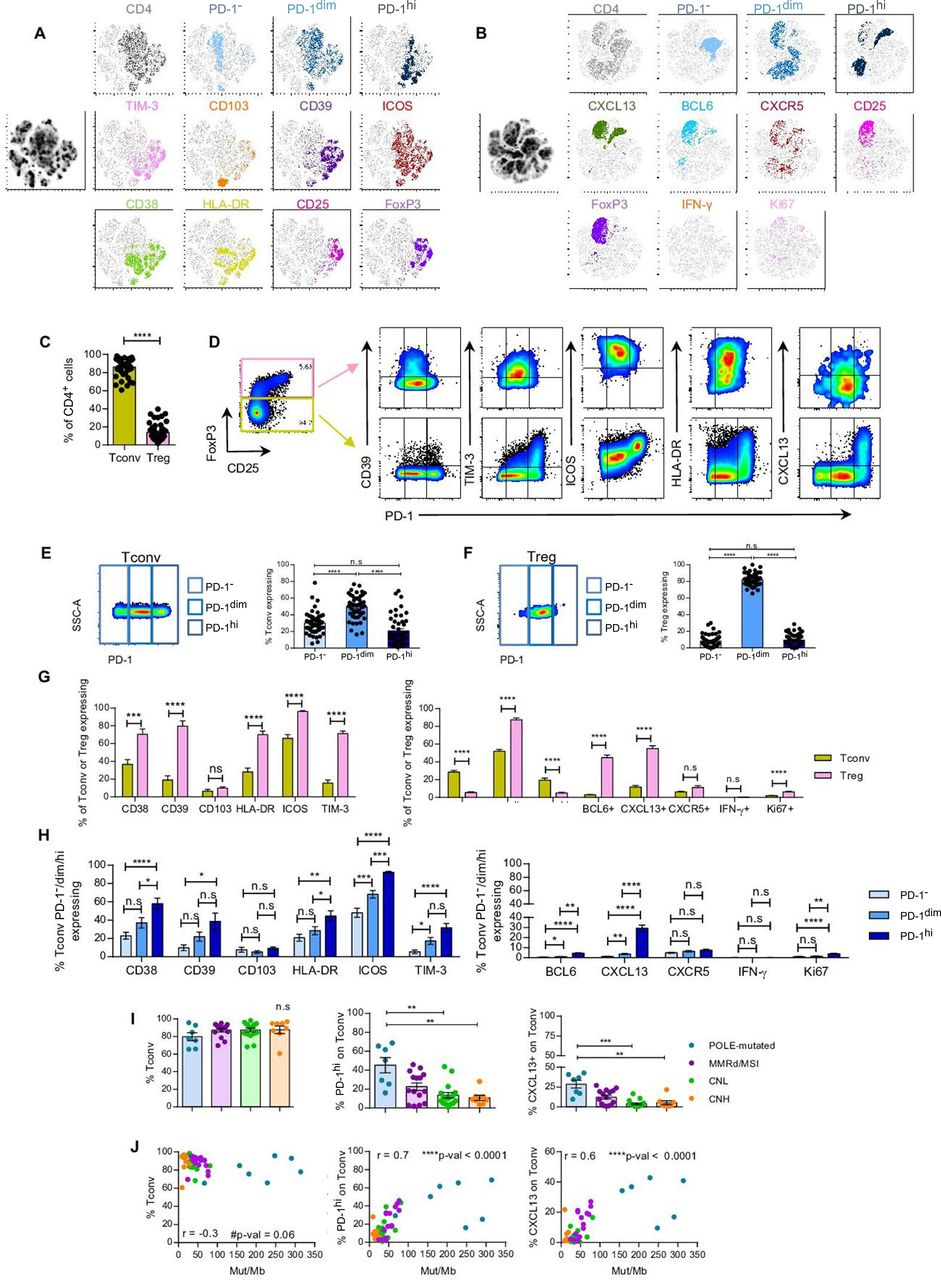
CD4+Tconv PD-1hi and CXCL13+ cells associate with POLE-mutated EC and tumor mutational burden. Tumor single-cell suspensions were rested overnight in culture without cytokines and assayed for the expression of cell surface receptors, intracellular cytokines or transcription factors by flow cytometry. (A–B) T-SNE visualization of CD4 TILs expressing no PD-1 (PD-1−), intermediate (PD-1dim) or high (PD-1hi) levels of PD-1, and the markers specified. T-SNE analyses were performed concatenating 15 (4 POLE-mutated, 4 MMRd/MSI, 3 CNH and 4 CNL) (A) or 10 (2 POLE-mutated, 2 MMRd/MSI, 2 CNH and 4 CNL) (B) tumor single-cell suspensions. (C) Frequency of CD4+Tconv (FoxP3−) and Treg (FoxP3+) TILs (n=47). (D) Representative flow cytometry plots displaying the gating strategy to define CD4+ Tconv and Treg TIL and co-expression of PD-1 and the indicated cell surface or intracellular markers. (E–F) Representative dot plots showing the gates to define the different expression levels of PD-1 (PD-1−, PD-1dim or PD-1hi) (left panels) and bar plots displaying the percentage of each subpopulation on CD4+ Tconv (E) or Treg (F) TILs (right panels) (n=47). (G) Frequency of CD4+ Tconv or Treg TILs expressing specific cell surface (n=15; left graph) or intracellular (n=47; right graph) markers. (H) Frequency of CD4+ Tconv PD-1−, PD-1dim or PD-1hi TILs co-expressing the depicted extracellular (n=15; upper graph) or intracellular (n=47; lower graph) markers. (I) Frequency of CD4+ Tconv, PD-1hi or CXCL13+ Tconv TILs among the four molecular subtypes of EC (CNL, green; CNH, orange; MMRd/MSI, violet; POLE-mutated, blue). Statistical significance was analyzed by non-parametric unpaired Mann-Whitney (C), Wilcoxon (G), Dunn’s multiple comparisons (H–I) or paired Dunn’s multiple comparisons (E–F); *p<0.05, **p<0.001, ***p<0.0001; n.s, not significant. (J) Non-parametric Spearman correlation analyses between the frequency of CD4+Tconv, PD-1hi or CXCL13+ Tconv TILs and the Mut/Mb of each tumor; r, correlation coefficient. For C, E–F, H–I, each dot represents a tumor. Data are expressed as mean±SEM. CNH, copy-number high; CNL, copy-number low; IFN, interferon; Mb, Megabase; MMRd/MSI, mismatch repair deficient or microsatellite instable; PD-1, programmed cell death protein-1; POLE, polymerase-ε; Tconv, T conventional; TIL, tumor-infiltrating lymphocyte; Treg, T regulatory; t-SNE, T-distributed stochastic neighbor embedding.
In EC, Tconv (CD4+FoxP3−) were much more abundant than Treg (CD4+FoxP3+) TILs (figure 5C). Both Tconv and Treg generally expressed an activated phenotype characterized by expression of PD-1, CD38, CD39, HLA-DR, ICOS, TIM-3, BCL6 and CXCL13 (figure 5D–G). Although the expression of these markers was higher on Treg compared with Tconv cells, Treg were almost exclusively PD-1dim, whereas Tconv displayed variable frequencies of PD-1−, PD-1dim and PD-1hi lymphocytes (figure 5A, B and E–G). Of note, FoxP3 and CXCL13 were co-expressed, with 40% of CXCL13+CD4+ cells displaying FoxP3+ expression (online supplemental figure 11B,C). Furthermore, CD4+PD-1hi Tconv, but not Treg, co-expressed higher levels of CD38, HLA-DR, ICOS, BCL6, CXCL13 and Ki67 compared with PD-1dim or PD-1− cells (figure 5H, online supplemental figure 11D), suggesting that, similarly to CD8+TILs, CD4+PD-1hi Tconv cells may also concentrate the antitumor reactivity.
We next investigated whether specific phenotypic or functional traits expressed by CD4+ T cells were associated with any of the molecular subgroups of EC or TMB. POLE-mutated EC contained a lower frequency of CD4+PD-1− and a higher frequency of CD4+PD-1hi and CXCL13+ TILs compared with CNL and CNH; specifically, these differences were observed on CD4+ Tconv but not Treg cells (figure 5I, online supplemental figure 11E, 12A,B). However, no additional differences were observed regarding the prevalence of CD4+ EC-resident cells expressing CD39, PD-1hiCD39 phenotype or any of the remaining markers included in the analyses (online supplemental figure 12). The abundance of CD4+ TILs expressing PD-1hi or CXCL13, specifically on Tconv but not Treg, positively and strongly correlated with TMB (figure 5J, online supplemental figure 11F). Overall, as with CD8+ TILs, the positive association between expression of these markers on CD4+ Tconv and TMB was maintained when POLE-mutated tumors were removed from the analyses (online supplemental figures 13A).
Altogether, our results suggest that PD-1hi and CXCL13 expression is more prevalent on CD4+ Tconv cells infiltrating POLE-mutated tumors with an outstanding survival, suggesting this population may be enriched in tumor-reactivity.
High expression of PD-1 marks CD4+ EC-infiltrating lymphocytes capable of recognizing tumor cells and associates with improved patient survival
In view of the variable expression and co-expression of PD-1 and CD39 on CD4+ lymphocytes (online supplemental figure 7A,C), we sought to investigate the tumor reactivity of CD4+ EC TILs isolated from four tumor samples (online supplemental figure 7A, table 9). Since none of the TCLs previously used expressed MHC-II constitutively (online supplemental figure 8, top panel), we either pretreated the TCLs with IFN-γ or transduced them with a lentivirus to constitutively overexpress hCIITA (POLE-mutated 1 and MMRd/MSI TCLs; online supplemental figure 8B,C). Next, we screened the sorted and expanded CD4 subpopulations against the autologous MHC-II+TCLs. When only using PD-1hi or CD39 expression to separate CD4+T cells into five subpopulations (PD-1−, PD-1dim, PD-1hi, CD39−, CD39+) tumor-reactive lymphocytes were detected in the PD-1hi and CD39+ subsets based on OX40 upregulation in three of four patients screened (POLE-mutated 1 and 2, and CNL), but not in the corresponding CD4+PD-1− nor CD4+CD39− populations (figure 6A, online supplemental figure 14).

Expression of PD-1hi and CD39 on CD4+ Tconv TILs defines subpopulations with distinct tumor recognition potential and correlation with patient survival. (A) Specific CD4 subpopulations from four tumor single-cell suspensions (POLE-mutated 1, POLE-mutated 2, MMRd/MSI and CNL) were isolated based on the differential expression of PD-1 and CD39 (flow cytometry plots in the four upper panels) and expanded in vitro for 14 days. After expansion, all the isolated and expanded subpopulations were co-cultured with the corresponding autologous tumor cell line (TCL) to screen for tumor recognition; recognition was assessed by the upregulation of the activation marker OX40 on CD4+ cells. Cultures stimulated with anti-CD3 (a CD3) were used as positive control and T cells cultured without the TCL as negative control. Co-cultures with an irrelevant TCL provided the specificity control (irrelevant TCL). To ensure optimal MHC-II expression, POLE-mutated 1 and MMRd/MSI TCLs were lentivirally transduced with human CIITA (hCIITA+autologous TCL) whereas POLE-mutated 2 and CNL TCLs were incubated overnight with 30 ng/mL IFN-γ (autologous TCL +IFN-γ). For each specific CD4+ subpopulation, the background values of OX40 upregulation were subtracted from all other conditions. For each patient screened, representative results of two independent experiments are shown in the four bottom panels. n.sort, not sorted; n.r, not reactive as results were not consistent in the two replicates of the experiment. (B) Kaplan-Meier survival curves according to the frequency of PD-1hi or CXCL13+CD4+ Tconv (FoxP3−) or Treg (FoxP3+) TIL (upper and lower graphs, respectively) using the z-score as a cut-off to divide the patients into high (HI) or low (LO) frequency groups; significance was evaluated using the log-rank (Mantel-Cox) method. Tick marks indicate censored data (n=47). (C) Heatmap matrix depicting the correlation coefficients between the frequency of CD4+Tconv expressing a given marker and the frequency of CD4+Tconv expressing the specified extracellular (n=15) and intracellular (n=47) markers measured by flow cytometry. Data were analyzed by the Spearman non-parametric correlation test. All correlations were statistically significant except for the ones indicated with the # symbol (n.s, not significant). The color code denotes significant correlations irrespective of being negative or positive. CIITA, human Class II Major Histocompatibility Complex Transactivator; CNL, copy-number low; IFN, interferon; MMRd/MSI, mismatch repair deficient or microsatellite instable; OS, overall survival; PD-1, programmed cell death protein-1; POLE, polymerase-ε; Tconv, T conventional; TIL, tumor-infiltrating lymphocyte.
Of the six CD4+ tumor-resident subpopulations (PD-1−CD39−, PD-1−CD39+, PD-1dimCD39−, PD-1dimCD39+, PD-1hiCD39− and PD-1hiCD39+), both the PD-1hiCD39+ and the PD-1hiCD39− lymphocytes contained lymphocytes reactive to autologous TCLs in all four EC (figure 6A, online supplemental figures 15-17, table 8). For POLE-mutated 1 and 2, tumor reactivity of CD4+PD-1hi and CD4+CD39+ was confirmed to be MHC-II restricted, since MHC-II blockade abrogated (POLE-mutated 1) or reduced (POLE-mutated 2) tumor recognition (online supplemental figures 15,16). Similarly, tumor reactivity of CD4+PD-1hiCD39− and PD-1hiCD39+ subpopulations was confirmed to be MHC-II restricted since it was partially reduced for POLE-mutated 1 and 2, and MMRd/MSI (online supplemental figures 15-17).
Our findings demonstrate that ECs are frequently infiltrated by tumor-reactive CD4+ lymphocytes in addition to CD8+ lymphocytes. Of the markers studied, PD-1 more comprehensively identified the tumor-infiltrating T cells enriched in tumor-reactivity. As opposed to their CD8+ counterparts, CD4+ tumor-reactive T cells did not always express CD39. Despite their ability to secrete IFN-γ following ex vivo expansion, the CD4+ PD-1hi cells infiltrating primary EC also lacked expression of IFN-γ in the absence of stimulation, but consistently displayed expression of CXCL13 (figure 5B,D), supporting convergent functional states of both tumor-reactive CD4+ and CD8+ TILs in the tumor microenvironment.
Finally, we investigated whether specific phenotypic features of CD4+ TILs correlated with patient prognosis. Tumors highly infiltrated with CD4+ lymphocytes expressing PD-1hi or CXCL13 specifically on Tconv, but not on Treg, were associated with improved survival of patients with EC (figure 6B); none of the remaining studied markers did so (data not shown). The proportion of CD4+PD-1hi Tconv TILs strongly correlated with the frequency of CD4+TIM-3+, CD38+, ICOS+ or BCL6+ cells and very strongly with CD4+CXCL13+ lymphocytes (figure 6C). Moreover, the frequency of CD4+PD-1hi or CXCL13+ TILs strongly correlated with CD8+PD-1hi or CXCL13+ cells (online supplemental figure 11G). Again, these correlations were only observed for Tconv but not on Treg TILs (online supplemental figures 11G,13B). These data are in agreement with the results from the TCL-reactivity experiments which showed that PD-1hi rather than CD39+ was a feature of tumor-reactive CD4+ TILs and therefore a possible prognostic marker.
Importantly, the associations between the frequency of PD-1hi or CXCL13+CD4+ Tconv cells and improved survival were not significant when POLE-mutated tumors were excluded from the analyses (online supplemental figure 13D), supporting that this correlation was driven by this particular EC subtype. Since high levels of PD-1 and expression of CXCL13 were also particularly high in POLE-mutated EC tumors compared with the other molecular subtypes (figure 5I), our data suggests that the CD4+ subsets expressing these biomarkers containing the tumor-reactive cells may be actively contributing to the protective antitumor immunity and outstanding survival in this particular patient population.
Discussion
T cells play an important role in antitumor immunity and the identification of tumor-specific T cells in patients with cancer is critical to understand and develop more effective personalized immunotherapies. Tumor-specific T cells accumulate in tumors, but tumors are also infiltrated by bystander T cells and only a minority of tumor-resident T cells recognize tumor.27 Here we investigated the prevalence, phenotype, specificity and prognostic value of T cells, with an important emphasis on the tumor-reactive CD8+ and CD4+ T cell subsets infiltrating primary EC.
Regarding CD8+TILs, co-expression of both PD-1 and CD39 better defined the population of tumor-reactive lymphocytes, as compared with PD-1 or CD39 alone. Specifically for the two POLE-mutated patients (figure 4), there were stark differences in the enrichment for tumor-reactive T cells between the CD39+ and the PD-1hiCD39+ subpopulations even though the majority of CD39+ cells expressed high levels of PD-1. This suggests that CD8+PD-1+CD39-or CD8+PD-1-CD39+TIL subsets, containing mainly bystander non-reactive TILs, can dilute out or even overgrow the tumor-reactive populations and strongly argues in favor of selecting T cells co-expressing both markers to obtain more enriched populations of reactive cells.
Importantly, our data revealed heterogeneity within CD8+ tumor-reactive TILs. CD8+PD-1+CD39+ TILs, including both cells expressing intermediate and high levels of PD-1, were both enriched in tumor-reactive lymphocytes. A greater expression of PD-1 by CD8+CD39+ cells was associated with an increased MFI of CD39 expression and a greater frequency of tumor-reactivity. Recent findings from experimental mouse models suggest that CD8+T cell dysfunction is shaped, at least in part, by TCR affinity, with higher levels of CD39 detected on TILs with higher affinity,28 and that targeting tumor antigens with intermediate affinity or selecting TILs with intermediate levels of CD39 expression exhibit more effective antitumor responses.28 29 Moreover, other studies have reported PD-1 stem-cell like cells.30 31 Interestingly, both the frequency of CD8+PD-1hiCD39+ and CD8+PD-1dimCD39+, displaying lower levels of CD39, independently correlated with improved survival of patients with EC (data not shown). Further studies should address whether this discrete population of CD8+PD-1dimCD39+TILs are less dysfunctional, represent the PD-1 stem-cell like cells and/or harbor T cells with lower TCR avidity and their relative contribution to improved survival, response to immune checkpoint blockade (ICB) or more effective T-cell products for adoptive cell therapy (ACT).
With regards to CD4+TILs, lymphocytes expressing high levels of PD-1 were enriched in tumor-reactive cells. The detection of tumor-reactive cells was independent of CD39 expression levels, contrasting with prior literature indicating that CD4+CD39+ or CD4+PD-1hiCD39+ lymphocytes contain tumor-reactive lymphocytes in HPV16 or HPV18 E6/E7+ anogenital, head and neck cancers or NY-ESO-1+ ovarian cancers.25 32 In agreement with a recent publication,33 we found that CD4+PD-1hi TILs containing the vast majority of tumor-reactive cells expressed ICOS. However, ICOS was not specifically expressed on the CD4+PD-1hi tumor-reactive subset, since this co-stimulatory receptor was detected on a high proportion of CD4+TILs, regardless of PD-1 expression, although preferentially detected on Tregs displaying intermediate levels of PD-1. Our data demonstrates that CD4+TILs recognizing tumor antigens can frequently be detected. Of note, the relatively low frequency of CD4+ lymphocytes reactive to tumor antigens detected by forcing tumor-intrinsic HLA-II expression may be an underestimation, given that they could potentially recognize additional tumor antigens via indirect presentation by antigen-presenting cells.34
Seven recent publications exploiting single-cell RNA-seq and TCR-seq coupled with testing specific TCRs for tumor or neoantigen recognition studies have revealed that CD8+ and CD4+ neoantigen-reactive cells are defined by a transcriptional program associated with T-cell exhaustion, leading to the discovery of new genes that were not previously associated with this state and novel gene or phenotypic signatures to prospectively identify neoantigen-specific CD8+ or CD4+ TCRs have been reported.34–40 This strategy can overcome some of the limitations of our experimental approach, namely, the inherent bias in marker selection, and TIL culture and functional testing which could potentially hinder the detection of tumor-reactivity as a result of tumor-induced T-cell dysfunction. Nonetheless, some of the markers reported to be preferentially expressed on tumor-reactive lymphocytes using such single-cell approaches are consistent with those we identified in EC, providing further validation of our experimental strategy and suggesting that the reported molecular signatures can be extended to EC. The consistency between our findings in primary tumors and those reported by these studies, largely focused on TIL derived from metastases treated with multiple therapies, suggest that at least some of the markers reported, for example, PD-1hi, CD39 and CXLC13 are consistently expressed on tumor-reactive TILs at different stages of the disease.
In our study, CD8+ and CD4+ T cell subsets containing tumor-reactive lymphocytes in the tumor microenvironment display a convergent functional state, defined by no IFN-γ expression but production of CXCL13 in the absence of exogenous stimulation. This chemokine is a key B-cell chemoattractant41 well-recognized for its promotion of TLS formation, ectopic lymphoid formations where local and systemic B and T-cell responses against cancer are initiated and maintained.42–44 CXCL13 has been shown to play an important role in the effectiveness of ICB in patients and preclinical mouse models.45 46 Our data demonstrates that tumor-reactive CD8+ and CD4+ T cells represent a major source of CXCL13, suggesting they are directly involved in TLS formation or maintenance in the tumor microenvironment, which is associated with better survival in EC47 48 and with improved response to ICB in several cancer types.22 23 43 47 49–51 However, the contribution of CXCL13 to the antitumor immune responses in EC warrants further investigation. Additional studies interrogating the association between the infiltration of tumor-reactive CD8 and/or CD4 EC-TILs expressing CXCL13 with the presence of TLS, B cells and survival of the patients or response to immunotherapy should be performed to help clarify the role of CXCL13 in EC.
EC represents an ideal model to evaluate the paradigm that high mutational burden tumors promote favorable antitumor immune responses since it comprises tumors with varying degrees of mutations. We did not observe differences on TCR-β repertoire diversity among the four EC molecular subtypes, suggesting that all types of EC are able to mount T-cell responses. This is in line with our own, as well as prior observations, that brisk T-cell infiltrates can be detected in POLE-mutated and MMRd/MSI, but also among CNL and CNH.11 52 Recent studies have also shown that TLS, T follicular helper cells, T-helper cells (CD3+CD4+) and cytotoxic T cells (CD3+CD8+) could be detected infiltrating all four subtypes of EC, although more frequently in POLE-mutated and MMRd/MSI.47 48 53–55 Moreover, our data establish that tumors with low TMB can also be infiltrated with CD8+ and CD4+ Tconv lymphocytes that can variably express PD-1hi, CD39, and CXCL13, which contain tumor-reactive lymphocytes.
Our work underscores the antitumor protective role of CD8+ and CD4+ tumor-reactive lymphocytes. In this exploratory cohort of EC patients, biomarkers preferentially expressed on TIL subsets containing tumor-reactive lymphocytes that is, PD-1hi, CD39, CXCL13 and CD103 by CD8+TILs and PD-1hi and CXCL13 by CD4+Tconv TILs, were associated with improved prognosis. This is in line with previous work describing that a high infiltration of CD8+CD103+ and CD8+CXCL13+CD103+ lymphocytes detected by IHC is associated with enhanced survival in patients with EC,13 56 and previous data showing that high levels of CXCL13 expression by CD8+TILs is strongly predictive of clinical response and survival following treatment with ICB in non-small cell lung cancer.19 46 Our work highlights the importance of CD4+ tumor-reactive TILs. CD4+TILs, specifically Tconv but not Treg, expressing high levels of PD-1 and CXCL13 were uniquely enriched in POLE-mutated tumors compared with the other molecular subtypes, suggesting that the CD4+PD-1hi tumor-reactive lymphocytes may be actively contributing to the protective antitumor immunity and outstanding survival in this patient population.
Altogether, our results provide insights into the biology of tumor-reactive T cells infiltrating EC and tools to dissect the antitumor CD8+ and CD4+ T cell response infiltrating human tumors that could be extrapolated to other tumor types. We show that tumor-reactive CD8+ and CD4+ Tconv lymphocytes are characterized by expression of PD-1, CD39, CXCL13 and CD103, or by PD-1hi and CXCL13, respectively. These markers can be used to select and enrich diverse populations of CD8+ and CD4+ tumor-reactive T cells for the development of ACT, but also to personalize the patient treatment. The predictive value of these biomarkers in the context of immunotherapy warrants further investigation.
Supplemental material
Data availability statement
Data are available upon reasonable request. All data relevant to the study are included in the article or uploaded as supplementary information.
Ethics statements
Patient consent for publication
Ethics approval
This study involves human participants and was approved by Comité de Ética de Investigación con Medicamentos del Hospital Universitario Vall d’HebronID ethics approval number PR(AG)537/2019. Participants gave informed consent to participate in the study before taking part.
Acknowledgments
We thank R Pujol-Borrell for helpful discussion and revision of the manuscript, and CRG/UPF Flow Cytometry Unit for assistance with cell sorting. Part of this work was presented by AG as an invited speaker at 2022 CIMT Cancer Immunotherapy Annual Meeting, Mainz, Germany, and SITC 36th Meeting 2021, Washington DC, USA.
References
Supplementary materials
Supplementary Data
This web only file has been produced by the BMJ Publishing Group from an electronic file supplied by the author(s) and has not been edited for content.
Footnotes
Contributors JP designed, performed, analyzed and interpreted experiments. CP produced hCIITA-lentiviruses and transduced EC-derived TCLs with hCIITA-expressing lentiviral particles. ML-R established in vitro EC-derived TCLs and obtained tumor single-cell suspensions from patients’ biopsies. RT performed TCR-β sequencing of EC-resident lymphocytes. JD-G cloned hCIITA cloning. DG established in vitro EC-derived TCLs and obtained tumor single-cell suspensions from patients’ biopsies. HP obtained tumor single-cell suspensions from patients’ biopsies. EDD and EGF analyzed TLS by histopathological examination. LA extracted DNA for targeted sequencing experiment. AV performed targeted sequencing of the 47 EC-primary samples. CEdA and IM provided valuable advice. JP performed surgical resection of the primary tumors. AV and XM-G classified patients based on immunohistochemical analyses. JMP supervised the follow-up of the patients. AG contributed to experimental design, supervised the project, and interpreted the data. All authors discussed the results and reviewed the manuscript. JP and AG wrote the manuscript. AG is the guarantor of this work.
Funding AG was funded by the Comprehensive Program of Cancer Immunotherapy and Immunology II (CAIMI-II) supported by the BBVA Foundation (grant 53/2021), the La Fundació La Marató de TV3 (201919-30; identification number 488/C/2019), the Spanish Ministry of Science and Innovation (PID2020-118529RB-100) and Instituto de Salud Carlos III (CP15/00058). We thank the CERCA Programme/Generalitat de Catalunya for institutional support. JP was supported by the Beatriu de Pinós programme (BP 2018), cofounded by the Agency for Management of University and Research Grants (AGAUR) and European Union's Horizon 2020. HUB-ICO-IDIBELL Biobank received support from Instituto de Salud Carlos III (PT20/00171) and by Xarxa de Bancs de Tumors de Catalunya sponsored by Pla Director d’Oncologia de Catalunya (XBTC).
Competing interests AG is a member of the scientific advisory board (SAB) of Achilles Therapeutics, SingulaBIO, RootPath, and BioNTech SE, and consults for PACT Pharma, and Instil BIo. AG is co-inventor of patents licensed and with royalties related to this work E-059-2013/0, E-085-2013/0, E-149-2015/0. IM reports grants from Roche, BMS, AstraZeneca and Genmab, as well as consultancy activities for Roche, BMS, AZ, Phamamar, F-sar, Merus, Amunix, Pieris, Numab, Third Rock and Highlight therapeutics. The authors declare that no other conflict of interest exists.
Provenance and peer review Not commissioned; externally peer reviewed.
Supplemental material This content has been supplied by the author(s). It has not been vetted by BMJ Publishing Group Limited (BMJ) and may not have been peer-reviewed. Any opinions or recommendations discussed are solely those of the author(s) and are not endorsed by BMJ. BMJ disclaims all liability and responsibility arising from any reliance placed on the content. Where the content includes any translated material, BMJ does not warrant the accuracy and reliability of the translations (including but not limited to local regulations, clinical guidelines, terminology, drug names and drug dosages), and is not responsible for any error and/or omissions arising from translation and adaptation or otherwise.