Article Text

Abstract
Background Adoptive cell transfer (ACT) of tumor-infiltrating lymphocytes (TIL) yielded clinical benefit in patients with checkpoint blockade immunotherapy-refractory non-small cell lung cancer (NSCLC) prompting a renewed interest in TIL-ACT. This preclinical study explores the feasibility of producing a NSCLC TIL product with sufficient numbers and enhanced attributes using an improved culture method.
Methods TIL from resected NSCLC tumors were initially cultured using (1) the traditional method using interleukin (IL)-2 alone in 24-well plates (TIL 1.0) or (2) IL-2 in combination with agonistic antibodies against CD3 and 4-1BB (Urelumab) in a G-Rex flask (TIL 3.0). TIL subsequently underwent a rapid expansion protocol (REP) with anti-CD3. Before and after the REP, expanded TIL were phenotyped and the complementarity-determining region 3 β variable region of the T-cell receptor (TCR) was sequenced to assess the T-cell repertoire.
Results TIL 3.0 robustly expanded NSCLC TIL while enriching for CD8+ TIL in a shorter manufacturing time when compared with the traditional TIL 1.0 method, achieving a higher success rate and producing 5.3-fold more TIL per successful expansion. The higher proliferative capacity and CD8 content of TIL 3.0 was also observed after the REP. Both steps of expansion did not terminally differentiate/exhaust the TIL but a lesser differentiated population was observed after the first step. TIL initially expanded with the 3.0 method exhibited higher breadth of clonotypes than TIL 1.0 corresponding to a higher repertoire homology with the original tumor, including a higher proportion of the top 10 most prevalent clones from the tumor. TIL 3.0 also retained a higher proportion of putative tumor-specific TCR when compared with TIL 1.0. Numerical expansion of TIL in a REP was found to perturb the clonal hierarchy and lessen the proportion of putative tumor-specific TIL from the TIL 3.0 process.
Conclusions We report the feasibility of robustly expanding a T-cell repertoire recapitulating the clonal hierarchy of the T cells in the NSCLC tumor, including a large number of putative tumor-specific TIL clones, using the TIL 3.0 methodology. If scaled up and employed as a sole expansion platform, the robustness and speed of TIL 3.0 may facilitate the testing of TIL-ACT approaches in NSCLC.
- immunotherapy
- adoptive
- lung neoplasms
- lymphocytes
- tumor-infiltrating
- translational medical research
- receptors
- antigen
Data availability statement
Data are available on reasonable request.
This is an open access article distributed in accordance with the Creative Commons Attribution Non Commercial (CC BY-NC 4.0) license, which permits others to distribute, remix, adapt, build upon this work non-commercially, and license their derivative works on different terms, provided the original work is properly cited, appropriate credit is given, any changes made indicated, and the use is non-commercial. See http://creativecommons.org/licenses/by-nc/4.0/.
Statistics from Altmetric.com
- immunotherapy
- adoptive
- lung neoplasms
- lymphocytes
- tumor-infiltrating
- translational medical research
- receptors
- antigen
Introduction
Lung cancer is the deadliest cancer with an estimated 135 000 deaths in the USA in 2020 alone.1 The majority of lung cancer diagnoses (~84%) are classified as non-small cell lung cancer (NSCLC).1 Current treatments elicit a limited response with a 5-year survival rate averaging 25% for patients with NSCLC and a mere 7% in patients with metastatic disease (American Cancer Society). The success and response rates associated with immunotherapy in the setting of metastatic melanoma (MM) have resulted in excitement for this type of treatment in NSCLC. Similar to MM, NSCLC exhibits a high mutational burden which correlates with favorable immunotherapy outcomes,2 3 particularly because these somatic mutations may give rise to tumor neoantigens capable of triggering host T-cell responses and eliciting clinical responses.4 5
Anti-programmed death-1 (PD-1) is now the standard of care in advanced NSCLC, demonstrating tumor regression in up to 20% of patients.6–8 Despite these encouraging results, the majority of patients do not respond to treatment or eventually recur. This has prompted interest in exploring additional immunotherapeutic interventions such as adoptive cell therapy (ACT) using tumor-infiltrating lymphocytes (TIL). TIL-ACT has proven highly effective in MM with an overall response rate of 40%–50% and 10%–20% of treated patients showing complete and durable long-term response.9–13 Similar to MM, tumor-reactive TIL have been reported in NSCLC, prompting exploration of TIL-ACT in NSCLC.14 15 In the late 1990s, Ratto et al reported minor survival benefits after infusion of patients with NSCLC with autologous expanded TIL.16 Since this report, TIL-ACT has substantially evolved in both manufacturing process of the infusion product and the host preconditioning. These efforts have been particularly focused in MM. The introduction of a non-myeloablative lymphodepleting pretreatment regimen to TIL-ACT has substantially augmented clinical response and persistence of TIL post-transfer.17 Culture methods to robustly expand TIL from tumor resections have also been optimized.18–21
Numerous groups have reported successful NSCLC TIL expansion and treatment of patients using the traditional TIL culture method which involves culture of tumor fragments in media containing high dose of interleukin (IL)-2 (further referred to as TIL 1.0).22–25 However, contrary to TIL propagated from MM, the majority of these studies reported expansion of a high proportion of CD4+ TIL with corresponding lower CD8+ TIL proportion. In prior work from our group and others in MM, infusion of a higher frequency and number of CD8+ TIL was posited to contribute to positive clinical outcomes.9–11 To elicit expansion of a NSCLC TIL product sharing critical attributes shown to be important for MM TIL products, we applied a new propagation process initially developed to improve success rate, shorten the time required for expansion and improve CD8+ TIL frequency from cutaneous and uveal melanoma tumor specimens.21 This method (termed TIL 3.0) capitalizes on the 3-signals required for optimal T-cell activation ((1) agonistic stimulation of CD3 (TCR engagement), (2) agonistic stimulation of 4-1BB (co-stimulation known to trigger preferential expansion of cytotoxic CD8+ TIL) and (3) IL-2 (cytokine exposure)) and differs from the traditional IL-2 expansion method relying solely on one signal.26–28 This initial stage of propagating TIL from tumor tissue is called pre-rapid expansion protocol (pre-REP). Streamlining the process of growing TIL is important but it is unclear how the process affects the TCR repertoire in expanded TIL. Preservation of the breadth of the TCR repertoire from the tumor tissue is deemed important as the success of TIL therapy is in part based on the ability of TIL to recognize an array of different tumor-associated antigens (TAA) to avoid immune-escape. Here, we demonstrate that, at pre-REP stage, our new TIL 3.0 propagation method consistently expands a larger number of T-cell clones from the tumor tissue, better capturing the repertoire present in the tumor, while augmenting the total yield of TIL, in particular CD8+ TIL, in a constantly shorter time frame in comparison to the traditional expansion method with IL-2 alone. Moreover, this accelerated expansion did not overdifferentiate the TIL product which maintained a higher proportion of putative tumor-specific TCR compared with the traditional IL-2 method. However, these observations did not hold true in the second phase of expansion (REP), suggesting that a scaled-up, single-phase expansion TIL 3.0 product may be more suitable for ACT in NSCLC.
Materials and methods
Patients and study design
This study was performed on NSCLC tumor tissue resected from 16 patients enrolled, following informed consent, in the ImmunogenomiC prOfiling of early stage NSCLC (ICON) project.
Clinicopathological features of patients are tabulated in table 1.
Clinicopathological features of patients used in the study
Reagents
The fully human purified IgG4 monoclonal agonistic antibody (mAb) against human 4-1BB (Urelumab, 663513; Lot 6A20377) was kindly provided by Bristol-Myers Squibb (BMS, New York, New York, USA) through a Materials Transfer Agreement. Human recombinant IL-2 (Proleukin) was generously provided by Clinigen (formerly known as Prometheus Therapeutics and Diagnostics) (Yardley, Pennsylvania, USA).
TIL isolation and expansion from NSCLC tissue
TIL isolation and initial (pre-REP) expansion from patients’ tumor samples was executed using two different methods referred to as TIL 1.0 and TIL 3.0. For each tumor sample received TIL were expanded with both methods in parallel (figure 1A). TIL 1.0 was performed as previously described.29 Briefly, the tumor samples were cut into 1–3 mm3 fragments and placed in culture in 24-well plates (one fragment/well) in TIL complete growth media (TIL-CM: RPMI-1640 (Thermo Fisher Scientific, Waltham, Massachusetts, USA) with GlutaMax (Gibco/Invitrogen, Grand Island, New York, USA), 1X Penicillin-Streptomycin (Gibco/Invitrogen), 50 µmol/L 2-mercaptoethanol (Gibco/Invitrogen), 10 mmol HEPES (Gibco/Invitrogen), 1 mmol/L pyruvate (Gibco/Invitrogen) and 10% AB Human Serum (Gemini-Bioproducts, West Sacramento, California, USA)) supplemented with 6000 IU/mL of IL-2. Half media changes were performed every 3–4 days with fresh TIL-CM supplemented with 6000 IU/mL of IL-2. TIL were split into fresh wells as the cultures became confluent and expanded for a maximum period of 5 weeks. TIL 3.0 was done as previously described.21 Briefly, five 1–3 mm3 tumor fragments were put in culture in a G-Rex 10 flask (Wilson Wolf Manufacturing, New Brighton, Minnesota, USA) in 20 mL TIL-CM supplemented with 6000 IU/mL IL-2, 10 µg/mL 4-1BB mAB (Urelumab, BMS) and 30 ng/mL anti-CD3 (OKT3 clone—Miltenyi Biotec, Bergisch Gladbach, Germany). The 4-1BB (Urelumab) antibody used in this study is clinical grade and has been successfully integrated in the clinical production here at MD Anderson Cancer Center (NCT00338377 and NCT03610490). Half media changes were performed every 3–4 days with fresh TIL-CM supplemented with 6000 IU/mL of IL-2 for up to 21 days. The benchmark for successful TIL 1.0 culture was established based on a scaled down threshold used in our clinical protocol for MM TIL expansion (≥40×106 cells for ≥20 tumor fragments). For TIL 3.0, the benchmark for success was kept as is (≥40×106 cells, for five tumor fragments).21 29 Cell counts were performed manually using trypan blue (Gibco/Invitrogen), and successful cultures were cryopreserved in fetal bovine serum (Gemini-Bioproducts) supplemented with 10% dimethyl sulfoxide (Thermo Fisher Scientific) using Nalgene’s Mister Frosty (Millipore Sigma, St. Louis, Missouri, USA).

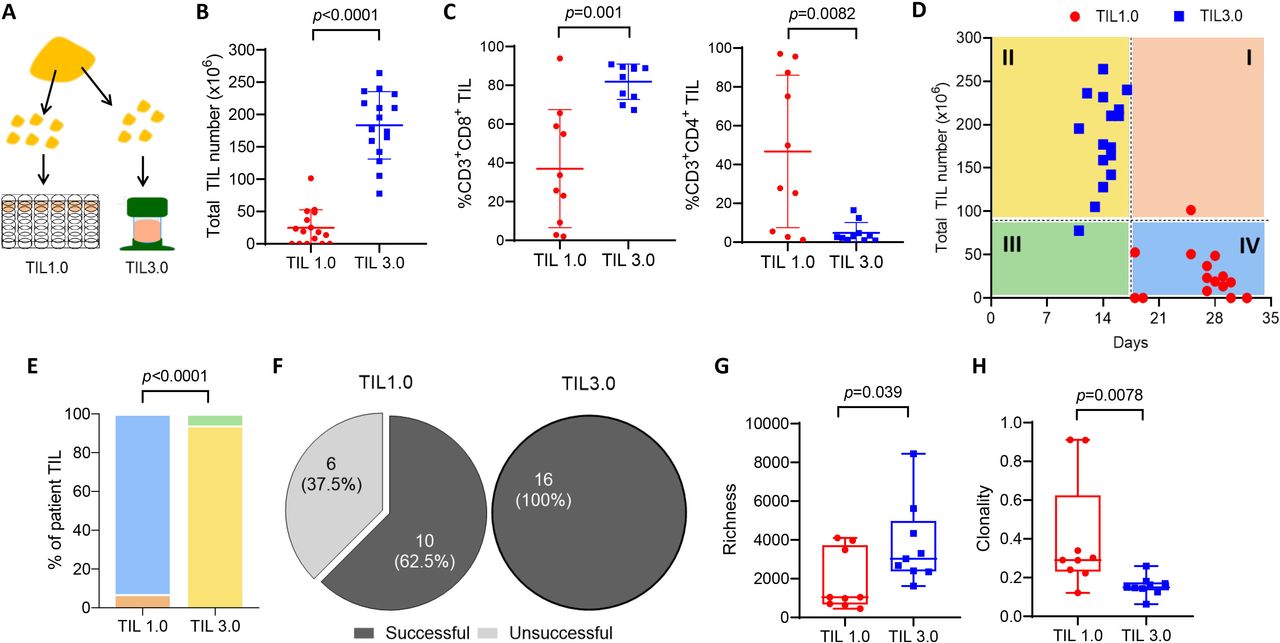
The novel expansion method, tumor-infiltrating lymphocytes (TIL) 3.0, enriches for CD3+ and CD8+ TIL while preserving T-cell diversity. (A) Schematic depicting TIL expansion from a single lung tumor resection. The minced tumor fragments are put in culture to propagate TIL with either the TIL 1.0 or TIL 3.0 method. (B) Comparison of the total TIL number expanded using the traditional culture method, TIL 1.0 (red) and the novel culture method, TIL 3.0 (blue) (paired, n=16). (C) The percentage of CD3+CD8+ TIL (left panel) and the percentage of CD3+CD4+ TIL (right panel) (paired, n=10) in successful TIL cultures for both expansion methods. (D) Time of culture with median of total TIL number expanded and days in culture (paired, n=16). The graph is divided in quadrants according to the median of TIL expanded versus number of days. (E) Percentage of patients in each quadrant for TIL 1.0 and TIL 3.0 from part D. (F) Success rate of growth for each TIL expansion method (paired, n=16). Comparison of T-cell receptor (TCR) richness (G) and clonality (H) of expanded TIL using TIL 1.0 vs TIL 3.0 (paired, n=9). Statistical analysis was performed by paired t-test (B) and (C), a Χ2 test was performed in (E) and a sign-rank test was performed in (G) and (H).
For the second phase of expansion (REP), cryopreserved TIL from the pre-REP cultures were thawed, rested for 2 days and propagated using a modified REP previously described.26 Briefly on day 0, 0.5×10⁶ TIL were seeded with 100×106 irradiated allogenic pooled peripheral blood mononuclear cell (PBMC) (1 TIL:200 PBMC ratio) in a GREX-10M along with 30 ng/mL of anti-CD3 (OKT3 clone) and 6000 IU/mL of IL-2 in 40 mL of REP-CM (50% TIL-CM and 50% AIM V (Thermo Fisher Scientific)). On day 5, 20 mL of REP-CM supplemented with 6000 IU/mL IL-2 was added. Cell concentration was determined on day 7 and TIL were subcultured. Each flask was topped at 100 mL with Aim V supplemented with 6000 IU/mL IL-2; 3000 IU/mL of IL-2 was added again on day 9 and day 11. On day 14, cell count and viability were assessed using Trypan Blue.
Flow cytometry
Phenotypic assessment
Expanded TIL were first washed in FACS Wash Buffer (Dulbecco’s phosphate-buffered saline 1X (PBS, Thermo Fisher Scientific)) with 1% bovine serum albumin (Millipore Sigma). Surface Fc receptors were blocked for 10 min at room temperature using goat serum (Sigma) diluted in FACS Wash Buffer (5%) before proceeding with surface staining on ice (100 µL per reaction) for 30 min. Cell surface expression assessment for this study was done using fluorochrome-conjugated antibodies against CD3 FITC (SK7), CD4 PerCP-Cy5.5 (RPA-T4), CD4 BUV496 (SK3), CD28 PE-Cy7 (CD28.2), CD8 PB (RPA-T8) (all BD Bioscience, San Jose, California, USA), LAG3 PE (3DS223H) (Life Technologies, Carlsbad, California, USA), PD-1 PerCP-Cy5.5 (EH12.2H7), CD27 APC (M-T271), CD8 APC-Cy7 (SK1) (Biolegend, San Diego, California, USA). Aqua or Yellow Live/Dead viability stain (Thermo Fisher Scientific) was used to exclude dead cells from analysis. Stained cells were fixed with 1% paraformaldehyde (Electron Microscope Sciences, Hatfield, Pennsylvania, USA) solution for 20 min at room temperature.
Functional assessment
Fresh post-REP TIL were washed in PBS and rested O/N without IL-2 in TIL-CM or if cryopreserved, thawed and rested O/N in the presence of 100 IU/mL of IL-2 followed by a pre-assessment incubation of 6 hours without IL-2. Rested TIL (0.5×10⁶) were incubated for 6 hours at 37°C with the CD107a (H4A3) flow cytometry antibody (BD Bioscience) in addition to phorbol myristate acetate (PMA)/ionomycin or TIL-CM alone (unstimulated control) in a 96-well plates. 1 hour into the incubation, the GolgiStop Monensin (BD Bioscience) was added. Post-incubation, cells were harvested and a surface staining was performed as described above using the CD3 FITC (SK7), CD4 PerCP-Cy5.5 (RPA-T4) and CD8 PB (RPA-T8). Cells were then fixed and permeabilized for intracellular staining using the BD Cytofix/Cytoperm (BD Bioscience). Cells were then blocked once again using goat serum and intracellularly stained with fluorochrome-conjugated antibodies against interferon (IFN)-γ PE-Cy7 (B27) and tumor necrosis factor (TNF)-α APC (Mab11) (BD Bioscience).
Samples were acquired using the BD FACS Canto II or BD LSRFortessa and analyzed using FlowJo Software (Tree Star). For surface stain analysis, gating was performed using fluorescence minus one when required. For functional assessment by flow cytometry, gating was performed by using the unstimulated condition.
DNA extraction and TCR sequencing
DNA was extracted from freshly resected tumor samples (post-pathology quality control) and expanded pre-REP and post-REP TIL for TCR sequencing on bulk TIL populations. For fresh tissue, DNA was extracted using the Qiagen QIAamp DNA Mini kit (Qiagen, Germantown, Maryland, USA) as per manufacturer’s instructions. For expanded TIL, DNA was extracted using DNeasy Blood and Tissue Kit as per manufacturer’s instructions. Sequencing of the complementarity-determining region 3 (CDR3) of human TCR-β was performed using the immunoSEQ Assay (Adaptive Biotechnologies, Seattle, Washington, USA) with T-cell genomic DNA supplied by the manufacturer as positive control and 1X Tris-EDTA Buffer as negative control. Briefly, T-cell clonality in each sample was measured by 1−Pielou’s evenness.30 T-cell diversity was defined by the number of unique nucleotide rearrangements within a sample by richness. Frequencies of unique nucleotide rearrangements were compared between samples to identify differentially abundant clones. Parameters were as follows: min total=1, productive only=true, all sequences=true alpha=0.05, count=nucleotide. Overall repertoire overlap between samples was measured using the Morisita overlap and Jaccard indices. Morisita overlap values were calculated using the Horn modification to restrict the range of possible values to between 0 and 1. Jaccard index values were calculated by dividing the number of shared unique nucleotide sequences by the sum of all unique nucleotide sequences between two samples.
Clustering TCR with GLIPH2 and putative tumor TCRs
In order to identify and cluster convergent CDR3 sequences that likely target the same antigen, we used the Grouping of Lymphocyte Interactions by Paratope Hotspots V.2 (GLIPH2) algorithm.31 GLIPH2 was implemented using the OSX executable irtools V.0.01 with default parameters. Significant clusters were considered as those with at least three unique TCR sequences and significant V-gene enrichment (Fisher’s exact test p<0.05). Curated publicly available TCR sequences with known antigen specificity were used to identify viral-specific motifs.32 To identify putative tumor-specific TCR, we excluded all motifs with known viral targets, as well as all motifs occurring at a frequency >1×10⁻⁴ in normal adjacent tissue from any patient in the study. Cluster visualization was performed in Cytoscape V.3.8.2.
Statistical analysis
The majority of statistical analyses were performed using GraphPad Prism V.8 (GraphPad software), Fisher’s exact test, sign-rank test and paired t-tests were used when appropriate after assessing for distribution normality by Jarque-Bera test.
Results
The 3-signal TIL 3.0 method improves TIL expansion, augments CD8+ TIL frequency and expands a more diverse T-cell repertoire
Fresh NSCLC tumors underwent TIL expansion using both the TIL 1.0 and TIL 3.0 propagation methods from the same tumor tissue as depicted in figure 1A. As shown in figure 1B, TIL 3.0 greatly increased the total number of TIL grown (median of 186.3×10⁶ vs 18.5×10⁶, p<0.0001), enriching for CD8+ TIL (median of 86.43% vs 29.67%, p=0.001, figure 1C, left panel) while decreasing the proportion of CD4+ TIL (median of 2.83% vs 38.83%, p=0.0082, figure 1C, right panel). TIL 3.0 also allowed for a shorter time in culture (median of 14 days vs 27.5 days, figure 1D). When visualizing the results in an x/y graph where four quadrants are formed using lines drawn from the median (median number of days in culture for the x-axis and median number of TIL for the y-axis), almost all TIL 3.0-expanded samples fell within Q2, while almost all TIL 1.0 samples fell within Q4 (figure 1D). This suggests that TIL 3.0 consistently expands TIL in both greater number and lesser time (p<0.0001, figure 1E). The overall success rate of establishing NSCLC TIL cultures was 62.5% for TIL 1.0 (≥12×106 cells) compared with 100% for TIL 3.0 (≥40×106 cells, figure 1F).
The voluminous and accelerated expansion of TIL brought by the TIL 3.0 culture method prompted us to explore its impact on the T-cell repertoire. To assess the T-cell repertoire in cultures obtained from both propagation methods, we performed next-generation sequencing of the CDR3 variable region of the T-cell receptor (TCR). Richness, a measure of T-cell diversity, was significantly higher in TIL expanded with TIL 3.0 when compared with TIL 1.0 (median of 3032 vs 1046 clonotypes, p=0.039, figure 1G). Conversely, clonality was higher in TIL 1.0 (median of 0.29 vs 0.1485, p=0.0078, figure 1H). This demonstrates the TIL 3.0 propagation method expands a broader repertoire of clonotypes than traditional expansion with high dose of IL-2.
TIL 1.0 and TIL 3.0 propagation methods expand distinct T-cell repertoires with TIL 3.0 maintaining a higher homology to resected tumors
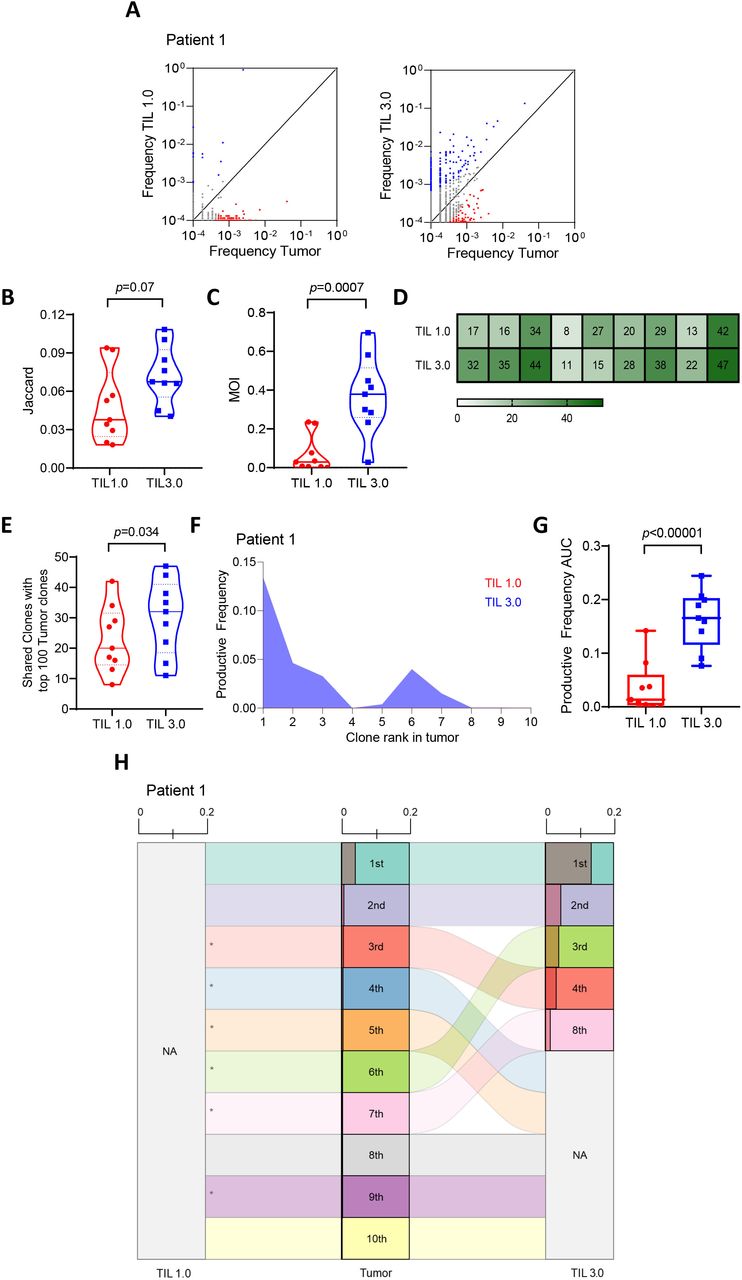
Poschcke et al have reported that TIL cultured through traditional TIL 1.0 method undergo drastic TCR repertoire changes from the initial tumor samples both in melanoma and pancreatic ductal adenocarcinoma (PDAC).33 In fact, TIL expanded with this method tend to lose a majority of the clonotypes found in the tumor including clonotypes dominating the TCR repertoire in the resected tumor, leading to the emergence of rare clonotypes in the expanded TIL product.33 Given the difference we observed in richness and clonality in NSCLC TIL between both expansion methods, we next evaluated changes in the composition of the T-cell repertoire. Figure 2A and online supplemental figure 1 show T-cell clones shared between the tumor tissue and TIL expanded from either TIL 1.0 or TIL 3.0. Overall, TIL 3.0 exhibited a tendency to expand more TIL clones to a frequency comparable to their original frequency in the resected tumor. To quantitatively assess this, we first determined the Jaccard index, which compares how many clonotypes were shared between the freshly resected tumor and expanded TIL cultures, finding a trend towards TIL 3.0 sharing more clones with the resected tumor (median of 0.067 vs 0.037, p=0.07, figure 2B). For a more precise measure of homology, we next determined the Morisita Overlap Index (MOI), which accounts for presence/absence of a given clonotype, and the relative abundance of clonotypes in both fresh and expanded TIL. We found that TIL 3.0 cultures were significantly more similar to fresh TIL than TIL 1.0 cultures (median of 0.37 vs 0.028, p=0.0007, figure 2C). We further assessed the top 100 TIL clones found in the resected tumor with the top 100 TIL clones of the expanded TIL product. As shown in figure 2D,E, the top 100 TIL 3.0-expanded clones shared a higher number of clones within the top 100 clones in the resected tumor (mean of 31 for TIL 3.0 vs 23 for TIL 1.0, p=0.034).
Supplemental material

Both tumor-infiltrating lymphocytes (TIL) propagation methods result in distinct T-cell receptor (TCR) repertoires with TIL 3.0 maintaining a higher resemblance to tumor. (A) Representative differential abundance plot comparing expanded T-cell repertoire in TIL 1.0 vs tumor (left panel) and TIL 3.0 vs tumor (right panel). Each circle represents a unique TIL TCR clone. Circles on either axis represents clones that are exclusively present in tumor (y-axis) or expanded in grown TIL product (x-axis). Clones with reads ≥1 were included. The black solid line is the frequency equality line and circles adjoining the equality line represents TCR clones that are equally expanded both in the tumor and the grown TIL product. Blue circles represent TIL TCR clones preferentially expanded in the grown TIL and the red circles represent TCR clones preferentially present in the tumor. Comparison of (B) Jaccard index (paired, n=9) and (C) Morisita Overlap Index (MOI) (paired, n=9) between TIL 1.0 and TIL 3.0 expanded product to tumor. (D) Heatmap of proportion of top 100 TIL clones present in the tumor in TIL 1.0 and TIL 3.0 clones stratified per patient; each vertical row represents a patient (n=9). (E) Comparison of the proportion of top 100 TIL clones found in the tumor present in the top 100 TIL 1.0 and TIL 3.0 clones (paired, n=9). (F) Representative plot of comparison of the productive frequency of top 10 resected tumor T-cell clones in grown TIL 1.0 and TIL 3.0 product. (G) Comparison of the productive frequency of top 10 TIL clones found in the tumor and the productive clonality of the same TIL clones in the top 10 TIL 1.0 and TIL 3.0 expansion products (paired, n=9). (H) Representative alluvial plot depicting the top 10 ranked TIL clones found in the tumor to their corresponding rank in TIL 1.0 and TIL 3.0 culture method. NA means not present in top 10 and * means they are not present in expanded TIL product. Shaded region in each clone represents the productive frequency (range from 0.0 to 0.2). Statistical analysis was performed by paired t-test on (B), (C), (E) and (F).
It was previously shown that the top TIL clones found in MM tumors exhibit enriched tumor specificity and could be critical to anti-tumor responses.34 Based on this finding, we next focused on the top 10 TIL clones found in NSCLC tumors and assessed both their presence and frequency in the expanded TIL product from both culture methods. As represented in figure 2F–H (and online supplemental figures 2 and 3), the top 10 resected tumor T-cell clones presented significantly higher frequencies in the TIL 3.0 than in the TIL 1.0 product (mean of 0.16 for TIL 3.0 vs 0.036 for TIL 1.0, p<0.00001), signifying that the top ranked TIL clones found in the tumor better maintained their ranks in the expanded TIL 3.0.
Altogether, these findings suggest that TIL 3.0 expands a NSCLC TIL product that better recapitulates the tumor when compared with products generated with TIL 1.0.
Putative tumor-specific TCR are better retained in TIL expanded with TIL 3.0
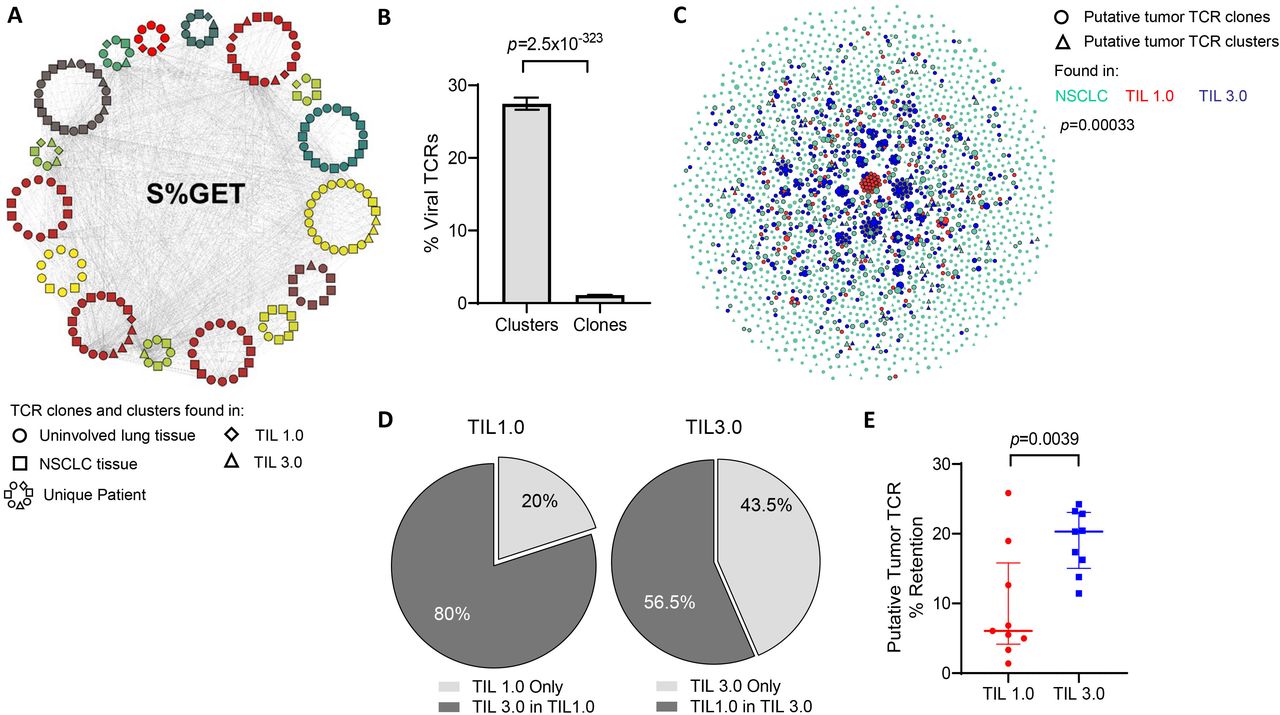
As previously mentioned, the effectiveness of TIL ACT in MM has been in part attributed to the diversity of TAA able to be recognized by the infused TIL. Similar to the skin, the lungs experience multiple viral infections and are likely to retain a high proportion of memory T cells of viral antigen specificities. Recent data suggest that NSCLC tumors are also surveyed by viral-specific memory T cells which thus should be detected in both the tumor and the normal tissues.35–37 In order to properly assess which of the two TIL propagation methods was able to better expand TAA-specific TIL, we began by clustering convergent TCR sequences with a shared motif using GLIPH2, alluding to a group of TCR able to recognize the same antigen. The TCR sequences that did not cluster were considered unique and labeled ‘TCR clones’. Across the 601 171 TCR sequences spanning all the patient samples (adjacent uninvolved tissue, tumor and expanded TIL 1.0 and TIL 3.0 T cells), we identified 14 614 clusters. An example of a single such TCR cluster is presented in figure 3A. Identified TCR clusters contained a mode of three patients per cluster and based on our prior work showing shared TCR sequences are enriched for viral TCR, we hypothesized that many of these clusters likely targeted viral antigens.36 Cross-referencing both individual clones and TCR clusters with known viral-specific TCR databases revealed that TCR in clusters were significantly enriched for known viral-specific sequences when compared with individual TCR clones (mean of 27.46% of cluster vs 1.114% of clone, p=2.5× 10−323, figure 3B).

Putative tumor-specific T-cell receptors (TCR) are better retained in tumor-infiltrating lymphocytes (TIL) expanded with TIL 3.0. (A) An example of a single TCR cluster which shares the central S%GET motif and potentially recognize the same antigen, as annotated by Grouping of Lymphocyte Interactions by Paratope Hotspots V.2 (GLIPH2). Each circular pattern represents a single patient. Circles indicate TCR motifs found in uninvolved lung tissue, squares represent non-small cell lung cancer (NSCLC) tissue, diamonds for TIL 1.0 expanded TCR and triangles indicate TIL 3.0 expanded TCR. Gray lines connect similar TCR motifs across patients, tissue compartments and expanded TIL products. (B) Graph representing percentage of predicted viral-specific TCR found in TCR clusters and clones defined in (A) across all patients’ samples. (C) Representative graph of putative tumor-specific TCR clones (circles) and clusters (triangles) found in the baseline NSCLC tissue (green), TIL expanded with TIL 1.0 (red) and TIL 3.0 (blue) from a single patient. The connecting gray lines represent the shared TCR motifs from the tumor tissue and their homologous TCR in the expanded TIL product. (D) Pie charts depicting the proportion of putative tumor-associated antigens (TAA)-specific expanded TIL found exclusively (light gray) in TIL 1.0 expanded product (left) and in TIL 3.0 (right). The dark gray represents the proportion of putative TAA-specific expanded TIL from each respective method that are found in the product of the other expansion method. (E) Graph displaying the comparison of the retained putative tumor-specific TCR in TIL 1.0 and TIL 3.0 expansion product across all patients (paired, n=9). Statistical analysis was performed by Fisher’s exact test on (B), sign-rank test on (D) and paired t-test on (E).
Finally, in order to focus our analysis on TCR that may be targeting tumor cells, we excluded all viral-specific TCR identified (figure 3A,B), along with all the TCR found in the normal uninvolved tissue of any patient from analysis. An example ‘putative tumor-specific TCR’ network is shown in figure 3C and online supplemental figure 4, where the repertoire of putative TAA-specific TCR (clusters and clones) found in the initial NSCLC and the expanded TIL from both methods can be visualized for individual patients. As observed in the network, while clones that expand by one protocol are more likely to expand by both protocols (p=0.00033 for figure 3C, p=8.2×10−228 for all samples), this corresponded to TIL 3.0 expanding 80% of TAA-specific TCR from TIL 1.0, whereas TIL 1.0 only expanded 56.5% of TAA-specific TCR from TIL 3.0 (figure 3D), indicating significant loss of potential T cells that could target the tumor. When looking across all nine patients, we observed that the putative tumor-specific TCR clones/clusters found in the baseline tumor were preserved at a significantly higher proportion in the TIL 3.0 expanded TIL compared with TIL 1.0 (median of 6% for TIL 1.0 vs median of 20.31% for TIL 3.0, p=0.00391, figure 3E).
Characterization of the pre-REP TIL product reveals that TIL 3.0 expanded TIL are less differentiated than their post-REP counterpart but neither are exhausted
We next expanded pre-REP TIL generated from both methods using the same process leading to the generation of the TIL infusion product, the REP, in order to test if our observations at the pre-REP stage would be maintained using six matched TIL pairs. As presented in figure 4A, the final product generated with TIL 3.0 displayed enhanced expansion potential during the REP over post-REP TIL 1.0 culture (mean of 3364-fold expansion for TIL 3.0 vs 1613-fold expansion for TIL 1.0, p=0.0035, online supplemental figure 5A). All TIL 1.0 and TIL 3.0 post-REP cultures exhibited over 90% viability (figure 4A). The final TIL product generated from TIL 3.0 also retained both its enriched CD8+ TIL phenotype described at the pre-REP level (median of 88.75% vs 41.45%, p=0.0091, figure 4B, left panel) with a lower CD4+ TIL population (median of 3.595% vs 51.35%, p=0.0079, figure 4B, right panel). Altogether, TIL 3.0 consistently expanded more effectively than TIL 1.0 while retaining pre-REP CD8+ and CD4+ proportions.
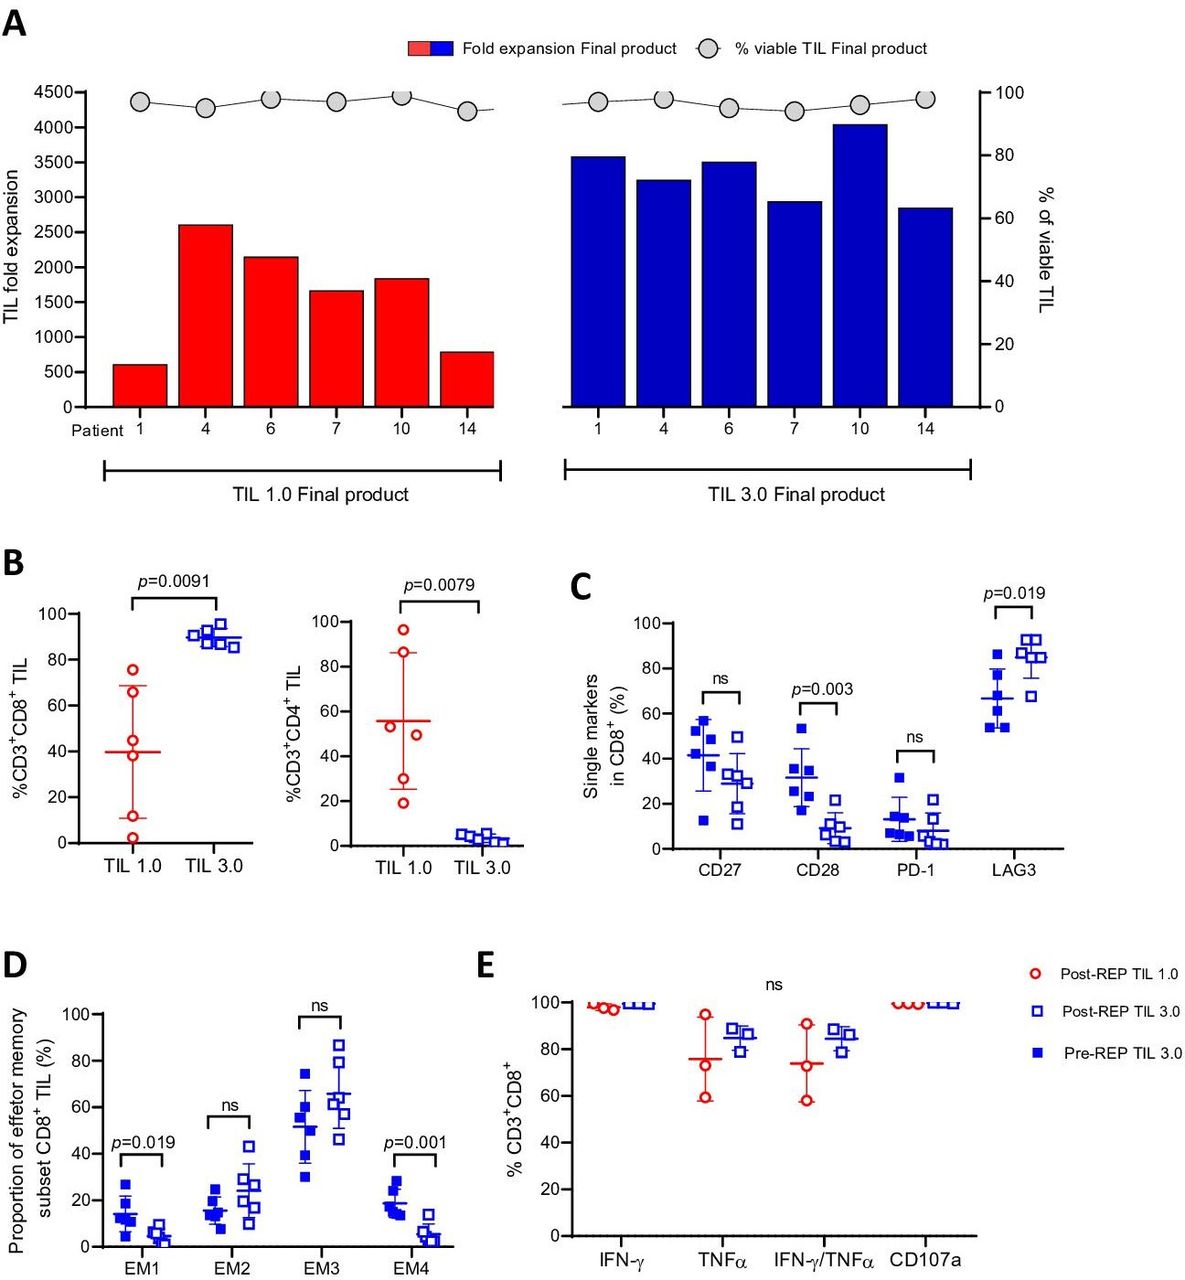
Characterization of the pre-rapid expansion protocol (pre-REP) tumor-infiltrating lymphocyte (TIL) products reveals that TIL 3.0 expanded TIL are less differentiated than their post-REP counterpart. (A) Total fold expansion (left axis) of final TIL 1.0 product (red) and TIL 3.0 (blue) (paired, n=6). Gray circles indicate viability (right axis) above each TIL culture. (B) The percentage of CD3+CD8+ TIL (left panel) and the percentage of CD3+CD4+ TIL (right panel) (paired, n=6) in the final TIL product. (C) Assessment of the surface expression of the differentiation/activation CD27, CD28, programmed death-1 (PD-1) and LAG3 on pre-REP (solid square) and post-REP (open square) CD8+ TIL (in %) generated from TIL 3.0 culture (paired, n=6). (D) Comparison of proportion of the four distinct EM population subsets of pre-REP and post-REP CD8+ TIL generated from TIL 3.0 culture (paired, n=6). (E) Analysis of TIL functionality measured by intracellular interferon (IFN)-γ, tumor necrosis factor (TNF)-α, co-expression and CD107a on fresh post-REP CD8+ TIL (in %) on phorbol myristate acetate (PMA)/ionomycin activation (TIL 1.0 vs TIL 3.0, paired, n=3). Statistical analysis was performed by paired t-test on (B), (C), (D) and (E).
Previous work from our group and others have shown that CD8+ TIL are constituted of a vast majority of effector memory (EM) T cells. This demonstration was based on the absence of expression of CCR7 and CD45RA as defined in the original work of Romero et al and later evaluated in melanoma and other solid tumors, in freshly isolated or expanded CD8+ TIL.29 38–40 When looking at the four distinct EM subpopulations, using the surface markers CD27 and CD28, in the CD8+ TIL population of the TIL 3.0 pre-REP versus the final product, we observed no differences in CD27 expression (figure 4C).40 The same observation was made when comparing the expression in both pre-REP methods (online supplemental figure 5B) or post-REP (online supplemental figure 5C). Interestingly, we observed a lower expression of CD28 in the post-REP TIL 3.0 when compared with its pre-REP counterpart (mean of 31.6% for pre-REP TIL 3.0 vs 9.17% for post-REP TIL 3.0, p=0.0035, figure 4C). Although no difference was observed pre-REP, we did see a difference at the post-REP level, where TIL 3.0 had less expression of CD28 than TIL 1.0 (mean of 28.23% for TIL 1.0 vs 9.172% for TIL 3.0, p=0.009) (online supplemental figure 5B,C). This change in CD28 expression did not impact the proportion of EM2 and EM3 phenotype in TIL 3.0 post-REP product (figure 4D, online supplemental figure 5E–G). EM2 and EM3 have been shown to be the most cytolytic EM fractions.40 The pre-REP TIL 3.0 product comprised a higher EM1 (mean of 14.17% vs 4.658%, p=0.019) and EM4 phenotype (mean of 18.717% vs 5.418%, p=0.001, figure 4D) than the post-REP product suggesting an overall less differentiated TIL status after the initial expansion when compared with the final product.40
Further looking into the activation/exhaustion status of TIL 3.0 pre-REP and post-REP, we found a low expression of PD-1 (figure 4C) independently of the step of expansion, suggesting that the highly proliferative TIL 3.0 were neither terminally differentiated nor exhausted.41 42 A similar observation was made for the TIL 1.0 pre-REP and post-REP product, although this was anticipated given the lesser proliferation potential observed with this method (online supplemental figure 5B–D). The activation status was confirmed with the high expression of LAG3 at both pre-REP and post-REP level (mean of 66.7% for pre-REP vs 84.95% for post-REP TIL 3.0 and mean of 50.53% for pre-REP vs 81.93% post-REP for TIL 1.0, figure 4C, online supplemental figure 5B–D) with a particularly higher expression in the final product generated with both methods.
Functionality of the TIL is an important feature that can be affected by the state of differentiation or activation. As primary autologous tumor cell lines could not be established, the cytolytic potential of the final product generated with both TIL 1.0 and TIL 3.0 was evaluated by degranulation capacity, based on CD107a surface expression on PMA/ionomycin stimulation. Both final products from TIL 1.0 and TIL 3.0 displayed a high degranulation potential (mean of 99.57% vs 99.8%, figure 4E) with no difference in their ability to secrete classical effector antitumor cytokines such as IFN-γ and TNF-α (mean of 98% for TIL 1.0 vs 99.47% for TIL 3.0 for IFN-γ and 75.76% vs 84.75% for TNF-α, figure 4E). Interestingly, when the experiment was repeated on cryopreserved post-REP TIL, we observed for all three post-REP TIL lines tested that the majority of the TIL still could degranulate, although a lower proportion could produce IFN-γ (49.2% for TIL 1.0 vs 40.1% for TIL 3.0) and TNF-α (13.31% vs 8.5%, online supplemental figure 5H) compared with the fresh final products (figure 4E).
The advantages of pre-REP TIL 3.0 on the T-cell repertoire are not retained after the REP
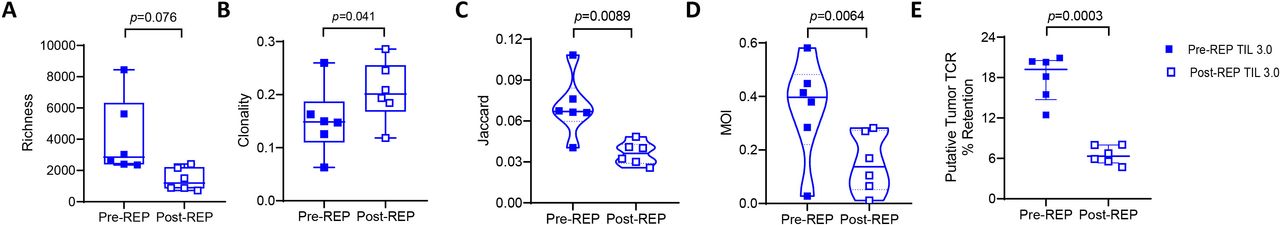
We next performed CDR3 ß variable TCR sequencing on the post-REP TIL product to assess if the pre-REP homology with the tumor previously found in the TIL 3.0 pre-REP product was preserved during this final stage of TIL expansion. We first looked at the richness of the post-REP product and interestingly, although not significant, we observed a reduction in TIL 3.0 post-REP product in comparison to what was initially observed in the pre-REP (median of 2857 for pre-REP vs 1199 for post-REP, p=0.07, figure 5A). In contrast, the TIL 1.0 product started off with lower richness but the REP expansion did not significantly change their richness although, the two pre-REP TIL 1.0 products that had scored higher in richness were also diminished in the post-REP products (online supplemental figure 6A). In fact, both TIL 1.0 and 3.0 post-REP final products presented a similar richness (online supplemental figure 6B). Conversely, when looking at clonality, we observed an increase in the TIL 3.0 final product compared with the TIL 3.0 pre-REP (median of 0.1485 for pre-REP vs 0.2013 for post-REP, p=0.041, figure 5B). Similarly to the richness score, no difference was observed between TIL 1.0 pre-REP and post-REP clonality score (online supplemental figure 6C) or between the clonality of post-REP products generated from both methods (online supplemental figure 6D).

Post-rapid expansion protocol (post-REP) tumor-infiltrating lymphocytes (TIL) 3.0 does not retain the homology and the putative tumor-specific T-cell receptor (TCR). Comparison of (A) TCR richness (paired, n=6), (B) clonality (paired, n=6), (C) Jaccard index (paired, n=6), (D) Morisita Overlap Index (MOI) (paired, n=6) and (E) retained putative tumor-specific TCR (paired, n=6) in pre-REP and post-REP TIL 3.0 expanded product. Statistical analysis was performed by paired t-test on (A), (B), (C), (D) and (E).
Having observed a drop in richness with a parallel increase in clonality in the final TIL 3.0 product, we next assessed the potential impact on the composition of the T-cell repertoire. As shown in figure 5C, we observed a significant decrease in the Jaccard index in post-REP TIL 3.0 (median of 0.067 for pre-REP vs 0.0362 for post-REP, p=0.0089) signifying a decrease in the number of shared clonotypes between the post-REP TIL product and the resected tumor. No differences in Jaccard index between the TIL 1.0 pre-REP and post-REP product (online supplemental figure 6E) or TIL 1.0 and TIL 3.0 post-REP product were detected (online supplemental figure 6F). When looking at the presence and the relative abundance of the particular clonotypes with the MOI, we saw a significant decrease in the TIL 3.0 final product compared with pre-REP (median of 0.3968 vs 0.1371, p=0.0064, figure 5D). Consistent with the Jaccard index, no MOI differences were noted between TIL 1.0 pre-REP and post-REP (online supplemental figure 6G) or TIL 1.0 and TIL 3.0 post-REP product (online supplemental figure 6H). Strikingly, analysis of retained putative tumor-specific TCR clones/clusters demonstrated a loss of enrichment in the TIL 3.0 final expansion product (median of 19.22% for pre-REP TIL 3.0 vs 6.322% for post-REP, p=0.0003, figure 5E). In contrast, the frequency of putative tumor-specific TCR in pre-REP TIL 1.0 was lower, but better retained in the REP, except for the one patient starting off with a higher frequency (median of 4.875% for pre-REP TIL 1.0 vs 4.219% for post-REP, p=0.6431, online supplemental figure 6I). Accordingly, no difference was observed between the frequency of putative tumor-specific TCR post-REP TIL 1.0 and TIL 3.0 product (online supplemental figure 6J).
Altogether, these data suggest that a second round of expansion (REP) may be detrimental to the favorable T-cell repertoire attributes we reported in the pre-REP TIL 3.0 product including increased TCR diversity and tumor-specific T-cell clone expansion.
Discussion
The success of TIL therapy depends in large part on the ability to expand tumor-specific TIL from the tumor tissue. In this study, we show that using our novel TIL expansion method employing three signals for proper T-cell activation (agonistic stimulation of CD3, 4-1BB along with high dose of IL-2 (TIL 3.0)) successfully expands TIL from 100% NSCLC tumor tissues tested, consistently augments the yield of expanded TIL as well as their proportion of putative anti-tumor TCR, at the pre-REP stage, while reducing the manufacturing time when compared with the traditional IL-2 method (TIL 1.0) in resected early stage NSCLC tumors.
Ratto et al in the mid-1990s published the first TIL-ACT trial in NSCLC demonstrating feasibility of this type of treatment for this malignancy.16 This early trial was performed before lymphodepletion preconditioning was added to the TIL therapy regimen. Creelan et al recently reported results from their phase I TIL-ACT trial using TIL expanded through traditional method employing IL-2 infused to lymphodepleted patients along with high dose of IL-2 regimen post-TIL infusion for the treatment of patients with PD-1 refractory NSCLC to be both safe and producing clinical benefit in patients (NCT03215810).25 Adverse effects to TIL-ACT reported in this clinical trial have been predominately attributed to lymphodepletion and administration of high dose of IL-2, which are both predictable and manageable side effects also seen in MM.11 12 25 43 To mitigate some of the side effects associated with high dose of IL-2, Ellebaek et al performed a small clinical trial with six patients receiving a low dose of IL-2 post-TIL infusion. They reported that low dose of IL-2 can indeed result in complete and durable clinical responses, demonstrating that TIL expanded in high dose of IL-2 can still exhibit anti-tumor activity when supported with low dose of IL-2 following TIL infusion.44
Our study highlights that modifications in the culture conditions of the TIL lead to measurable changes in the composition of the TIL product as it relates to phenotype and T-cell specificity. The TIL 3.0 expansion method increased the yield of the desirable CD8+ TIL fraction as we achieved a median of 81.8% of CD8+ with TIL 3.0 vs 36.9% for TIL 1.0 at the initial pre-REP TIL stage. Similar percentages (88.75% of CD8+ with TIL 3.0 vs 41.45% for TIL 1.0) were retained in the final TIL product. The impetus to favor CD8+ TIL expansion comes from our prior observation that CD8+ TIL content was associated with better response to TIL therapy in MM.9–11 There are indications that CD8+ T cells also play a major role in the clearance of NSCLC, as evidence shows that increased diversity of the circulating CD8+PD-1+ population pre-therapy and their clonal expansion during therapy correlates with response to checkpoint blockade.45 The accumulation of dysfunctional CD8+ TIL in NSCLC tumors is on the contrary correlated with resistance to checkpoint blockade approaches.46 Thus, the methodology that we report boosts the CD8+ TIL numbers for infusion and may preserve the function of the TIL to be transferred. It has been shown that T cells exhibiting polyfunctional attributes can mediate superior antitumor immune responses.25 47 Here, we report that the expanded TIL product from both TIL 1.0 and 3.0 process also shows polyfunctionality (TNF-α and IFN-γ secretion) following a polyclonal stimulation, as well as antitumor cytotoxic potential (degranulation capacity).
Success of TIL-ACT also depends on the differentiation status of the infused product.48 The TIL 3.0 expansion method does not overly differentiate cells and prevents exhaustion, which is believed to improve antitumor responses and persistence post-TIL transfer.21 36 This can be appreciated by the low PD-1 expression, high cytotoxic potential (CD107a positivity) and high level of IFN-γ and TNF-α effector cytokine secretion despite high LAG3 expression levels.41 Conflicting reports are found in literature with regard to LAG3 expression alone or its co-expression with PD-1 on NSCLC TIL and its correlation on outcome.49 50 Interestingly, although our TIL expressed high LAG3, their PD-1 expression was very low, suggesting that LAG3 here is most probably an activation surrogate rather than a true exhaustion marker. This observation is in line with findings reported with TIL expanded using a similar method in sarcoma.28 Nonetheless, the expression of LAG3 is expected to suppress the function of TIL which could advocate for concomitant administration of anti-LAG3 to improve TIL function. Along this line, inhibition of LAG3 is currently being evaluated in patients with PD-1 refractory MM (NCT01968109).
TCR sequencing of the TIL found in the tumor resections used for TIL propagation and their corresponding expanded TIL (pre-REP and post-REP) provided further insight into the repertoire of TCR specificities that are expanded by the different methods. Poschke et al previously reported that pre-REP TIL cultured using the traditional TIL 1.0 method tend to undergo profound changes in clonal composition from the initial tumor samples from which the culture was set up both in MM and PDAC.33 During the initial expansion process the cultures tend to lose a majority of tumor dominant T-cell clones or promote outgrowth of T-cell clones that were not prominently present to begin with in the tissue. A similar observation was made for NSCLC TIL expansion by Creelan et al.25 They reported that a majority of the expanded clonotypes in the final infusion product were either present at a lower frequency or not at all in the resected tumor. Furthermore, only a small fraction of the most prevalent clones was retained in the final TIL infusion product. They stipulate that TIL clonal contraction within the culture could partly explain this observation and may have perturbed the ‘polyvalency’ and efficacy of their TIL product. At the pre-REP level, TIL 3.0 resulted in growth of a more diverse TIL repertoire when compared with the traditional method which supports the idea of a more diverse TAA recognition potential. The importance of clonal dominance in the tumor tissue, in the context of MM, was demonstrated by Pasetto et al who showed that the top TIL clones in MM tumor tissue are enriched for tumor specificity and could mediate an efficient antitumor response.34 This finding supports the idea that T cells infiltrating the tumor tissue that have an ability to recognize the tumor will clonally expand and thus will be over-represented in the TIL population. Altogether, these data suggest that it is critical that the TIL expansion process preserves high frequency clones found in the tumor to capitalize on their antitumor potential, as was observed in TIL 3.0 expanded pre-REP TIL.
Previous work from our group has shown in MM that the proportions of the TCR vα and vβ families of the TCR repertoire of pre-REP TIL are generally conserved during the REP.20 However, this investigation of NSCLC post-REP TIL 3.0 culture looked further than families of TCR chains by using high-throughput TCR CDR3 sequencing. We demonstrated a drastic reduction in both the clonal diversity and the homology of the pre-REP product with the tumor, decreasing the proportion of putative tumor-specific TIL in the end product. These data call into question the usefulness of numerically expanding TIL with polyclonal anti-CD3 stimulation in the REP following initial derivation from tumor fragments. Higher numbers of infused TIL have been associated with better clinical outcome, thus prompting the refinement of large-scale expansion strategies.12 51 However, since patients have historically been infused with a varying number of cells depending on the ability of the TIL to expand, higher cell numbers may simply have been a reflection of improved TIL fitness. Ideally, a smaller number of TIL with increased fitness and more replicative potential could be infused, allowing for the last phase of expansion to happen within the lymphodepleted patient. Evidence that functionally enhanced TIL would require infusion of fewer cells to achieve clinical benefit has been reported with TIL modified to express IL-12 induced following TCR activation.52 Indeed, 63% objective clinical response was achieved for IL-12-expressing TIL with the administration of a single dose between 0.3 and 3.0×10⁶ TIL, which is 10–100 times lower than the non-engineered TIL doses currently being administered, however the regimen proved toxic for the patients. TIL 3.0 incorporates TCR activation at the pre-REP stage and delivers a TIL product with desirable qualities in terms of cytotoxic anti-tumor T-cell content and proliferative potential in 2–3 weeks. The output of cells generated does not match the number of TIL usually infused for therapy without a second expansion step (REP) but this initial expansion step could be scaled up to reach higher numbers.
Since lungs are organs constantly exposed to different external insults, viruses being one of them, NSCLC tumors also retain a viral-specific T-cell repertoire in addition to the TAA-recognizing TIL fraction.35–37 In this current study, we show that an initial expansion using TIL 3.0 unbiasedly expands and preserves the TAA-specific T-cell fraction as well as the virus-specific TIL found in the NSCLC tumor resections. The latter could be seen as a drawback for NSCLC TIL-ACT as virus-specific TIL are considered bystander TIL not involved in the antitumor response. Furthermore, Rosatto et al reported that ‘dormant’ virus-specific TIL could be used as part of an effective antitumor response using both mice and ex vivo human models by restimulating these virus-specific TIL with viral peptides.53 This reactivation triggered secretion of cytokines such as IFN-γ, IL-2 and C-X-C motif chemokine ligand 10 by the virus-specific TIL which promoted the antitumor immune cells accumulation such as dendritic cells, natural killer cells and T cells at the tumor site and upregulated the peptide presentation machinery in local antigen-presenting cells as well as tumor cells. In addition, recent work by Chiou et al reported the cross-reactivity of TCRs against epitopes derived from NSCLC tumors, Epstein-barr virus and Escherichia coli.37 Overall, this suggests expansion of TIL with pathogen specificity may not necessarily be detrimental to antitumor responses and could perhaps serve to harvest a potential ‘helper’ role of bystander TIL in the antitumor response.
In conclusion, our report demonstrates that the pre-REP TIL 3.0 methodology expands a product that is enriched in CD8+ TIL and shares a significant homology to the initial TIL milieu. This methodology additionally delivers a TIL product that more faithfully respects the TIL clonal hierarchy, preserving the higher frequency of putative TAA-specific T-cell clones found in the tumor tissue, which is unfortunately lost during the REP. This last observation advocates for the elimination of the REP and for the development of a new single-step process for NSCLC TIL expansion where the initial culture from tumor fragments with the TIL 3.0 process is scaled up and patients are infused with CD8 enriched, a less-differentiated and more diverse product within 3 weeks from surgery.
Supplemental material
Data availability statement
Data are available on reasonable request.
Ethics statements
Patient consent for publication
Ethics approval
This study involves the use of tumor tissue from human participants enrolled in the ICON study and was approved by the University of Texas MD Anderson Cancer Center’s Institutional Review Board. Participants gave informed consent to participate in the study before taking part.
References
Supplementary materials
Supplementary Data
This web only file has been produced by the BMJ Publishing Group from an electronic file supplied by the author(s) and has not been edited for content.
Footnotes
PS, M-AF and MLF contributed equally.
Contributors Conception and design: PS, M-AF, MLF, DJMcG, AR, CB. Data acquisition: PS, M-AF, MLF, PJ, DS-T, LF, C-wBC, YL, JF, RK, CAN. Analysis and Interpretation of data: PS, M-AF, MLF, PJ, DS-T, LF, DJMcG, CLH, AR, CB. Writing and revision of the manuscript: PS, M-AF, MLF, LF, PJ, DS-T, RK, CAN, S-YL, C-wBC, YL, JF, MVN, KGM, AAV, TC, JR, JZ, BS, IW, DLG, JVH, CLH, DJMcG, AR, CB. Guarantors: DJMcG, AR and CB. All authors have made material intellectual contributions to this work in accordance with the International Committee of Medical Journal Editors Recommendations.
Funding This work has been supported by generous philanthropic support of the University of Texas MD Anderson Moon Shot Lung Cancer Moon Shots Program and Lung SPORE P50CA070907; and used the Tissue Biospecimen and Pathology Resource, and the Research Histopathology Facility (CCSG P30CA016672). PS was supported by the CPRIT Research Training Award (RP210028). D.J.M. was supported by NCI grant K99CA240689. AR is supported by the Exon20 Foundation, Rexanna’s Foundation for Fighting Lung Cancer, the Waun Ki Hong Lung Cancer Research Fund, MD Anderson’s Lung Cancer Moon Shot, the Petrin Fund, the University Cancer Foundation via the Institutional Research Grant program at the University of Texas MD Anderson Cancer Center, and the Cancer Prevention and Research Institute of Texas (RP210137). This work was also possible due to the generous contribution of Bristol Myers Squibb who provided the agonistic anti-4-1BB antibody (BMS-663513) as well as Clinigen Inc, (formerly known as Prometheus Therapeutics and Diagnostics) who kindly provided the IL-2 used in this study.
Competing interests CB is on the SAB of Myst Therapeutics and has received research funding from Iovance Biotherapeutics. AR serves on the Scientific Advisory Board of and has received honoraria from Adaptive Biotechnologies. DLG has received research funding from AstraZeneca, Takeda, Astellas, NGM Biopharmacueticals and Ribon Therapeutics and has participated in advisory boards for AstraZeneca, Lilly and Sanofi. JVH has received research support from AstraZeneca, Bayer, GlaxoSmithKline and Spectrum; participated in advisory committees for AstraZeneca, Boehringer Ingelheim, Exelixis, Genentech, GlaxoSmithKline, Guardant Health, Hengrui, Lilly, Novartis, Specrtum, EMD Serono and Synta and received royalties and/or licensing fees from Spectrum. TC has received speaker’s fees from the Society for Immunotherapy of Cancer and Bristol-Myers Squibb and research funding to MD Anderson Cancer Center from Boehringer Ingelheim and Bristol-Myers Squibb. JZ served on advisory board for AstraZeneca and Geneplus and received speaker’s fees from Bristol-Myers Squibb, Geneplus, OrigMed, Innovent, grant from Merck, outside the submitted work. BS receives consultation fees from Bristol-Myers Squibb. No potential conflicts of interest are disclosed by the other authors.
Provenance and peer review Not commissioned; externally peer reviewed.
Supplemental material This content has been supplied by the author(s). It has not been vetted by BMJ Publishing Group Limited (BMJ) and may not have been peer-reviewed. Any opinions or recommendations discussed are solely those of the author(s) and are not endorsed by BMJ. BMJ disclaims all liability and responsibility arising from any reliance placed on the content. Where the content includes any translated material, BMJ does not warrant the accuracy and reliability of the translations (including but not limited to local regulations, clinical guidelines, terminology, drug names and drug dosages), and is not responsible for any error and/or omissions arising from translation and adaptation or otherwise.