Article Text

Abstract
Background Patients treated with immunotherapy are at risk of considerable adverse events, and the ongoing struggle is to accurately identify the subset of patients who will benefit. Tumor mutational burden (TMB) has emerged as a promising predictive biomarker but requires tumor tissue which is not always available. Blood-based TMB (bTMB) may provide a minimally invasive assessment of mutational load. However, because of the required sequencing depth, bTMB analysis is costly and prone to false negative results. This study attempted to design a minimally sized bTMB panel, examined a counting-based method for bTMB in patients with stage I to IV non-small cell lung cancer (NSCLC) and evaluated both technical factors such as bTMB and tissue-based TMB (tTMB) cut-off, as well as sample-related factors such as cell-free DNA input mass which influence the correlation between bTMB and tTMB.
Methods Tissue, plasma, and whole blood samples collected as part of the LEMA trial (NCT02894853) were used in this study. Samples of 185 treatment naïve patients with stage I to IV NSCLC were sequenced at the Roche Sequencing Solutions with a custom panel designed for TMB, using reagents and workflows derived from the AVENIO Tumor Tissue and circulating tumor DNA Analysis Kits.
Results A TMB panel of 1.1 Mb demonstrated highly accurate TMB high calls with a positive predictive value of 95% when using a tTMB cut-off of 16 mut/Mb, corresponding with 42 mut/Mb for bTMB. The positive per cent agreement (PPA) of bTMB was relatively low at 32%. In stage IV samples with at least 20 ng of cfDNA input, PPA of bTMB improved to 63% and minimizing the panel to a subset of 577 kb was possible while maintaining 63% PPA.
Conclusion Plasma samples with high bTMB values are highly correspondent with tTMB, whereas bTMB low results may also be the result of low tumor burden at earlier stages of disease as well as poorly shedding tumors. For advanced stages of disease, PPA (sensitivity) of bTMB is satisfactory in comparison to tTMB, even when using a panel of less than 600 kb, warranting consideration of bTMB as a predictive biomarker for patients with NSCLC eligible for immunotherapy in the future.
- lung neoplasms
- tumor biomarkers
- genetic markers
- immunotherapy
Data availability statement
All data relevant to the study are included in the article or uploaded as online supplemental information. Additional data is available upon reasonable request.
This is an open access article distributed in accordance with the Creative Commons Attribution Non Commercial (CC BY-NC 4.0) license, which permits others to distribute, remix, adapt, build upon this work non-commercially, and license their derivative works on different terms, provided the original work is properly cited, appropriate credit is given, any changes made indicated, and the use is non-commercial. See http://creativecommons.org/licenses/by-nc/4.0/.
Statistics from Altmetric.com
Introduction
The introduction of immune checkpoint inhibitors (ICI) has provided a significant survival benefit in up to 50% of patients with non-small cell lung cancer (NSCLC).1–3 Since patients treated with immunotherapy are at risk of considerable immune-related adverse events, the ongoing struggle is to accurately identify the subset of patients who benefit. Tumor mutational burden (TMB), defined as the total number of somatic mutations per coding area of a tumor genome, has emerged as a promising predictive biomarker. It is hypothesized that high TMB tumors are likely to generate more neoantigens to elicit stronger antitumor immune responses.4–6
High TMB tumors have been associated with an improved overall response rate, durable clinical benefit (DCB), and progression-free survival (PFS) in patients with NSCLC treated with ICI.7 8 Several trials showed no significant overall survival (OS) benefit in patients with TMB high (TMB-H) tumors,9–11 although a recent meta-analysis demonstrated an OS improvement in patients with TMB-H tumors receiving first-line ICI in comparison to platinum-based chemotherapy.12 These contradicting results may be explained by preanalytical and methodological issues including the use of different sequencing panels, different cut-off values for TMB and including different types of mutations in TMB algorithms.12–15 In 2020, the Food and Drug Administration (FDA) approved the FoundationOneCDx assay for tTMB assessment in patients with unresectable or metastatic TMB high solid tumors using a 10mut/Mb cut-off to decide in which patients to start pembrolizumab.16
TMB assessment typically relies on tumor tissue obtained by core needle biopsies or surgical resection, which require invasive procedures with inherent risk of complications.17 Furthermore, biopsies may yield scant amounts of tissue, resulting in insufficient quality and quantity to provide DNA for complete molecular analysis and TMB estimation.18 19 Blood-based TMB (bTMB) may provide an alternative for those patients who are not amenable to undergo invasive procedures, by allowing minimally invasive sampling. In addition, bTMB may defy spatial intratumoral heterogeneity between primary and metastatic lesions and prevent sampling bias by examining a pool of circulating tumor DNA (ctDNA) derived from all tumor sites.20 21
TMB is a continuous numeric variable, although for practical predictive use TMB is often categorized in TMB high versus low. bTMB thresholds are highly dependent on the used sequencing panels and often based on their equivalence with tTMB cut-offs, resulting in different bTMB cut-offs ranging from 6, 10, 16 to 20 mut/Mb.11 22–24 Previous studies have shown bTMB can also be used as a predictive biomarker in patients with metastatic NSCLC treated with ICI.11 23 However, bTMB assessment is hampered by both biological and technical challenges. Biologically, a low tumor burden can be due to early stage disease or poorly shedding tumors and when the level of ctDNA in plasma is low, tumor mutations may be missed.18 25 Technical challenges include TMB overestimation when variants associated with clonal hematopoiesis of indeterminate potential (CHIP) are mistaken for tumor specific variants, whereas TMB underestimation may be the result of genomic alterations below detection limit.26 27 A larger panel size and increased depth of coverage are associated with more precise TMB estimations, but also with increased healthcare costs.19
The aims of this research study were: (1) to establish a counting-based bTMB method which accurately reflects TMB in patients with all stages of NSCLC by comparing bTMB to tTMB using panel and whole exome sequencing (WES) approaches applied to tumor, plasma, and germline DNA, (2) to determine the effect on the tTMB to bTMB correlation of sample-specific factors such as disease stage and cfDNA input as well as technical factors such as the bTMB and tTMB cut-off and the mutant variant allele frequency (AF) cut-off, and (3) to determine the minimum panel size required for a diagnostically useful positive predictive value (PPV) of bTMB classification in NSCLC.
Methods
Study samples
Samples used in this study were derived from residual specimens from the Lung cancer Early Molecular Assessment (LEMA) trial (NCT02894853). The original specimens have been obtained from treatment naïve patients diagnosed with stage I- IV NSCLC, included in 10 hospitals in the Netherlands from 2016 until 2020. This study included patients based on availability of residual specimens from pre-treatment plasma, tumor tissue, and peripheral blood mononuclear cells (PBMCs) (n=183, online supplemental figure S1A). This research study was approved by the local institutional review board.
Supplemental material
Supplemental material
Approximately, 8–10 mL blood was collected per patient in either K2-EDTA tubes or Cell-Free DNATM Blood Collection Tubes (Streck, Omaha, USA). The blood samples collected within 14 days prior to tumor tissue collection were centrifuged at 1700 g for 10 min at room temperature. Plasma samples were then spun at 20 g for an additional 10 min and stored at −80°C. Time between plasma separation and storage was less than 120 hours.
Library preparation and next generation sequencing
Targeted NGS was performed on DNA isolated from 183 formalin-fixed paraffin-embedded tissue (FFPET) specimens, 178 plasma, and 170 whole blood samples using modified versions of the AVENIO Tumor Tissue and ctDNA Analysis workflows (online supplemental tables S1,S2).
Supplemental material
Tumor tissue
Anatomic pathologists scored nucleated tumor cell percentages and indicated the most tumor-dense regions for isolation based on H&E stained slides. Depending on tumor size, 5–10 FFPE slides of 10 µm were used for DNA isolation after microdissection. Immunohistochemistry testing for PD-L1 expression was performed according to the local standard of care in the healthcare facility where subjects were enrolled. Various PD-L1 testing was performed using clones such as 22C3, E1L3N, SP142, and SP263. The mass of DNA isolated from FFPET was measured using the Qubit High Sensitivity dsDNA kit, and the quality of DNA was assessed using a qPCR-based method.28 Eleven to 260 ng of DNA was available and up to 200 ng was used as input for library preparation. DNA was treated with Uracil N-Glycosylase and then fragmented using enzymatic fragmentation. UMI-containing adapters were ligated onto the DNA fragments, and the library was amplified with sample index containing PCR primers targeting the adapters. Half of the PCR product of each sample was captured with a ~2.2 megabase (Mb) panel designed for pan-cancer genotyping and a subset of samples was also captured with the ~1.1 Mb panel described below. Each library was amplified to produce a final sequencing library and libraries were pooled and sequenced on the NovaSeq with 2×150+2×8 reads.
PBMCs
DNA was isolated from 20 uL of whole blood samples with a protease and bead-based method. The library preparation procedure for whole blood DNA was identical to the procedure for tumor tissue except no qPCR-based quality check was performed, and a consistent 50 ng of input DNA was used for library preparation.
Plasma
cfDNA was isolated from an average of 4.2 mL of plasma (median: 4 mL; range 1–6 mL). The mass of cfDNA was measured using the Qubit High Sensitivity dsDNA, and the quality of cfDNA samples was assessed using a qPCR-based method.29 The qPCR-based method was used to adjust the calculated input mass of DNA (eg, if a sample was found to be 33% high molecular weight DNA, and 75 ng of total DNA was added, it was considered 50 ng of cfDNA input). Up to 50 ng of cfDNA was used as input for library preparation. In practice, 3–50 ng of cfDNA was used as input (mean: 27 ng; median 24 ng). DNA was prepared for ligation and UMI-containing adapters were ligated onto the DNA fragments, followed by library amplification with sample-index containing PCR primers targeting the adapters. Half of the PCR product of each sample was captured with the lung TMB panel.
Lung TMB panel design
Approximately 300 kb of the panel was designed using known drivers and combined with a TMB module of ~800 kb in size to generate a 1.1 Mb targeted TMB panel. The approach for the TMB module used the CAPP-Seq monitoring panel design algorithm and relied on the prioritization of highly recurrent mutations present in TCGA cohorts of NSCLC.27 30 Two-third of the samples were used for training, and one-third was held out for testing the targeted regions. Successive subsets of the panel were used to measure the impact of panel size on TMB estimates. Seventeen panels were generated in-silico, with the smallest containing only medical content (300 kb) and the largest 1.1 Mb. Panels in the middle of the size gradient were constructed by gradually adding ~50 kb TMB module tiles per intermediate panel, ordered by mutation prevalence.
Variant calling and filtering method for TMB
Single nucleotide variants (SNVs) and short insertions and deletions (InDels) were called from sequencing data using AVENIO Tumor Tissue and ctDNA Analysis variant callers, which are based on the CAPP-Seq variant calling methods.27 31 32 For both tissue and plasma TMB, variants that recurred more than five times in the cohort of the same sample type sequenced by the same capture panel were removed. Driver and suppressor variants were filtered out, as were germline variants identified from public databases including ExAC, dbSNP, and 1000 genomes. The following strategies were used: (1) in the absence of paired PBMC samples, variants were counted towards TMB after filtering based on an allele frequency (AF) of 5%–40% for tissue, and 0.3%–30% for plasma, (2) when paired PBMC samples were available, PBMC variants were filtered from the paired tissue sample when the AF was larger than 50% of the AF detected in tissue, or when the PBMC variant AF was larger than 30%. After filtering, variants with AF greater than 0.3% were counted towards TMB.
Tumor informed tumor burden assessment
Variants in the lung TMB panel genome regions that overlapped with matched plasma samples were used for tumor-informed tumor burden estimation (average four variants per patient, range 1–16 variants). The variant AF for each of these variants was calculated using barcode-deduped, background polished data as previously described, and the average of these AFs resulted in a mean AF for each sample.27 TMB was defined as the total number of exonic SNVs and InDels per Mb.
In-silico immunotherapy response prediction
Supplementary information was obtained from the Rizvi et al cohort which included 34 patients with NSCLC treated with monotherapy pembrolizumab.7 The median age of this cohort was 63 years and 83% of patients had an adenocarcinoma and 11% squamous cell carcinoma. Further details are available via cBioPortal: http://www.cbioportal.org/study/summary?cancer_study_id=luad_mskcc_2015. Table S3 of the original publication contains detailed clinical information of individual patients, including DCB, PFS in months and events (event or censure for PFS). Table S5 of the original publication contains the mutation list of WES using hg19 build. Only SNV mutations were included, in total 9049 mutations. SnpEff with genome version GRCh37.75 was used to annotate mutations, and 8708 nonsynonymous mutations were kept for TMB calculation after excluding annotations of synonymous_variant, non_coding_transcript_exon_variant, intron_variant, upstream_gene_variant, non_coding_transcript_exon_variant, and downstream_gene_variant.
We intersected the mutation list with the tumor tissue, lung TMB and 577 kb panels after hg38 to hg19 conversion. TMB calling for WES and the three panels was performed by first removing driver and suppressor mutations and then limiting to variant AF >5%. To calculate the WES TMB score, a 32 Mb exome was assumed. A nonsynonymous mutation count of 178 in WES was used in the Rizvi study to separate TMB high (TMB-H) and TMB low (TMB-L) values. Using our calculation, 19 patients of this cohort were TMB-H, and 15 patients were TMB-L.
Statistical analyses
The linear correlations were characterized by R squared, calculated with the ‘sklearn’ package in python, and Spearman’s rho, calculated with the ‘scipy’ package in python. Intergroup comparisons were performed using one-way ANOVA or unpaired two-samples Wilcoxon test with basic R packages. Since our reference (ie, tTMB) is known to contain uncertainty, the agreement between tTMB and bTMB will be assessed using positive and negative per cent agreement (PPA, NPA) terminology. The Kaplan-Meier survival analysis was performed with the R packages ‘survival’ and ‘survminer’, using the ‘log-log’ CI. AF for mutations was calculated as the number of deduped reads supporting that mutation divided by the deduped reads covering that genomic position.
Results
Cohort characteristics
Paired tumor tissue and plasma samples obtained from 183 patients with stage I-IV NSCLC were included in this study. In this cohort, treatment naïve patients were diagnosed with stage I, II, III and IV NSCLC disease in 26% (n=48), 14% (n=26), 20% (n=36), and 40% (n=73), respectively. Adenocarcinoma was a predominant histopathological subtype across all stages and squamous cell carcinoma was found to be more common among patients with stage I-III disease than patients with stage IV disease (27% vs 11%). The clinical characteristics of the assessed cohort are represented in table 1 and online supplemental table S1.
Demographic and baseline characteristics from patients with NSCLC in this study
Tissue based TMB assessment
First, a ~2.2 Mb panel designed for solid tumor genotyping was used to establish tissue-based TMB calls on 183 tumor tissue specimens using a hybrid-capture based approach optimized for FFPET (see Methods section). In total, 94% of samples (172/183) met the recommended sequencing depth requirements to enable sensitive variant detection at 5% AF (online supplemental figure S1B–D and table S2, 3). Matched PBMCs were also analyzed, and the PBMC-based germline filtering method was compared with an AF and database-based germline filtering method (online supplemental figure S2A). For a subset of tissue samples with high mean variant AF, the PBMC-based germline filtering resulted in higher TMB values than the AF and database-based method, suggesting that the AF and database method discards some true somatic variants from high purity tissue samples (online supplemental figure S2A). Therefore, in this study, only samples with paired germline were considered for TMB assessment (n=160).
Supplemental material
Despite similar TMB distribution, the mean TMB from this dataset was higher than the TCGA lung dataset (13.9 vs 7.6) (figure 1A,B).18 This could be due to a higher sequencing depth in our approach with a mean unique depth of 1556 vs ~100–120 for TCGA, leading to a higher sensitivity for low AF (<10%) variants. Similar to other TMB studies in lung cancer cohorts, TMB was not associated with variant mean AF (online supplemental figure S2B).19 26 Hence, it was assumed that missing low AF variants will not lead to artificially lowered TMB values. Additionally, WES was performed in a subset of the samples (n=11) and a correlation was seen in TMB estimation between WES and the tumor tissue panel (R squared=0.65; Spearman’s rho=0.74; online supplemental figure S2C), confirming the ability of this panel to estimate TMB. Also, in-silico comparison of panel content between the FDA-approved F1CDx panel and the tumor tissue panel showed good correlation (R squared=0.99, Spearman’s rho=0.99; online supplemental figure S2D).

Tissue TMB assessment using a 2.2 Mb tumor tissue panel. (A,B) Histogram of TMB (mut/Mb) in tissue samples sequenced by tumor tissue panel filtered for germline variants (A; n=160) is compared with TMB (mut/Mb) from TCGA WES lung cancer adenocarcinoma and squamous cell carcinoma samples (B; n=1058). (C) TMB (mut/Mb) in tissue samples filtered for germline variants separated by stage of disease. (D) Comparison of TMB (mut/Mb) by in-silico validation of our tumor tissue panel in the Rizvi et al dataset which included patients with DCB (n=14) and NDB (n=16), p=0.04. Variant calls are restricted to variants overlapping with the tumor tissue panel that were present at >5%. The diamond symbol (♦) in the boxplot represents outliers. (E) Kaplan-Meier curve showing progression-free survival when using our tumor tissue panel for patients from the Rizvi et al cohort. The dataset is split in high vs low using a cut-off of 9.4 mutations/Mb as determined by variants present in the tumor tissue panel regions. DCB, durable clinical benefit; NDB, no durable benefit; NSCLC, non-small cell lung cancer; TMB, tumor mutational burden; WES, whole exome sequencing.
As previously described by others,26 TMB values were not associated with disease stage (figure 1C, online supplemental figure S2F) and no correlation was seen between TMB values and PD-L1 expression or tumor histology (online supplemental figure S2E,G). Higher TMB values were found in patients with a smoking history in comparison with never smokers (online supplemental figure S2H,I). No difference was seen in TMB values and tumors with or without mutations in EGFR, BRAF, KRAS, or STK11 (p>0.1) (online supplemental figure S3A–C,F). However, tumors with TP53 mutations showed significantly higher TMB than those without (p=0.0014), a similar trend was also seen in tumors with KEAP1 mutations (p=0.057) (online supplemental figure S3D,E).
Supplemental material
To evaluate the panel design and filtering methods, an in-silico assessment was performed with the published WES data from the clinical NSCLC cohort by Rizvi et al.7 We adopted a WES-based categorical cut-off of 10 mutations/Mb suggested by a TMB harmonization study across multiple institutions. An in-silico intersection was applied to the tumor tissue panel using the Rizvi cohort, resulting in a linear correlation between WES TMB and tumor tissue panel intersection TMB (online supplemental figure S4A). The WES cut-off was converted accordingly to a corresponding 9.4 mutations/Mb cut-off of the tumor tissue panel.15 Applying the WES cut-off, 8 samples were TMB-high and 26 were TMB-low, and with the tumor tissue panel cut-off, 11 were TMB-high and 23 were TMB-low. Using the converted TMB cut-off in the tissue panel, a significant separation of patients with and without DCB (figure 1D; p=0.04), as well as prediction of PFS (figure 1E; HR=3.30) was seen which is similar to the performance of WES (online supplemental figure S4B, C; p=0.02 and HR=3.32). These analyses support the utility of this tumor tissue panel in identifying patients who benefit from ICI.
Supplemental material
Panel design for plasma-based TMB assessment
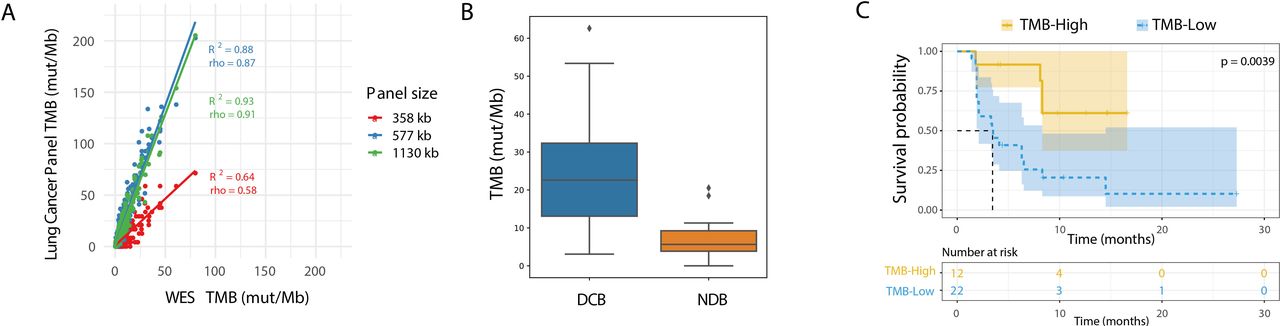
High costs for NGS-based bTMB assays are driven by the required unique depth for ctDNA detection in plasma in combination with a broad panel size. In-silico analyses based on TCGA data showed specific variant enrichment per Mb in the panel, suggesting a smaller panel can be used to overcome the statistical sampling concerns and minimize variability (figure 2A). To minimize the cost per-sample, a smaller plasma panel targeted for lung TMB estimation was designed using the CAPP-Seq panel design algorithm, maximizing expected variants in the panel region (Methods section).27 The panel design started with a core of ~300 kb covering key content, followed by the addition of regions of ~50 kb at a time to maximize the number of NSCLC relevant variants covered, resulting in a final lung TMB panel of approximately 1.1 Mb, covering exonic regions of 965 genes. This Lung TMB panel is smaller compared with most of the commercially available panels that assess TMB including the 2.2Mb FoundationOne CDx panel covering 324 genes, the 2.15Mb Guardant OMNI panel covering 500 genes, the 1.97Mb TruSight Oncology 500 panel covering 523 genes, and the 1.53Mb MSK-IMPACT panel covering 468 genes.15

In-silico lung cancer TMB panel assessment. (A) In-silico comparison of TCGA lung cancer data as determined from WES on the x-axis vs designed lung cancer TMB panels on the y-axis. Three panel subsets are shown with a size of 358 kb (red), 577 kb (blue), and the full 1130 kb (green). (B) Comparison of TMB by in-silico validation of the variants present in lung TMB panel in the Rizvi et al dataset which included patients with DCB (n=14) and NDB (n=16), p=0.002. The diamond symbol (♦) in the boxplot represents outliers. (C) Kaplan-Meier curve showing progression-free survival for patients from the Rizvi et al cohort. The dataset is split by high vs low TMB, using a cut-off of 19.6 mutations/Mb as determined by the lung TMB panel. DCB, durable clinical benefit; NDB, no durable benefit; NSCLC, non-small cell lung cancer; TMB, tumor mutational burden; WES, whole exome sequencing.
Plasma samples of 178 patients were analyzed with the lung TMB panel (1.1 Mb) using a hybrid-capture based approach optimized for cfDNA. Variants were called using a bioinformatic pipeline designed for cfDNA (see Methods section). In our cohort, 62% of plasma samples derived from patients across all stages and 70% of samples from patients with stage IV disease yielded at least 20 ng of cfDNA input. As expected, unique depth tracked closely with input mass of cfDNA and samples with more than 30 ng of cfDNA input showed greater than 3000× depth, which is sufficient to enable highly accurate variant calling at 0.5% AF at most positions across the panel (online supplemental figure S5, table S4).
Supplemental material
To evaluate this lung TMB panel with regard to clinical outcomes, a similar in-silico assessment was performed by calculating TMB intersected to the panel used for the Rizvi cohort.7 The 10 mutation/Mb WES-based cut-off corresponded to 19.3 mutations per Mb in the lung TMB panel. The lung TMB panel showed stronger separation in comparison with WES between patients with and without DCB (figure 2B, p=0.002), as well as improved prediction of PFS (figure 2C, p=0.0039, HR=4.023). When considering only non-synonymous mutations and the cut-off described by Rizvi et al of 178 SNVs corresponding to 11.6 mut/Mb in the lung TMB panel, the lung TMB panel maintained significant separation for DCB and PFS (online supplemental figure S4D–G). These analyses lend further credence to the potential utility of a smaller panel designed specifically for lung TMB.
TMB high calls in plasma samples have high PPV
The TMB score is impacted by several factors including panel content and design, QC parameters such as coverage, tumor purity, contamination, and bioinformatics analysis methods. Also, differences in sequencing depth can affect the detection rate of variants and consequently TMB calculation. Since our tissue variant calling used a higher depth of sequencing and showed higher TMB values than previous approaches (figure 1A,B),33 we used a TMB cut-off in which ~40% of samples were found to be TMB high in the tissue data which resulted in a cut-off of 16 mut/Mb for the tumor tissue panel. This method is in line with previously reported approaches, including the FDA-approved F1CDx assay, where a cut-off of 10 mut/mb resulted in a TMB high cohort of 44.2% and 43.8% of samples in CheckMate 227 and CheckMate 568, respectively.34–36
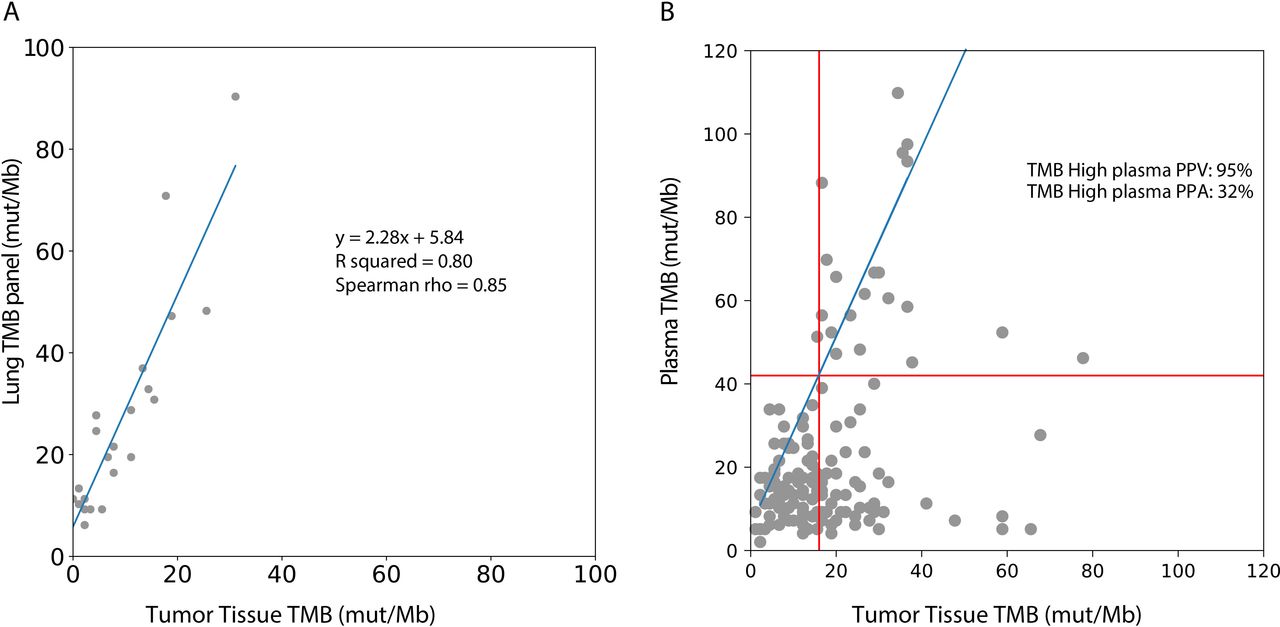
To compare tumor tissue panel based TMB values with the TMB values from the lung TMB panel, a subset of tissue samples was recaptured with the lung TMB panel, and an equation relating TMB values between the two panels was determined (R squared=0.80; figure 3A). Based on the above-mentioned analysis, 16 mutations per Mb in the tissue panel were found to correspond to 42 mutations per Mb in the lung TMB panel (figure 3A).

Comparison of plasma TMB with tumor tissue TMB. (A) A subset of tumor tissue samples sequenced by the tumor tissue panel were recaptured with the lung TMB panel. The TMB values by the tumor tissue panel correlated with the lung TMB panel: TMB/Mb=2.28 * tissue panel TMB/Mb+5.84. (B) Tissue TMB measured by tumor tissue panel (mut/Mb) vs plasma TMB measured by lung TMB panel (mut/Mb) for all samples (n=143). The linear relationship between the tissue and lung TMB panels determined in (A) is shown in blue, and TMB cutoffs corresponding to 16 mutations/Mb in the tissue panel are shown with red lines. PPA of plasma TMB high calls (percentage of tissue TMB high samples called high in plasma) and positive predictive value of plasma TMB high calls (percentage of plasma TMB high samples called high in tissue) are shown. PPA, positive per cent agreement; PPV, positive predictive value; TMB, tumor mutational burden.
The concordance between categorical TMB values (TMB-H vs TMB-L) between plasma and tumor was assessed using a tTMB cut-off of 10–24 mutations/Mb (table 2, figure 3B). The PPV for plasma TMB-H remained high (91%–100%) when tumor cut-offs were 16 mut/Mb or below, corresponding with plasma cut-offs of 42 mut/Mb or below, demonstrating accurate TMB-H calls in plasma. The PPA of detecting TMB-H from plasma remained low across most thresholds (24%–32%). As previously reported by others studies, samples classified as TMB-H in tissue may show lower TMB values in plasma.11 37 38 This may be due to a low tumor burden at earlier stages of disease as well as poorly shedding tumor types, all of which lead to a lower ctDNA, a lower mutation count, and hence reduced sensitivity for variant detection.39
Different TMB cut-off values for tissue and plasma TMB high vs low in all samples (n=143) sequenced by tumor tissue panel and lung TMB panel
Factors that impact the positive per cent agreement of plasma TMB
Although the PPV of bTMB-H calls is high, PPA (or sensitivity) is relatively low when all samples are considered. We next defined factors that drive bTMB PPA in NSCLC plasma samples and sought to determine whether there was a subset of tumor samples in which higher bTMB PPA could be achieved. Achieving high ctDNA PPA in general is challenged by small amounts of available cfDNA in specimens derived from early stage disease or tumors with low shedding rates. To answer the question, we looked at the impact of input mass and tumor burden on bTMB assessment.
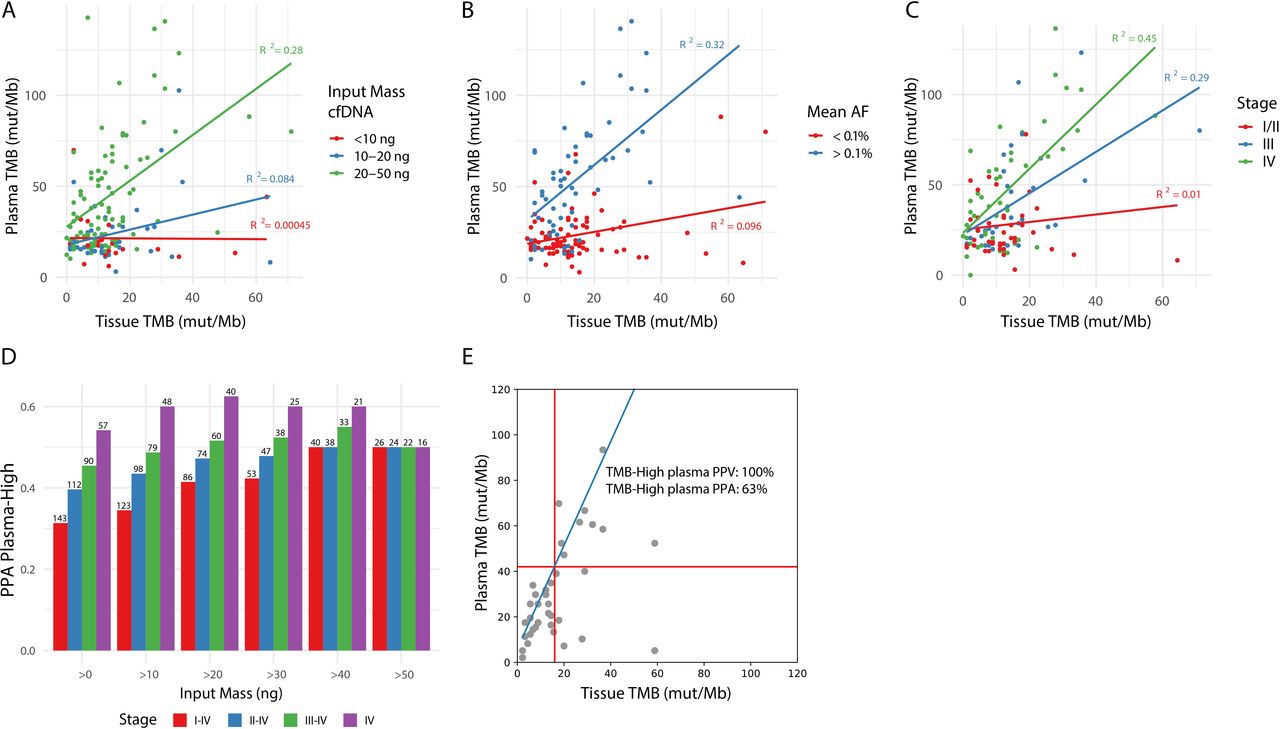
First, increased input mass of cfDNA showed an improved correlation between tissue and plasma TMB (online supplemental figure S6A). Samples with less than 20 ng of cfDNA input (38%) only rarely showed TMB-H values, regardless of the tissue TMB value, while samples with at least 20 ng of cfDNA input (62%) showed a correlation with tissue TMB (figure 4A, R squared 0.00045–0.084 vs 0.28). These data suggest using at least 20 ng of input cfDNA is important to ensure sufficient depth for low AF mutation calling. Previous studies have found similar results and also advice a minimum of 20 ng of cfDNA to accurately and reproducibly assess bTMB.11
Supplemental material

cfDNA input, tumor burden and stage of disease impact PPA of blood-based TMB. (A) Impact of cfDNA input mass, divided into three categories (<10 ng, 10–20 ng, and 20–50 ng), on the correlation between tissue and plasma TMB after germline filtering. (B) Impact of mean AF on the correlation between tissue and plasma TMB after germline filtering. For each plasma sample, the mean AF in plasma of variants found in the tumor sample was used to estimate tumor burden, resulting in a tumor-informed mean AF. Points are colored based on mean AF of <0.1% (red) or >0.1% (blue). Only samples with >10 ng cfDNA input mass and with variants detected by the tumor tissue panel which overlap with regions of the lung TMB panel are included in this plot. (C) Impact of stage of disease on the correlation between tissue and plasma TMB. Only samples with >10 ng cfDNA input mass are included in this plot. (D) The effect of a combination of cfDNA input mass and stage of disease on PPA for TMB high calls in plasma based on a 16 mut/Mb cut-off in tTMB is shown on the Y-axis. The cell-free DNA input mass was categorized into >0, 10, 20, 30, 40, 50 ng and is shown on the X-axis. Stage of disease was categorized as I–IV, II–IV, III–IV, or IV and is represented by the color of the bars. The number of samples included in the analysis is listed above each bar. (E) Tissue TMB vs plasma TMB for stage IV samples with >20 ng cfDNA input mass (n=39). The linear relationship between the tissue and lung TMB panels is shown in blue, and TMB cutoffs corresponding to 16 mutations/Mb in the tissue panel are shown with red lines. PPA and PPV of plasma TMB high calls (as defined in figure 3B) are shown. AF, allele frequency; PPA, positive per cent agreement; PPV, positive predictive value; TMB, tumor mutational burden.
Second, to define the relationship between tumor burden and TMB PPA, we used a tumor-informed approach to calculate tumor burden in plasma samples. We determined a list of true tumor-specific variants based on paired FFPET and PBMC per patient (n=143 with plasma, PBMC, and FFPET samples that passed sequencing QC metrics). In the patient’s corresponding plasma sample, we sought the mean AF of the known tumor specific variants. The correlation between tissue and plasma TMB was examined using different tumor-informed mean AF cutoffs (online supplemental figure S6B). Samples with a tumor burden greater than 0.1% mean AF (42%) showed sufficient correlation in TMB values between tissue and plasma, while those with a tumor burden below showed low correlation (R squared 0.32 vs 0.096, figure 4B).
Tumor burden is known to correlate with disease stage (online supplemental figure S7). In samples derived from patients with stage I, II, III, and IV disease, the PPA of bTMB increased from 0% (no bTMB-H results in stage I), 11%, 35% to 54%, respectively. The strongest correlation between tissue and plasma TMB is seen in patients with NSCLC with stage IV disease, correlation decreases with stage III, and no correlation is found in the earlier stages (R squared of 0.45, 0.29, and 0.01, figure 4C).
Supplemental material
Last, we examined the impact of sample filtering strategies that combined input mass, tumor burden, and stage information (figure 4D, online supplemental figure 8, tables S7,8). When restricting to samples from patients with stage IV disease and with >20 ng cfDNA input, at a tissue TMB cut-off of 16 mutations/Mb, TMB-H showed a 100% NPA, 63% PPA, 79% NPV, and 100% PPV (figure 4E, online supplemental table S10).
Supplemental material
Maintaining TMB performance while minimizing the sequencing panel
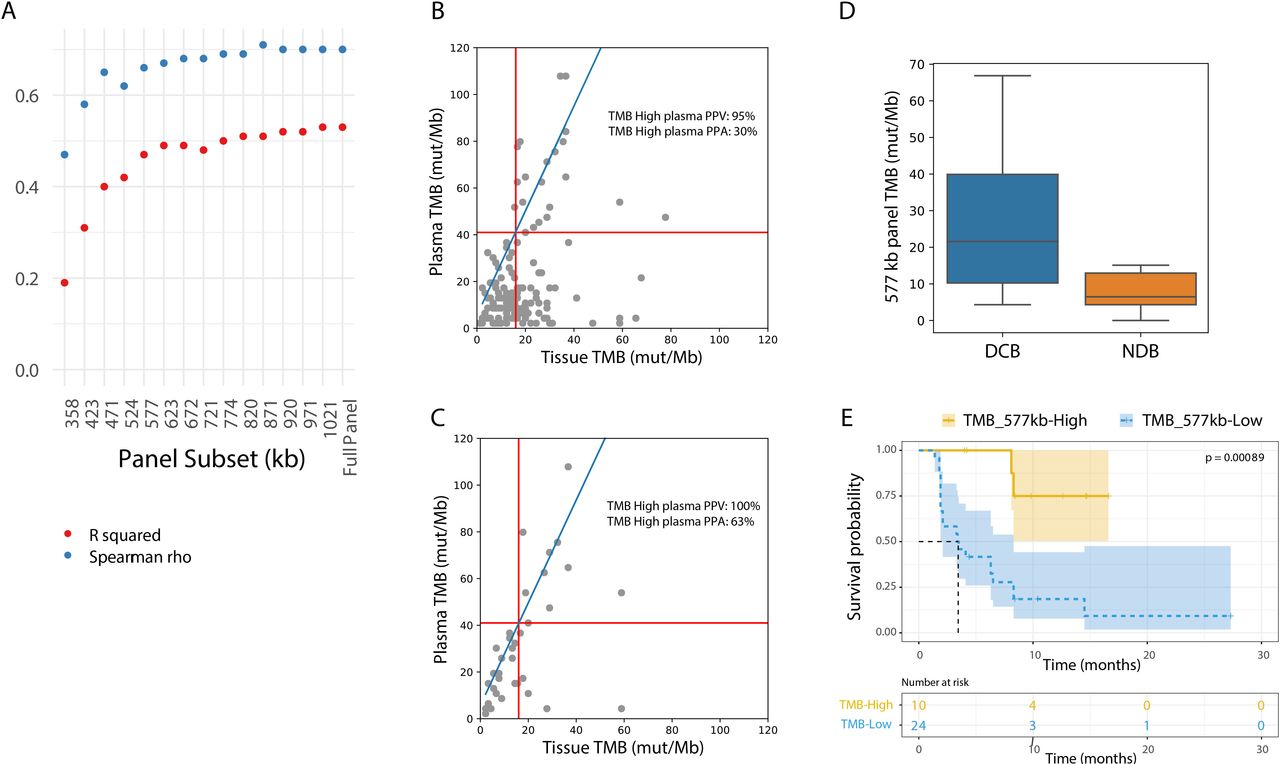
To examine whether a smaller panel would be able to determine TMB, subsets of the lung TMB panel were constructed ranging from 300 kb to 1.1 Mb. The panel subsets were formed by gradually adding ~50 kb tiles including only exonic regions from non-driver genes, in order of mutation prevalence (online supplemental table S6). A panel subset of at least ~577 kb maintained test performance in comparison to the 1.1 Mb lung TMB panel (figure 5A; R squared=0.48 and Spearman’s rho=0.66). Using the ~577 kb panel and a tissue TMB cut-off of 16 mut/Mb, the 557 kb panel maintained performance in comparison to the 1.1 Mb panel with 95% NPA and 30% PPA (figure 5B vs figure 3B, online supplemental table S11 vs table 2). When restricting to stage IV samples with at least 20 ng cfDNA input, PPA increased to 63% (figure 5C and online supplemental table S12). These data show that, when designed to maximize expected variants in the panel regions, a panel approximately half the size of what has been previously described, is able to accurately call plasma TMB.
An NGS panel as small as 577 kilobases enables accurate plasma TMB calls. (A) Correlation metrics (R squared in red; Spearman’s rho in blue) between tissue TMB and plasma TMB using different lung TMB panel subsets. Only samples with >10 ng cfDNA input mass and at least one variant captured were included. In smaller sub-sized panels, less variants could be captured, resulting in exclusion of 4% of the samples in the 358kb panel and 2% in the 423 to 577 kb panels. (B) Tissue TMB vs plasma TMB with the 577 kb panel for all samples (n=143). The linear relationship between tissue and lung TMB panels is shown in blue, and TMB cutoffs corresponding to 16 mutations/Mb in the tissue panel are shown with red lines. (C) Tissue TMB vs plasma TMB with the 577 kb panel for stage IV samples with >20 ng cfDNA input (n=39). The linear relationship between tissue and lung TMB panels is shown in blue, and TMB cutoffs corresponding to 16 mutations/Mb in the tissue panel are shown with red lines. (D) Comparison of TMB by in-silico validation considering only variants in the 577 kb lung TMB panel subset from the Rizvi et al dataset which included patients with DCB (n=14) and NDB (n=16). (E) Kaplan-Meier curve showing progression-free survival for patients from the Rizvi et al cohort. The dataset is split by high vs low TMB, considering only variants in the 577 kb lung TMB panel subset (TMB high: >20.8 mutations/Mb; TMB low: <20.8 mutations/Mb). DCB, durable clinical benefit; NDB, no durable benefit; TMB, tumor mutational burden.
Finally, to assess whether the ~577 kb panel TMB is clinically relevant, in-silico analyses of the data from Rizvi et al were reassessed with this panel subset. A significant difference in TMB values between patients with and without DCB was shown (figure 5D; p=0.006), and PFS was significantly longer in patients classified as TMB-H with the lung panel subset (figure 5E; HR=7.32, 95% CI 3.14 to 17.06).
Discussion
This study showed that by selectively designing a specific NSCLC panel for TMB, trustworthy plasma TMB-high results could be achieved with a PPV of 95%. However, the inherent challenge of low levels of cfDNA remained, which may be explained by non-shedding tumors or low clinical tumor burden due to early stage disease. Interestingly, PPA (sensitivity) of plasma TMB improved up to 63% in samples derived from patients with metastatic NSCLC.
To differentiate under which conditions a bTMB-L call can be trusted to accurately represent a TMB-L tumor, we assessed key features including input mass, tumor burden, and stage of disease. First, plasma samples with greater than 20 ng of cfDNA input were significantly more likely to accurately reflect tissue TMB, which is in line with previous research that typically recommends either 20 or 30 ng of input for cfDNA assays.11 40 In our study, 62% of samples across all stages and 70% of stage IV samples yielded at least 20 ng of cfDNA input. Although this yield is imperfect, tissue samples often fail to provide adequate DNA yield for TMB estimation as well due to insufficient sampling or poor tissue quality. In previous studies, 58%–63% of tissue samples provided sufficient DNA quantity for TMB estimation.36 40 To maximize the proportion of patients with sufficient cfDNA for NGS-based bTMB assessment, at least 4 mL of plasma should be isolated for each patient, and collection of more plasma may improve the PPA.
Second, tumor burden strongly correlated with the PPA of bTMB calling. Others have shown that a low AF <1% is associated with a higher rate of ctDNA technical discordance and a lower PPV.41 In this study, paired tissue samples enabled an accurate and sensitive method for tumor burden assessment using known tumor variants. When restricting to a mean AF of at least 0.1%, bTMB-H values showed a PPA of 64%. However, in the clinical setting, a paired tumor sample will typically not be available when assessing bTMB. Instead of AF, disease stage information may help us to determine the PPA of bTMB assessment. While TMB-H PPA across all samples in this study was 30%, it more than doubled to 63% when restricting to samples derived from patients with stage IV disease, demonstrating that setting thresholds for input mass and stage of disease improves bTMB PPA. Interestingly, this PPA is similar to other molecular plasma-based methods such as the ddPCR test for EGFR detection.42 Given the ease of access to peripheral blood versus tumor tissue, bTMB may be considered as the first test in clinical setting to assess TMB. With the current test performance, a bTMB-high result would be trustworthy; however, in case of a low bTMB result, physicians should subsequently consider a tissue-based TMB assessment. In this scenario, obtaining tumor tissue would not be necessary for patients with a bTMB-high result, thereby reducing the number of invasive procedures.
Since TMB is a continuous numeric variable rather than a discrete one, it is challenging to determine the optimal cut-off to predict ICI benefit. Several studies determined bTMB cutoffs based on comparisons with tTMB cutoffs, lacking a clinical perspective.11 23 24 36 Recently, studies have identified bTMB cutoffs based on clinical improvement in terms of OS and PFS.22 40 43 To test the practicability of our panel in relation to clinical outcomes, an in-silico analysis was performed using previously published data.7 In this analysis, clinical outcome differentiation by our lung TMB panel was in line with WES data, suggesting that the methods described here have clinical potential.
A key limitation for integration of plasma-based TMB in daily clinical care is the high cost, caused by the necessity of high depth of unique coverage to reliably detect low AF variants in plasma. Therefore, plasma panels are typically limited in breadth to ensure sequencing costs remain affordable. The traditional TMB sequencing panels cover at least 1 Mb of exonic regions to ensure accurate TMB assessment.19 23 44 45 Here, we demonstrated that accurate TMB calling can be achieved using smaller panels by targeting specifically recurrently mutated regions. A 577 kb plasma panel maintained 95% PPV for TMB calling, representing a potential 40% reduction in sequencing costs relative to a 1 Mb panel. Notably, approximately half of the 577 kb panel targets relevant driver and resistance mutations, implying if a panel were designed exclusively for TMB assessment, panel size and sequencing costs may be further reduced.
In conclusion, sufficient PPV for bTMB-H can be achieved with a novel cost-efficient and highly accurate TMB panel that is significantly smaller than the 1 Mb minimum previously established.46 As observed in other bTMB studies, PPA for blood based TMB assessment was lower than for matched tumor samples. This could be improved by setting criteria including amount of cfDNA, tumor-informed mean AF’s, or stage of disease information. For patients with stage IV NSCLC in particular, bTMB assessment can be performed alongside somatic mutation detection in cfDNA with a single NGS assay. However, in case of bTMB low values, reflexing to a tissue-based TMB assessment may be prudent. These results warrant consideration of bTMB as a predictive biomarker for patients with NSCLC eligible for ICI in the future.
Data availability statement
All data relevant to the study are included in the article or uploaded as online supplemental information. Additional data is available upon reasonable request.
Ethics statements
Patient consent for publication
Ethics approval
This study involves human participants and was approved by Institutional Review Board of the Netherlands Cancer Institute (Reference number CFMPB612). Participants gave informed consent to participate in the study before taking part.
Acknowledgments
The authors would like to thank the Core Facility of Molecular Pathology and Biobanking of the Netherlands Cancer Institute.
References
Supplementary materials
Supplementary Data
This web only file has been produced by the BMJ Publishing Group from an electronic file supplied by the author(s) and has not been edited for content.
Footnotes
MS and ZH contributed equally.
Correction notice This article has been corrected since it was first published. The author order has been updated.
Contributors MS: conceptualization, formal analysis, writing—original draft. ZH: conceptualization, software, formal analysis, writing—original draft. SS: laboratory experiments, formal analysis. MJ: writing—review and editing. LdV: conceptualization, writing—review and editing. DvdB: conceptualization, writing—review and editing. KM: conceptualization, writing—review and editing. MvdH: conceptualization, writing—review and editing, supervision. AL: conceptualization, software, formal analysis, writing—original draft, visualization. DK: writing—review and editing, guarantor of the study.
Funding All kits and reagents in this research were furnished by Roche Diagnostics. The reagents and workflows were derived from the AVENIO Tumor Tissue and ctDNA Analysis Kits and are for research use only and not for use in diagnostic procedures.
Competing interests ZH, SS, MJ, and DK are employed by Roche Sequencing Solutions (Pleasanton, CA, USA), which manufactures the AVENIO Tumor Tissue and ctDNA Analysis Kits. AL is a former employee of Roche Sequencing Solutions (Pleasanton, CA, USA) and is employed by Freenome (San Francisco, CA, USA). LdV is employed by Roche Diagnostics International, CH. DvdB received payment or honoraria for lectures, presentations, speakers bureaus, manuscript writing, or educational events and for expert testimony by Roche to the institution. KM received a research grant from Astra Zeneca, speakers fees from MSD, Roche, Astra Zeneca, Benecke, consultant fees from Pfizer, BMS, Roche, MSD, Abbvie, AstraZeneca, Diaceutics, Lilly, Bayer, Boehringer Ingelheim, and non-financial support from Roche, Takeda, Pfizer, PGDx, and Delfi. MvdH received sponsorship or research funding by Astrazeneca, BMS, Janssen Pharmaceutica, Stichting Treatmeds, Merck, MSD, Novartis, Pamgene, Pfizer, Roche, Roche diagnostics and fees or other from Abbvie, Astrazeneca, BMS, Lilly, MSD, Novartis, Pfizer, and Roche. MS: none declared.
Provenance and peer review Not commissioned; externally peer reviewed.
Supplemental material This content has been supplied by the author(s). It has not been vetted by BMJ Publishing Group Limited (BMJ) and may not have been peer-reviewed. Any opinions or recommendations discussed are solely those of the author(s) and are not endorsed by BMJ. BMJ disclaims all liability and responsibility arising from any reliance placed on the content. Where the content includes any translated material, BMJ does not warrant the accuracy and reliability of the translations (including but not limited to local regulations, clinical guidelines, terminology, drug names and drug dosages), and is not responsible for any error and/or omissions arising from translation and adaptation or otherwise.