Article Text

Abstract
Background The composition of the tumor immune microenvironment (TIME) associated with good prognosis generally also predicts the success of immunotherapy, and both entail the presence of pre-existing tumor-specific T cells. Here, the blueprint of the TIME associated with such an ongoing tumor-specific T-cell response was dissected in a unique prospective oropharyngeal squamous cell carcinoma (OPSCC) cohort, in which tumor-specific tumor-infiltrating T cells were detected (immune responsiveness (IR+)) or not (lack of immune responsiveness (IR−)).
Methods A comprehensive multimodal, high-dimensional strategy was applied to dissect the TIME of treatment-naive IR+ and IR− OPSCC tissue, including bulk RNA sequencing (NanoString), imaging mass cytometry (Hyperion) for phenotyping and spatial interaction analyses of immune cells, and combined single-cell gene expression profiling and T-cell receptor (TCR) sequencing (single-cell RNA sequencing (scRNAseq)) to characterize the transcriptional states of clonally expanded tumor-infiltrating T cells.
Results IR+ patients had an excellent survival during >10 years follow-up. The tumors of IR+ patients expressed higher levels of genes strongly related to interferon gamma signaling, T-cell activation, TCR signaling, and mononuclear cell differentiation, as well as genes involved in several immune signaling pathways, than IR− patients. The top differently overexpressed genes included CXCL12 and LTB, involved in ectopic lymphoid structure development. Moreover, scRNAseq not only revealed that CD4+ T cells were the main producers of LTB but also identified a subset of clonally expanded CD8+ T cells, dominantly present in IR+ tumors, which secreted the T cell and dendritic cell (DC) attracting chemokine CCL4. Indeed, immune cell infiltration in IR+ tumors is stronger, highly coordinated, and has a distinct spatial phenotypical signature characterized by intratumoral microaggregates of CD8+CD103+ and CD4+ T cells with DCs. In contrast, the IR− TIME comprised spatial interactions between lymphocytes and various immunosuppressive myeloid cell populations. The impact of these chemokines on local immunity and clinical outcome was confirmed in an independent The Cancer Genome Atlas OPSCC cohort.
Conclusion The production of lymphoid cell attracting and organizing chemokines by tumor-specific T cells in IR+ tumors constitutes a positive feedback loop to sustain the formation of the DC–T-cell microaggregates and identifies patients with excellent survival after standard therapy.
- tumor microenvironment
- immunotherapy
Data availability statement
Data are available in a public, open access repository. Data are available upon reasonable request. All data relevant to the study are included in the article or uploaded as supplementary information.
This is an open access article distributed in accordance with the Creative Commons Attribution Non Commercial (CC BY-NC 4.0) license, which permits others to distribute, remix, adapt, build upon this work non-commercially, and license their derivative works on different terms, provided the original work is properly cited, appropriate credit is given, any changes made indicated, and the use is non-commercial. See http://creativecommons.org/licenses/by-nc/4.0/.
Statistics from Altmetric.com
Introduction
Head and neck cancer is the sixth most prevalent cancer type and predominantly comprises squamous cell carcinoma (90%).1 Head and neck tumors can develop in the pharynx, larynx, oral cavity and sinonasal tract following genetic alterations driven by carcinogen exposure or high-risk human papillomavirus (HPV) infection. The majority of oropharyngeal squamous cell carcinomas (OPSCCs), which include tumors of the tonsils and the base of tongue, are induced by HPV type 16 (HPV16).2 Patients with HPV16+ OPSCC display a longer overall survival (OS) and a lower recurrence rate after surgery and/or chemoradiation than patients with HPV− OPSCC.3 Head and neck squamous cell carcinomas (HNSCCs) are generally treated with surgery and/or chemoradiation,4 associated with high comorbidities and thereby severely impacting patients’ quality of life. Immune checkpoint inhibition (ICI) is nowadays used in recurrent or metastatic HNSCC after failure of first-line treatment, and is only successful in 20%–30% of patients.5 6 The low response rate to ICI highlights the need to better understand the complex biology underlying the state of the tumor immune microenvironment (TIME) in HNSCC, in order to improve the efficacy of ICI and to provide a rationale for new immunotherapy design.
Biomarker studies of the TIME suggest that parameters associated with good prognosis also predict the efficacy of ICI, and both entail the strong presence of pre-existing CD4+ and CD8+ tumor-reactive T cells.7–10 In most types of tumors, it is difficult to assess the presence of tumor-reactive tumor-infiltrating lymphocytes (TILs) as it requires the identification of tumor (neo)antigens recognized by T cells for each individual patient. Consequently, it will be tough to identify the immunological blueprint of a productive—that is, a tumor-reactive T cell-infiltrated—TIME, and subsequently to pinpoint what issues should be addressed by novel immunotherapy approaches. In the case of HPV16-induced OPSCC, all tumors have the HPV neoantigens in common, providing a unique setting to unravel the make-up of a productive TIME.
Here, we made use of a unique prospective cohort of patients with OPSCC to address these questions. We recently showed that the improved survival of HPV16+ OPSCC was strongly associated with the presence of HPV16 E6-reactive and/or E7-reactive tumor-specific CD4+ and CD8+ TILs,2 which were detected in 57% of the HPV16+ patients with OPSCC. The dichotomy of HPV16-induced OPSCC with or without the presence of tumor-specific TILs provides an exceptional opportunity to identify TIME features associated with immune responsiveness (IR+) or lack of immune responsiveness (IR−) using a multimodal high-dimensional approach. Our studies in treatment-naive tumor tissues revealed distinct interactions of CD8+ and CD4+ T cells with different myeloid cells between HPV16+IR+ and HPV16+IR− patients with OPSCC. These differences were associated with higher expression of CXCL12 and LTB, as well as the clonal expansion of T cells producing CCL4 in HPV16+IR+ OPSCC compared with its IR− counterpart. Clinical and bulk mRNA sequencing data from The Cancer Genome Atlas (TCGA)11 confirmed our findings in an independent HPV16+ OPSCC cohort.
Materials and methods
Patients
Patients included in this study were part of a larger prospective observational study in OPSCC. Patients with histologically confirmed OPSCC were included in the P07-112 study investigating the circulating and local immune response in patients with head and neck cancer.2 12 All the tumor material investigated in this study was obtained prior to therapy. Patients were treated with standard of care therapy consisting of surgery, radiotherapy, chemotherapy or combinations thereof. HPV typing on formalin-fixed paraffin-embedded (FFPE) tumor sections was performed as described.2 12 Tumor staging was performed according to the National Comprehensive Cancer Network (https://www.nccn.org/professionals). An overview of the study design is shown in online supplemental figure 1A. A summary of the characteristics of the patient with OPSCC and the tumor analyses performed is provided in online supplemental table 1. The OS of the patients was updated until February 2021.
Supplemental material
Supplemental material
Blood and tumor cell isolation
Venous blood samples (54 mL) were drawn in sodium heparin tubes (BD Bioscience, Breda, the Netherlands) prior to surgery and processed within 6 hours. Peripheral blood mononuclear cells (PBMCs) were isolated using Ficoll density centrifugation and stored in the vapor phase of liquid nitrogen until use. Tumor material was obtained from the operation theater or from the outpatient clinic. One part of the tumor was fixed in formalin and embedded in paraffin for routine diagnostics at the pathology department, whereas the other part was used in parallel for single-cell dissociation and culture of TILs, as described.2 12 In brief, OPSCC tumors were cut into small pieces. One-third of the tumor pieces were put in culture in Iscove's Modified Dulbecco's Medium (IMDM) supplemented with 10% human AB serum (Capricorn Scientific, Ebsdorfergrund, Germany), 100 IU/mL penicillin, 100 µg/mL streptomycin, 2 mM L-glutamine (IMDM complete; Lonza, Breda, the Netherlands) and 1000 IU/mL human recombinant IL-2 (Aldesleukin; Novartis, Arnhem, the Netherlands). Cultures were replenished every 2–3 days until sufficient cells were obtained. Two-thirds of the tumor pieces were incubated for 15 min at 37°C in IMDM dissociation mixture containing 10% human AB serum, high dose of antibiotics (as mentioned previously) and 0.38 mg/mL Liberase (Roche Liberase TL research grade; Sigma Aldrich Chemie N.V., Zwijndrecht, the Netherlands). Following incubation, the cell suspension was passed through a 70 µm cell strainer (Falcon, Durham, North Carolina, USA) to obtain a single-cell suspension, counted using trypan blue exclusion (Sigma Aldrich Chemie N.V.), and cryopreserved at approximately 2 million cells/vial. All cells were stored in the vapor phase of liquid nitrogen until further use.
Tumor-specific T-cell reactivity analysis
Cultured TIL batches were analyzed for the presence of HPV16-specific T cells as described previously.2 To this end, reactivity of the cultured TIL was tested using autologous monocytes loaded with 5 µg/mL HPV16 E6/E7 synthetic long peptides (SLPs, 22 mers with 14 amino acid overlaps) in a 5-day (3-hour) thymidine-based proliferation and cytokine production assay. PHA (0.5 µg/mL, HA16 Remel; Thermo Fisher Scientific, Bleiswijk, the Netherlands) served as a positive control, while unloaded monocytes served as negative controls. At days 1.5 and 4.0, supernatant (50 µL/well) was harvested for cytokine analyses. Antigen-specific interferon gamma (IFN-γ), tumor necrosis factor alpha (TNF-α), interleukin (IL)-10 and IL-5 production was measured by using a cytometric bead array (Th1/Th2 kit, BD Bioscience). The cut-off value for cytokine production was 20 pg/mL, except for IFN-γ, for which it was 100 pg/mL. Antigen-specific CCL4 and CXCL13 production was assessed by a custom-made 2-plex cytokine assay (Luminex, ProcartaPlex Immunoassay; Thermo Fisher Scientific). Positive cytokine production was defined as at least two times above that of the unstimulated cells. HPV16 reactivity was also determined by intracellular cytokine staining (ICS). ICS was performed with antibodies for the markers CD3, CD4, CD8, CD137, CD154, IFN-γ, TNF-α, and CCL4 following stimulation with HPV16 E6/E7 SLP-loaded EBV-transformed B-lymphoblastoid cell lines (BLCLs) as described.12 Unloaded BLCL served as negative control and phytohaemagglutinin (PHA) served as positive control. A positive response was defined as at least two times the value of the negative control, and at least 10 events in the gate. Acquisition was done on an LSRII Fortessa (BD Biosciences, LUMC flow cytometer core facility) and data analysis was performed with FlowJo software V.10.7.1.
NanoString PanCancer IO360 panel analysis
Archived diagnostic FFPE histological specimens were used to cut 10 consecutive sections of 10 µm for RNA extraction. Directly before and after these 10 µm-thick sections, a 4 µm section was cut for H&E staining. An OPSCC-specialized pathologist annotated tumor regions on these two H&E slides to ensure that all 10 µm slides contained tumor. After the sections were deparaffinized, the tumor areas were macrodissected using the annotated H&E slides as reference and were placed in Buffer PKD of the RNA FFPE isolation kit (Qiagen, Hilden, Germany). RNA was isolated according to the manufacturer’s instruction. The quality and quantity of the RNA was verified with the Agilent 2100 Bioanalyzer System, making use of the RNA 6000 Nano kit (Agilent, Santa Clara, California, USA). Samples were selected for further processing when >15% of the RNA fragments were >300 bp and the corrected RNA concentration remained ≥60 µg/µL. To measure the gene expression profiles, 300 ng of RNA from each sample was hybridized with the probes of the human PanCancer IO360 panel for 17 hours at 65°C, following the manufacturer’s instructions (NanoString Technologies, Seattle, Washington, USA). The number of copies of each gene in every sample was counted by scanning 490 fields of view using the nCounter MAX system (NanoString Technologies). The raw data (counts of genes) were uploaded to the nSolver V.4.0 software (NanoString Technologies), after which a quality check was performed in the gene expression analysis. The 20 housekeeping genes in the IO360 panel facilitated sample-to-sample normalization. Eight negative controls and six synthetic positive controls were included. The data were reviewed for reliability and validity based on the imaging (>0.75) and binding density (0.1–2.25) quality control metrics and performance check of the positive controls (0.95–1). Samples with less than eight housekeeping genes with >100 counts were removed during quality control (n=3). The data were analyzed using nCounter Advanced Analysis module V.2.0 software (NanoString Technologies), in which automated cell type profiling and pathway analysis based on the expression of predefined genes was performed (online supplemental table 2). Benjamini-Hochberg adjusted p values were used to decrease the false-discovery rate. Differentially expressed genes (DEGs) were defined by a log2 fold difference of >1 or ≤1 and an adjusted p value of <0.05.
Imaging mass cytometry (IMC) and imaging processing analysis pipeline
IMC was performed using a previously optimized 33-marker panel.13 FFPE whole-tumor sections of 4 µm thick were deparaffinized. Heat-induced epitope retrieval was performed with citrate (10 mM, pH6.0), and SuperBlock (Thermo Fisher Scientific) was used to block non-specific binding sites. The first mix of 16 heavy metal conjugated antibodies was incubated for 5 hours at room temperature; the second mix of 17 heavy metal conjugated antibodies was incubated overnight at 4°C. Finally, an intercalator (DNA binder) was applied. An overview of the antibodies and their conjugated heavy metals can be found in online supplemental table 3. The tissue slides were then analyzed by IMC using the Hyperion system (Fluidigm). Tumor regions were annotated by a pathologist, and two to three 1 mm2 regions per tumor were analyzed to account for intratumoral heterogeneity. The selected regions on the slides were laser ablated and processed through a mass cytometer, after which the detected heavy metals and their corresponding antibody (marker) were linked to the ablated region with a subcellular resolution of 1 μm2 per pixel (an overview of IMC workflow is provided in online supplemental figure 1B,C).
The generated high-dimensional output was analyzed with a newly developed imaging processing pipeline, combining multiple previously validated publicly available software programs. The pipeline incorporates six automated consecutive steps, of which an overview is presented in online supplemental figure 1C. First, the signal of the markers was normalized to prevent sample biased clustering as this is frequently encountered when using FFPE tissue. Semisupervised machine learning was employed to train the software to distinguish signal from background noise for each individual marker using the software programs Ilastik and CellProfiler,14 creating a binarized mask in which markers with their location on the image were expressed. Second, the same semisupervised machine learning approach was used to segment the tissue into tumor and stroma, as well as to segment the individual cells on the images. These masks with layers of required information (normalized signal for all 33 markers, tissue segmentation, and cell segmentation) were then combined in a single flow cytometry standard (FCS) file using ImaCyte (in-house developed software program for IMC data analysis, https://github.com/biovault/ImaCytE).15 Hierarchical Stochastic Neighbor Embedding (HSNE)-based cell clustering was performed with Cytosplore,16 and cluster verification and phenotype calling were performed using MCD Viewer and ImaCyte. After these preprocessing steps, quantitative analysis of the identified clusters was performed using ImaCyte. Spatial high-dimensional cell–cell interaction analyses and cellular microaggregate detection (more than three cells directly neighboring each other) were performed using ImaCyte and R. Permutation testing with 1000 iterations was performed to identify spatial interactions that occurred more frequently than expected based on chance, thus correcting for the cell cluster frequency. Only interactions with a permutation-based Z-score of >2 (ie, outside 95% normal distribution range) were included for further analyses. To study differences in spatial interactions across two subgroups (HPV16+IR− vs HPV16+IR+), interactions with a permutation-based Z-score of >2, occurring at a frequency of at least twofold more in either of the subgroups, were included in the comparative analyses.
Single-cell RNA sequencing and data analysis
Single-cell tumor samples were thawed and enriched for viable CD3+ T cells and CD56+ NK cells using the dead cell removal kit (Miltenyi Biotec), followed by combined CD3/CD56 microbead-guided magnetic cell enrichment (Miltenyi Biotec) according to the manufacturer’s instructions. After isolation, viability was more than 70%, and percentage CD3/CD56 was 62.5 (range 27.5–97) and percentage B cells was 28.7 (range 1.6–64.8). Single-cell RNA sequencing (scRNAseq) was performed as we described previously.17 In brief, between 2108 and 6107 sorted cells per sample were loaded on a chromium single-cell controller (10x Genomics), lysed, and barcoded. Reverse transcription of polyadenylated mRNA from single-cells was performed inside each gel bead emulsion using the single-cell 5′ gene expression library workflow. Next-generation sequencing libraries were prepared in a single bulk reaction, and transcripts were sequenced using the HiSeq4000 System (Illumina). FASTQ files were preprocessed with Cell Ranger V.3.0.0 (10x Genomics) using the GRCh38 reference genome. Quality control and downstream analysis was performed using Scanpy V.1.6.018 and Scirpy V.0.6.1.19 All scripts used to perform the analysis are combined in one fully reproducible Nextflow pipeline and publicly available from GitHub (https://github.com/icbi-lab/abdulrahman2021_paper). Briefly, low-quality cells were excluded, retaining only cells with (1) >700 detected genes, (2)>2000 detected reads, and (3) <11% mitochondrial reads. Cells with more than one T-cell receptor (TCR)-β or more than two TCR-α chains were discarded as putative doublets, in addition to computational doublet detection using SOLO.20 Ribosomal, mitochondrial, and TCR genes were excluded from downstream transcriptomic analysis. Raw counts were normalized per cell and log-transformed. Finally, the 6000 most highly variable genes of 14 242 T cells and 2820 NK cells were selected and used for unsupervised Leiden clustering.21 Embeddings were visualized using Uniform Manifold Approximation and Projection (UMAP).22 Differential gene expression between clusters was computed using edgeR,23 including the number of detected genes into the linear model.
Statistical analysis
Statistical data analysis was performed with GraphPad Prism V.8.0.1 (GraphPad Software, LA Jolla, California, USA), which was also used to create graphs to visualize the data. The median immune counts of the three different OPSCC subgroups (HPV−, HPV16+IR−, and HPV16+IR+) were compared using the non-parametric Kruskal-Wallis test, with two subgroups (HPV16+IR− vs HPV16+IR+) using the non-parametric Mann-Whitney U test. Spearman correlation was used to study correlations between the identified (super)clusters. Differences in survival, HR with 95% CI, were calculated with the non-parametric Mantel-Cox test. Two-sided p values of <0.05 were marked as statistically significant.
Results
Differences in immune signature between OPSCC patient groups with different clinical outcomes
The OS data from our prospective cohort of 128 patients with OPSCC extended earlier observations3 showing that patients with HPV+ OPSCC displayed a better clinical outcome than HPV− OPSCC. Importantly, the TILs of 35 out of 61 tested patients with HPV16+ OPSCC displayed reactivity against the E6 and/or E7 viral oncoproteins (IR+). The fate of this HPV16+IR+ patient group, of which >90% had at least 5 years of follow-up, was much better as they displayed superior survival when compared with the HPV16+IR− group (figure 1A), providing a firm basis for a positive role of local T-cell immunity in OPSCC. Differences in survival based on anatomical tumor location could be excluded (online supplemental table 1), and the influence of smoking, tumour, node, metastasis stage, and received therapy on survival was excluded earlier.2
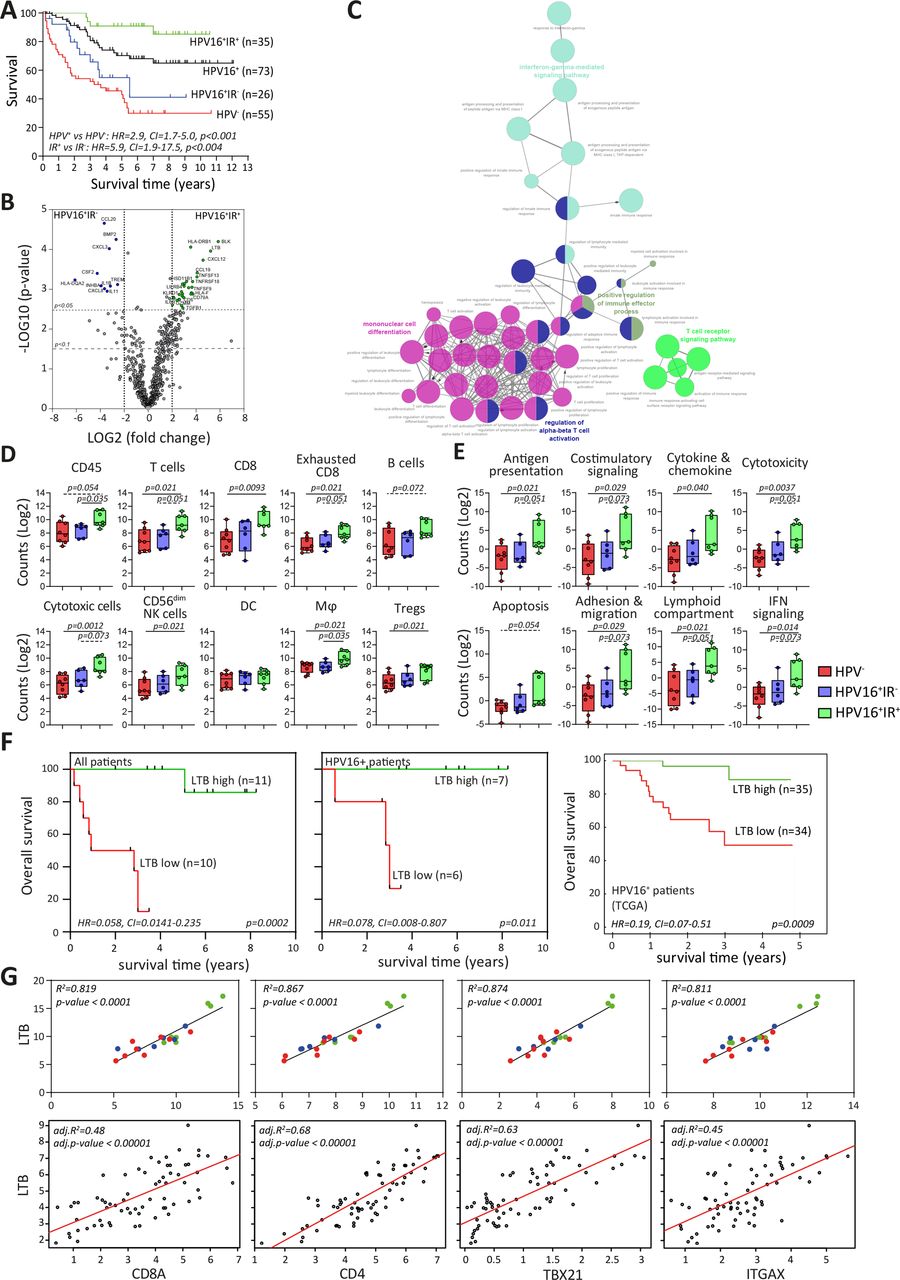
Immune signature of TME impacts survival of patients with OPSCC. (A) Kaplan-Meier survival curves of prospectively followed up cohort of HPV− and HPV16+ patients with OPSCC, the latter of whom are also subdivided into those with a tumor-specific T-cell response (HPV16+IR+) and those lacking this immune response (HPV16+IR−). (B) Volcano plots of upregulated DEGs identified by NanoString Pancancer IO360 between HPV16+IR+ (right) and HPV16+IR− (left). The dotted lines indicate the Benjamini-Hochberg adjusted p<0.05 and p<0.1 thresholds. (C) ClueGo of DEGs (p<0.1) between HPV16+IR+ and HPV16+IR− patients, visualizing the pathways in which these genes are involved. (D) Deconvoluted cells by expression of genes predefined for different immune cell types depicted as counts in HPV−, HPV16+IR− and HPV16+IR+ OPSCC. (E) Differential expression of predefined pathway genes in HPV−, HPV16+IR− and HPV16+IR+ OPSCC. (F) Kaplan-Meier survival curves based on high/low LTB expression (classification based on median LTB expression), in all patients with OPSCC analyzed by NanoString Pancancer IO360 (n=21), in the HPV16+ patients within this cohort (n=13) and in a large independent TCGA cohort of HPV16+ OPSCC (n=69). (G) Linear regression analyses of top upregulated DEG LTB in HPV16+IR+ compared with HPV16+IR− OPSCC versus cell-type profiles of CD8 (CD8A), CD4, Tbet+ T cells (TBX21) and DC (ITGAX, CD11c) both for this cohort (n=21, upper panel) and the TCGA cohort of HPV16+ OPSCC (n=69, lower panel). HPV− (red), HPV16+IR− (blue) and HPV16+IR+ (green). DC, dendritic cell; DEG, differentially expressed gene; HPV, human papillomavirus; IR+, immune responsiveness; IR−, lack of immune responsiveness; OPSCC, oropharyngeal squamous cell carcinoma; TCGA, The Cancer Genome Atlas; TME, tumor microenvironment.
Differences in gene expression, both at pathway and individual gene levels, were studied in 21 patients with OPSCC (n=8 HPV−, n=6 HPV16+IR−, and n=7 HPV16+IR+) using the NanoString human PanCancer IO360 panel, with a particular focus on immune-related pathways including estimation of immune cell abundance. This approach revealed 43 DEGs between HPV16+IR+ and HPV16+IR− patients OPSCC (figure 1B and online supplemental table 2A). The immune profile of HPV− and HPV16+IR− patients with OPSCC was highly similar as only one DEG was detected (online supplemental tables 2A and 4B), and 209 DEGs were detected between HPV− and HPV16+IR+ patients with OPSCC (online supplemental tables 2B and 4C). A number of the upregulated DEGs (p<0.05) in HPV16+IR− OPSCC compared with HPV16+IR+ OPSCC are associated with suppressive myeloid cells (CCL20, CXCL3, CSF2, TREM1, and IL-1B),24 angiogenesis (CXCL8),25 transforming growth factor (TGF)-β pathway (INHBA and BMP2),26 and immune suppression (IL-11).27 The top upregulated DEGs in HPV16+IR+ compared with its IR− counterpart were BLK, reflecting B cells (online supplemental figure 2C), and the chemokines LTB and CXCL12, which are involved in ectopic lymphoid structure development, required for the coordination of adaptive immune responses.28 Interestingly, the well-known chemokines for T-cell attraction, CXCL9, CXCL10, and CXCL11, did not differ.
Supplemental material
ClueGO analyses of all DEGs between the two HPV16+ patient groups29 indicated a strong relation with immune enrichment processes related to IFN-γ signaling, T-cell activation, TCR signaling, and mononuclear cell differentiation in HPV16+IR+ tumors (figure 1C). Gene expression-based cell type profiling (online supplemental table 2) suggested an increased infiltration by immune cells in the HPV16+IR+ group, including T cells, CD8+ T cells, natural killer (NK, CD56dim) cells, cytotoxic cells, and macrophages (figure 1D). This group also displayed a stronger involvement of several immune signaling pathways, including antigen presentation, costimulatory signaling, interferon signaling, cytokine and chemokine pathway, cytotoxicity, apoptosis, cell adhesion, and migration pathway (figure 1E).
Assessment of the impact of the three top upregulated DEGs in HPV16+IR+ and HPV16+IR− on survival revealed that higher expression of BLK, LTB and CXCL12 was associated with longer OS, in our own discovery cohort as well as in in a larger independent group of 69 patients with HPV16+ OPSCC from the publicly available TCGA database11 (figure 1F and online supplemental figure 2D), whereas there was no clinical impact for the three top upregulated DEGs in HPV16+IR− (online supplemental figure 2E). Specifically, LTB expression was consistently related to the presence of CD4+ T cells, CD8+ T cells, and CD11c+ myeloid (ITGAX) cells and the expression of Tbet (TBX21) (figure 1G and online supplemental figure 2F). Furthermore, LTB expression was strongly related to genes of immune cell activation (RELA, NFKB1, NFKB2, and TNF) but not with RELB and MET online supplemental figure 2G), previously reported in the context of LTB to be associated with migration of tumor cells.30
Overall, these data suggest that the OPSCC of HPV16+IR+ patients displays a hot immune signature with a chemokine-driven coordinated influx of different immune cells, whereas HPV16+IR− OPSCC displays upregulation of genes related to poor survival. These data fit well with the clinical fate of these groups, showing a long OS for HPV16+IR+ and shorter OS for HPV16+IR− and HPV− patients with OPSCC.
Identification and quantification of 51 different cell clusters in the tumor microenvironment (TME) of OPSCC
To provide a detailed inventory of the in situ immune landscape of OPSCC, we extensively characterized the tumors of 20 patients (n=5 HPV−, n=4 HPV16+IR−, and n=11 HPV16+IR+) using a previously optimized 33-marker panel for IMC13 and an imaging processing pipeline (online supplemental figure 1C). A total of 142 868 tumor cells, 46 907 stromal cells, and 274 775 immune cells (online supplemental figure 1D) were identified in the images (figure 2A) for cluster quantification and for spatial and cell interaction analyses. These cells formed 51 clusters comprising 14 tumor, 15 lymphoid, 15 myeloid, and 7 other cell clusters (online supplemental figure 3A), all of which were verified in the raw images using MCD Viewer (online supplemental figure 4). The 51 clusters (c) were then grouped into 18 mutually exclusive superclusters (sc) (online supplemental figure 3A), and in 10 non-mutually exclusive sc, based on the expression of a particular lineage marker of interest expressed by multiple clusters (online supplemental table 5).
Supplemental material
Supplemental material

Imaging mass cytometry identifies cell clusters present in different percentages across OPSCC subgroups. (A) Representative images of immune cell infiltrate in the context of the microenvironment of OPSCC, as found in the three distinct subgroups (HPV−, HPV16+IR−, and HPV16+IR+), visualizing the spatial location of immune cells (CD45ro in green) in the tumor epithelium (keratin in red) and stroma (vimentin in blue) regions. A selection of both lymphoid and myeloid cell markers in the same image is also shown. (B) Fractional composition of the TME of the three OPSCC subgroups, depicting the median percentage of the 18 sc. (C) Box plots visualizing the quantitative cell counts in the whole tumor of the most differential sc across the three OPSCC subgroups: HPV− red (n=5), HPV16+IR− blue (n=4), and HPV16+IR+ green (n=11). HPV, human papillomavirus; IR+, immune responsiveness; IR−, lack of immune responsiveness; OPSCC, oropharyngeal squamous cell carcinoma; sc, superclusters; TME, tumor microenvironment.
Quantification of the 51 cell clusters (online supplemental figure 5) and 18 mutually exclusive sc immediately revealed differences in tumor composition between the three OPSCC groups studied. The HPV16+IR+ tumors displayed the highest percentage of immune cells among all counted cells in the TME (figure 2B). They were richer infiltrated by T cells, M1 macrophages, and dendritic cells (DCs) (figure 2B,C, and online supplemental figure 3B). The OPSCC of HPV16+IR− and HPV− patients contained relatively more tumor cells, fibroblasts, and blood vessels, indicative of a more tumor-promoting environment. The HPV− OPSCC contained the lowest percentage of immune cells (figure 2B,C, and online supplemental figure 3B). The differences observed in the cellular composition of OPSCC among the three patient groups underline the transcriptomic signatures found by NanoString analyses and relate to their corresponding clinical course.
Principally different immune cell interactions in HPV16+IR+ versus HPV16+IR− patients
Immune-mediated tumor control requires a coordinated response of several immune cell types in a spatial and dynamic manner.31 Spearman correlation heatmaps generated for the 28 sc revealed strong positive and negative correlations between the counts of various cell types in HPV16+IR+ tumors (figure 3A,B). Linear regression analysis results for those phenotypes with a correlation coefficient of >0.6 and p value of <0.01 were analyzed, showing in particular strong associations between the counts of (CD103+) CD8+ T cells with DCs and with CD14+ inflammatory myeloid cells in HPV16+IR+ patients (figure 3B,C). No significant correlations were detected in HPV16+IR− OPSCC (online supplemental figure 6A), emphasizing the lack of uniform immune cell organization in these tumors.
Supplemental material

A coordinated and diverse immune infiltrate in HPV16+IR+ patients. (A) Spearman quantitative correlation heatmaps of the 28 sc (18 mutually exclusive and 10 non-mutually exclusive) in the whole tumor in HPV16+IR+ OPSCC (n=11). The empty line separates mutually exclusive sc (above the crossed line) from the non-mutually exclusive sc (below the crossed line). (B) Waterfall plot of statistically significant (p<0.01) Spearman correlations between the 28 sc (defined in online supplemental table 5) in HPV16+IR+ OPSCC (n=11), with bars indicating their corresponding Spearman r coefficient. (C) Linear regression analyses of the mutually exclusive sc with statistically significant (p<0.01) Spearman correlations in HPV16+IR+ OPSCC (n=11), including corresponding R squared values and linear regression p values. HPV, human papillomavirus; IR+, immune responsiveness; OPSCC, oropharyngeal squamous cell carcinoma; sc, superclusters; TME, tumor microenvironment.
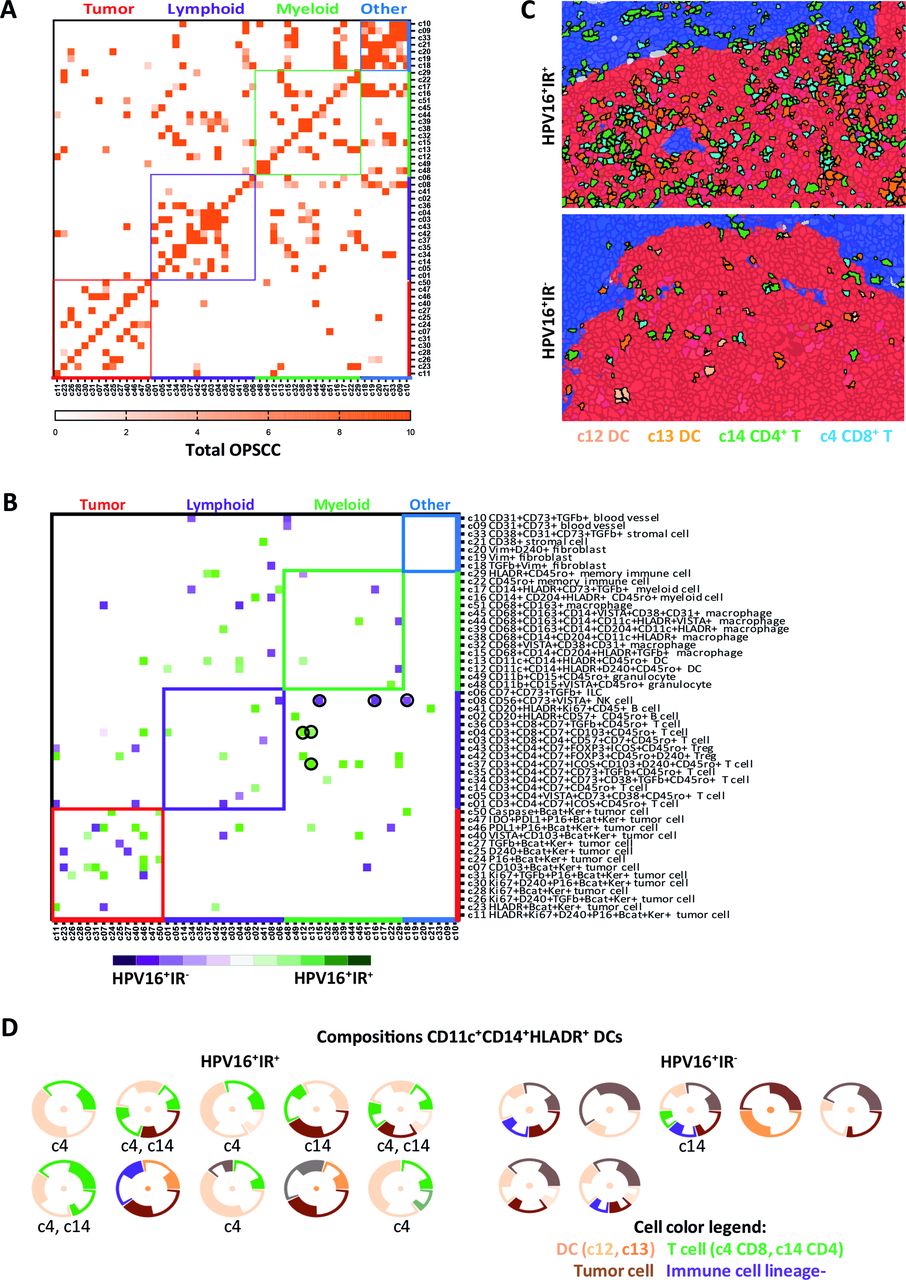
The IMC data enabled us to study which cells are in close vicinity and, therefore, able to interact with each other at the single-cell level. Analysis of the 51 identified cell clusters revealed interactions between immune cells, tumor cells, and other cells (figure 4A). As expected,32 most cells sojourn in the neighborhood of cells from the same cluster (figure 4A). A clear distinct spatial phenotypical signature (SPS) became evident when only the interactions specifically occurring at a frequency that (1) is higher than would be expected by chance, thereby correcting for differences in cell cluster frequencies by using permutation testing and (2) is at least twofold higher in one of the subgroups were visualized (figure 4B). These spatial analyses revealed that, in particular, DCs and D2-40+ (invasive margin) tumor cells were more frequently interacting with both CD8+ T cells (c4) and CD4+ T cells (c14) in HPV16+IR+ OPSCC (figure 4B,C). T cells (c4, c14) and CD14+CD11c+HLA-DR+CD68− DCs (c12 and c13) formed simple immune cell aggregates28 of more than three cells directly neighboring each other, designated as microaggregates, within the tumor cell beds of HPV16+IR+ OPSCC (figure 4C). Of note, these were not tertiary lymphoid-like structures (TLS), of which only one was found in one OPSCC image, and this image was excluded from further analysis as in OPSCC it cannot be differentiated from a normal germinal center. Flow cytometry on the tumor-infiltrating CD14+CD11c+HLA-DR+ cells revealed the coexpression of CD1c, CD32b, CD36, CD141, CD40, and CD86 (online supplemental figure 7).
Supplemental material

Organized intratumoral immune microaggregates specifically in HPV16+IR+ OPSCC. Spatial interaction heatmap of the 51 identified clusters (online supplemental table 5), with interaction neighborhood defined as 5 µm (<1 cell, direct spatial interaction). Cluster name is based on the markers that are expressed by that cluster, indicating that a cluster is negative for all other tested markers. (A) Spatial interaction heatmap of the total OPSCC cohort (n=20), showing all spatial interactions with a permutation-verified Z-score of >2 (ie, outside the 95% normal distribution range), with dark orange indicating highest Z-scores. (B) Heatmap showing the differences in spatial interactions occurring in HPV16+IR+ (n=11) versus HPV16+IR− (n=4) OPSCC. Only spatial interactions with a permutation-verified Z-score of >2, which specifically occurred in only one of the subgroups, and had at least a twofold interaction difference in percentage between the subgroups, are visualized. Spatial interactions occurring more frequently in HPV16+IR+ tumors are indicated in green, and those in HPV16+IR− tumors are indicated in purple. (C) Hyperion images of the TME of OPSCC, showing the direct spatial interactions between CD8+ T cells, CD4+ FoxP3 T cells and dendritic cells with tumor cells in HPV16+IR+ OPSCC, and the absence of these microaggregates in HPV16+IR− OPSCC. Tumor epithelium is visualized in red; tumor stroma is visualized in blue. (D) Spatial interaction compositions of 360° of DCs, for HPV16+IR+ and HPV16+IR− tumors. Visualized is the DC (center), surrounded by other clusters (thin circle segment indicates SD). Below each composition, the involved T-cell cluster numbers are given. Threshold for the 360° compositions: ≥20 occurrences. HPV, human papillomavirus; IR+, immune responsiveness; IR−, lack of immune responsiveness; OPSCC, oropharyngeal squamous cell carcinoma; TME, tumor microenvironment.
In HPV16+IR− OPSCC, lymphocytes were found to interact with immunosuppressive myeloid cells, illustrated by interactions between NK cells (c8) and CD68+CD204+TGF-β+CD14− tumor-associated M2 macrophages (c15) as well as CD14+CD204+ myeloid cells (c16), and interactions between CD4+TGF-β+ T cells (c34) and CD14+HLADR+TGF-β+ myeloid cells (c17), or CD8+CD103+ T cells (c8) with CD68+CD163+ (c51) M2-like macrophages (figure 4B). Notably, PD-L1 expression was not detected on these myeloid cells. The interactions between T cells and myeloid cells varied per patient in accordance with the earlier observed lack in coordination of immune cell infiltration in HPV16+IR− OPSCC. A 360° spatial composition analysis of DCs sustained the notion that these DC, CD8+ T cell, CD4+ T cell, and tumor cell microaggregates are scarce in HPV16+IR− OPSCC (figure 4D). Finally, visualization of the top 10 complete spatial immune compositions with the highest Z-scores indicated dominant interactions with lymphocytes in HPV16+IR+ OPSCC, while the TME in HPV16+IR− OPSCC was dominated by myeloid cell interactions (online supplemental figure 8).
Supplemental material
HPV16+IR+ patients show preferential T-cell expansion in CD8+ T-cell clusters defined by the expression of CCL4
The profound differences in spatial interactions of T cells and myeloid cells observed between HPV16+IR+ and HPV16+IR− OPSCC are likely to bear impact on the function and phenotype of T cells present in these tumors. This was investigated by a combined single-cell transcriptome (scRNAseq) and TCR sequencing analysis on magnetic bead-sorted CD3+ and CD56+ cells from 13 patients (3 HPV−, 4 HPV16+IR−, and 6 HPV16+IR+), yielding data for 14 242 T cells and 2820 NK cells. Unsupervised clustering21 resulted in the detection of 32 T-cell clusters, comprising 12 CD8+, 11 CD4+, 6 FoxP3+ (Treg), and 3 other CD3+CD4−CD8− T-cell (Tother) clusters, as well as six NK-cell clusters (figure 5A). All clusters were found in >1 patient (figure 5B and online supplemental table 6). Analysis of the distribution of these 38 cell clusters among the three OPSCC groups revealed a significant enrichment of clusters CD8_0 and Treg_0 in HPV16+IR+ when compared with HPV16+IR− OPSCC (figure 5C–E and online supplemental figure 9). Top 30 DEGs of all clusters are listed in online supplemental table 7.
Supplemental material
Supplemental material
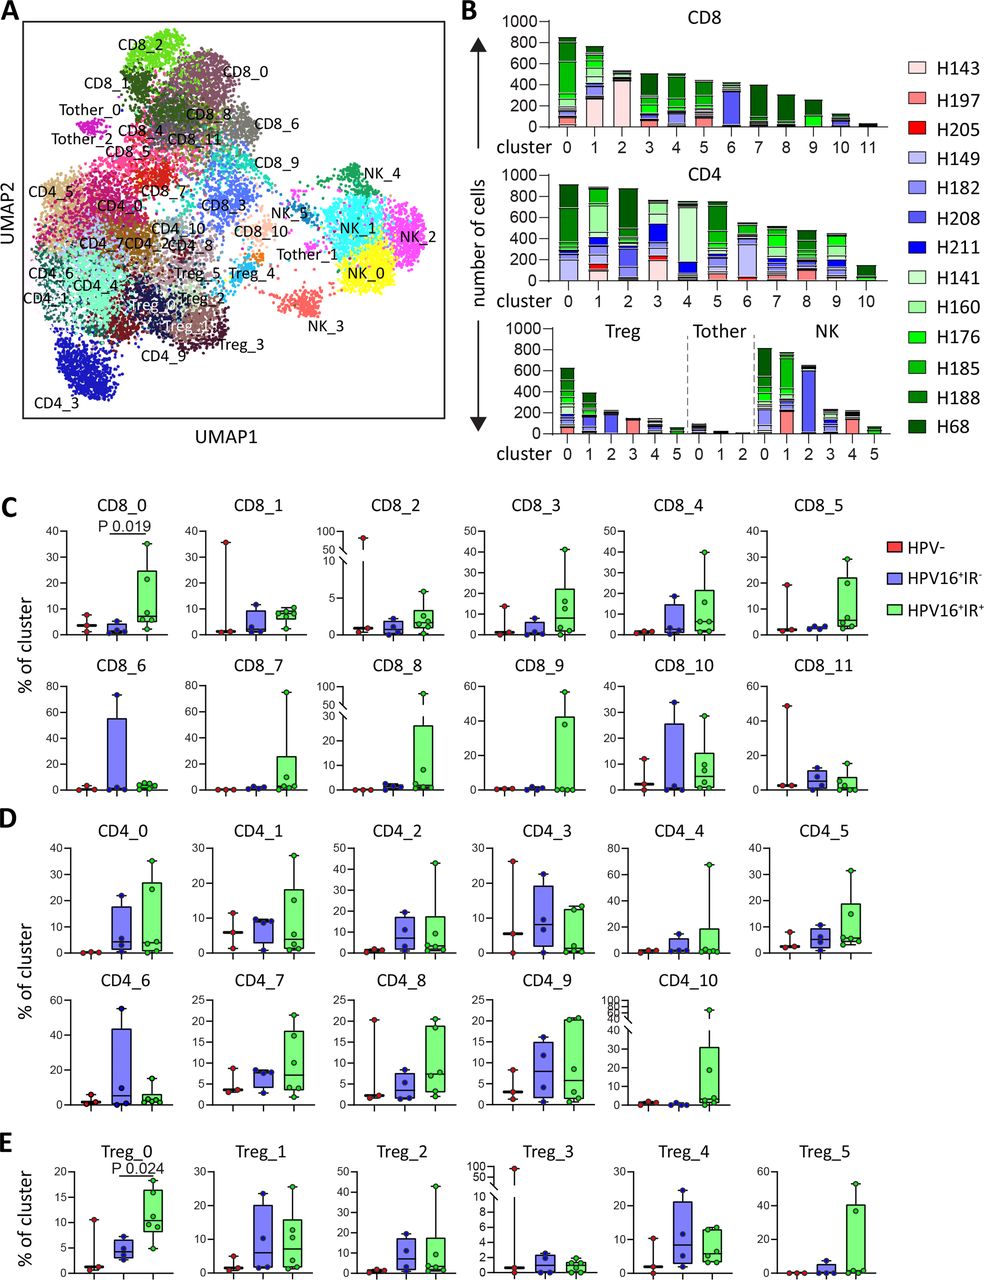
HPV16+IR+ patients show enrichment of clusters CD8_0 and Treg_0. Integrated single-cell transcriptome and TCR repertoire RNA sequencing analysis was performed on magnetic-bead sorted CD3+ T cells and CD56+ NK cells from 13 OPSCC samples. Following quality control and doublet filtering, the 6000 most highly variable genes of 14 242 T cells and 2820 NK cells were selected and unsupervised clustering was performed using the Leiden algorithm.21 (A) A two-dimensional UMAP plot visualizing the 38 identified clusters. (B) Bar graphs depicting the number of cells per patient per cluster for CD8+ (top), CD4+ (middle) T cells and FoxP3+ T cells (Treg), Tother and NK cells (bottom, from left to right). (C, D, E) Box plots depicting the identified CD8 (C), CD4 (D) and Treg (E) clusters, among HPV− (red, n=3), HPV16+IR− (blue, n=4) and HPV16+IR+ (green, n=6) OPSCC tumors. Data are represented as percentage of cluster. HPV, human papillomavirus; IR+, immune responsiveness; IR−, lack of immune responsiveness; NK, natural killer; OPSCC, oropharyngeal squamous cell carcinoma; TCR, T-cell receptor; Treg, regulatory T cell.
As the TCR is responsible for the specificity and intratumoral TCR clonal expansion may reflect tumor reactivity,33 analysis of the TCR repertoire yields valuable information that can be connected to the IR status of the patients. Full-length TCR sequences were obtained for 75.4% of all T cells. In total, 2905 of the 10 734 cells (27.1%) were clonally expanded on the basis that at least two identical TCRs were found, resulting in a total of 690 of the 8519 individual clonotypes (8.1%) being expanded. Clonotype network analysis revealed that clonally expanded TCRs are present in all patients, and clonal expansion was the strongest and more frequent among CD8+ T cells (figure 6A and online supplemental figure 10A). Moreover, the number of cells and clonotypes with expanded TCRs tended to be higher in HPV16+IR+ OPSCC among CD8+ and CD4+ T cells, but not among Treg and Tother cells (figure 6B and online supplemental figure 10B).
Supplemental material

HPV16+IR+ patients show T-cell expansion in clusters particularly defined by the expression of CCL4 or CXCL13. Integrated single-cell transcriptome and TCR repertoire RNA sequencing analysis was performed on magnetic-bead sorted CD3+ T cells and CD56+ NK cells from 13 OPSCC samples. (A) UMAP plot depicting the localization of expanded TCR clonotypes (left) and graph depicting the percentage of expanded TCR clonotypes within CD8, CD4, Treg, and Tother cells (right). (B) Box plots displaying the number of expanded cells (top) and clonotypes (bottom) within all cells (left), CD8 (middle) and CD4 (right) cells detected in HPV− (red, n=3), HPV16+IR− (blue, n=4) and HPV16+IR+ (green, n=6) patients with OPSCC. (C) Dot plots showing the gene expression of selected determining genes in the clusters. (D) Normalized log2 counts for the expression of chemokine receptors in HPV16+IR+ (green, n=7) compared with HPV16+IR− (blue, n=6) OPSCC (Mann-Whitney U test). (E, F) Heatmap presenting specific (E) CXCL13 and (F) CCL4 cytokine production of cultured CD4+ and CD8+ T cell containing TIL in response to HPV16 E6 peptide (pool 1+2 and 3+4)-loaded, HPV16 E7 peptide (pool 1+2)-loaded autologous monocytes for HPV16+IR+ (n=9) and HPV16+IR− (n=5) OPSCC. PHA served as positive control. Three OPSCC TIL cultures containing HPV-specific T cells were analyzed for HPV16-specific cytokine production by intracellular cytokine staining and flow cytometry following stimulation with BLCL loaded with pools of HPV16 E6/E7 synthetic long peptides. Expression of CD3, CD4, CD8, IFN-γ, TNF-α, and CCL4 following overnight stimulation in the presence of brefeldin A. (G) A representative example. The TILs were gated for viable and single cells, and further gated for CD3, CD4, and CD8. The cells producing TNF-α and CCL4 within the CD8+IFN-γ+ (left) and CD4+IFN-γ+ (right) T-cell population are depicted. (H) The percentage of TNF-α and CCL4 within the total IFN-γ-producing CD4+ and CD8+ T cells is depicted for two patients for HPV16 peptide (left) and three patients for PHA (right). BLCL, B-lymphoblastoid cell line; HPV, human papillomavirus; IFN-γ, interferon gamma; IR+, immune responsiveness; IR−, lack of immune responsiveness; NK, natural killer; OPSCC, oropharyngeal squamous cell carcinoma; TCR, T-cell receptor; TIL, tumor-infiltrating lymphocyte; TNF-α, tumor necrosis factor alpha; Treg, regulatory T cell.
To link the preferentially expanded CD8+ and CD4+ T cells in HPV16+IR+ OPSCC to transcriptional profiles, integration of the single-cell transcriptome and TCR repertoire data sets was performed. Strong CD8+ T-cell expansion existed in the majority of patients and clusters, whereas expansion of CD4+ T cells and Tregs was lower or absent in some patients and clusters (online supplemental figure 10C,D). Importantly, the percentage of expanded cluster CD8_0 T cells was clearly higher (p=0.057) in HPV16+IR+ OPSCC than in IR− OPSCC (online supplemental figure 11A–C). The CD8_0 cluster can be defined as a cytokine-producing CD8+ T-cell subset, in which particularly CCL4 was highly expressed. This subset differs substantially from cluster CD8_3, which did not significantly differ between our patient groups and is made up of cells that, based on their DEG profile, resemble highly activated tumor-resident cytotoxic effector T cells (online supplemental table 7 and figure 12). CCL4 was also expressed by NK cells (figure 6C and online supplemental figure 13), but as NK cells were >20 fold less abundant than T cells in these tumors (online supplemental figure 3B), their contribution is much lower. The production of CCL4 prompted us to re-examine the expression of chemokine receptors in the NanoString data. This revealed that the expression of CCR5 (CCL4’s receptor), CCR2 (CCL2’s receptor), CXCR3 (CXCL9, 10, and 11’s receptor), and CXCR6 (CXCL16’s receptor), but not CXCR2, CXCR4 and CX3CR1, or CCR4, was increased in HPV16+IR+ tumors compared with HPV16+IR− tumors (figure 6D). Of note, none of the T-cell and NK-cell clusters showed expression of CXCL12, whereas LTB was expressed by the majority of the CD4+ T-cell clusters (figure 6C and online supplemental figure 13). Extensive characterization of all the T-cell and NK-cell clusters in terms of tissue residency, costimulatory, and coinhibitory genes is provided in online supplemental figure 12, showing that in contrast to cluster CD8_3, cluster CD8_0 has an overall low expression of immune checkpoints.
Supplemental material
Supplemental material
Supplemental material
To confirm that CCL4 was predominantly produced by T cells in HPV16+IR+ OPSCC, the supernatants of TIL cultures from HPV16+ OPSCC were analyzed for the production of CCL4 and as control CXCL13, as it is expressed by cluster CD8_3 T cells, which did not differ between the patient groups. While a similar production of CXCL13 was found in the PHA-stimulated cultures of IR+ and IR− patients, CCL4 production was almost exclusively found in HPV16+IR+ OPSCC, with all nine cultures showing substantial production of CCL4 when stimulated with tumor antigen or PHA (figure 6E,F, and online supplemental figure 14). Subsequent flow cytometric analysis showed that all IFN-γ-producing CD8+ T cells coproduced CCL4, whereas half of the IFN-γ-producing CD4+ T-cell population produced CCL4 when stimulated with cognate antigen or PHA (figure 6G,H).
Supplemental material
CCL4 expression is related to T-cell and DC tumor infiltration as well as survival in HPV16+ OPSCC TCGA patients
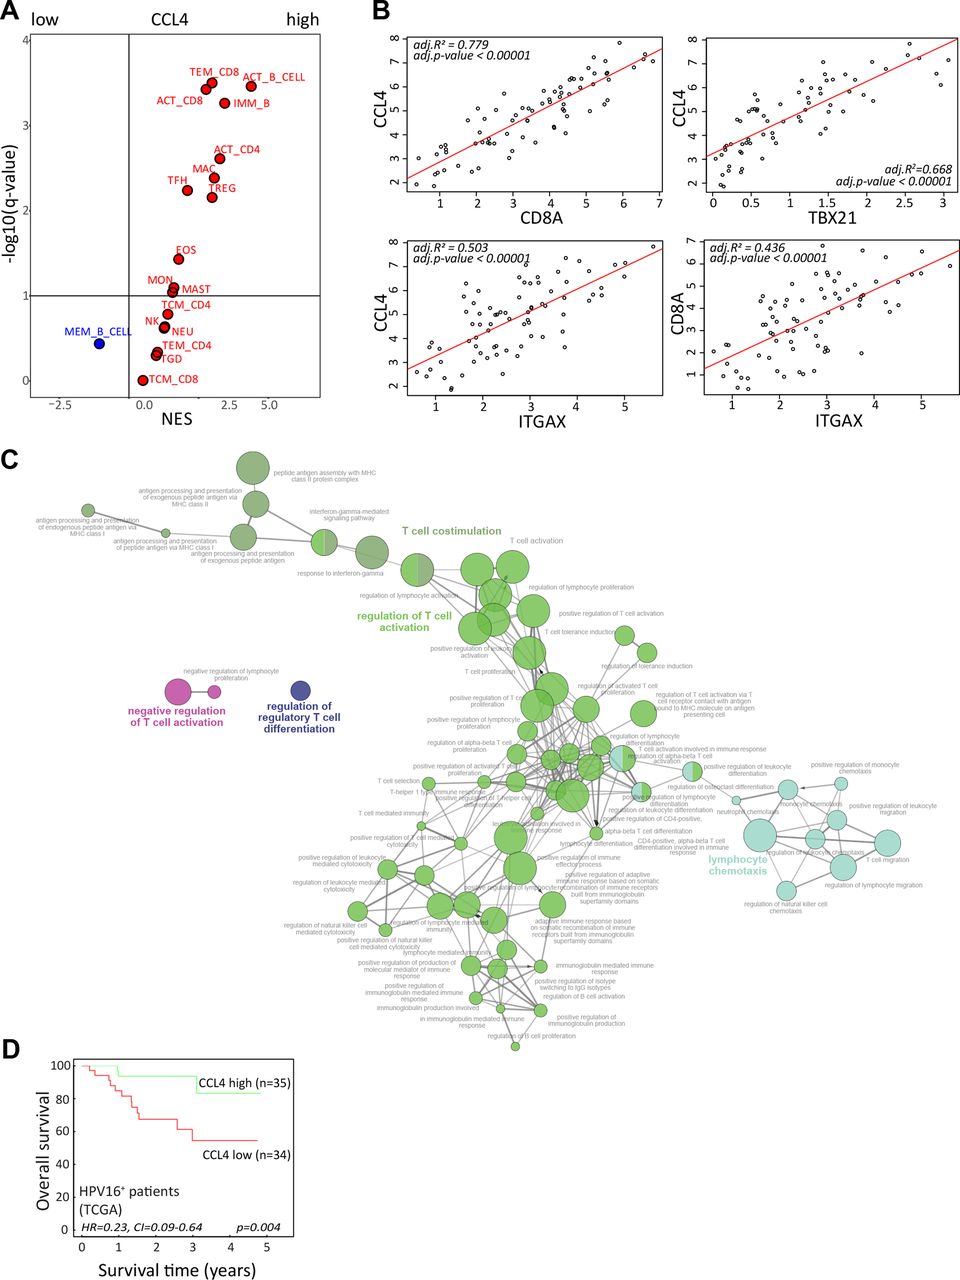
Our T-cell data indicated a role for CCL4 in a productive TIME; hence, a gene set enrichment analysis of the TCGA RNA-sequencing data from the 69 patients with HPV16+ OPSCC11 was performed. Our previously published immunogenomic analytical strategy to estimate subpopulations of tumor-infiltrating immune cells34 was applied to determine which immune cells were relatively enriched or depleted in HPV16+ OPSCC with high versus low CCL4 gene expression (figure 7A). These analyses confirmed a positive relationship between CCL4 with a larger fraction of activated and effector memory CD8+ T cells and activated CD4+ T cells as well as with B cells, T follicular helper cells, Tregs, macrophages, and eosinophils suggestive for a more effective antitumor inflammatory response. This notion was supported by a strong correlation between the expression of CCL4, CD8+ T cells (CD8A), CD4+ T cells (CD4), Tbet+ T cells (TBX21), and CD11c+ myeloid cells (ITGAX) (figure 7B) consistent with recent literature suggesting that CCL4 functions as a long-range homotypical signaling molecule to attract more T cells and cross-presenting DCs into the TME.35 36
CCL4 associates with stronger antitumor immunity and improved survival. (A) To identify immune cell types that are over-represented in HPV16-positive OPSCC with strong expression of CCL4, a gene set enrichment analysis was performed on a cohort of 69 patients with HPV16+ OPSCC present in the publicly available TCGA database. An average gene expression of each gene was calculated for a high and low group. The log2-fold change of expression level between groups was used as input for the GSEA pre-ranked analysis. The association was represented by a NES. An immune cell type was considered enriched when the FDR (q-value) was <10%. The Volcano plot for the enrichment (red) and depletion (blue) of immune cell types in CCL4-high versus CCL4-low HPV16+ OPSCC is shown. (B) The Pearson correlation between the expression of CCL4 with CD8A (for CD8 T cells), TBX21 (for Tbet+ T cells), and ITGAX (CD11c for DCs) as well as CD8A and ITGAX in the tumors of the 69 patients with HPV16+ OPSCC in the TCGA database. (C) The correlation between CCL4 with a subset of genes representing immune related functions selected based on correlation analysis (Pearson correlation coefficient (R) >0.6, adjusted p<0.05) were used for gene ontology analysis of immune enrichment processes using ClueGO.29 (D) Kaplan-Meier survival plots of the 69 patients with HPV16+ OPSCC in the TCGA database grouped according to high and low gene expression using the median value of CCL4 as cut-off. HPV, human papillomavirus; NES, normalized enrichment score; OPSCC, oropharyngeal squamous cell carcinoma; TCGA, The Cancer Genome Atlas.
To gain more information on the immune enrichment processes associated with high expression of CCL4 in the TME, ClueGO analyses29 were performed. This showed that especially CCL4 was positively associated with T-cell costimulation, activation, and proliferation, as well as lymphocyte chemotaxis and IFN-γ responses (figure 7C, online supplemental figure 15). Finally, the expression of CCL4 was associated with superior disease control in patients with HPV16+ OPSCC (figure 7D), indicating the significance of the immune response associated with this cytokine.
Supplemental material
Discussion
This multimodal high-dimensional study of the TIME in OPSCC revealed a distinct spatial phenotypical signature in the immune landscape of HPV16+IR+ and that of HPV16+IR− OPSCC. Immune cell infiltration in HPV16+IR+ tumors is highly coordinated resulting in characteristic CD8+(CD103+) T cells, CD4+ T cells, and DC microaggregates within the tumor cell beds, a perfect place for DCs to ingest tumor antigens and stimulate tumor-specific T cells. In this study, T cell–DC interactions are associated with longer OS, but they have also been reported to be required for successful anti-PD1 therapy.37 These microaggregates are most likely organized under the influence of the chemokines LTB and CXCL1228 38 and sustained by CCL4, known to attract T cells and cross-presenting DCs.35 36 39 Indeed an increased expression of CCL4’s receptor CCR5 was detected in HPV16+IR+ tumors compared with HPV16+IR− tumors. Previously, it was shown that the production of CCL4 by tumor cells was key to attract DCs and to start tumor immunity.9 36 Here we show that CCL4 can also be produced by tumor-specific T cells and lead to a productive TIME. While CCL4 is capable of attracting both tumor supporting (regulatory T cells, M2 macrophages, and myeloid-derived suppressor cells (MDSC) and tumor-rejecting (cytotoxic T cells, M1 macrophages) immune cells, depending on the context in which it is produced,40 we did not observe differences in counts of Tregs and macrophages, suggesting that in the HPV+IR+ context, the chemotaxis of tumor-rejecting immune cells by CCL4 prevails.
The formation of organized aggregates by tissue-infiltrating leukocytes occurs often during inflammation, and such regions may exist as the simple aggregates found here inside the tumor cell bed, or as more sophisticated structures in the tumor stroma that resemble tertiary lymphoid structures (excluded in our imaging analyses) and are known to stimulate adaptive immunity.28 Of the chemokines, LTB was produced by multiple CD4+ T-cell clusters, indicating that the sheer presence of more activated CD4+ T cells was responsible for its overexpression in HPV16+IR+ tumors. CCL4 was expressed specifically by clonally expanded, most likely tumor-reactive,33 CD8+ T cells that were found more frequently in HPV16+IR+ tumors. It was also produced by tumor-specific T cells cultured from these tumors. High intratumoral T-cell clonality has previously been positively linked to clinical outcome in patients with melanoma treated with ICI.8 The detection of more clonally expanded T cells in HPV16+IR+ tumors is suggestive of the accumulation of intratumoral tumor-specific T cells, fitting well with the detection of type 1 CD4+ and CD8+ HPV-specific T cells among the TILs in these IR+ OPSCCs.2 Our current study suggests that through the production of the chemokines LTB and CCL4, these two types of tumor-specific T cells act as a positive feedback loop for the spatial organization of DC–T cell aggregates, necessary to maintain effective tumor immunity. The discovery of these intratumoral immune microaggregates is of particular importance as a potential biomarker in OPSCC, as in this tumor type TLS are not of diagnostic value since they cannot be differentiated from normal lymphoid tissue in which the tumor arises.
In addition to the significant enrichment of CCL4-expressing expanded CD8_0 T cells in HPV16+IR+ OPSCC tumors, also the clonally expanded clusters CD8_5 and CD4_5 tended to be higher in HPV16+IR+ OPSCC tumors. Cluster CD8_5 is characterized by the expression of XCL1, known for its capacity to attract cross-presenting DCs into the TME,39 and the clonally expanded CD4+ T-cell cluster is characterized by the expression of LMNA (lamin A), which is upregulated early after T-cell activation to accelerate the formation of the immunological synapse with APCs41 and critical for their Th1 differentiation.42 However, these two clusters also displayed an increased expression of several heat shock protein and stress pathway-related genes. As the expression of such genes may be related to cryopreservation, thawing, and dissociation procedures,43 the interpretation of data for these clusters should be done with caution.
The DCs in these microaggregates were defined by their expression of CD11c, CD14, and HLA-DR but not CD68, and coexpressed CD1c, CD32b, CD36, and CD141. The presence of such inflammatory antigen presenting cells (APCs) has been linked to acute inflammatory processes,44 45 to the survival of patients with HPV-induced cervical cancer,46 and to immunotherapy responsiveness in HPV-induced premalignant lesions,47 48 while the incapacity to attract these cells constituted a secondary escape mechanism to immunotherapy in a mouse model.49 Our current findings, showing that these cells are found in higher numbers and organized in immune microaggregates when a tumor-specific T-cell response is present, sustain the notion that these cells are of major importance in tumor immunity. Currently, patients with OPSCC are treated by surgery and/or chemoradiation, a therapy associated with high comorbidity and loss in quality of life. The well-organized TIME in HPV16+IR+ OPSCC is likely to promote the response to immunotherapy.50 51 Notably, the current group of patients treated with ICI after failing standard of care therapy most likely are those that failed to mount a HPV-specific T-cell response (HPV16+IR− group) as they will rapidly present with progressive disease.2 Hence, they will not display the distinct SPS of HPV16+IR+ patients that may make them responsive to ICI. The SPS of HPV16+IR+ OPSCC could be exploited for the identification and selection of this particular patient group, potentially by CD8 and CD11c dual immunohistochemistry, for neoadjuvant ICI.37 Alternatively, the mRNA expression profile of IR+ OPSCC could be developed into a suitable selection tool to this purpose.
IMC showed that the TME in HPV16+IR− tumors comprises a relatively higher number of fibroblasts and blood vessels than HPV16+IR+ OPSCC. Although HPV16+IR− OPSCCs are infiltrated with T cells, although it less than those in HPV16+IR+ OPSCC, the SPS in these lukewarm tumors was different and comprised spatial interactions between lymphocytes and different subpopulations of immunosuppressive myeloid cells, including CD163+ macrophages, CD204+, macrophages, as well as TGF-β+ myeloid cells. This varied per patient, consistent with the lack of coordination of immune cell infiltration in this patient group. Increased expression of the TGF-β superfamily members INHBA and BMP226 was also found in our transcriptomic analyses. The presence of these immune suppressive cells52–54 and the increased expression of the immune suppressive cytokine IL-11, known to suppress the attraction and functionality of tumor-reactive CD4+ T cells,27 potentially explain why tumor-specific T cells were not detected in these tumors. It also provides a rational foundation for combinations of T cell-stimulating agents6 55 56 with strategies focusing on the identified resistance mechanisms, for example, cotargeting M2-like macrophages,57 TGF-β,58 and/or angiogenesis.59
In conclusion, the blueprint of a productive TIME comprises the local production of chemokines that not only attract tumor-reactive CD4+ and CD8+ T cells as well as DCs, but also organize them into small aggregates within the tumor cell beds where most likely the DCs gobble up antigens from dying tumor cells and stimulate the T cells to exercise their effector function and to amplify the immune response.
Code availability
All code and software used for the analyses in this study are made publicly available on the community repositories described in this article.
Supplemental material
Supplemental material
Data availability statement
Data are available in a public, open access repository. Data are available upon reasonable request. All data relevant to the study are included in the article or uploaded as supplementary information.
Ethics statements
Patient consent for publication
Ethics approval
This study involves human participants and was approved by the local medical ethical committee of the Leiden University Medical Center (reference number P07-112) and in agreement with Dutch law. Participants gave informed consent to participate in the study before taking part.
Acknowledgments
The authors thanks Danielle Cohen, head and neck cancer specialized pathologist at Leiden University Medical Center, for annotating tumor regions on the oropharyngeal squamous cell carcinoma (OPSCC) H&E slides used in this study; and Renske Goedemans, Ilina Ehsan and Vanessa van Ham for handling, culturing and testing OPSCC tumor-infiltrating lymphocyte cultures.
References
Supplementary materials
Supplementary Data
This web only file has been produced by the BMJ Publishing Group from an electronic file supplied by the author(s) and has not been edited for content.
- Data supplement 1
- Data supplement 2
- Data supplement 3
- Data supplement 4
- Data supplement 5
- Data supplement 6
- Data supplement 7
- Data supplement 8
- Data supplement 9
- Data supplement 10
- Data supplement 11
- Data supplement 12
- Data supplement 13
- Data supplement 14
- Data supplement 15
- Data supplement 16
- Data supplement 17
- Data supplement 18
Footnotes
Twitter @grsturm
MJPW and NFCCdM contributed equally.
Contributors Conceptualization: ZA, SJS, MJPW, NFCCdM, and SHvdB. Software: AS and TH. Formal analysis: ZA, SJS, GS, PC, MEI, FF, DAMM, and MJPW. Resources: SLvE. Supervision: NFCCdM, ZT, and SHvdB. Funding acquisition: ZA, SHvdB, SJS, MJPW, NFFCdM, FF, and ZT. Writing of the original draft: ZA, SJS, MJPW, and SHvdB. Writing review and editing: ZA, SJS, GS, PC, MEI, FF, AS, TH, DAMM, SLvE, MJPW, NFCCdM, ZT, and SHvdB. SHvdB accepts full responsibility for the finished work and/or the conduct of the study, had access to the data, and controlled the decision to publish by acting as guarantor.
Funding ZA received an MD/PhD grant from Leiden University Medical Center. SHvdB received base funding from the Oncode Institute. NdM received funding from the European Research Council under the European Union’s Horizon 2020 research and innovation program (grant agreement number 852832). FF was supported by the Austrian Science Fund (FWF) (project number T 974-B30). ZT was supported by the European Research Council (grant agreement number 786295), by the FWF (projects I3291 and I3978) and by the Horizon 2020 IMI project imSAVAR (grant agreement number 853988), and is a member of the German Research Foundation (project TRR 241(INF)). MJWP received an installation grant from NanoString for using the IO360 panel.
Competing interests None declared.
Provenance and peer review Not commissioned; externally peer reviewed.
Supplemental material This content has been supplied by the author(s). It has not been vetted by BMJ Publishing Group Limited (BMJ) and may not have been peer-reviewed. Any opinions or recommendations discussed are solely those of the author(s) and are not endorsed by BMJ. BMJ disclaims all liability and responsibility arising from any reliance placed on the content. Where the content includes any translated material, BMJ does not warrant the accuracy and reliability of the translations (including but not limited to local regulations, clinical guidelines, terminology, drug names and drug dosages), and is not responsible for any error and/or omissions arising from translation and adaptation or otherwise.