Article Text

Abstract
Background Oncogenes act in a cell-intrinsic way to promote tumorigenesis. Whether oncogenes also have a cell-extrinsic effect on suppressing the immune response to cancer is less well understood.
Methods We use an in vivo expression screen of known cancer-associated somatic mutations in mouse syngeneic tumor models treated with checkpoint blockade to identify oncogenes that promote immune evasion. We then validated candidates from this screen in vivo and analyzed the tumor immune microenvironment of tumors expressing mutant protein to identify mechanisms of immune evasion.
Results We found that expression of a catalytically active mutation in phospho-inositol 3 kinase (PI3K), PIK3CA c.3140A>G (H1047R) confers a selective growth advantage to tumors treated with immunotherapy that is reversed by pharmacological PI3K inhibition. PIK3CA H1047R-expression in tumors decreased the number of CD8+ T cells but increased the number of inhibitory myeloid cells following immunotherapy. Inhibition of myeloid infiltration by pharmacological or genetic modulation of Ccl2 in PIK3CA H1047R tumors restored sensitivity to programmed cell death protein 1 (PD-1) checkpoint blockade.
Conclusions PI3K activation enables tumor immune evasion by promoting an inhibitory myeloid microenvironment. Activating mutations in PI3K may be useful as a biomarker of poor response to immunotherapy. Our data suggest that some oncogenes promote tumorigenesis by enabling tumor cells to avoid clearance by the immune system. Identification of those mechanisms can advance rational combination strategies to increase the efficacy of immunotherapy.
- immunotherapy
- biomarkers
- tumor
- immune evation
Data availability statement
Data are available on reasonable request. All data relevant to the study are included in the article or uploaded as supplementary information. All data relevant to the study are included in the article or as online supplemental information. Any further information about resources and reagents should be directly requested to the corresponding author and will be fulfilled on reasonable request.
This is an open access article distributed in accordance with the Creative Commons Attribution Non Commercial (CC BY-NC 4.0) license, which permits others to distribute, remix, adapt, build upon this work non-commercially, and license their derivative works on different terms, provided the original work is properly cited, appropriate credit is given, any changes made indicated, and the use is non-commercial. See http://creativecommons.org/licenses/by-nc/4.0/.
Statistics from Altmetric.com
Background
Oncogenes act in a cell-intrinsic manner to control proliferation, differentiation, and survival. The success of immunotherapy clinically suggests the immune response to tumors can act to constrain tumor growth, however most patients do not benefit, and current biomarkers are imperfect predictors of those that are likely to respond to therapy. Mechanisms of resistance to immunotherapy have been described including loss of interferon sensing and antigen presentation, but the role of oncogenes in immune evasion is less well understood.1–4
Phospho-inositol 3 kinase (PI3K) has a well described role in supporting growth and metabolism of tumors, however monotherapy with PI3K inhibitors has been largely disappointing for a number of reasons including inherent and acquired mechanisms of resistance.5–7 Further underlying the importance of PI3K in cancer, gain-of-function mutations in PIK3CA, the gene encoding the alpha isoform of the catalytic subunit of PI3K, are commonly identified in cancer and may portend a worse prognosis.8–11
Myeloid-derived suppressor cells (MDSCs) are a diverse and heterogeneous immune cell population described in many preclinical models and in human cancer.12 The degree of MDSC infiltration has been negatively correlated with outcome in human cancer and has been implicated in chemotherapy and immunotherapy resistance.13–16 MDSCs are traditionally divided into two groups, those functionally and phenotypically similar to neutrophils (PMN-MDSC) and those similar to monocytes (M-MDSC). Functionally, these cells rely on differential expression of immune inhibitory enzymes including arginase-1 (Arg1) and inducible nitric oxide synthase (iNOS).17 Diversity of MDSCs within these broad subtypes is complicated and poorly understood, and little is known about tumor-lineage-dependent recruitment and function.12 18
We performed an in vivo screen of a library of known cancer-associated somatic mutations to discover oncogenes that act in a cell-extrinsic manner to inhibit the immune response to tumors.19 We describe a new role for PI3K signaling in modulating the tumor immune microenvironment by recruitment of a monocytic lineage of MDSCs.
Methods
Cell lines
MC38 colon carcinoma cell line was a gift from A. Sharpe. MC38 was grown in Dulbecco’s Modified Eagle Medium (DMEM) (Gibco) with 10% fetal bovine serum (FBS, Gemini Biosciences) and antibiotics. Cell lines were subject to periodic testing for mycoplasma using the LookOut Mycoplasma PCR Detection Kit (Sigma). Lentiviral transduction was used for PIK3CA H1047R or irrelevant control protein (CD19) open reading frame (ORF) expression in pLEX_307 or pLEX_311 (Addgene) under control of elongation factor 1-alpha (EF1α) promoter. Tumor cell lines were sequenced to verify presence of intended ORF. LY294002 (Cell Signaling) was reconstituted in dimethyl sulfoxide and added to cell culture media at 50 μM concentration for 24 hours prior to analysis.
Animal treatment and tumor challenges
Dana-Farber Cancer Institute’s specific pathogen-free facility was used for the housing and care of all mice. Wild-type female C57BL/6J mice aged 6 weeks were obtained from Jackson laboratories. A colony of B6.129S2-Tcra tm1Mom/J (Tcra−/−) T cell-deficient mice were bred on site. Mice were age-matched to be 7–12 weeks old at the time of tumor inoculation 1.0×10⁶ MC38 were resuspended in 100 µL Hanks Balanced Salt Solution (Gibco) and subcutaneously injected into the right flank on day 0. Tumors were measured every 3 days beginning on day 6 after challenge until time of death. Death was defined as the point at which a progressively growing tumor reached 2.0 cm in the longest dimension. Measurements were taken manually by collecting the longest dimension (length) and the longest perpendicular dimension (width). Tumor volume was estimated using the volume of an ellipsoid. CO2 inhalation was used to euthanize mice on the day of euthanasia. Optimal group sizes were determined empirically. Researchers were not blinded to group identity and randomization of animal groups was done when appropriate. Antiprogrammed cell death protein 1 (anti-PD-1) treatment was with 100 μg of rat monoclonal anti-PD-1 (clone: 29F.1A12, gift of Dr G. Freeman, BioXCell) or isotype rat IgG2a (BioXCell) on days indicated via intraperitoneal injection. BAY 80-6946 (MedChem Express) was prepared as described and 1 mg/kg/dose was administered on days indicated via intraperitoneal injection.20 BMS687681 was a gift from Bristol Meyers Squibb, prepared in PEG300 (Rigaku), and administered 50 μg in 200 μL volume orally two times per day by oral gavage.
Tumor leukocyte isolation
On the indicated days postchallenge, tumors were dissected from the surrounding fascia, mechanically minced, and treated with collagenase P (2 mg/mL, Sigma) and DNAse I (50 µg/mL, Sigma) for 10 min at 37°C. When indicated, cells were sorted on a FACS Aria II (BD Biosciences) to obtain >95% purity.
In vivo ORF screen
Library composition, multiplexed in vivo screen, tumor harvest, and PCR amplification for barcode demultiplexing was performed as previously described with the following modifications19: 2500 MC38 cells were plated in a 96-well plate and 10 µL of arrayed viral supernatant was used for infection. Arrayed infections were pooled into five subpools, with composition ranging from one plate (89 ORFs, subpool A) to five plates (445 ORFs, subpool E). Subpools B–D were derived from two arrayed plates (178 ORFs); 1×10⁶ MC38 cells (at least 2000X coverage) were injected subcutaneously into the right flank of the indicated animals. Five mice were injected per group of wild-type mice, immunodeficient mice, and wild-type mice treated with anti-PD-1 (see above Animal treatment and tumor challenges section for treatment regimen). Immunodeficient animals for subpools B, D, and E were TCRα−/− animals and for subpool A and C were animals depleted of CD8+ T cells using antibody depletion as previously described with antimouse CD8a clone 2.43 (BioXCell).21 Subpools were also grown in vitro for the duration of tumor growth.
Single-cell RNA-sequencing library preparation and analysis
Untreated PIK3CA H1047R and control MC38 cells were implanted subcutaneously in the abdomens of C57BL/6 mice. On day 15, tumors were dissected from the surrounding fascia, mechanically minced, and treated with collagenase P (2 mg/mL, Sigma) and DNAse I (50 µg/mL, Sigma) for 10 min at 37°C. Groups were of five mice. If tumors were intraperitoneal or ulcerated, they were not used. Three tumors were processed in each group, and two were ultimately sequenced. Tumor-infiltrating leukocytes were enriched by centrifugation. In brief, single-cell tumor lysates were centrifuged at 50 g×5 min to pellet down tumor cells. Supernatants were saved, and another spin was performed 50 g×5 min. The supernatants from both spins were pooled. Leukocytes were further enriched by CD45+ MACS-positive selection (Miltenyi Biotec). Cells were counted, mixed at a 4:1 ratio with human peripheral blood leukocytes (to assess for doublet formation), and 20,000 total cells loaded onto the SeqWell device. Samples were processed per the published protocol22 and sequenced on an Illumina NextSeq500 sequencer using a 75 bp kit with paired-end reads. Sample demultiplexing, barcode processing, alignment, filtering, and unique molecular identifier (UMI) counting were performed using Picard V.1.138 and Star V.2.4.0 as per the DropSeq analysis pipeline.23 Downstream analyses were performed in R using the Seurat package (V.2.1.0).24
For each cell, two quality control metrics were calculated: (1) the total number of genes detected and (2) the proportion of UMIs contributed by mitochondrially encoded transcripts. Cells in which fewer than 200 genes were detected and in which mitochondrially encoded transcripts constituted >10% of the total library were excluded from downstream analysis. Genes detected in fewer than three cells across the dataset were also excluded, yielding an expression matrix of 1660 cells by 12,776 genes. Each gene expression measurement was normalized by total expression within the corresponding cell and multiplied by a scaling factor of 10,000. Mean and dispersion values were calculated for each gene across all cells: 2161 genes classified as highly variable. Highly variable genes were used for principal components analysis. Principal components (PCs) were determined to be significant (p<0.01) using the jackstraw method and t-distributed stochastic neighbor embedding (tSNE) was performed on these significant PCs using default parameters for 1000 iterations for visualization in two dimensions. Unsupervised clustering was performed using a shared nearest neighbor modularity optimization-based algorithm.25 Differential expression analysis was performed between each cluster and all other cells using a Wilcoxon rank-sum test.
Flow cytometry
Cells were blocked with α-mouse CD16/32 antibody (BioLegend) and surface stained with the indicated antibodies for 30 min at 4°C. Dead cells were excluded using Live/Dead (1:1000, ThermoFisher Scientific) added concurrently with surface antibodies. Spherotech AccuCount Fluorescent particles were added for cell quantification before analysis on an LSR Fortessa (BD Biosciences). Analysis was performed using FlowJo software (TreeStar) using single-color compensation controls and fluorescence-minus-one thresholds to set gate margins. Cell counts were determined by normalizing cell numbers to beads recorded, divided by the amount of tumor aliquot taken and the mass of the tumor. Gating strategy for immune subtype analysis has been previously described.1 Antibodies included: αCD45 (Clone 30-F11, BioLegend), αCD11b (M1/70, BioLegend), αF4/80 (BM8, BioLegend), αCD192(Ccr2) (SA203G11, BioLegend), αCD4 (GK1.5, BioLegend), αCD8a (53–6.7, BioLegend), αTCR γ/δ (GL3, BioLegend), αNK1.1 (PK136, BioLegend), αCD3 (17A2, BioLegend), αLy-6C (HK1.4, BioLegend).
Myeloid suppression assay
Generation of bone marrow-derived granulocyte-macrophage colony-stimulating factor (GM-CSF)-stimulated dendritic cells and suppression assay were adapted from T regulatory suppression assay previously described,26 with antimouse CD3ε (BD Biosciences) and murine GM-CSF (Peprotech). CD8a+ T cells from mouse spleen were isolated by negative MACS selection per manufacturer’s instructions (Milltenyi Biotec) and labeled with CellTrace Violet (ThermoFisher Scientific) prior to coculture. CD8+ T cell proliferation was measured after 72 hours of coculture.
Cytokine quantification/Luminex
Cytokine quantification was performed on tumor supernatants after collagenase and DNAse digestion with digestion volume normalized to tumor weight. Peripheral blood cytokines were measured from serum obtained at time of animal sacrifice (tumor day 15). Cytokine quantification was by multiplex (50) microsphere analysis according to manufacturer’s instructions (Luminex).
Immunoblot
Whole cell lysates were prepared in lysis buffer: 60 mM Tris HCl, 2% sodium dodecyl sulfate (SDS), 10% glycerol, complete EDTA-free protease-inhibitor (Roche), 500 U/mL benzonase nuclease (Novagen), Phosphatase Inhibitor Cocktail I (Sigma) and Phosphatase Inhibitor Cocktail III (Sigma). Samples were boiled at 100°C and clarified by centrifugation. Protein concentration was measured with a bicinchoninic acid (BCA) protein assay kit (Pierce); 50–150 µg of protein was loaded on 4%–12% Bolt Bis-Tris Plus gels (Life Technologies) in MES buffer (Life Technologies). Protein was transferred to 0.45 µm nitrocellulose membranes (Bio-Rad). Membranes were blocked in Tris-buffered saline plus 0.1% Tween 20 (TBS-T) containing 5% non-fat dry milk for 1 hour at room temperature followed by overnight incubation with primary antibody at 4°C. Membranes were washed with TBS-T and incubated with horseradish peroxidase (HRP)-conjugated secondary antibodies for 1 hour at room temperature. HRP was activated with Supersignal West Dura Extended Duration Substrate (Pierce) and visualized with a chemiluminescent detection system using Fuji ImageQuant LAS4000 (GE Healthcare Life Sciences). Blots were then analyzed using ImageJ and Adobe Photoshop software.
RNA-sequencing analysis of tumor cells
RNA was extracted from PIK3CA H1047R-expressing or control ORF-expressing infected MC38 cells grown in vitro using the Qiagen RNeasy Mini Kit according to the manufacturer’s instructions. First-strand Illumina-barcoded libraries were generated using the NEB RNA Ultra Directional Kit according to the manufacturer’s instructions, including a 12-cycle PCR enrichment. Libraries were sequenced on an Illumina NextSeq 500 instrument using paired-end 37 bp reads. Data were trimmed for quality using the trimmomatic pipeline with the following parameters: LEADING:15 TRAILING:15 SLIDINGWINDOW:4:15 MINLEN:16. Data were aligned to mouse reference genome mm10 using Bowtie2. HTSeq was used to map aligned reads to genes and to generate a gene count matrix. Normalized counts and differential expression analysis was performed using the DESeq2 R package.
Statistical analysis
Significance of pathway enrichment within screen results was determined using a Kolmogorov-Smirnov test. Statistical analysis of differential gene expression was done using DESeq2. All mouse experiments were randomized without investigator blinding, and sample sizes of 5–10 animals per experiment were used, and data shown are reflective of at least two independent repetitions. Paired t-tests were run on comparisons within experimental animals, and all other experimental data were analyzed using unpaired, two-tailed Student’s t-tests in Graphpad Prism 7. Rout outlier tests were run with default parameters in Prism on all mouse experimental data. Correlation of PIK3CA and CCR2 mRNA levels was performed using Spearman’s correlation of mRNA levels from RNA-sequencing (RNA-seq) data across The Cancer Genome Atlas (TCGA) cancer types calculated by Tumor Immune Estimation Resource (TIMER) and adjusted for tumor purity.27 Coefficient of determination (R2) was calculated from linear regression of HALLMARK/PI3K/AKT/MTOR signaling score calculated by single sample gene set enrichment analysis and immune infiltrate score by CIBERSORT from RNA-seq data from TCGA.28 29 P values and q values <0.05 were considered to indicate a significant difference.
Immunohistochemistry
Immunohistochemical staining was performed on formalin-fixed tumors at the Dana-Farber/Harvard Cancer Center Specialized Histopathology Core using a Leica Bond automated staining platform with anti-CD8 (eBio, clone 14-0808; 1:100 dilution) antibody. Slides were visualized using Aperio software. CD8+ cells were enumerated in five separate areas from three tumors per group at 20× magnification in a blinded fashion by HWP for each slide.
Enzyme-linked immunosorbent assay
Cells were plated at 25,000/well in a 96-well flat-bottomed plate with 200 μL of DMEM+10% media. Each sample had three biological replicates. Supernatant was collected after 24 hours and tested using a mouse Ccl2 Quantikine ELISA Kit (R&D Systems). To ensure recorded values fell on the standard curve, supernatant was plated at full concentration, 1:10, 1:100 and 1:1000, diluted in calibrator diluent per the kit protocol. A standard curve was generated and used to analyze each sample. Displayed data use the least diluted biological replicates to calculate pg/mL of mouse Ccl2 detected after 24 hours.
Quantitative PCR
A total cell number of 1×10⁶ cells were harvested, spun down, and RNA was isolated using an RNeasy Mini Kit (Qiagen) with an on-column DNase digestion. Complementary DNA was produced through reverse transcription (RT). Ccl2 transcript levels were measured using TaqMan RT-PCR master mix and primers, compared with internal beta-actin control primers (ThermoFisher Scientific) and run on a ViiA 7 PCR Machine (ThermoFisher Scientific) using a 384-well plate.
Results
PI3K signaling is a mechanism of resistance to PD-1 blockade
To identify somatic cancer-associated mutations that confer resistance to immunotherapy, we used the PD-1-sensitive transplantable tumor model, MC38. Treatment with antibodies targeting PD-1 resulted in tumor regression in wild-type but not T cell receptor-alpha (TCRα) mutant mice (figure 1A).1 A PD-1-sensitive tumor cell line (MC38) was necessary in order to screen for mutations that confer resistance to immunotherapy (a positive selection screen). We infected murine MC38 cells with lentiviral vectors in an arrayed format to express a library of human ORFs expressing somatic mutations frequently identified in human cancer.19 Pools of infected and selected cells were implanted subcutaneously into wild-type C57/Bl6 mice, into mice subsequently treated with anti-PD-1, or into animals lacking functional CD8+ T cells (immunodeficient condition). Pools of cells were also maintained in vitro. At time of tumor harvest, ORF representation was determined by PCR amplification and sequencing of associated nucleic acid barcodes (figure 1B). This system does not distinguish whether depleted ORFs were selected against by increasing PD-1 responsiveness or by immune rejection, therefore we chose to focus on enriched ORFs. ORFs conferring cell-extrinsic immune evasion are expected to differentially increase in representation in PD-1-treated animals in comparison to immunodeficient animals, while those conferring growth advantage unrelated to immunity (ie, oncogenes) would increase in both conditions. Notably, distribution of gain-of-function alterations in the PI3K pathway were enriched compared with distribution of the remainder of the library by Kolmogorov-Smirnov test when comparing PD-1-treated and immunodeficient conditions (figure 1C). This finding is unique to the PI3K pathway, as mutations in other cancer-associated pathways or genes including p53, β2m, and RAS (H-RAS, N-RAS, K-RAS) failed to enrich, nor did control ORFs in the library (luciferase, GFP, BFP) (figure 1D). Overexpression of the wild-type ORF of PIK3CA, the alpha isoform of the catalytic domain of PI3K, functions similarly to a gain-of-function mutation in PIK3CA, and, indeed, scored highest in this screen. PIK3CA c.3140A>G(H1047R) is a gain-of-function mutation in the catalytic domain of PIK3CA and encodes a constitutively active kinase domain. AKT c.49G>A(E17K) is a gain-of-function mutation downstream of PI3K, and PTEN c.386G>A G129E functions as a dominant negative form of PTEN, a negative regulator of PI3K, all with a net effect of increasing signaling through the PI3K pathway.19 An immunoblot showing increased phospho S473 AKT confirms human PIK3CA H1047R increases signaling through the murine PI3K pathway (figure 1E). Thus, an in vivo screen identified multiple members of the PI3K pathway that conferred a common effect of increasing signaling through the PI3K pathway as a mechanism of immune evasion.
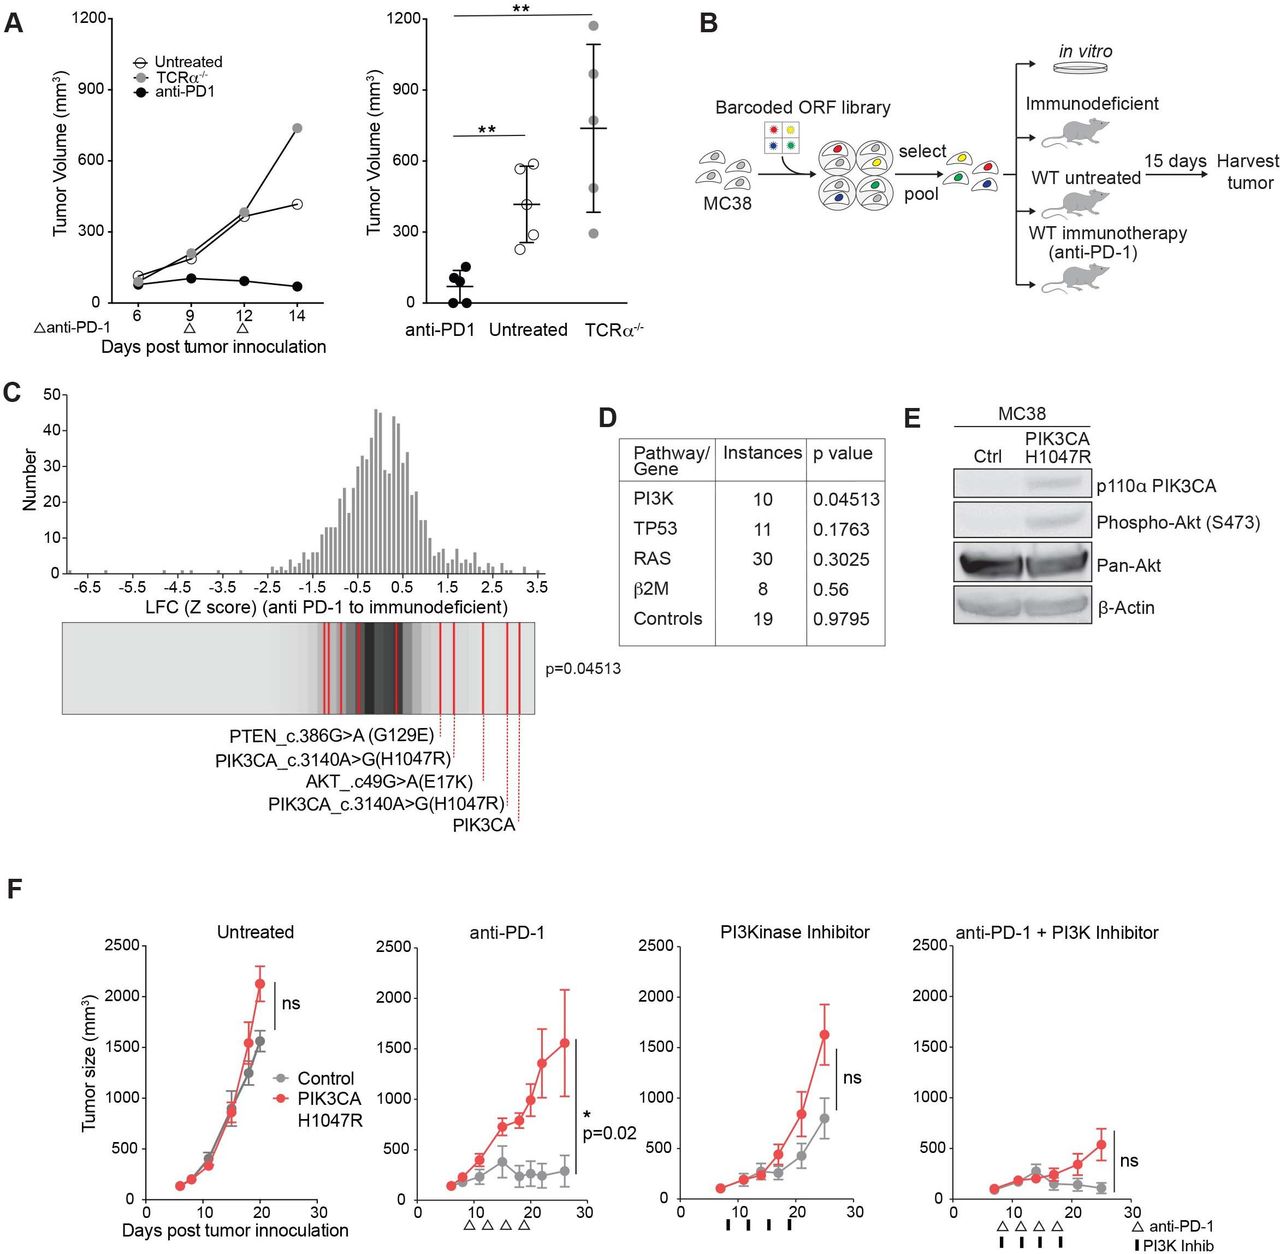
Phospho-inositol 3 kinase (PI3K) signaling is a mechanism of resistance to programmed cell death protein 1 (PD-1) blockade. (A) Representative tumor volume averaged for groups indicated for one subpool. n=5 per group per subpool. Data are mean±SD. (B) Experimental design for in vivo open reading frame (ORF) screening system. (C) Frequency histograms of enrichment or depletion (z-score) for all ORFs. PI3K activating ORFs are indicated by red lines. (D) Pathway or gene representation in library and significance of enrichment (Kolmogorov-Smirnov test). (E) Western blot analysis of phospho Akt after expression of PIK3CA H1047R. (F) Tumor volume of PIK3CA H1047R (red) or control (gray) MC38 tumors after indicated treatments. Data are mean±SEM; n=5 mice per group; representative of four independent experiments. ns, not significant; WT, wild type. *P<0.05; **p<0.01.
We confirmed this finding in single gene experiments expressing a control gene or PIK3CA H1047R in MC38 tumors. Control tumors treated with anti-PD-1 regressed as expected, however PIK3CA H1047R expressing tumors failed to respond to immune checkpoint therapy. Sensitivity to anti-PD-1 was restored when combined with a PI3K inhibitor, BAY80-6946, a pan PI3K inhibitor with highest isoform specificity to the alpha and delta isoforms,30 demonstrating PI3K inhibition can reverse the anti-PD-1 resistance of PIK3CA H1047R tumors (figure 1F).
PI3K signaling promotes an immune suppressive myeloid microenvironment
We evaluated the tumor microenvironment (TME) of PIK3CA H1047R-expressing and control tumors to identify immunological features of PIK3CA pathway activation at baseline before immune checkpoint therapy. Control tumors exhibited increased CD8+ T cell infiltration after PD-1 blockade compared with PIK3CA H1047R expressing tumors assayed by immunohistochemistry (figure 2A, online supplemental figure A). To further dissect the TME of PIK3CA mutant and wild-type tumors, we used single-cell RNA-seq (figure 2B); 1660 cells from control and PIK3CA H1047R tumors were analyzed (online supplemental figure B). Unsupervised clustering of gene expression profiles identified distinct subpopulations based on gene expression similarity. Identities of subpopulations were identified by canonical markers (online supplemental figure C). Of the CD45+ immune cells, myeloid cells predominate in both wild-type and PIK3CA-mutant MC38 tumors. However, PIK3CA H1047R-expressing tumors showed an increase in the MDSC and M2 inhibitory myeloid populations (figure 2B). The inhibitory myeloid populations expressed known markers of inhibition including Ccr2, Arg1, and Il1b (figure 2C). A Ccr2-expressing myeloid population could be detected by flow cytometry, confirming preferential enrichment in PIK3CA H1047R tumors (figure 2D). This cell population did not express Ly-6C, making it distinct from Ccr2+, Ly6Chi inflammatory monocytes (data not shown). CD8+ T cells were a minority population in both PIK3CA H1047R and wild-type tumors and were largely effector T cells based on GZMB and PRF1 expression (online supplemental figure C). Other immune subtypes were not significantly altered in control tumors and PIK3CA tumors as assessed by flow cytometry (online supplemental figure D). To test whether enrichment of Ccr2hi myeloid cells was a local or a systemic effect, we implanted wild-type and PIK3CA H1047R tumors on opposite flanks on the same animal. We again observed enrichment of Ccr2hi cells in the PIK3CA tumors compared with control tumors on the same animal, suggesting the effect on the myeloid TME is locally mediated (figure 2E). Consistent with the finding of an inhibitory microenvironment, inflammatory cytokines Gzmb, Ifnγ, Il6, TNFα, and soluble 41bb were more highly expressed in control tumors compared with PIK3CA H1047R tumors (figure 2F).
Supplemental material
Supplemental material

Phospho-inositol 3 kinase (PI3K) signaling promotes an immune suppressive myeloid microenvironment. (A) Immunohistochemistry showing CD8+ T cells in control or PIK3CA H1047R MC38 day 15 tumors after antiprogrammed cell death protein 1 treatment (n=5 mice per group). Quantification in online supplemental figure A. (B) tSNE projection (left) and density plots (center and right) of single-cell RNA-sequencing profiles from CD45+ tumor infiltrating immune cells from control or PIK3CA H1047R MC38 tumors at day 15, colored by cluster in tSNE. (C) Paired quantile–quantile (Q–Q) plots comparing the expression of a curated set of genes in immune cells from PIK3CA H1047R and control tumors and matched tSNEs depicting the distribution of gene expression. P values calculated using Wilcoxon rank-sum test. (D) Frequency of Ccr2hi or F4/80+ cells previously gated on CD45+ and CD11b+. Representative flow plots (left) and summary (right). (E) Frequency of Ccr2hi cells from individual tumors by flow cytometry as in (D) from animals with control tumors on left flank and PIK3CA H1047R on right flank. (F) Differences in cytokine quantification of inflammatory cytokines from tumor supernatants from control or PIK3CA H1047R MC38 tumors collected at day 15. (G) Correlation of PIK3CA and mRNA levels with CCR2 mRNA levels in indicated cancers. Volcano plot showing the Spearman’s correlation and estimated significance from RNA-sequencing data across The Cancer Genome Atlas (TCGA) cancer types calculated by Tumor Immune Estimation Resource and adjusted for tumor purity.27 Each dot represents a cancer type in TCGA; red dots indicate significant correlations (p<0.05). (H) Correlation of indicated immune cell type fraction estimated by CIBERSORT with hallmark PI3K/AKT/MTOR signaling signature from MsigDB scored by single sample gene set enrichment.28 29 31 ns, not significant. *P<0.05; ***p<0.001.
To test the relationship between PI3K signaling and inhibitory myeloid cell recruitment in human cancer, we examined the relationship between PIK3CA and CCR2 gene expression in human tumors. Using TCGA RNA-seq and TIMER, we found a correlation between mRNA levels for PIK3CA and CCR2 in human cancer types (figure 2G).27 We failed to observe this in tumors expressing other known tumor drivers, such as MYC and HRAS (online supplemental figure E). In human colon adenocarcinoma, which is frequently associated with both PI3K mutations and elevated PI3K signaling, a hallmark signature of PI3K/MTOR activation showed positive correlation with M2 macrophage infiltration, normalized to total infiltration (figure 2H).29 31 This was not due simply to increased total immune infiltration, as CD8+ T cells and M1 macrophages showed no correlation to PI3K/MTOR activation signature.
Myeloid cells from PIK3CA H1047R tumors are recruited by Ccl2 and inhibit CD8+ T cell proliferation
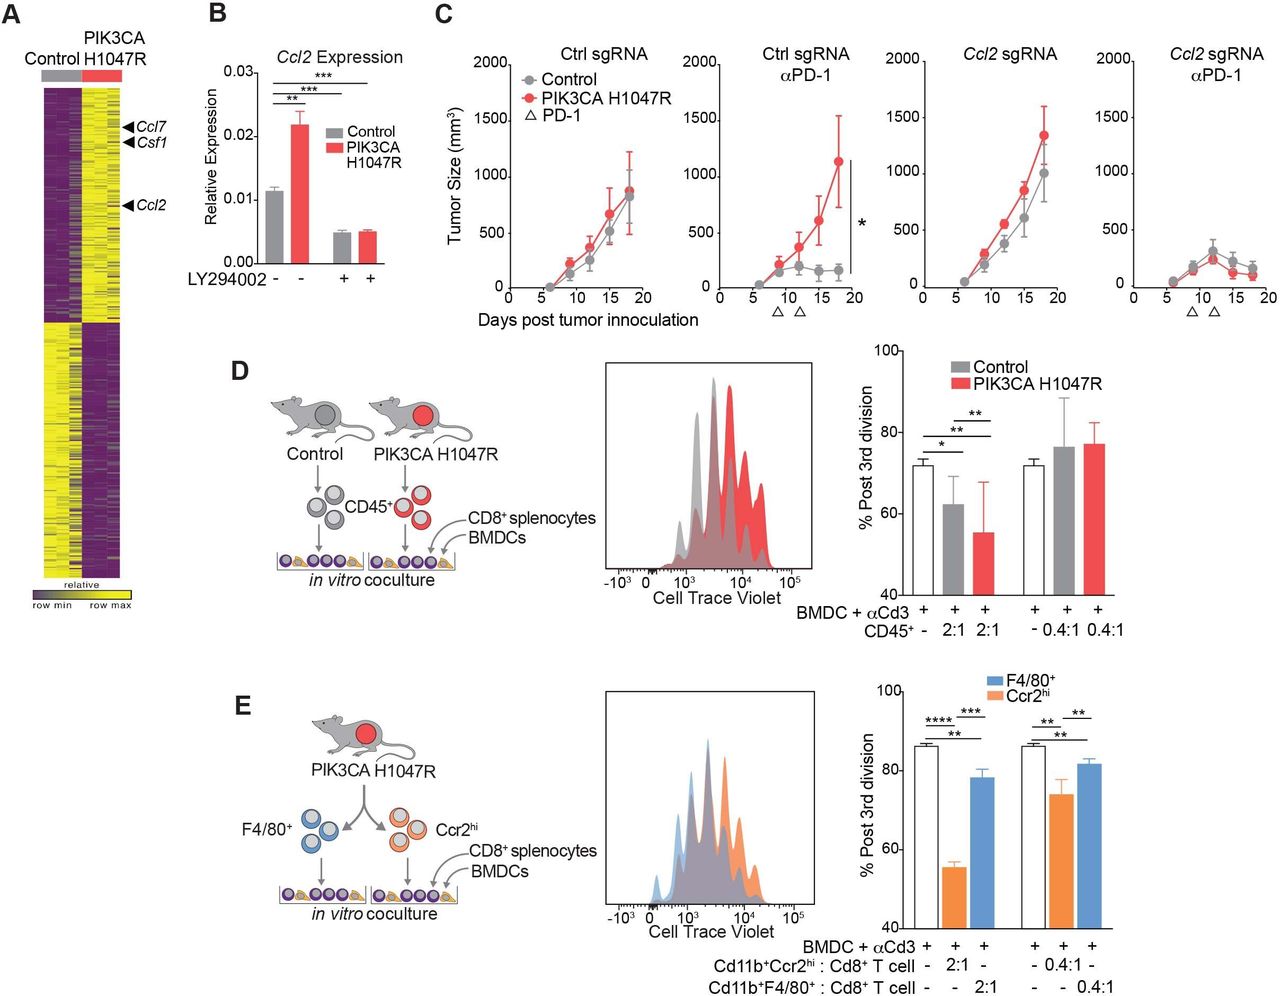
To determine the mechanism by which PIK3CA H1047R-expressing tumors enhance the recruitment of suppressive myeloid populations, we performed RNA-seq of PIK3CA-mutant expressing and wild-type murine MC38 cells grown in vitro. We detected higher levels of the suppressive myeloid cell-recruiting chemokines, Csf1, Ccl2, and Ccl7 in PIK3CA H1047R tumor compared with control cells (figure 3A). We further investigated Ccl2 expression, as a known ligand for Ccr2 identified on the subpopulation of myeloid cells enriched in PIK3CA mutant tumors. Increased expression of Ccl2 in MC38 PIK3CA H1047R cells was confirmed by quantitative PCR (figure 3B). Expression of Ccl2 was inhibited in vitro by treatment with LY294002, a pan PI3K inhibitor (figure 3B). When Ccl2 was deleted using CRISPR/Cas9 in MC38 tumors expressing PIK3CA H1047R, these tumors were resensitized to anti-PD-1, similar to control MC38, suggesting that Ccl2 is necessary for resistance to anti-PD-1 (figure 3C). Deletion of Ccl2 was confirmed by both loss of transcript and loss of chemokine production (online supplemental figure F,G). When tumors lacked Ccl2, there was no enrichment of Ccr2hi myeloid cells in PIK3CA H1047R tumors compared with wild-type, as was seen when Ccl2 was present (online supplemental figure H). Therefore, Ccl2 is required for establishment of the inhibitory TME and resistance of PIK3CA H1047R-expressing tumors to immunotherapy.

Myeloid cells from PIK3CA H1047R tumors are recruited by Ccl2 and inhibit CD8+ T cell proliferation. (A) Gene expression in control or PIK3CA H1047R MC38 cells in vitro. (B) Ccl2 transcript abundance after treatment with phospho-inositol 3 kinase (PI3K) inhibitor LY294002 measured by quantitative PCR. Data are mean±SD. (C) Tumor volume over time for PIK3CA H1047R or control tumors with single-guide RNA (sgRNA) for Ccl2 or control guide growing in mice treated with programmed cell death protein 1 (PD-1) blockade. Data are mean±SEM; n=5 animals per group. (D) Proliferation of CD8+ splenocytes measured by cell trace violet after coculture for 3 days with bone marrow-derived dendritic cells (BMDCs), anti-CD3, and CD45+ cells from control or PIK3CA H1047R tumors. Experimental design (left), representative histograms (center), and quantification (right). Data are mean±SD. (E) Proliferation of CD8+ splenocytes measured by cell trace violet after coculture for 3 days with BMDCs, anti-CD3, and F4/80+ or Ccr2hi populations sorted from PIK3CA H1047R tumor. Experimental design (left), representative histograms (center), and quantification (right). Data are mean±SD. *P<0.05; **p<0.01; ***p<0.001; ****p<0.0001.
Next, we examined whether the myeloid TME or, specifically, the Ccr2+ cells, inhibited CD8+ T cell proliferation. CD45+ cells were sorted from both control and PIK3CA H1047R-expressing tumors and cocultured for 3 days with splenocyte derived, cell trace violet-stained CD8+ T cells, bone marrow-derived dendritic cells as antigen-presenting cells, and anti-CD3 antibody. CD8+ T cells cultured with the CD45+ compartment derived from PIK3CA tumors proliferated less than those derived from control tumors (figure 3D). Having identified CD45+ CD11b+ Ccr2hi myeloid cells as differentially enriched in PIK3CA tumors, we determined whether that cell type had a similar effect on CD8+ T cell proliferation. CD45+ CD11b+ Ccr2hi and CD45+ CD11b+ F4/80+ cells were sorted from a PIK3CA H1047R tumor. CD8+ T cells showed impaired proliferation when cocultured with CD45+ CD11b+ Ccr2hi cells compared with coculture with CD45+ CD11b+ F4/80+ myeloid cells (figure 3E). Thus, the myeloid microenvironment, characterized by Ccr2hi myeloid cells, of PIK3CA H1047R tumors produces Ccl2 and suppresses CD8+ T cell proliferation.
Ccr2/5 inhibition resensitizes PIK3CA H1047R tumors to treatment with anti-PD-1
Since CD45+ CD11b+ Ccr2hi cells predominate in the PI3K activated microenvironment, we tested whether inhibition of migration of these cells reversed the PD-1 checkpoint blockade resistance phenotype. A small molecule inhibitor, BMS 687681, targets receptors Ccr2 and Ccr5 on myeloid cells and prevents migration into the tumor.32 We treated mice continuously for 10 days starting on day 6 with BMS 687681, with or without concurrent anti-PD-1 (figure 4A). When this drug engages the target receptors Ccr2 and Ccr5, the ligands for these receptors, Ccl2 and RANTES respectively, increase in circulation (BMS communication). Indeed, mice treated with the Ccr2/5 inhibitor showed increased circulating Ccl2 and RANTES, indicative of on-target drug effect (figure 4B). Flow cytometry of the TME from PIK3CA H1047R tumors treated with Ccr2/5 inhibitor or inhibitor plus anti-PD-1 showed a decrease in Ccr2hi cells compared with either drug alone (figure 4C). Mice bearing PIK3CA H1047R tumors, when treated with Ccr2/5 inhibition in combination with anti-PD-1 showed regression of tumors, which was not the case when treated with either alone (figure 4D). Targeting the myeloid microenvironment in PI3K-active tumors therefore sensitized these tumors to anti-PD-1.

Ccr2/5 inhibition resensitizes PIK3CA H1047R tumors to treatment with antiprogrammed cell death protein 1 (anti-PD-1). (A) Experimental design for in vivo Ccr2/5 inhibitor treatment. (B) Ccl2 (left) and Ccl5 (right) chemokine quantification in peripheral blood of mice bearing control or PIK3CA H1047R tumors after BMS687681 or vehicle treatment. (C) Frequency of Ccr2hi myeloid cells in control or PIK3CA H1047R MC38 tumors treated with BMS687681 and/or anti-PD-1 treatment. (E) Tumor volume over time for PIK3CA H1047R or control tumors growing in mice treated with BMS687681 or PD-1 blockade as indicated. Data are mean±SEM; n=5 animals per group. *P<0.05; **p<0.01.
Discussion
We show that activation of PI3K signaling in tumor cells creates a TME characterized by increased representation of inhibitory CD45+ CD11b+ Ccr2hi myeloid cells, less CD8+ T cell infiltration after immunotherapy, and impaired response to immune checkpoint blockade. Although the role of PI3K signaling in tumor initiation is well established, we found a new role for PI3K signaling in creating an immunosuppressive TME. This suggests PI3K mutation is a potential biomarker of poor response to immunotherapy, and these findings provide a rationale for combination of PI3K inhibition with myeloid-targeting strategies to overcome immunotherapy resistance.
We found that PI3K exerts an immune inhibitory effect by recruitment of a monocytic suppressive population marked by Ccr2. Ccr2-expressing cells have been implicated in immune inhibition.33 These cells are the most differentially represented in single cell analysis of the myeloid microenvironment after immune checkpoint therapy, decreasing with a productive immunotherapy response.34 In the B16 melanoma mouse syngeneic transplantable model, GM-CSF recruited Cd11b+Ccr2+ monocytic cells to tumors and blocked CD8+ infiltration, limiting immune checkpoint efficacy.35 Similarly, in another mouse orthotopic model of non-small cell lung cancer, recruitment of Ccr2-expressing cells by TNF-related apoptosis-inducing ligand (TRAIL) signaling favored tumor growth.36 Also consistent with these findings, in a mouse model of hepatocellular carcinoma, Ccr2+ myelomonocytic cells are recruited and beneficial during senescence surveillance, but functionally inhibit CD8+ T cell proliferation and promote tumor growth after tumor initiation.37 The presence of these cells in human liver metastases confers a poor prognosis in colorectal cancer.38 These data support the finding that recruitment of myeloid cells expressing Ccr2 creates an immunosuppressive microenvironment that inhibits CD8+ T cell expansion and limits immune checkpoint therapy. Our data show that recruitment of this population is promoted by PI3K gain of function in tumors and that inhibition can resensitize tumors to immune checkpoint blockade. Clinically, this is relevant to both primary and secondary resistance. In our model, Ccl2 was necessary for PI3K gain-of-function resistance to immunotherapy, but given the broad effects of PI3K activation on tumor progression, there may be other PI3K-mediated effectors involved.
Previous work supports our findings that the PI3K pathway is associated with resistance to immunotherapy. PTEN is a negative regulator of PI3K, therefore a loss of function in PTEN would be expected to phenocopy gain of function in PI3K. In human melanoma samples, PTEN loss correlated with decreased CD8+ T cell infiltration, and a PI3Kβ inhibitor synergized with anti-PD-1 in a mouse model of melanoma.39 In agreement with our findings, CCL2 expression was higher in tumors with loss of function of PTEN.39 A single patient with previously untreated leiomyosarcoma has been described who had a prolonged, sustained response to pembrolizumab with the exception of a single, treatment-resistant metastatic site. When sequenced, the resistant tumor harbored a loss of function PTEN mutation not present in the parent tumor or other metastatic sites, leading to the conclusion that this mutation is associated with immune escape.40 PIK3CA mutation or increased mammalian target of rapamycin signaling has also been associated with poor response to immune checkpoint inhibition in head and neck squamous and clear cell renal cell carcinomas.41 42 In a breast cancer orthotopic model, treatment with BKM120, a pan PI3K inhibitor synergized with anti-PD-1 in tumor regression.43 The alpha isoform of PI3K is responsible for most tumor intrinsic functions typically attributed to PI3K such as growth signaling and transformation downstream of receptor tyrosine kinases.6 7 In this study, we have used a PI3K inhibitor, BAY80-6946, with dual specificity for the alpha and delta isoforms. A potential limitation of our study is the confounding effect of PI3K delta isoform inhibition. The delta isoform is primarily expressed in lymphocytes, therefore the expected effect of delta inhibition would be impaired anti-PD-1 response, which was not seen, although ultimately, effect on other isoforms cannot be excluded. Other work has shown that inhibition of PI3K gamma enhances response to immune checkpoint inhibitors through the effect on myeloid cells.44–46 This study is an important complement to current understanding by showing that tumor-intrinsic gain-of-function mutations in PI3K may be associated with poor response to immunotherapy and proposes a mechanism of TME modulation that can be further targeted therapeutically.
Strategies to increase response to immunotherapy in otherwise resistant tumors are a priority to inform clinical trial design. We found that small molecule inhibitors of both PI3K as well as Ccr2 can sensitize resistant PIK3CA H1047R tumors to anti-PD-1 therapy, suggesting two possible therapeutic strategies in patients with primary or secondary immunotherapy resistance. Ccr2 inhibitors are currently in clinical trials in patients with pancreatic cancer, having shown promise in preclinical models.47 Two PI3K inhibitors with activity against the alpha isoform are Food and Drug Administration-approved, apelisib and copanlisib (BAY80-6946). There are currently open studies investigating the use of copanlisib with immune checkpoint blockade (NCT04895579, NCT04431635, NCT03842228, NCT03711058, NCT04317105, NCT03884998). Therapeutic use of small molecule inhibitors to target tumor cell signaling pathways in order to modulate the immune microenvironment has been shown in principle first with mitogen-activated protein kinase (MEK) inhibition and histone deacetylase (HDAC) inhibition. While traditionally thought to target tumor intrinsic mechanisms of growth, these also modulate the immune microenvironment to be less suppressive.48–50 Clinical trials are underway with these combinations. This also points to the need for robust immune assessment in patients receiving targeted small molecules on clinical trials to advance understanding of drugs which have beneficial effects on the immune response.
PI3K was identified in a systematic screen for resistance to immunotherapy conferred by known tumor-associated mutations. Mutations were included in the analysis based on representation in a common cancer type.19 From this pool of mutations, none of which was selected for inclusion based on a role in immune responsiveness, we were able to discover a novel role for a cancer driver mutation. This expands on our knowledge of somatic mutations that alter the vulnerability of a tumor to immune attack and challenges the notion that driver mutations act solely in a cell intrinsic way to promote cell growth and survival. Careful evaluation of driver mutations and their role in regulating susceptibility to immunity to cancer may inform combination therapy with immune checkpoint blockade.
Data availability statement
Data are available on reasonable request. All data relevant to the study are included in the article or uploaded as supplementary information. All data relevant to the study are included in the article or as online supplemental information. Any further information about resources and reagents should be directly requested to the corresponding author and will be fulfilled on reasonable request.
Ethics statements
Patient consent for publication
Ethics approval
All procedures and animal experiments were reviewed and approved by the Institutional Animal Care and Use Committee at Dana-Farber Cancer Institute (#12-044).
References
Supplementary materials
Supplementary Data
This web only file has been produced by the BMJ Publishing Group from an electronic file supplied by the author(s) and has not been edited for content.
Footnotes
Contributors WNH and NBC contributed to the study design. NBC and RAA performed all experiments in cell lines and with live animals. HWP and RTM developed selected reagents for use in experiments. QZ and MQ provided reagents and performed cytokine measurements. NBC prepared samples for single-cell RNA-sequencing, which KB and KBY analyzed. NBC and RAA prepared samples for single cell analysis, which BCM performed, and KB analyzed. MW, TH, and AKS provided expertise and developed methods for single cell analysis. JJI and NBC performed The Cancer Genome Atlas analysis. YS, JSB, and WCH developed library for screening. JGD supervised screening processing and analysis. NBC and WNH wrote the manuscript, and WNH is guarantor.
Funding This work was supported in part by the foundation Cookies for Kids Cancer. Partial funding was also received from the Cancer Target Discovery and Development (CTD2) Network, National Cancer Institute, Bethesda, MD. It was also supported with drug supply from Bristol Myers Squibb. WCH funding sources were U01 CA176058, U01 CA224146, U54 CA217377. AKS was supported in part by the Pew-Stewart Trust and a Sloan Fellowship in Chemistry.
Competing interests WNH is employed by Arsenal Biosciences, equity in Merck and Arsenal Biosciences; QZ is an employee at BMS; HWP at Arsenal Biosciences; YS at AstraZeneca; MQ is employed by Gilead Sciences, equity in Bristol Myers Squibb, Gilead Sciences and Enara Bio; WCH is a consultant for Thermo Fisher, Solasta Ventures, MPM Capital, Frontier Medicines, iTeos, Tyra Biosciences, RAPPTA Therapeutics, Jubilant Therapeutics, KSQ Therapeutics and Parexel; JI is a consultant for Phenomic AI and Related Sciences; AKS reports compensation for consulting and/or SAB membership from Merck, Honeycomb Biotechnologies, Cellarity, Repertoire Immune Medicines, Hovione, Third Rock Ventures, Ochre Bio, Relation Therapeutics, and Dahlia Biosciences; JGD consults for Agios, Maze Therapeutics, Microsoft Research, BioNTech, and Pfizer; JGD consults for and has equity in Tango Therapeutics.
Provenance and peer review Not commissioned; externally peer reviewed.
Supplemental material This content has been supplied by the author(s). It has not been vetted by BMJ Publishing Group Limited (BMJ) and may not have been peer-reviewed. Any opinions or recommendations discussed are solely those of the author(s) and are not endorsed by BMJ. BMJ disclaims all liability and responsibility arising from any reliance placed on the content. Where the content includes any translated material, BMJ does not warrant the accuracy and reliability of the translations (including but not limited to local regulations, clinical guidelines, terminology, drug names and drug dosages), and is not responsible for any error and/or omissions arising from translation and adaptation or otherwise.