Article Text

Abstract
Background Tumor-associated macrophages (TAMs) secreting IL-10 could be a specific functional cell subset with distinct polarization state and suppressive role in antitumor immune response. Here, we assessed the associations of clinical outcome, therapeutic responses and molecular features with IL-10+TAMs infiltration, and potential impact of IL-10+TAMs on the immune contexture in muscle-invasive bladder cancer (MIBC).
Methods In this retrospective study, 128 patients and 391 patients with MIBC from Zhongshan hospital (ZS cohort) and The Cancer Genome Atlas cohort were included respectively. Immunohistochemistry was performed to quantify various immune cell infiltration in the ZS cohort. Single cell RNA sequencing and flow cytometry were performed to examine the functional status of IL-10+TAMs and its correlation with other immune cells. Survival analyses and assessment of the adjuvant chemotherapy (ACT) benefit analyses were also performed.
Results High IL-10+TAMs infiltration was associated with inferior prognosis in terms of overall survival and recurrence-free survival, but superior chemotherapeutic response in MIBC. IL-10+TAMs with suppressive features were associated with immunoevasive tumor microenviroment characterized by exhausted CD8+ T cells, immature NK cells and increased immune checkpoint expression. Additionally, high IL-10+TAMs infiltration showed a strong linkage with basal-featured subtype and augmented EGF signaling.
Conclusions Immunosuppresive IL-10+TAMs contributed to an evasive contexture with incapacitated immune effector cells and increased immune checkpoint expression, therefore, predicting unfavorable clinical outcomes despite better ACT responsiveness. IL-10+TAMs might provide guidance for customized selection of EGFR-targeted therapy, FGFR3-targeted therapy as well as immunotherapy. The potential of immunosuppressive IL-10+TAMs as a therapeutic target is worth further exploration.
- immunotherapy
- urinary bladder neoplasms
- tumor microenvironment
- tumor biomarkers
- macrophages
Data availability statement
Data are available on reasonable request. All data generated that are relevant to the results presented in this article are included in this article. Other data that were not relevant for the results presented here are available from the corresponding author JX on reasonable request.
This is an open access article distributed in accordance with the Creative Commons Attribution Non Commercial (CC BY-NC 4.0) license, which permits others to distribute, remix, adapt, build upon this work non-commercially, and license their derivative works on different terms, provided the original work is properly cited, appropriate credit is given, any changes made indicated, and the use is non-commercial. See http://creativecommons.org/licenses/by-nc/4.0/.
Statistics from Altmetric.com
Introduction
Bladder cancer is the 10th most commonly diagnosed cancer worldwide, featured with high incidence rate and mortality.1 Bladder cancer can be categorized as non-muscle-invasive bladder cancer (NMIBC), MIBC, and metastatic tumor from distant sites. Among them, the 5-year survival rate of patients with MIBC is still less than 50%. The standard treatment for patients with MIBC is radical cystectomy (RC). Cisplatin-based adjuvant chemotherapy (ACT) is often applied to reduce the risk of recurrence after RC, yet its therapeutic benefits remain vague due to the low response rate and the frequent occurrence of drug resistance.2 Recently, emerging immune checkpoint inhibitors (ICI) and targeted therapies have remodeled the paradigm of MIBC treatment. Nevertheless, the response rates of patients with MIBC to PD-1/PD-L1 inhibitors approved by FDA were merely 15%–21.1%.3 Recent studies have uncovered that the therapeutic responses to systematic treatment (ACT or ICI) potentially lies in the tumor microenvironment (TME) and tumor-infiltrating immune cells.4 Therefore, the investigations of immune-related biomarkers with predictive values for clinical outcome and therapeutic efficacy are crucially needed in MIBC.
Tumor-associated macrophages (TAMs) could exhibit pleiotropic functions in TME. TAMs with M1-like phenotype could produce proinflammatory cytokines, activate cytotoxic T lymphocytes and orchestrate the anti-tumor immunity. However, pro-tumorigenic M2-like TAMs are believed to preferentially attract Tregs and Th2 cells, and suppress T-cell responses.5 Our previous studies have illustrated the indispensable role of TAMs in the modulation of TME,6 and identified specific TAMs subgroup expressing lectins (DC-SIGN and Galectin-9) as the promoter of immunosuppressive microenvironment in MIBC,7 8 which confirmed the importance and heterogenity of TAMs. As an immunosuppressive cytokine, IL-10 is secreted by multiple immune cells including macrophages. Secretion of IL-10 could be a definitive feature of a specific type of functional TAMs, directly representing its polarization state and suppressive role in anti-tumor immune response. Previous studies have unraveled IL-10+TAMs role as a facilitator in immune evasion in breast cancer and gastric cancer.9 10 Nevertheless, the significance of immunosuppressive IL-10+TAMs in terms of clinical outcome and therapeutic paradigm of MIBC is yet unclear.
Herein, we aimed to explore the predictive values of IL-10+TAMs infiltration for clinical outcome and ACT responsiveness in MIBC, and further discovered its phenotypic features, as well as its potential impact on the immune contexture and molecular features of MIBC. Subsequently, we seek to evaluate the association of IL-10+TAMs infiltration with therapy-related signatures, hence providing better insight into the therapeutic landscape of MIBC.
Materials and methods
Study cohort
Two cohorts of MIBC patients were enrolled in the study, as illustrated in supplemental figure 1A. The Cancer Genome Atlas (TCGA) cohort was composed of 412 patients with bladder cancer from TCGA database, which was downloaded in May 5, 2017. A total of 21 patients were excluded: 3 patients without survival information, 4 patients without RNA-seq data, 10 patients receiving neoadjuvant chemotherapy, and 4 patients with NMIBC. 175 patients in TCGA cohort received ACT, while detailed information of the chemotherapy drugs was unknown.
Supplemental material
Approved by the Clinical Research Ethics Committee of Zhongshan Hospital, Zhongshan (ZS) cohort was composed of 215 patients with bladder cancer who were treated with RC at Zhongshan Hospital of Fudan University from 2002 to 2014. Informed consent was acquired from all the patients. 87 patients were excluded: 60 patients without MIBC, 13 patients without urothelial carcinoma, 14 specimens with dots lost on the tissue microarray (TMA) during the immunohistochemistry (IHC) procedure. Consequently, 128 patients were enrolled in the ZS cohort, and 62 patients received adjuvant cisplatin-based ACT which lasted at least one therapeutic cycle. Patients received follow-ups every 3 months in the first year, every 6 months for the next 2 years and once per year thereafter. Information collected during follow-ups included clinical history, physical examination results and laboratory tests. All follow-up data collection was completed before July 2016. The overall survival (OS) and the recurrence-free survival (RFS) were defined as the period from the date of RC to the date of death and first recurrence, or to the latest follow-up. The clinical-pathological characteristics of 391 patients from TCGA cohort and 128 patients from ZS cohort are summarized in supplemental table 1.
Immunohistochemistry
Single and double IHC staining were performed on formalin-fixed, paraffin-embedded TMA as described previously.11 Single staining was performed for the following molecules and their corresponding cells: TAMs (CD68), neutrophils (CD66b), mast cells (mast cell tryptase), NK cells (CD56), B cells (CD19), CD3+ cells (CD3), CD8+ cells (CD8), CD4+ cells (CD4), Th17 cells (IL-17), Treg cells (FOXP3), PD-L1, PD-1+ cells, CTLA-4+ cells, TIM-3+ cells, TIGIT+ cells, LAG-3+ cells, KRT5/6, GATA3, EGF and FGFR3 expression. The detailed procedure of IHC is provided in supplemental methods and supplemental table 2.
Single-cell RNA sequencing
The 10X Genomics Chromium Controller Instrument and Chromium Single Cell 3’ V3 Reagent Kits (10X Genomics, Pleasanton, California, USA) were used to generate the scRNA-Seq libraries. In brief, cells at a concentration of 1000 cells/uL and approximately 8000 cells were loaded into each channel to generate single-cell Gel Bead-In-Emulsions (GEMs), which results into expected mRNA barcoding of 6000 single-cells for each sample. After the RT step, GEMs were broken and barcoded-cDNA was purified and amplified. The amplified barcoded cDNA was fragmented, A-tailed, ligated with adaptors and index PCR amplified. The final libraries were quantified using the Qubit High Sensitivity DNA assay (Thermo Fisher Scientific) and the size distribution of the libraries were determined using a High Sensitivity DNA chip on a Bioanalyzer 2200 (Agilent). Sequencing of the libraries was applied by HiSeq Xten (Illumina, San Diego, California, USA) on a 150 bp paired-end run. The detailed procedures of single-cell dissociation and single-cell RNA sequencing data analysis are provided in supplemental methods.
Flow cytometry
Seventeen freshly resected tumor tissues were obtained from three independent institute (Zhongshan Hospital, Fudan University Shanghai Cancer Center and Ruijin Hospital) to examine the infiltration of IL-10+TAMs and the functional molecules of CD8+ cells including PRF-1, GZMB and IFN-γ, as well as exhausted CD8+ cells markers including PD-1, CTLA-4, TIM-3, LAG-3 and TIGIT. Signed informed consent was obtained from each patient. The detailed procedure of specimen processing is provided in supplemental methods. The antibodies used in flow cytometry (FCM) are listed in supplemental table 3.
TCGA data source and processing
The clinical and pathological characteristics and mRNA data of patients from TCGA cohort were downloaded from cBioPortal for Cancer Genomics at http://wwwcbioportalorg. TAMs were defined as the sum of M0, M1 and M2 proportion calculated by CIBERSORT algorithm. Cut-off value of TAMs was 0.139385 by minimum log-rank P value method. The IL-10+TAMs signature included IL10, STAT3, MAF, MAPK3, ATF1, CD68, CD163 and CD204 (MSR1). STAT3, MAF, MAPK3 and ATF1 are important transcription factors and regulation molecules in the IL-10-related signaling pathway.12 CD68 is a pan-macrophage marker. CD163 and CD204 are scavenger receptors highly expressed by TAMs.13 14 IL-10+TAMs signatures were calculated by the geomean of FPKM values of related genes. Cut-off value of IL-10+TAMs signature scores was 1.67590 calculated by minimum log-rank p value. FGFR3 signature was adopted from Reactome-HSA-5654708 gene set. EGF signaling was adopted from Reactome-HSA-1643713 gene set. Immunotherapy-related signatures were defined from previous studies.15 16 Data of therapy-related gene signature values were derived from our previous studies.17
Classification of molecular subtype
In TCGA cohort, we obtained the molecular classification information of patients using R package ‘BLCAsubtyping’ (2.1). In ZS cohort, we performed IHC single staining of KRT5/6 (1:25 dilution, Abcam, ab17133) and GATA3 (1:100 dilution, Abcam, ab199428) to classify patients into either basal or luminal subtype in ZS cohort according to an IHC subtyping method reported in a previous article.18 KRT5/6 is considered as a basal marker, while GATA3 is highly expressed in luminal subtype. During IHC evaluation, KRT5/6 and GATA3 expression were assessed as either negative or positive, the cut-off point of which was defined as 20% tumor tissue positivity under 200× high power field.18 KRT5/6+GATA3- tumors were classified as basal subtype, while the rest were classified as luminal subtype.
Statistical analysis
Cut-off values of IL-10+TAMs signature scores and IL-10+TAMs infiltration level were calculated by minimum log-rank P value method using R package survMisc (0.5.5) in both TCGA and ZS cohort. For the comparisons of data between two subgroups, Chi-square test and Mann-Whitney U test were used. Kaplan-Meier analyses were performed by log-rank test. Univariate analyses of cox proportional hazard regression models were conducted to evaluate the HRs of IL-10+TAMs level in the background of gene mutation. Spearman correlation analysis was used for FCM data. Univariate and multivariate cox regression analysis were applied to assess HRs of clinicopathologic factors. GO analysis was performed using R package clusterProfiler (3.18.1). Differential gene analyses were performed using R package edgeR (V.3.32.1). Gene set enrichment analysis (GSEA) were conducted on GSEA software V.4.0.2 (Broad Institute, Massachusetts, USA). A p<0.05 was considered statistically significant in our study. All statistical analyses were performed using IBM SPSS Statistics V.22.0 and R V.3.6.3 (http://www.rproject.org/).
Results
Prognostic value of IL-10+TAMs infiltration for poor clinical outcomes in MIBC patients
To explore the prognostic merit of IL-10+TAMs in MIBC, Kaplan-Meier analysis of IL-10+TAMs infiltration in both ZS and TCGA cohort was performed. IL-10+TAMs level was identified by double IHC staining in ZS cohort (supplemental figure 1B) and also calculated through its related gene signature in TCGA cohort. In ZS cihort, total TAMs were identified by single IHC staining of CD68. In TCGA cohort, total TAMs were the sum of M0, M1 and M2 proportion calculated by CIBERSORT algorithm.19 While total TAMs infiltration failed to distinguish patients’ OS and RFS (figure 1A,C), IL-10+TAMs infiltration predicted worse prognosis of patients both in TCGA cohort (OS: p=0.015; RFS: p=0.035, figure 1B) and ZS cohort (OS: p<0.001; RFS: p<0.001, figure 1D). Moreover, multivariate Cox analyses confirmed that IL-10+TAMs infiltration level was an independent prognosticator for worse prognosis (OS: HR (95% CI)=2.873 (1.685 to 4.898) in ZS cohort, HR (95% CI)=1.593 (1.031 to 2.459) in TCGA cohort; RFS: HR (95% CI)=2.445 (1.419 to 4.211) in ZS cohort, HR (95% CI)=1.359 (0.840 to 2.199) in TCGA cohort; supplemental table 4 and 5) after the adjustment of age, pT stage and grade. Collectively, IL-10+TAMs showed greater prognostic value than total TAMs, and were associated with poor clinical prognosis in patients with MIBC.

IL-10+TAMs infiltration yields poor prognosis in MIBC patients. (A, B) Kaplan-Meier curves of overall survival (OS) and recurrence-free survival (RFS) according to TAMs infiltration (A) and IL-10+TAMs infiltration (B) in TCGA cohort. (C, D) Kaplan-Meier curves of OS and RFS according to TAMs infiltration (C) and IL-10+TAMs infiltration (D) in ZS cohort. Log-rank test was performed for Kaplan-Meier curves. MIBC, muscle-invasive bladder cancer; TAMs, tumor-associated macrophages; TCGA, The Cancer Genome Atlas.
Predictive merit of IL-10+TAMs infiltration for ACT responses in MIBC patients
ACT has been widely applied in the treatment for MIBC patients according to the guidelines, yet only a relatively small population of patients could gain survival benefit. The beneficiaries of ACT remained difficult to detect.1 We evaluated whether IL-10+TAMs infiltration was associated with ACT responsiveness in patients with MIBC. In both TCGA cohort and ZS cohort, MIBC patients failed to benefit from adjuvant cisplatin-based chemotherapy (figure 2A,B top). We then compared the clinical outcomes of patients stratified by ACT application in both IL-10+TAMs high and low subgroups individually. As shown in figure 2A,B, ACT application led to survival benefit in patients with high IL-10+TAMs infiltration in TCGA cohort (figure 2A middle, OS: p=0.014) and ZS cohort (figure 2B middle, OS: p=0.013, RFS: p=0.035). Intriguingly, patients with low IL-10+TAMs infiltration had inferior RFS after receiving ACT in TCGA cohort (figure 2A bottom, p=0.035). Collectively, these results suggested patients with high IL-10+TAMs infiltration were more likely to benefit from chemotherapy.

Predictive value of IL-10+TAMs infiltration abundance for adjuvant chemotherapy benefit. (A, B) Kaplan-Meier curves of os and RFS according to act application for all MIBC patients (top), high IL-10+TAMs subgroup (middle) and low IL-10+TAMs subgroup (bottom) in TCGA cohort (A) and Zs cohort (B). Log-rank test was performed for Kaplan-Meier curves. ACT, adjuvant chemotherapy; MIBC, muscle-invasive bladder cancer; RFS, recurrence-free survival; TAMs, tumor-associated macrophages; TCGA, The Cancer Genome Atlas.
Identification of the immunoevasive microenvironment with IL-10+TAMs infiltration
The influences of IL-10+TAMs infiltration on TME in MIBC remained unclear. Based on RNA-seq results from TCGA cohort, differentially expressed genes (DEGs) were selected and performed with Gene Ontology (GO) analysis, which showed that multiple immunosuppressive gene sets were enriched in IL-10+TAMs high subgroup, including negative regulation of T cell proliferation and immune responses (figure 3A). Meanwhile, among DEGs in TCGA cohort, immune checkpoint genes were upregulated in IL-10+TAMs high subgroup (figure 3B).
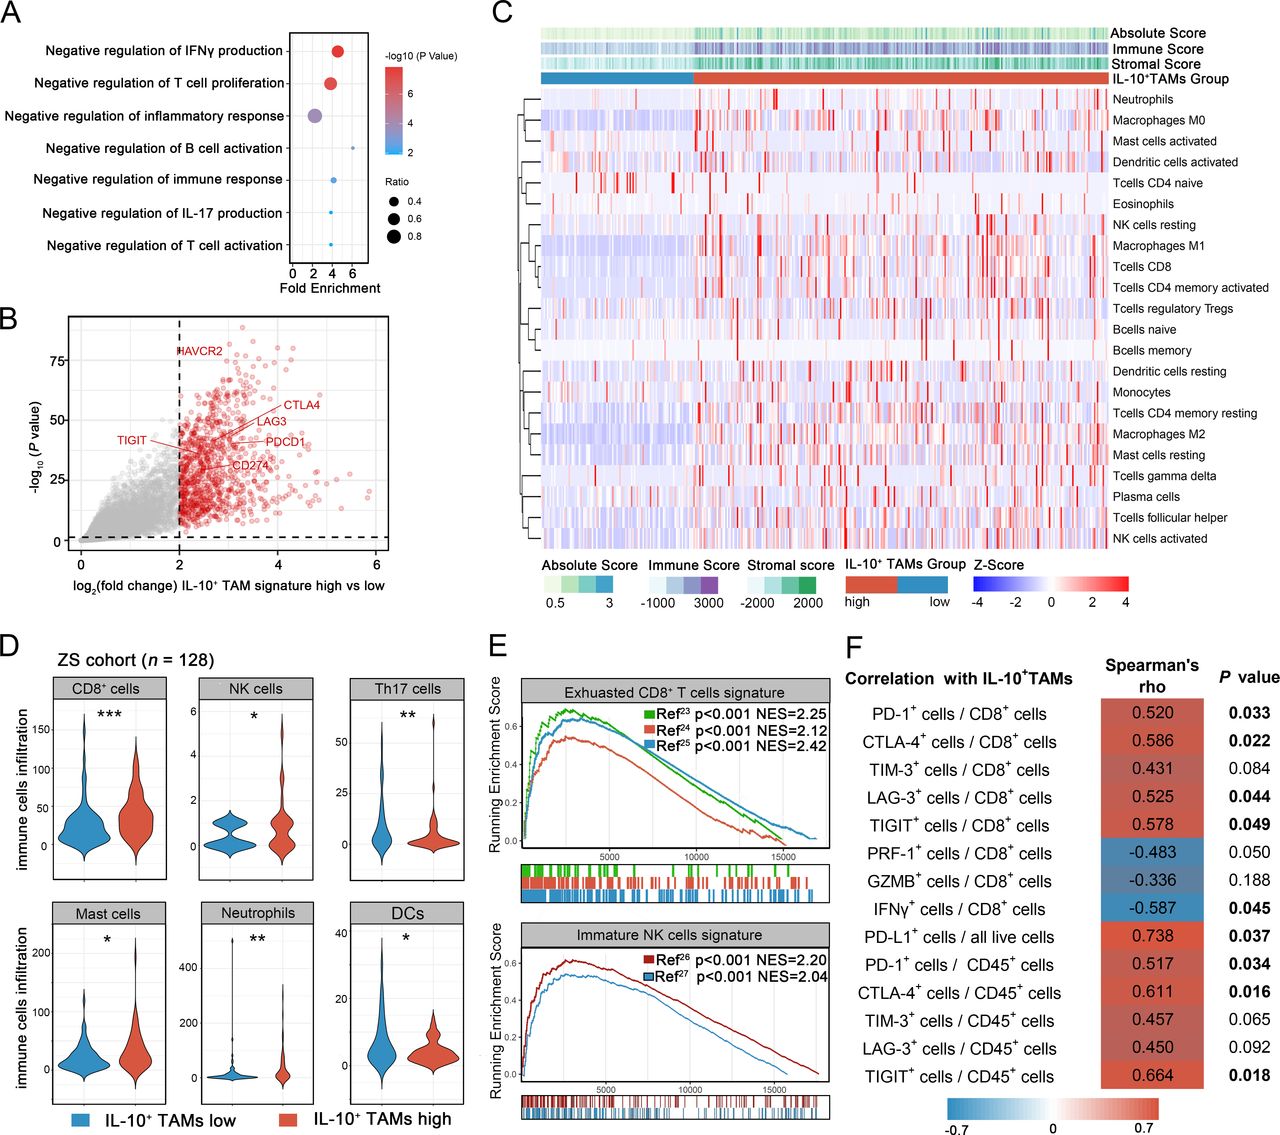
Identification of the immunoevasive microenvironment with IL-10+TAMs infiltration. (A) Gene Ontology (GO) analysis of differentially expressed genes (DEGs) in IL-10+TAMs high subgroup. Results were presented as bubble chart. Dot size represents gene ratio. Color key represents -log10 (p value). (B) Volcano plot for differential mRNA expression between high and low IL-10+TAMs signature subgroups in TCGA cohort. (C) Heatmap for CIBERSORT analysis of TCGA cohort to detect the correlation between IL-10+TAMs signature level and 22 kinds of immune cells. (D) Comparisons of CD8+ cells, NK cells, Th17 cells, mast cells, neutrophils and DCs between IL-10+TAMs low (left, n=68) and high (right, n=60) subgroups in ZS cohort. Data were analyzed using Mann-Whiney U test. (E) GSEA analysis showing the enrichment of exhausted CD8+ T cells signature and immature NK cells signature. (F) Heatmap showing the Spearman correlation analysis results between IL-10+TAMs level, cytotoxic profile, exhausted profile of CD8+ T cells and immune checkpoints expression based on FCM. *P<0.05, **p<0.01, ***p<0.001. DC, dendritic cells; FCM, flow cytometry; GSEA, Gene set enrichment analysis; NK, natural killer; TAMs, tumor-associated macrophages; TCGA, The Cancer Genome Atlas.
CIBERSORT analysis calculated the absolute proportion of 22 human hematopoietic cell phenotypes (LM22) in patients from TCGA cohort, hence revealing the connection between IL-10+TAMs infiltration and immune contexture in MIBC. We found that patients in IL-10+TAMs high subgroup presented a state of enriched immune infiltration, with the majority of 22 types of immune cells highly accumulated in TME. As illustrated in figure 3C, high IL-10+TAMs signature was associated with higher levels of immunosuppressive cells (iDCs, mast cells resting, and neutrophils) and lower level of active DCs. However, we also found that two typical immune effector cells, CD8+T cells and NK cells were more abundant in IL-10+TAMs high subgroup. To validate the above mentioned findings, we performed IHC to quantify important tumor infiltrating immune cells in ZS cohort. The representative IHC images of immune cells (including NK cells, CD19+ B cells, CD3+ cells, CD8+ cells, CD4+ cells, Th1, Th2, Th17, Tregs, mast cells, neutrophils, DCs, PD-L1+ cells, PD-1+ cells, CTLA-4+ cells, Tim-3+ cells, LAG-3+ cells and TIGIT+ cells) stratified by IL-10+TAMs high and low infiltration subgroups were attached in supplemental figure 2. Consistent with the results in TCGA cohort, patients with high IL-10+TAMs infiltration have a greater number of immunosuppressive cells (figure 3D, mast cells: p=0.013; neutrophils: p=0.003) and decreased DCs (p=0.029) and effector Th17 cells (p=0.002). Two aforementioned immune effector cells were found increased in ZS cohort as well (CD8+ cells: p<0.001; NK cells: p=0.037). Other subsets of immune cells that did not present a significant difference between IL-10+TAMs high and low subgroups were shown in supplemental figure 3.
The abundance of CD8+ T cells and NK cells were seemingly contradictory to the immunoevasive contexture conferred by IL-10+TAMs infiltration. Therefore, we further depicted the functional status of CD8+ T cells and NK cells via GSEA using TCGA RNA-Seq data. Previous studies have identified exhausted CD8+ T cells signature and immature NK cells signature,20–23 which were highly enriched in IL-10+TAMs high subgroup (figure 3E). To validate the findings from GSEA analysis, we performed FCM to investigate CD8+ cell function and immunosuppressive TAMs. Gating strategy of FCM for CD8+ T cells and IL-10+TAMs have been provided in supplemental figure 4. Besides, the representative FCM images of CD8+ T cells functional and exhausted subtypes and the immune checkpoints were attached in supplemental figure 5. FCM analyses confirmed the positive relation between IL-10+TAMs and CD8+ T cell exhaustion. We observed the cytotoxicity of CD8+ T cells (PRF-1 and IFN-γ) were impaired in high IL-10+ TAMs subgroup. Functional markers of CD8+ T cells were negatively correlated with IL-10+TAMs infiltration (PRF-1+CD8+ T cells: Spearman r=−0.483, p=0.050; GZMB+CD8+ T cells: Spearman r=−0.336, p=0.188; IFN-γ+CD8+ T cells: Spearman r=−0.587, p=0.045; figure 3F, supplemental figure 6). Moreover, the exhausted markers of CD8+ T cells were positively associated with IL-10+TAMs infiltration (PD-1+CD8+ T cells: Spearman r=0.520, p=0.033; CTLA-4+CD8+ T cells: Spearman r=0.586, p=0.022; TIM-3+CD8+ T cells: Spearman r=0.431, p=0.084; LAG-3+CD8+ T cells: Spearman r=0.525, p=0.044; TIGIT+CD8+ T cells: Spearman r=0.578, p=0.049; figure 3F, supplemental figure 6). These FCM results at the protein level, which conformed to our findings in TCGA by GSEA algorithm, further illustrated the association between IL-10+TAMs and dysfunctional CD8+ T cells.
Apart from the functional and exhausted profiles of CD8+ T cells, we have also investigete the associations of IL-10+TAMs with the overall expression of immune checkpoints using both IHC and FCM. In IHC, we observed the elevation of immune checkpoints in IL-10+ TAMs high subgroup in ZS cohort (PD-L1: p<0.001; PD-1: p=0.015; CTLA4: p<0.001; TIM-3: p=0.002; LAG-3: p<0.001; TIGIT: p=0.006; supplemental figure 7). FCM results confirmed the positive correlations between IL-10+TAMs level and immune checkpoint expression (PD-L1: Spearman r=0.738, p=0.037; PD-1: Spearman r=0.517, p=0.034; CTLA-4: Spearman r=0.611, p=0.016; TIM-3: Spearman r=0.457, p=0.065; LAG-3: Spearman r=0.450, p=0.092; TIGIT: Spearman r=0.664, p=0.018; figure 3F, supplemental figure 8).
Taken together, the immunosuppressive contexture and dysfunctional effector cells potentially explained the unsatisfactory clinical outcomes in patients with high IL-10+ TAMs infiltration.
Characterization of IL-10+TAMs by scRNA-seq in MIBC
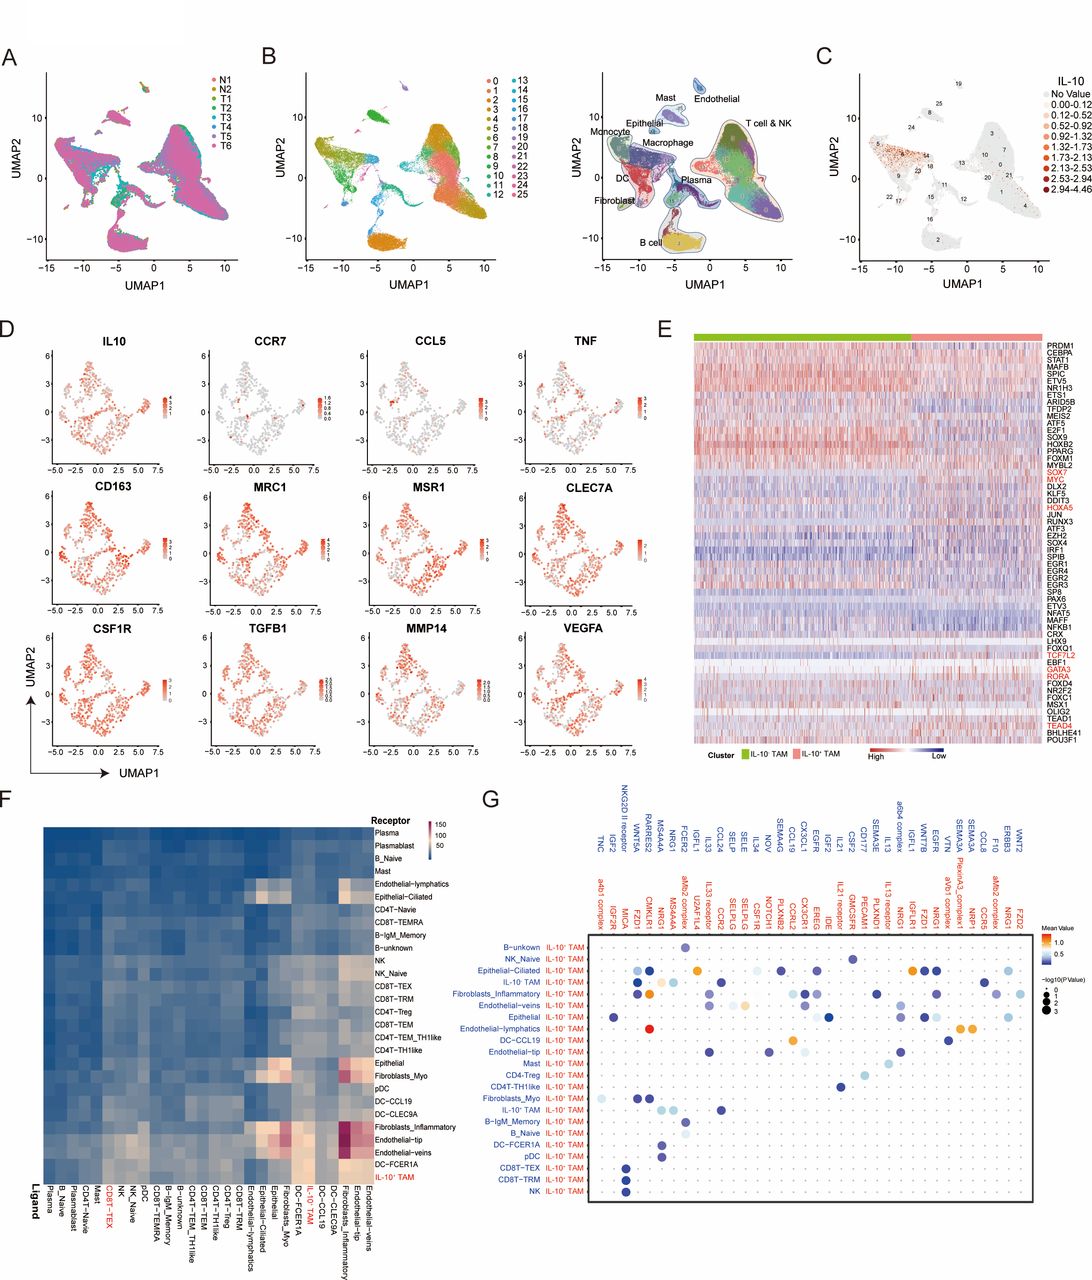
To further characterize the functional phenotype of IL-10+TAMs, we conducted single cell RNA sequencing (scRNA-seq) from 6 MIBC samples and two peritumor samples (figure 4A). Twenty-six cell clusters of 11 cell types identified could be visualized by a combined Uniform Manifold Approximation and Projection analysis (figure 4B). IL-10 has been found mainly expressed on macrophage across all cell types (figure 4C; cluster 6, 14 and 23). We preliminarily extracted the characteristics of IL-10+TAMs and investigated the expression of several macrophage landmarks on IL-10+TAMs. The results showed that M1 macrophage markers (including CCR7, CCL5 and TNF) were significantly downregulated, while M2 macrophage markers (including CD163, MRC1, MSR1, VTCN1, ARG1, TGFB1, MMP14 and EGF) were upregulated in IL-10+TAMs (figure 4D). Besides, several core transcription factor for M2 macrophage polarization including SOX7, MYC, HOXA5, TCF7L2, GATA3, RORA and TEAD4 were also enriched in IL-10+ TAMs compared with IL-10- TAMs by single-cell regulatory network inference and clustering (SCENIC) analysis24–26 (figure 4E). Importantly, to find a causative link between IL-10+ TAMs and exhausted T cells, we further conducted the cell communication analysis using scRNA-seq data and found a closed interaction between IL-10+TAMs and exhausted CD8+ T cells with CellPhoneDB27 (figure 4F). Of the ligand receptor pairs pertaining to IL-10+ TAMs and exhausted CD8+ T cells, NKG2D II receptor-MICA was significantly enriched in IL-10+ TAMs, implicating a potential role of IL-10+TAMs in remodeling CD8+ T cells functional status (figure 4G). In conclusion, IL-10+TAMs exhibited an immunesuppressive M2-like phenotype. These results demonstrated that the potential mechanistic evidence on the relationship between immunosuppressive IL-10+ TAMs and exhausted CD8+ T cells, which needs our further validation in the following study.

Characterization of IL-10+TAMs by scRNA-seq in MIBC. (A) UMAP plot showing the sources of collected scRNA-seq cell samples (6 tumors and two normal tissues). (B) UMAP plot showing 26 cell clusters of 11 cell types from collected samples. scRNA-seq analysis reveals substantial transcriptional heterogeneity within known immune populations. (C) UMAP plot showing IL-10 expression levels on 25 cell clusters. (D) UMAP plot showing expression levels of M1 and M2 macrophage markers on IL-10+TAMs. (E) Heat-map of the t values of AUC scores of expression regulation by transcription factors of the indicated clusters by single-cell regulatory network inference and clustering (SCENIC) analysis. (F) Heatmap showing the total number of interactions between cell types with CellPhoneDB analysis. (G) Bubble heatmap showing the interaction strength for selected ligand-receptor pairs on IL-10+TAMs and other cell subtypes with CellPhoneDB analysis. Dot size indicates p value, colored by interaction strength levels. MIBC, muscle-invasive bladder cancer; TAMs, tumor-associated macrophages; UMAP, Uniform Manifold Approximation and Projection.
Characterization of IL-10+TAMs infiltration across molecular features and therapeutic implication
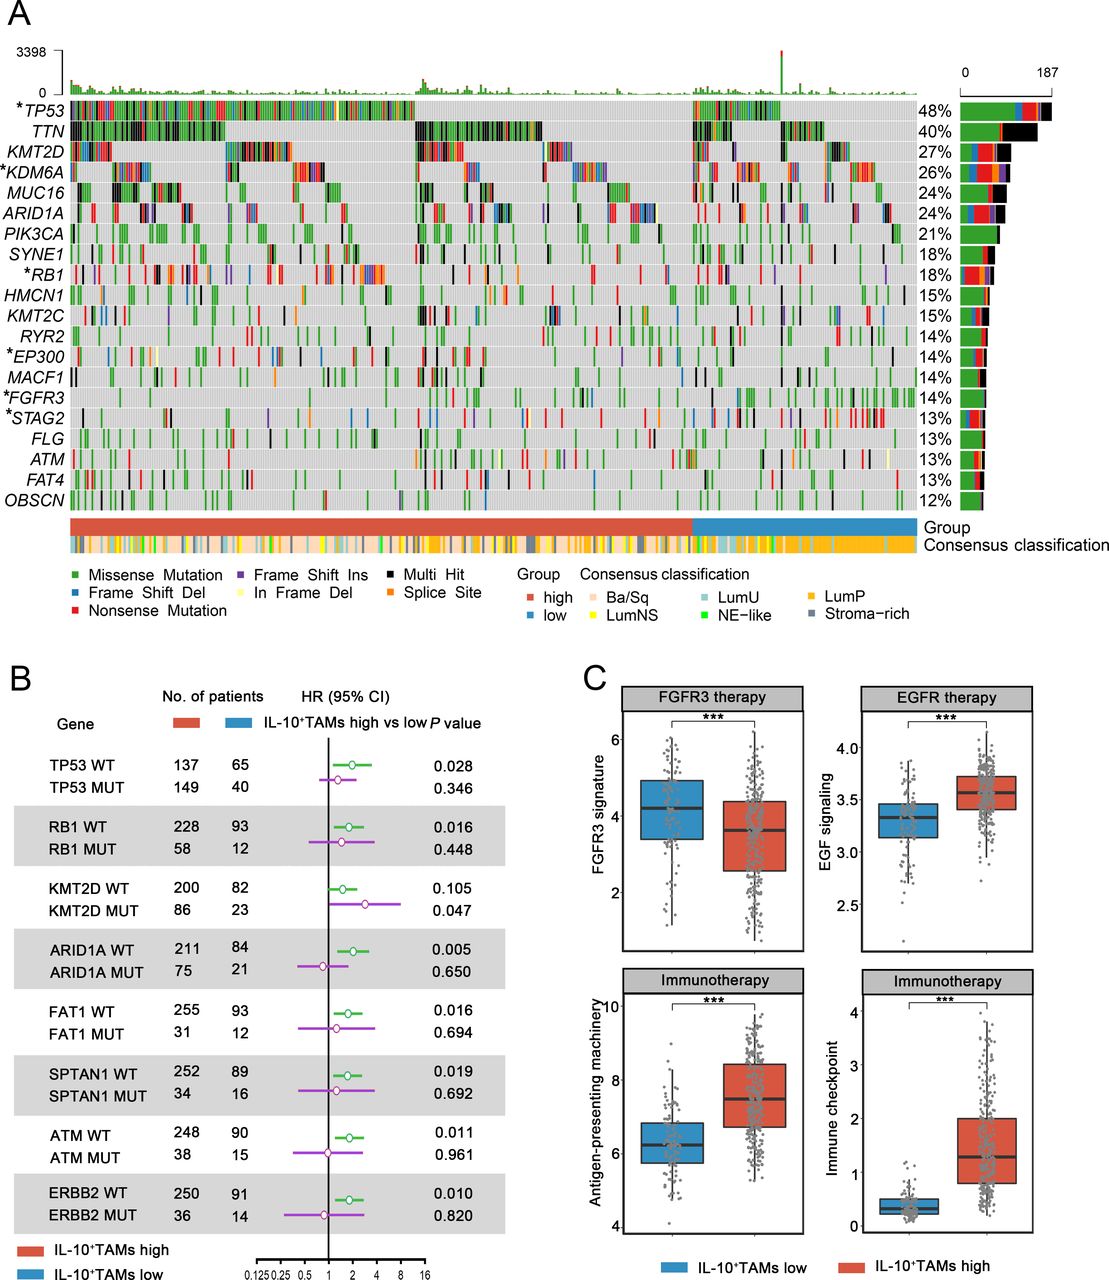
Molecular characteristics have proven to exert significant influence on the nature and progression of MIBC.28 We found that IL-10+TAMs were associated with distribution of different molecular subtypes of MIBC. In the oncoplot presenting the molecular landscape of MIBC, Ba/Sq accounted for the largest proportion among patients in IL-10+ TAMs high subgroup, while LumP was the predominant subtype among IL-10+ TAMs low subgroup in the TCGA cohort (figure 5A). Using R package BLCAsubtyping and an IHC subtyping method, we obtained molecular classification of patients in both TCGA and ZS cohort. We found that IL-10+TAMs infiltration correlated with basal status of MIBC. Basal subtype, being a major component in MIBC (39.9% in TCGA cohort, 30.5% in ZS cohort), was distributed mostly in IL-10+TAMs high subgroup in both ZS and TCGA cohort, supporting the intrinsic association between IL-10+ TAMs and basal status. 53.5% and 61.7% of patients in IL-10+TAMs high subgroup belong to basal subtype in TCGA and ZS cohort, while 95.2% and 94.1% of patients in low IL-10+TAMs subgroup belong to luminal subtype in TCGA and ZS cohort, respectively (supplemental figure 9). The mutation rate of crucial genes involved in MIBC was significantly different between IL-10+TAMs high and low subgroups, with more mutations of TP53, RB1 in the IL-10+TAMs high subgroup, which was typical of basal subtype. Meanwhile, mutants of KDM6A, STAG2 and FGFR3 were strongly enriched in the IL-10+TAMs low subgroup, which agreed with features of luminal subtype (figure 5A).

Characterization of IL-10+TAMs infiltration across molecular features and therapeutic implication. (A) Oncoplot showing the correlation between IL-10+TAMs signature level, tumor mutations and molecular subtypes of MIBC in TCGA cohort (n=391). Data were analyzed by χ2 test. (B) HR of mortality for patients with or without specific gene mutations according to IL-10+TAMs signature levels. (C) Comparisons of therapy-related gene signatures between IL-10+TAMs low and high subgroups in TCGA cohort (n=391). Data were analyzed by Mann-Whitney U test, and presented as median and IQR. *P<0.05, ***p<0.001. MIBC, muscle-invasive bladder cancer; TAMs, tumor-associated macrophages; TCGA, The Cancer Genome Atlas.
Subsequently, to assess whether IL-10+TAMs acted differently under the influence of certain tumor mutation, we performed Cox univariate analysis of IL-10+TAMs level in patients with or without specific gene mutation, and found that IL-10+TAMs abundance suggested higher HR in patients with wild-type TP53, RB1, ARID1A, FAT1, SPTAN1, ATM and ERBB2. Intriguingly, although IL-10+TAMs showed no impact on clinical outcomes among mutants for most genes, high IL-10+TAMs infiltration could be regarded as a prognostic risk factor only in KMT2D mutants, suggesting KMT2D mutation might be a crucial upstream molecular event that initiated or mediated IL-10+TAMs accumulation and their downstream mechanism (figure 5B).
In addition, we observed remarkably higher EGF signaling, antigen presenting and immune checkpoint signature scores in IL-10+TAMs high subgroup (EGF signaling: p<0.001; antigen-presenting machinery: p<0.001; immune checkpoint: p<0.001, figure 5C), implying that patients with higher IL-10+TAMs infiltration could be more sensitive to EGFR-targeted therapy and immunotherapy. In IL-10+TAMs low subgroup, a larger proportion of FGFR3 mutation and higher FGFR3 signature score (p<0.001) were observed, suggesting potential responsiveness to FGFR3-targeted therapy. Besides related signaling signatures, higher EGF expression and lower FGFR3 expression were observed in IL-10+TAMs high subgroup in terms of FPKM values in the TCGA cohort (EGF: p<0.001, FGFR3: p<0.001; supplemental figure 10A). We further verified these findings in ZS cohort by histologic staining. We performed IHC single staining of EGF and FGFR3 on formalin-fixed, paraffin-embedded TMA in ZS cohort. The results suggested that the expression level of EGF was elevated in IL-10+TAMs high subgroup, while FGFR3 expression was increased in IL-10+TAMs low subgroup (EGF: p<0.001, FGFR3: p<0.001; supplemental figure 10B). Accumulatively, IL-10+TAMs level was associated with specific therapy-related signatures, therefore indicating different sensitivities to assorted types of targeted therapies and immunotherapies.
Discussion
TAMs have proven to contribute to immunosuppression in TME. Through mediating cancer-related inflammation, TAMs could affect tumor progression and antitumor immunity.29 Heterogeneity of TAMs has been widely acknowledged, and the representative theory is the classification of activated macrophages as either classical (M1) or alternative (M2) phenotype.30 However, this classification system oversimplifies the complexity of TAMs, for TAMs are more of a dynamic spectrum than a simple collection of two distinct cell subgroups.
Based on our findings, IL-10+TAMs are a special subset of TAMs that infiltrate the TME and act as an immunosuppressive dictator, shaping an immunoevasive contexture in MIBC. We investigated that IL-10+TAMs exhibited an immunesuppressive M2-like phenotype in MIBC through scRNA-seq. A high level of IL-10+TAMs was associated with a state of high immune infiltration, with multiple immune cells enriched in the TME. However, immune effector cells (CD8+ T cells and NK cells) presented an exhausted or dysfunctional state, and therefore, could not play an active role in anti-tumor immunity. The secretion of IL-10 by TAMs also upregulated the expressions of a series of immune checkpoints and coinhibitory receptors (PD-L1, CTLA4, TIM-3, LAG-3, etc),4 which further validated the debilitated immune cytotoxic efficacy of effector cells. The clustering of mast cells and neutrophils have been found to contribute to the progression of tumor in MIBC.31 Mast cells within TME were previously reported to exert a pro-tumor impact via reducing activation of CD8+ T cells and M1 macrophages.32 Consistently, increased amount of mast cells and neutrophils were found to coexist with high infiltration of IL-10+TAMs, partially explaining the dysfunctional state of anti-tumor immunity in IL-10+TAMs high TME. In accordance with our other results, GO analysis suggested that multiple pathways related to negative regulation of immune response and immune cell activation were enriched.
In both TCGA and ZS cohort, we noted that patients with high IL-10+TAMs infiltration could benefit from ACT, while in low IL-10+TAMs subgroup ACT failed to improve patients’ prognosis. Chemotherapy drugs could choose TAMs as one of their targets, either killing TAMs via selective toxicity, or modulating macrophage responses to tumor,5 33 taming them toward a more M1-like phenotype.34 35 For example, cyclophosphamide could enhance the production of pro-inflammatory cytokines (IL-12, IL-6) and suppress secretion of protumoral M2-related cytokines, including but not limited to IL-10.36 ACT could also exert antitumor effect through reversing the impact of immunosuppressive cells (such as IL-10+TAMs in our study). Moreover, chemotherapy drugs interact with the immune contexture, stimulating the activation of immune effector cells or the inhibition of immunosuppressive factors via off-target effects.37 Therefore, responses to chemotherapy were found to correlate with or partially dependent on the local immune infiltrates.38 A poor CD8+ T cells to FOXP3+ cell ratio could predict a poor prognosis after receiving ACT in patients with breast cancer.39 40 According to our findings, patients with high IL-10+TAMs tend to present with a highly infiltrated immune contexture with accumulated dysfunctional immune cells. This could suggest a greater tumoricidal potential once ACT reversed the pre-existing immunosuppressive contexture and rekindled the cytotoxic ability of these once-incapacitated immune effector cells.
MIBC is a disease of heterogeneous nature characterized by genomic instability and high mutation rate.15 Different molecular subtypes in MIBC possess distinctive biological characteristics and clinical prognosis. In both TCGA and ZS cohorts, we found that high IL-10+ TAMs infiltration correlated with basal molecular subtypes of MIBC. The basal subtype is the most prevalent, characterized by a basal and squamous differentiation.15 Basal tumors express basal and stem cell markers such as KRT5/6, KRT14 and CD44, which are normally expressed by the basal or stem cell layer of the urothelium.41 Although prior studies found an immune-enriched TME with high infiltration of cytotoxic lymphocytes and natural killer (NK) cells, there were no studies digging into the infiltration and functional status of specific TAMs subtypes in basal type MIBC. Established evidence denotes that the immune infiltration was mainly found within basal tumors with STAT3 regulon activation, elevated HIF1A and downregulation of genes associated with urothelial differentiation such as FOXA1, GATA3 and PPARG.42 Since the activation of STAT3 is characteristic of IL-10 signal transduction in tumor-infiltrating cells,43 we speculated that IL-10 also involved in the formation and development of the basal subtype MIBC. Prior studies found that bladder cancer cells could upregulate PD-L1 expression of in monocytes/macrophages in an IL-10/STAT3-dependent fashion.44 As another main sources of IL-10 in MIBC, TAMs also played an essential role in the TME. Here we first investigated that IL-10+ TAMs contributed to an immunoevasive contexture with incapacitated immune effector cells including both CD8+ T cells and NK cells. It was reasonable to speculate that IL-10+ TAMs also correlate to the formation of the basal subtype MIBC, which needs for our further investigation.
KMT2D is a gene encoding the lysine-specific histone methyltransferase. In a previous study pertaining to B cell lymphoma, IL-10-induced genes were identified as KMT2D’s target genes.45 Here, we found that high IL-10+TAM infiltration became a significant risk factor in the background of KMT2D mutation, suggesting that KMT2D mutation could be an upstream driving event at the genomic level, which initiated the specific differentiation or polarization of TAMs, guiding them towards a protumoral IL-10-secreting M2-like subset. An earlier study has identified KMT2D as a major modulator of ICI response, for the reason that KMT2D deficiency sensitizes tumors to ICI by augmenting tumor immunogenicity.46 These results implied that IL-10+TAMs might be a crucial intermediary agent between upstream tumor mutation and downstream immune contexture alteration, such as upregulation of immune checkpoints and dysfunction of effector cells.
The limitations of this study are the following. The retrospective design of our study needs future prospective studies to provide validation. Besides, the cut-off values were determined by minimum p value approach. Although this method can evaluate the optimal threshold of IL-10+TAMs based on the length of OS and dichotomize biomarkers, its limitation lies in its potential non-repeatability for identifying patients with different IL-10+TAMs level.
In summary, this study identified a special IL-10 positive subset of TAMs in MIBC, and discovered their association with unfavorable clinical prognosis but superior responsiveness to ACT. IL-10+TAMs contributed to an immunosuppressive contexture in TME, resulting in the dysfunctional state of immune cytotoxic cells. Through combined analyses of IL-10+TAMs and molecular features of MIBC, we discovered possible upstream driving event and downstream signaling pathway alteration pertaining to IL-10+TAMs infiltration level, which provided a deeper insight into personalized approach to EGFR-targeted therapy, FGFR3-targeted therapy as well as immunotherapy. The potential of IL-10+TAMs and their regulating factors as therapeutic targets in MIBC would be another fruitful area for further work.
Supplemental material
Data availability statement
Data are available on reasonable request. All data generated that are relevant to the results presented in this article are included in this article. Other data that were not relevant for the results presented here are available from the corresponding author JX on reasonable request.
Ethics statements
Patient consent for publication
Ethics approval
This study was approved by the Clinical Research Ethics Committee of Zhongshan Hospital, Fudan University (No. B2015-030). Participants gave informed consent to participate in the study before taking part.
Acknowledgments
We thank Dr Lingli Chen (Department of Pathology, Zhongshan Hospital, Fudan University, Shanghai, China) and Dr Yunyi Kong (Department of Pathology, Fudan University Shanghai Cancer Center, Shanghai, China) for their excellent pathological technology help.
References
Footnotes
YX, HZ, KJ and ZL contributed equally.
Contributors YX, HZ, KJ and ZL for acquisition of data, analysis and interpretation of data, statistical analysis and drafting of the manuscript; YZ and LX for technical and material support; ZW, YC and JX for study concept and design, analysis and interpretation of data, drafting of the manuscript, obtained funding and study supervision; JX as the guarantor for this study. All authors read and approved the final manuscript.
Funding This study was funded by grants from National Natural Science Foundation of China (31770851, 81872082, 82002670, 82103408), Shanghai Municipal Natural Science Foundation (19ZR1431800, 22ZR1413400), Shanghai Sailing Program (18YF1404500, 21YF1407000), Shanghai Municipal Commission of Health and Family Planning Program (201840168) and Fudan University Shanghai Cancer Center for Outstanding Youth Scholars Foundation (YJYQ201802).
Disclaimer All these study sponsors have no roles in the study design, in the collection, analysis and interpretation of data.
Competing interests None declared.
Provenance and peer review Not commissioned; externally peer reviewed.
Supplemental material This content has been supplied by the author(s). It has not been vetted by BMJ Publishing Group Limited (BMJ) and may not have been peer-reviewed. Any opinions or recommendations discussed are solely those of the author(s) and are not endorsed by BMJ. BMJ disclaims all liability and responsibility arising from any reliance placed on the content. Where the content includes any translated material, BMJ does not warrant the accuracy and reliability of the translations (including but not limited to local regulations, clinical guidelines, terminology, drug names and drug dosages), and is not responsible for any error and/or omissions arising from translation and adaptation or otherwise.