Article Text

Abstract
Background The efficacy of immunotherapies in metastatic melanoma depends on a robust T cell infiltration. Oncogenic alterations of tumor cells have been associated to T cell exclusion. Identifying novel cancer cell-intrinsic non-genetic mechanisms of immune escape, the targeting of which would reinstate T cell recruitment, would allow to restore the response to anti-programmed cell death protein 1 (PD-1) antibody therapy. The epithelial-to-mesenchymal transition (EMT)-inducing transcription factor ZEB1 is a major regulator of melanoma cell plasticity, driving resistance to mitogen-activated protein kinase (MAPK) targeted therapies. We thus wondered whether ZEB1 signaling in melanoma cells may promote immune evasion and resistance to immunotherapy.
Methods We evaluated the putative correlation between ZEB1 expression in melanoma cells and the composition of the immune infiltrate in a cohort of 60 human melanoma samples by combining transcriptomic (RNA-sequencing) and seven-color spatial multi-immunofluorescence analyses. Algorithm-based spatial reconstitution of tumors allowed the quantification of CD8+, CD4+ T cells number and their activation state (PD-1, Ki67). ZEB1 gain-of-function or loss-of-function approaches were then implemented in syngeneic melanoma mouse models, followed by monitoring of tumor growth, quantification of immune cell populations frequency and function by flow cytometry, cytokines secretion by multiplex analyses. Chromatin-immunoprecipitation was used to demonstrate the direct binding of this transcription factor on the promoters of cytokine-encoding genes. Finally, the sensitivity to anti-PD-1 antibody therapy upon ZEB1 gain-of-function or loss-of-function was evaluated.
Results Combined spatial and transcriptomic analyses of the immune infiltrates in human melanoma samples demonstrated that ZEB1 expression in melanoma cells is associated with decreased CD8+ T cell infiltration, independently of β-catenin pathway activation. ZEB1 ectopic expression in melanoma cells impairs CD8+ T cell recruitment in syngeneic mouse models, resulting in tumor immune evasion and resistance to immune checkpoint blockade. Mechanistically, we demonstrate that ZEB1 directly represses the secretion of T cell-attracting chemokines, including CXCL10. Finally, Zeb1 knock-out, by promoting CD8+ T cell infiltration, synergizes with anti-PD-1 antibody therapy in promoting tumor regression.
Conclusions We identify the ZEB1 transcription factor as a key determinant of melanoma immune escape, highlighting a previously unknown therapeutic target to increase efficacy of immunotherapy in melanoma.
Trial registration number NCT02828202.
- melanoma
- tumor escape
- tumor microenvironment
- lymphocytes
- tumor-infiltrating
- immunotherapy
Data availability statement
Data are available in a public, open access repository. All data relevant to the study are included in the article or uploaded as supplementary information. RNA-Seq data have been deposited in the GEO repository under accession number GSE169203. Other data relevant to the study are included in the article or uploaded as supplementary information.
This is an open access article distributed in accordance with the Creative Commons Attribution Non Commercial (CC BY-NC 4.0) license, which permits others to distribute, remix, adapt, build upon this work non-commercially, and license their derivative works on different terms, provided the original work is properly cited, appropriate credit is given, any changes made indicated, and the use is non-commercial. See http://creativecommons.org/licenses/by-nc/4.0/.
Statistics from Altmetric.com
Introduction
Metastatic melanoma treatment has recently made headway with the advent of targeted therapies (BRAF+MEK inhibitors for BRAFV600-mutated melanoma) and immunotherapies (anti-CTLA4 and anti-programmed cell death protein 1 (PD-1) antibodies). However, resistance to targeted therapies invariably occurs. Whereas sustained responses may be observed with anti-PD-1 antibody therapy,1 2 around 60% of patients still do not respond favorably to these treatments or may develop resistance. Therefore, a complete understanding of cellular and molecular mechanisms underlying phenotypic adaptations, and thus, the exceptional capacity of melanoma cells to develop resistance to current therapeutic strategies, is required in order to propose new combination therapies.
Mechanisms of resistance to targeted therapies have been extensively studied in recent years, providing proof that in parallel to genomic alterations, development of resistance can be attributed to phenotypic adaptations through transcriptional and epigenetic processes.3–5 The mechanisms of resistance to immunotherapies targeting inhibitory immune checkpoints rely both on immune cell and tumor cell characteristics.6 Aside from an inefficient CD8+ T cell response, other immune parameters, such as the presence of regulatory T cells (Tregs), myeloid-derived suppressor cells, M2 macrophages (ΜΦ), and other inhibitory immune checkpoints, may contribute to inhibiting antitumor immune responses. Tumor cell-intrinsic mechanisms of resistance have been associated with genetic alterations (JAK1/2 mutations), which decrease interferon γ (IFN-γ) sensitivity of melanoma cells. Oncogenic alterations leading to WNT/β-catenin pathway activation,7 8 or to loss of PTEN expression,9 have been associated to T cell exclusion. Recent evidence suggests that resistance to immunotherapy may also rely on transcriptomic/phenotypic alterations of tumor cells. The EZH2 histone methyltransferase or the growth factor Midkine MDK were for example reported to be implicated in resistance to melanoma immunotherapy.10 11 A major challenge is thus to identify novel cancer cell-intrinsic non-genetic mechanisms of immune escape, the targeting of which would reinstate T cell recruitment and restore the response to anti-PD-1 antibody therapy.
Melanomas display a high degree of intertumoral and intratumoral heterogeneity, as evidenced by gene expression analyses of tumors at the single cell level.12 13 Melanoma plasticity relies on a phenotypic switch between a proliferative/differentiated and an invasive/stem-like state.14–16 In this context, loss of Microphthalmia-associated Transcription Factor (MITF), the master regulator of melanocyte differentiation, induces the reprogramming of melanoma cells toward an invasive and stem-like phenotype.17 We previously showed that the epithelial–mesenchymal transition (EMT)-inducing transcription factor (EMT-TF), ZEB1,18 19 regulates phenotype switching toward a MITFlow invasive and stem-like state20 and favors the acquisition of resistance to mitogen-activated protein kinase (MAPK)-targeted therapies in melanoma.21 Hence, we wondered whether ZEB1 intrinsic signaling in melanoma cells may promote immune evasion of melanoma cells and the remodeling of the immune microenvironment. Indeed, EMT factors have been reported to contribute to immune evasion in carcinoma (non-small cell lung cancer and breast cancer).22 23 This question remained to be precisely addressed in the context of melanoma, given EMT-TFs cell-type specific roles.24 25
We thus studied the crosstalk of tumor cells with the immune microenvironment in human melanoma samples by combining transcriptomic and spatial multi-immunofluorescence analyses and demonstrated that ZEB1 expression in melanoma cells is associated with decreased CD8+ T cell infiltration. ZEB1 gain-of-function or loss-of-function approaches were then implemented in melanoma mouse models and showed that ZEB1 regulates tumor growth by controlling CD8+ T cell recruitment in the tumor. Moreover, Zeb1 knock-out, by promoting CD8+ T cell infiltration, synergizes with anti-PD-1 antibody therapy in promoting tumor regression.
Methods
Human tumor samples
Melanoma tumor samples were obtained through the Biological Resource Center of the Lyon Sud Hospital (Hospices Civils de Lyon) and were used with the patient’s written informed consent. This study is registered in ClinicalTrial.gov (MelBase). A first cohort of 60 cutaneous melanoma patients was used for RNA-Seq and multi-immunofluorescence analyses. All melanoma biopsies were cutaneous, either primary melanoma or cutaneous metastases. All samples were biopsied at baseline, before any treatment. Patient clinical information are available in online supplemental table 1. Stainings were validated by two independent pathologists. A validation cohort of 22 melanoma patients previously stained and scored for ZEB1 expression21 was used to validate the inverse correlation with CD8+ T cell infiltrate by immunohistochemical stainings (IHC).
Supplemental material
RNA sequencing analyses
RNA was extracted from FFPE sections with the RNeasy FFPE Kit (Qiagen). Libraries were prepared from 100 ng RNA with the TruSeq RNA exome kit (Illumina), and sequencing was performed on the CLB genomic platform, on Illumina NextSeq or Novaseq machines with a paired-end protocol (2×75 bp, 64Mp reads). Raw sequencing reads were aligned on the human genome (GRCh38) with STAR (V.2.7.3a), with the annotation of known genes from gencode V.33. Gene expression was quantified using Salmon (V.1.1.0) and the annotation of protein coding genes from gencode V.33. RNA-seq quality controls and analyses were performed on the Gilles Thomas Bioinformatics platform as detailed in online supplemental material and methods. ZEB1 mRNA expression (TPM) was also analyzed in the melanoma single cell RNA-Seq data set from Jerby-Arnon et al.26
Seven-color immunofluorescence multiplex stainings and digital image analyses
Three micrometer tissue sections were cut from formalin-fixed paraffin-embedded human melanoma specimens. The sections underwent immunofluorescence staining using the OPAL technology (Akoya Biosciences) on a Leica Bond RX. A seven-color panel (online supplemental table 2) was designed. DAPI was used for nuclei detection. Sections were digitalized with a Vectra Polaris scanner (Perkin Elmer, USA). An autofluorescence treatment of images was carried out using the Inform software (Perkin Elmer). A blinded evaluation of the staining was carried using the HALO Image Analysis Software (Indica Labs). Tumors were phenotyped based on SOX10, CD8, and CD4 expression using the HighPlex module in respectively four phenotypes: melanoma cells expressing SOX10, CD8+ cells, CD4+ cells and other cells expressing none of the SOX10, CD8, or CD4 marker. The matrix of phenotype containing the X and Y positions of each cell, as well as the mean nuclear, cytoplasmic and membrane intensities of each fluorescence staining was then further analyzed using the R software. Tumors were spatially reconstituted using the R plot() function. For CD8, a cut-off (<1.5% of total nuclei) was applied to define the ‘immune desert’. The localization of CD8+ T cells was analyzed in more details thanks to an R-based spatial reconstitution of tumors and defined as marginal to the tumor or intratumoral, allowing the tumors to be classified as ‘excluded’ or ‘infiltrated’, respectively. Melanoma cells were classified following their nuclear expression level of ZEB1. A cut-off of at least 15% of melanoma cells expressing high nuclear expression level of ZEB1 (intensity >3) was applied to define ZEB1high melanoma.
Immunohistochemical stainings
For the validation cohort, sections underwent immunohistochemical staining with an antibody against CD8, using steam heat-induced epitope retrieval, the Ventana Benchmark XT platform (Ventana-Roche Tissue Diagnostics, Meylan France) and DAB detection. The number of CD8+ cells was quantified using the HALO Image Analysis Software (Indica Labs).
Cell culture and reagents
Br16M3, Br25F4, and Br42M6 mouse melanoma cell lines were established from tumors arising from the LSL-BrafV600E;Tyr::CreERT2+/o mouse model.27 NR6.1 mouse melanoma cell line was established from melanoma bearing Tyr:NRASQ61K mice that were backcrossed on C57BL/6 J28. BrafV600E mutation was induced in melanocytes by administrating Tamoxifen (Sigma) on the back skin. Established Br16M3, Br25F4, Br42M6, and NR6.1 mouse melanoma cell lines were then cultured in RPMI 1640 Glutamax (61870044, Life Technologies) complemented with 10% FBS (Cambrex) and 100 U/mL penicillin-streptomycin (15140148, Gibco). The absence of Mycoplasma contamination was checked every 3 weeks with the MycoAlert detection kit (LT07-318, Lonza).
Viral infections
For ZEB1 overexpression using retroviral infection, Platinum-E Retroviral Packaging cells PLAT-E (4×10⁶) were transfected with retroviral expression constructs (10 µg) using Genejuice (Millipore). HA-Zeb1 in a pBabe-puro vector was previously described20. For Zeb1 knock-out, human embryonic kidney 293 T cells (4×10⁶) were transfected with lentiviral expression constructs (10 µg) in combination with GAG-POL (5 µg) and ENV expression vectors (10 µg). The constructs allowed the insertion in an all-in-one manner of the Cas9 nuclease and the guide RNA in a pLenti-Puro vector (pLenti-All-in-one-U6-sgRNA mouse Zeb1 or scramble -SFFV-Cas9 nuclease-2A-Puro) (Applied Biological Materials Inc, Richmond, Canada). The sequence of the sgRNA targeting ZEB1 are the following: 5′-GCCTCTATCACAATACGGGC-3′ (F=forward), 5′-GCCCGTATTGTGATAGAGGC-3′ (R=reverse). Viral supernatants were collected 48 hours post-transfection, filtered (0.45 µm membrane) and placed in contact with 2×10⁶ melanoma cells for 8 hours in the presence of 8 µg/mL polybrene. Forty-eight hours postinfection, cells were selected in the presence of puromycin (1 µg/mL) (Invitrogen). Knock-out clones were screened by western blot and Sanger sequencing.
For CXCL10 overexpression in ZEB1-overexpressing cells, human embryonic kidney 293 T cells (4×10⁶) were transfected with lentiviral expression constructs (10 µg) in combination with GAG-POL (5 µg) and ENV expression vectors (10 µg). Cxcl10 (NM_021274) Mouse Tagged ORF Clone – MR200291L2 plasmid used were tagged with mGFP (OriGene Technologies, Inc, Rockville, US). Viral supernatants were collected 48 hours post-transfection, filtered (0.45 µm membrane) and placed in contact with 2×10⁶ melanoma cells for 8 hours in the presence of 8 µg/mL polybrene. Forty-eight hours postinfection, cells were selected by GFP sorting (S3e Cell Sorter, Bio-Rad).
Mouse injections
Experiments using mice were performed in accordance with the animal care guidelines of the European Union and French laws and were validated by the local Animal Ethic Evaluation Committee and the French MESRI (CECCAPP-2018–022 #17220). Mice were housed and bred in a specific pathogen-free animal facility ‘AniCan’ at the CRCL, Lyon, France. Single cell suspensions of Br16M3, Br25F4, Br42M6 and NR6.1 cell models (1–3 × 10⁶ cells), in phosphate buffered saline (PBS)/Matrigel (BD Biosciences, Oxford, UK) (1/1) were injected subcutaneously into the flank of 6-week-old male C57BL/6 J mice (Charles River laboratories). RAG2 KO (kindly provided by Julien Marie) were bred in house. Five mice were included in each experimental group, in separate cages. No randomization was done. ZEB1 status was blinded until the end of the experimental procedure. Tumor growth was monitored for 2–6 weeks postinjection. Tumors grew up to 1.5 cm in diameter, at which point animals were euthanized. For anti-PD-1 treatment, 5 days after injection, mice were treated with intraperitoneal injection of 200 µg of anti-PD-1 rat antimouse PD-1 clone RMP1-14 (BP0146, Bio X Cell) or with the control isotype three times every 2–3 days.
IHC staining analyses of mouse tumor samples
Tumors were embedded in paraffin, and ZEB1 staining was performed using the anti-ZEB1 antibody (IHC-00419, 1/500, Bethyl) as well as the anti-CD8 antibody (clone 4SM15, 14-0808-82, 1/500, Invitrogen), the anti-CD4 antibody (clone 4SM95, 14-9766-82, 1/1000, Invitrogen), DAB (brown) or purple chromogen (for heavily pigmented tumors) detection and counterstaining with hematoxylin. Images were digitalized with a 3DHistech Pannoramic SCAN2 scanner on the Research Pathology Platform (CRCL). Quantification was done with HALO Image Analysis Software (Indica Labs).
Mouse tumors sample immunophenotyping using flow cytometry
Tumors were dissociated, digested 20 min at 37°C in a digestion medium composed of DNaseI type II (D4527, 10 µg/mL, Sigma), Collagenase A (COLLA-RO 11088793001, 2 mg/mL, Sigma) in RPMI complemented with 2% FBS and filtered using MACS SmartStrainer 70 µm (Miltenyi). Dying cells were first stained using the Fixable Viability Dye eFluor 506 (65-0866-18, 1/400, eBioscience) for 20 min at room temperature in the dark. 1.106 cells per condition were then stained for extracellular markers for 1 hour at 4°C in the dark (online supplemental table 3). After three washes in PBS complemented with 0.5 mM EDTA and 2% FBS, streptavidin staining was performed for 20 min at 4°C in the dark. After three washes, cells were fixed and permeabilized for 40 min at 4°C in the dark (Foxp3/Transcription Factor Staining Buffer Set, 00–5523, eBioscience). After one wash in the permeabilizing buffer, cells were stained for intracellular staining overnight at 4°C in the dark. After three washes in permeabilizing buffer, cells were then counted on a BD LSRFortessa Flow Cytometer (BD Biosciences-IN). Data were analyzed using the FlowJo V.10 software.
Cytokine quantification in the supernatant of cell cultures or dilacerated tumors
For in vitro supernatants, 15 000 cells per wells were cultured in 96-well plate for 5 days in RPMI complemented with 10% FBS and 100 U/mL penicillin-streptomycin. For in vivo supernatant of dilacerated tumors, C57BL6/J mice were euthanized 14 days after subcutaneous injection of melanoma mouse cell lines; tumors were dissected and dissociated in RPMI complemented with 2% FBS at the concentration of 500 mg tumor per mL. Supernatant of dilacerated tumors were centrifuged at 1000 RPM 5 min and stored at −80°C. EPO, GM-CSF, IFN-γ, IL-1β, IL-2, IL-4, IL-5, IL-6, IL-9, IL-10, IL-12/IL-23p40, IL-12p70, IL-13, IL-15, IL-16, IL-17A, IL-17A/F, IL-17C, IL-17E/IL-25, IL-17F, IL-21, IL-22, IL-23, IL-27p28/IL-30, IL-31, IL-33, IP-10, KC/GRO, MCP-1, MIP-1α, MIP-1β, MIP-2, MIP-3α, TNF-α, VEGF-A, and TGF-β isoforms 1, 2 and 3 quantities were measured using the Meso Scale Diagnostics technology (K15083K, U-PLEX Biomarker Group 1 (ms) 35-Plex and K15242K, U-PLEX TGF-β Combo (ms)).
Immunoblot analyses
Cells were washed twice with PBS containing CaCl2 and then lysed in a 100 mM NaCl, 1% NP40, 0.1% SDS, 50 mM Tris pH 8.0 RIPA buffer supplemented with a complete protease inhibitor cocktail (Roche, Mannheim, Germany) and phosphatase inhibitors (Sigma-Aldrich). ZEB1-, MITF- and PTEN- protein expressions were examined by western blot (See online supplemental table 4 for antibody references). Loading was controlled using anti-GAPDH. Horseradish peroxidase-conjugated goat antirabbit polyclonal antibodies (Glostrup) was used as secondary antibodies. Western blot detections were conducted using the Luminol reagent (Santa Cruz). Western Blot Digital Imaging was performed with ChemiDoc MP Imager (Bio-Rad).
Reverse transcription quantitative-PCR (RT-Q-PCR)
Total RNA was isolated using RNeasy Kit (QIAGEN) and reverse transcribed using a high cDNA capacity reverse transcription kit following the manufacturer’s instructions (Fisher Scientific). Real-time PCR intron-spanning assays were designed using the ProbeFinder software (Roche). All reactions, including no-template controls and RT controls were performed in triplicate on a CFX96 (Bio-Rad) and were analyzed with the Bio-Rad CFX manager software. Mouse HPRT1 was used for normalization. The primers are described in online supplemental table 5.
Chromatin immunoprecipitation
The ChIP assay was carried out according to the protocol from the iDeal ChIP-Seq Kit for Transcription Factors (Diagenode, Denville, New Jersey, USA). Briefly, Br16M3 cells from one 15 cm dish were cross-linked with 1% formaldehyde at RT for 10 min and quenched in 125 mM glycine for 5 min. The cross-linked chromatin was isolated and sonicated to generate DNA fragments averaging 200–500 bp in length by Bioruptor plus sonication device (Diagenode). Chromatin fragments were immunoprecipitated with antibodies directed against Zeb1 (1 µg, Genetex, GTX105278), or IgG (1 µg, Bio-Rad, PRABP01) as negative control. Immunoprecipitated DNA was purified and dissolved into 50 µL of H2O and finally analyzed by qPCR. Primers were specified to amplify genomic DNA from a region flanking the transcriptional starting site −500 bp to +100 bp devoid of local CpG islands (from Zingg et al, 2017, online supplemental table 6). Relative promoter enrichment was normalized to chromatin inputs.
Data availability
RNA-Seq data have been deposited in the GEO repository under accession number GSE169203.
Statistical analyses
Statistical analyses were performed using GraphPad Prism V.8 software (GraphPad Software, Inc, San Diego, California, USA) or R software (V.3.6.1). All experiments were performed at least in triplicate. Data are presented as mean±SD or ±SEM as specified in the figure legends. To assess significant correlation between signatures, a Pearson’s correlation coefficient was performed. To determine significant differences between two groups, parametric data were analyzed using a t-test or Mann-Whitney test. All statistical tests were two tailed. The p values obtained were considered significant <0.05. Heatmaps were generated with Excel.
Results
High ZEB1 expression in tumor cells is associated with decreased CD8+ T cell infiltration in human melanoma samples
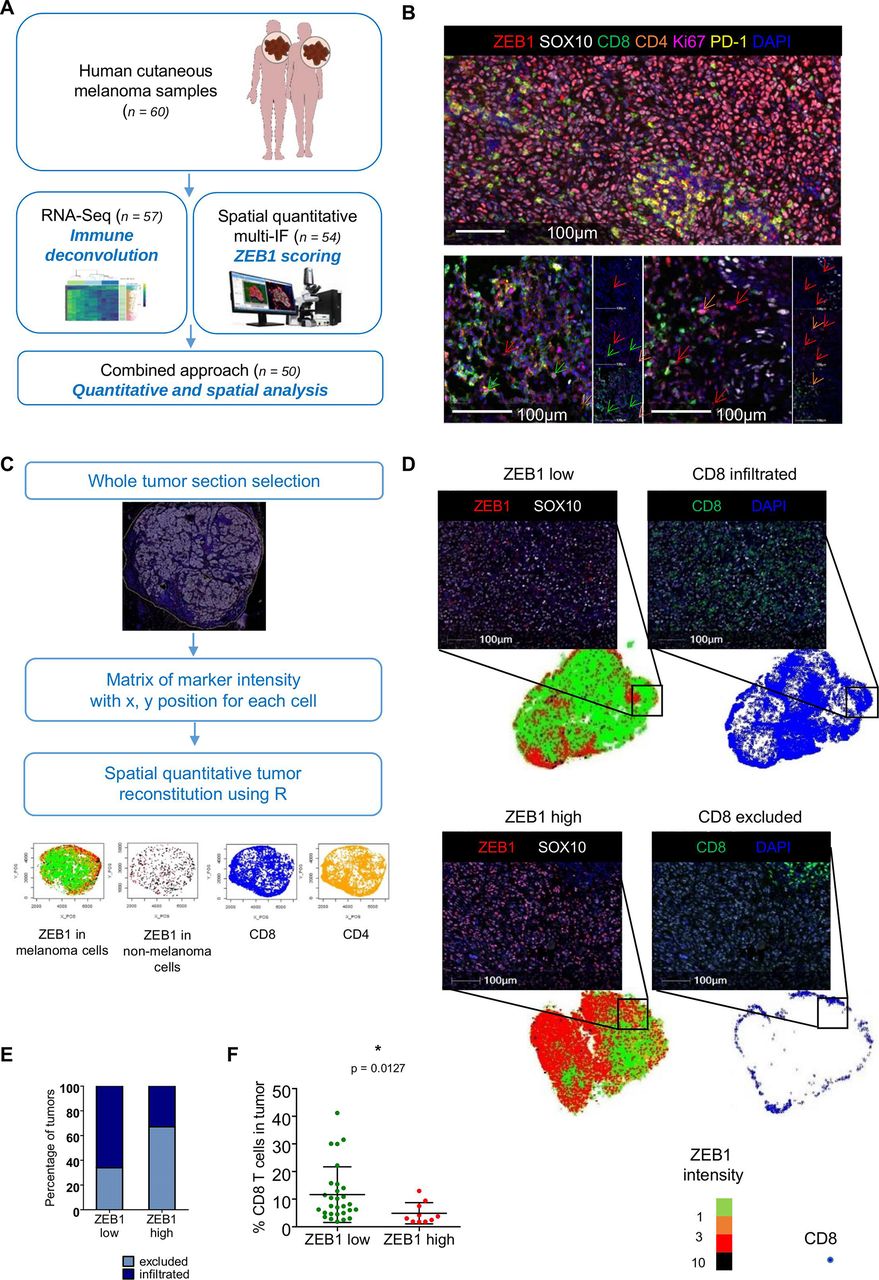
In order to investigate the putative correlation between ZEB1 expression in melanoma cells and the composition of the immune infiltrate, we analyzed 60 samples from a cohort of melanoma patients (figure 1A). Only cutaneous biopsies were selected, either primary tumors or cutaneous metastases, excluding lymph node metastasis to avoid contamination with immune cells (table 1 and online supplemental table 1). Bulk RNA-sequencing (RNA-seq) was performed on the FFPE samples from this cohort (n=57; 3 samples did not pass the RNA quality control). To estimate the relative abundance and diversity of the different immune cells present in the tumor biopsies, deconvolution of immune cells was performed with MCP Counter and Quantiseq algorithms. ZEB1 expression was associated with an increase in overall immune infiltration (p=0.0225, online supplemental figure 1A) and was strongly correlated with cancer-associated fibroblast (CAF), endothelial cell, neutrophil, myeloid dendritic cell (R>0.5, p<0.0005), and NK cell scores (R=0.3, p<0.05) (online supplemental figure 1B). This is consistent with the observation that ZEB1 is expressed by tumor cells and by stromal cells, endothelial cells, and some immune cell subsets.29 Reanalysis of the published scRNA-Seq dataset from Jerby-Arnon et al26 consistently revealed that ZEB1 is expressed by almost 50% of CAFs and endothelial cells, about 20% of T cells, 15% of B cells, 10% of macrophages, and 8% of NK cells (online supplemental figure 1C). Hence, any conclusions drawn regarding a putative correlation between ZEB1 expression and immune subsets (online supplemental figure 1B) may have been severely biased in these conditions, thus pointing to the requirement of spatial analyses of tumors.
Supplemental material

High ZEB1 expression in tumor cells is associated with decreased CD8+ T cell infiltration in a cohort of human melanoma samples. (A) Schematic diagram of the RNA-seq and spatial multi-immunofluorescence (multi-IF) analyses of human cutaneous melanoma samples. (B) Representative pictures of multi-immunofluorescence opal staining for ZEB1 (red), SOX10 (white), CD8 (green), CD4 (orange), Ki67 (magenta) and PD-1 (yellow). Blue: DAPI. Scale bar=100 µm. ZEB1-expressing CD8, CD4, and stromal cells are indicated with green, orange and red arrows, respectively. (C) Schematic representation of digital image analyses pipeline and tumor reconstruction. The entire tumor sections were selected for the analysis. Each cell was detected based on the nucleus and associated with a phenotype based on the expression of SOX10 (melanoma cell), CD8 (CD8+ T cells), and CD4 (CD4+ T cells). For each cell, both the location and immunofluorescence intensities of each markers were stored in a so-called phenotype matrix. Tumors were then reconstructed, and quantification was performed using the R software. (D) Whole tumor regions were spatially reconstituted using the R software. Melanoma cells are represented using a color gradient (green, orange, red, and black) corresponding to ZEB1 nuclear intensity in melanoma cells (respectively <1; (1;3); (3;10); >10). Spatial reconstitution of CD8 localization is represented with blue dots. The black insets correspond to representative pictures of multi-IF opal staining for ZEB1 (red), CD8 (green), and SOX10 (white) of a ZEB1 low/CD8 infiltrated (upper panel) and a ZEB1 high/CD8 excluded (lower panel) tumor. Blue: DAPI. Note that in the ZEB1 low tumor, ZEB1 high cells are not melanoma SOX10-positive cells. Scale bars=100 µm. (E) Stacked bar representing the percentage of CD8 excluded (light blue) and CD8 infiltrated (dark blue) tumors within ZEB1 low and ZEB1 high tumors. (F) Percentage of CD8 T cells as quantified by IF in ZEB1 low (green: n=28) and ZEB1 high (red: n=10) tumors (mean with SD, Mann-Whitney test).
: Clinical parameters of melanoma patients
In order to analyze ZEB1 expression specifically in tumor cells, we thus performed multi-immunofluorescence staining of these cutaneous melanoma samples. A seven-color panel was designed to perform spatial analyses of both ZEB1 expression in tumor cells (defined by the expression of the SOX10 marker) and the adaptive immune response, namely T cell infiltration (CD8 and CD4) and function (assessed by the expression of the PD-1 immune checkpoint and the Ki67 proliferation marker) (figure 1B). Quantifications were performed on whole tumor sections in order to take into account intratumor heterogeneity. The intensity of expression of each marker together with the x, y position of each cell, was extracted into a matrix, enabling spatial reconstitutions using a R-based algorithm (figure 1C). Quantification of the percentage of ZEB1-expressing cells among SOX10-positive melanoma cells (online supplemental figure 2A) enabled us to segregate tumors in ZEB1high (n=13) and ZEB1low (n=41) subgroups, based on their tumor cell-intrinsic expression (figure 1D). ZEB1 tumor cell expression was poorly correlated with the ZEB1 score defined by bulk RNA-seq. The presence of ZEB1high stromal and endothelial cells (figure 1B) was responsible of a misclassification of many tumors when analyzed as bulk (online supplemental figure 2B). Indeed, a significant proportion of tumors classified as ZEB1high according to bulk RNA-seq data, displayed no or low levels of ZEB1 expression in tumor cells. Spatial analyses, by excluding ZEB1-expressing endothelial cells, CAFs, and immune cells from the microenvironment, thus enable to reliably stratify tumors according to their tumor cell-intrinsic expression of ZEB1.
We then analyzed the level of immune infiltration by focusing on CD8+ T lymphocytes. CD8+ T cell quantification was performed as a percentage of CD8+ cells among total nuclei in the tumor zone. A cut-off (CD8+ T cell % among total nuclei <1.5%) was applied to define the ‘immune desert’. The localization of CD8+ T cells was analyzed in more details thanks to the R-based spatial reconstitution of tumors and defined as marginal to the tumor or intratumoral, allowing the tumors to be classified as ‘excluded’ or ‘infiltrated’, respectively (figure 1C–E and online supplemental table 1). Poorly infiltrated tumor samples (CD8+ T cell excluded pattern) were enriched in ZEB1high melanoma cells compared with infiltrated tumors (38% vs 14%) (online supplemental figure 3A). Sixty-seven per cent of ZEB1high tumors presented a CD8+ T cell excluded pattern, compared with only 38% of ZEB1low tumors (figure 1E). Overall, combined spatial and quantitative analyses demonstrated a significantly lower infiltration of ZEB1high tumors by CD8+ T cells, compared with ZEB1low tumors (p=0.0127) (figure 1F).
We then characterized the function of CD8+ T cells, through the quantification of the expression of the PD-1 immune checkpoint and the Ki67 proliferation marker. Interestingly, quantification of PD-1 expression by CD8+ T cells (online supplemental figure 3B,C) indicated that CD8+ T cells in the margin of excluded tumors do not express PD-1. In contrast, a significant proportion of CD8+ T cells that infiltrated the tumor zone displayed a PD-1+ state or a PD-1+ Ki67+ double positive state (online supplemental figure 3C), though no significant difference was observed between ZEB1high and ZEB1low tumors. Moreover, the frequency of CD4+ T cells and PD-1+CD4+ T cells was similar in ZEB1high and ZEB1low tumors (online supplemental figure 3D,E).
RNA-Seq data were then reanalyzed using the ZEB1 classification derived from spatial analyses (online supplemental figure 4). Reassuringly, no significant correlation between ZEB1 expression and endothelial cell scores as well as with total immune infiltration or neutrophil, myeloid dendritic cell, and NK cell scores was now observed (online supplemental figure 4A,B). Tendency toward decreased CD8 and IFN scores in ZEB1high tumors compared with ZEB1low tumors were now evidenced (online supplemental figure 4C–E), highlighting the requirement for complementary spatial analyses in order to exploit bulk RNA-seq data.
Finally, samples from a validation cohort (n=22) were stained by immunohistochemistry for ZEB1 and CD8 and confirmed an enrichment in the CD8+ T cell excluded pattern in ZEB1high tumors (online supplemental figure 5). Overall, our results clearly demonstrate that high ZEB1 expression in melanoma cells is associated with a decreased CD8+ T cell infiltration within the tumor zone.
ZEB1-mediated impairment of T cell recruitment is independent of β-catenin pathway activation
Since β-catenin pathway activation has been described as a major T cell exclusion mechanism in approximately 20%–30% of melanomas,30 we wondered whether the effect of ZEB1 was independent of this pathway. We first determined a β-catenin score for each melanoma tumor based on RNA-Seq data, by using the previously described score from Spranger et al.8 We showed that high ZEB1 expression was not correlated with activation of the β-catenin pathway, thus emphasizing that these two pathways may be uncoupled (figure 2A). To further address this hypothesis by taking into account intratumor heterogeneity, we also reanalyzed the single cell RNA-seq dataset from Jerby-Arnon et al26 and confirmed, at the single cell level, that the β-catenin score remained unaltered in ZEB1high cells (figure 2B). Next, we analyzed β-catenin protein levels by immunofluorescence in 12 ZEB1high melanoma samples from our cohort (figure 2C,D), as its activation can be determined by its nuclear relocalization.31 Importantly, 73% of these samples did not show any activated β-catenin protein in the nucleus, further supporting our conclusion that melanoma cell-intrinsic ZEB1-mediated T cell exclusion is mostly independent of β-catenin pathway activation.

ZEB1-mediated T cell recruitment defect is independent of β-catenin pathway activation. (A) β-catenin ssGSEA score calculated from the RNA-seq data, using the previously described score from Spranger et al based on seven genes: EFNB3, APC2, TCF1, C-MYC, TCF12, VEGFA and CTNNB1. Tumors were classified as ZEB1 low (n=38) and ZEB1 high (n=12) following the IF analysis (mean with SD, Mann-Whitney test). (B) Single cell RNA-seq from Jerby-Arnon et al.26 X-axis: β-catenin single-sample gene set enrichment analysis (ssGSEA) score calculated on melanoma cells. Y-axis: ZEB1 expression (TPM) in melanoma cells. R²=0.0005748, p value=0.2817. (C) Pie charts representing the proportion of nuclear β-catenin (dark orange) and cytoplasmic β-catenin (light orange) tumors within ZEB1high melanoma (n=12). Representative pictures of cytoplasmic (on the left) and nuclear (on the right) β-catenin staining (in red). DAPI in blue. Scale bars=100 µm and 200 µm, respectively. (D) Representative picture of cytoplasmic β-catenin staining in a ZEB1high tumor: β-catenin (red), ZEB1 (yellow) and SOX10 (cyan). DAPI in blue. Scale bar=50 µm. RNA-seq, RNA-sequencing.
ZEB1 ectopic expression in melanoma cells increases tumor growth in immunocompetent mice by impairing the recruitment of CD8+ T cells
To investigate the role of ZEB1 in immune escape and CD8+ T cell exclusion in vivo, we manipulated its expression in syngeneic melanoma mouse models. Melanoma cell lines were established in our lab from TyrCRE-ERT2/° ; BrafV600E/+ tamoxifen-induced (Br16M3, Br25F4, Br42M6)27 as well as from Tyr:NRASQ61K/° (NR6.1)28 melanoma-bearing mice. In contrast to highly pigmented MITFhigh NRAS-mutated cells, BRAFV600 cell lines displayed a MITFlow undifferentiated phenotype (online supplemental figure 6A), as previously described in BrafV600; PTEN KO models.32 PTEN expression was maintained in these BRAFV600 cell lines, thus allowing to explore ZEB1 function in immune escape independently from PTEN loss of function.
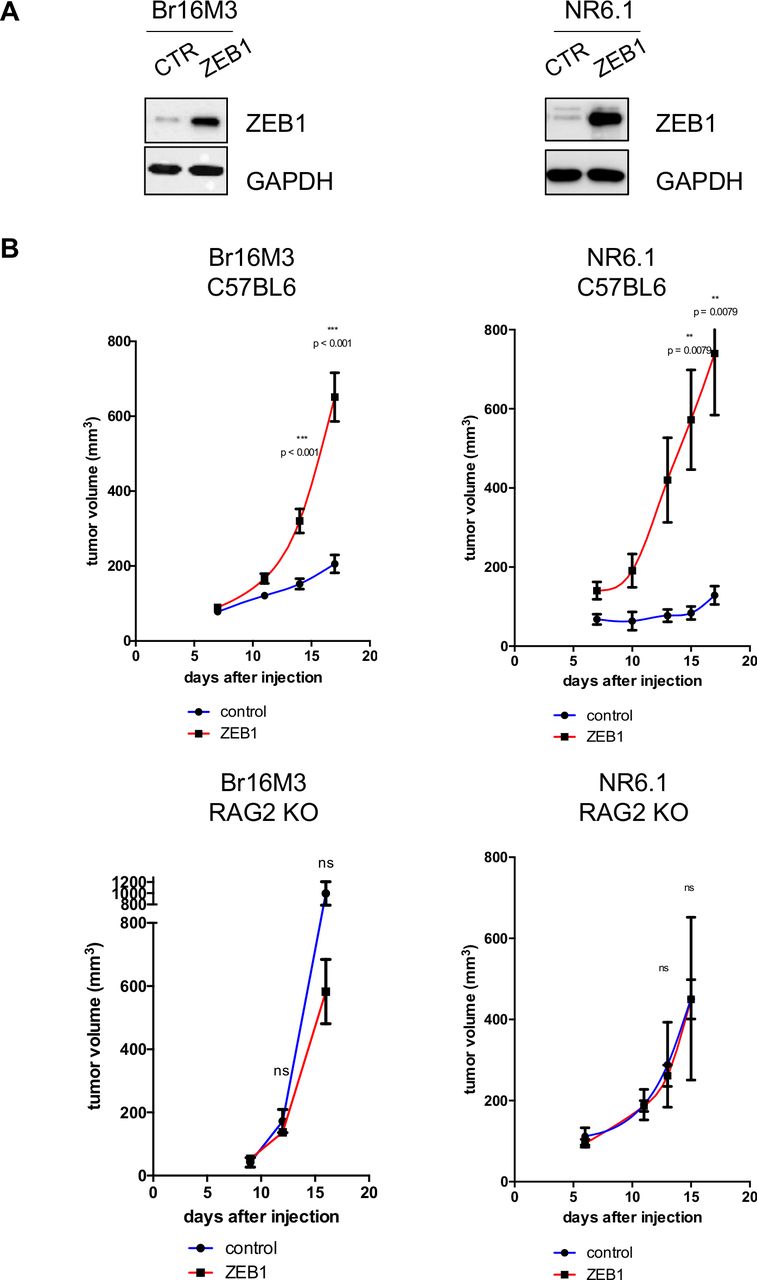
We ectopically expressed ZEB1 in two ZEB1low cell lines, a MITFlow BRAFV600 (Br16M3), and a MITFhigh NRASQ61 cell line (NR6.1), in order to analyze a non-pigmented and a pigmented model (figure 3A). ZEB1-expressing melanoma cells exhibited increased tumor growth upon subcutaneous injection into syngeneic immunocompetent C57BL6/J mice but not into C57BL6/J RAG2 KO immunodeficient mice (figure 3B). These results highlight the key role of the immune system in controlling tumor growth. In accordance with these results, ZEB1 expression mediated drastic modifications in the composition of the immune infiltrate in tumors growing in C57BL6/J immunocompetent mice, as assessed by multiparametric flow cytometry. Indeed, the CD45 infiltrate was lower in ZEB1high tumors (figure 4A).

ZEB1 ectopic expression in melanoma cells increases tumor growth in immunocompetent mice. (A) Br16M3 and NR6.1 murine melanoma cells were infected with retroviruses expressing ZEB1. Western blot analyses of ZEB1. GAPDH was used as a loading control. (B) 3×10⁶ Br16M3 (left) or NR6.1 (right) control (green) or ZEB1-overexpressing (red) cells were injected subcutaneously into C57BL6 immunocompetent mice (upper panel) or into immunodeficient RAG2 KO mice (lower panel). The mean tumor volume is represented (±SEM, Mann-Whitney test). Br16M3: n=17–19 and n=4 for immunocompetent and RAG2 knock-out (KO) mice respectively; NR6.1: n=5 for both immunocompetent and RAG2 KO mice.

ZEB1 ectopic expression in melanoma cells impairs the recruitment of CD8+ T lymphocytes. (A) FACS analyses of CD45 infiltration 2 weeks after injection into immunocompetent C57BL6 mice of Br16M3 (left) or NR6.1 (right) models: control (blue); ZEB1 ectopic expression (red), n=4–5 per group. Bar chart representing the number of CD45+ cells/g of tumor (mean with SD, Mann-Whitney test). (B and C) FACS analyses of CD8+ and CD4+ infiltration in Br16M3 and NR6.1 control and ZEB1-overexpressing tumors. Bar charts representing the number of CD8+ (B) or CD4+ (C) cells per gram of tumor. (D) Representative pictures of H&E coloration, ZEB1 or CD8 immunostaining in Br16M3 (left) and NR6.1 (right) control and ZEB1-overexpressing tumors collected 2 weeks after injection into C57BL6 mice. Purple chromogen was used for IHC visualization in pigmented NR6.1 tumors instead of brown DAB for non-pigmented Br16M3 tumors. Scale bars=50 µm. Arrows indicate purple positive CD8+ T cells. (E) Quantification of CD8+ T cell infiltration in Br16M3 and NR6.1 control versus ZEB1-overexpressing tumors. Bar chart representing the number of CD8+ T cells per mm² of tumor (n=5–6, mean with SD, Mann-Whitney test). (F) FACS analyses of FOXP3+ CD4+ regulatory T cells (Treg) infiltration in Br16M3 and NR6.1 control and ZEB1-overexpressing tumors. Bar charts representing the percentage of Tregs among CD4+ T cells in Br16M3 control (blue) and ZEB1-overexpressing (red) tumors, 14 (left) and 21 (right) days after injection (mean with SD, Mann-Whitney test). (G) Bar chart representing the ratio between the number of CD8+ T cells and the number of Tregs in Br16M3 control and ZEB1-overexpressing tumors (mean with SD, Mann-Whitney test).
Further immunohistochemical and multiparametric flow cytometry analyses demonstrated that the density of CD8+ T cells (/mm2 or /g of tumor) was severely impaired in ZEB1high tumors at day 14 (figure 4B–D), with CD4+ T cells showing the same trend (figure 4C). The percentage of Tregs (FOXP3+CD4+) increased only after 21 days (+25%) (figure 4F), strongly reducing the CD8+ T cells/Treg ratio (figure 4G). Of note, the frequency of NK cells, macrophages, and DC were not significantly modified in ZEB1-overexpressing tumors (online supplemental figure 6B).
Finally, we evaluated the activation state of CD8+ T cells by performing Granzyme B, Ki-67 and PD-1 staining, which showed a trend toward decreased expression in ZEB1high tumors, suggesting a lower level of activation (online supplemental figure 6C). Overall, these results argue in favor of an important role for ZEB1 in preventing the recruitment and activation of CD8+ T cells.
Melanoma cell-intrinsic ZEB1 signaling decreases the production of T cell-attracting chemokines
Immune cell infiltration is regulated by chemokines secreted in the tumor microenvironment.33 In order to further investigate the mechanisms by which high ZEB1 expression in melanoma cells impairs the recruitment of CD8+ T cells to the tumor, we analyzed the secretome of the tumors. The composition of the supernatant of dilacerated tumors was analyzed using the Meso Scale Diagnostics multiplex technology (35 analytes). High ZEB1 expression in melanoma tumors was associated with a decreased secretion of major cytokines, including IFNγ and TNFα (figure 5A), while increased secretion of TGFβ2 was observed (figure 5A,B). Importantly, decreased secretion of CD8+ T cell-attracting chemokines (CXCL10, CCL3 and CCL4) was found in the supernatant of ZEB1-expressing tumors (figure 5A,B). In order to dissect the melanoma cell-intrinsic production, the same technique was applied to supernatants of cells cultured in vitro. The amount of secreted molecules was generally very low, except for CXCL10 and CCL4, the secretion of which appeared lower in ZEB1high cells (online supplemental figure 6D). Magnetic sorting of CD45-negative cells (mostly melanoma cells) from tumors validated the decreased production of CXCL10 by ZEB1high melanoma cells in vivo (online supplemental figure 6E). Chromatin immunoprecipitation analyses further demonstrated the binding of ZEB1 to the promoter of Cxcl10 and Ccl4 in Br16M3 cells (figure 5C). Overall, melanoma cell-intrinsic ZEB1 impairs secretion of various chemokines, including CXCL10, which may contribute to a defective CD8+ T cell recruitment.

Melanoma cell-intrinsic ZEB1 signaling decreases the production of T cell-attracting chemokines. (A) Heatmap representing the relative quantity of 35 analytes measured using the Meso Scale Diagnostics (MSD) technology in supernatants of dilacerated control (n=5) or ZEB1-overexpressing (n=8) Br16M3 tumors. TGF-β isoforms were also quantified with the same technology in n=6 and n=8 control or ZEB1-overexpressing tumors, respectively. Mann-Whitney test. (B) Bar charts representing the concentration of CXCL10, CCL4, TGF-β1 and 2 (pg/mL), in the supernatant of dilacerated Br16M3 control (n=5 or 6) and ZEB1-overexpressing (n=8) tumors (mean with SD, Mann-Whitney test). (C) Chromatin immunoprecipitation assay of ZEB1 showing binding to the promoter of Cxcl10 and Ccl4 in Br16M3 cells. The fraction of chromatin bound to the promoter, with IgG control or anti-ZEB1 antibody is represented as a percentage of input (n>=3) (mean with SD, t-test). (D) NR6.1 control and ZEB1-overexpressing murine melanoma cells were infected with control or Cxcl10-expressing lentiviruses. qPCR analyses of CXCL10 mRNA expression in NR6.1 control (CT), ZEB1 control (Z1 CT) and ZEB1-overexpressing CXCL10 (Z1 CXCL10) (n=1). (E) 2.5×10⁶ NR6.1 ZEB1 control (Z1 CT) and ZEB1 CXCL10 (Z1 CXCL10) cells were injected subcutaneously into C57BL6 immunocompetent mice (n=5 per group). The mean tumor volume is represented (±SEM, Mann-Whitney test). (F) FACS analyses of CD45 and CD8 infiltration 17 days after injection into immunocompetent C57BL6 mice of NR6.1 ZEB1 control (n= 4) and ZEB1 CXCL10 (n= 5). Bar chart representing the number of CD45+ cells and CD8+ T cells/g of tumor (mean with SD, Mann-Whitney test). (G) Quantification of CD8+ T cell infiltration in NR6.1 ZEB1 control and ZEB1 CXCL10 tumors. Bar chart representing the number of CD8+ T cells per mm² of tumor (n=5 per group, mean with SD, Mann-Whitney test).
In order to investigate the role of this chemokine, CXCL10 was overexpressed in ZEB1-overexpressing melanoma cells (figure 5D). CXCL10 overexpression induced a 50% decrease in ZEB1-overexpressing melanoma cells tumor growth upon subcutaneous injection into C57BL6/J mice (figure 5E). However, CXCL10-mediated rescue of tumor control was only transient and partial compared with control cells, suggesting that additional mechanisms may contribute to immune escape. CD8+ T cells infiltration in ZEB1-overexpressing tumors at day 17 was only slightly increased upon CXCL10 overexpression (figure 5F,G). Overall, these data indicate that CXCL10 partially accounts for ZEB1-mediated CD8+ T cells deficiency.
Knock-out of Zeb1 in melanoma cells strongly reduces tumor growthand favors CD8+ T cell infiltration
To better characterize the mechanisms underlying the role of ZEB1, we then performed knock-out experiments by lentiviral infection (CRISPR-Cas9) in a BRAFV600 melanoma cell line. Zeb1 KO was validated by western blot (figure 6A) and Sanger sequencing. One scramble and one KO clone were selected, which displayed similar proliferation rates in vitro. Tumor growth of Zeb1 KO melanoma cells was impaired in syngeneic immunocompetent C57BL6/J mice but not in C57BL6/J RAG2 KO mice (figure 6B), confirming the impact of ZEB1 on the immune system and the absence of intrinsic proliferation defect. Loss of ZEB1 expression in tumor cells was validated by immunohistochemical staining of the tumors (figure 6C). Consistent with the decreased CD8+ T cell infiltration observed in ZEB1-overexpressing tumors, Zeb1 KO tumors exhibited increased CD8+ T cell infiltration (threefold increase) as assessed by immunohistochemical analyses (figure 6C). Importantly, similar conclusions regarding ZEB1-mediated CD8+ T cell recruitment and subsequent decreased tumor growth were obtained from experiments conducted with another pair of scramble-Zeb1 KO clones (online supplemental figure 7A–D).
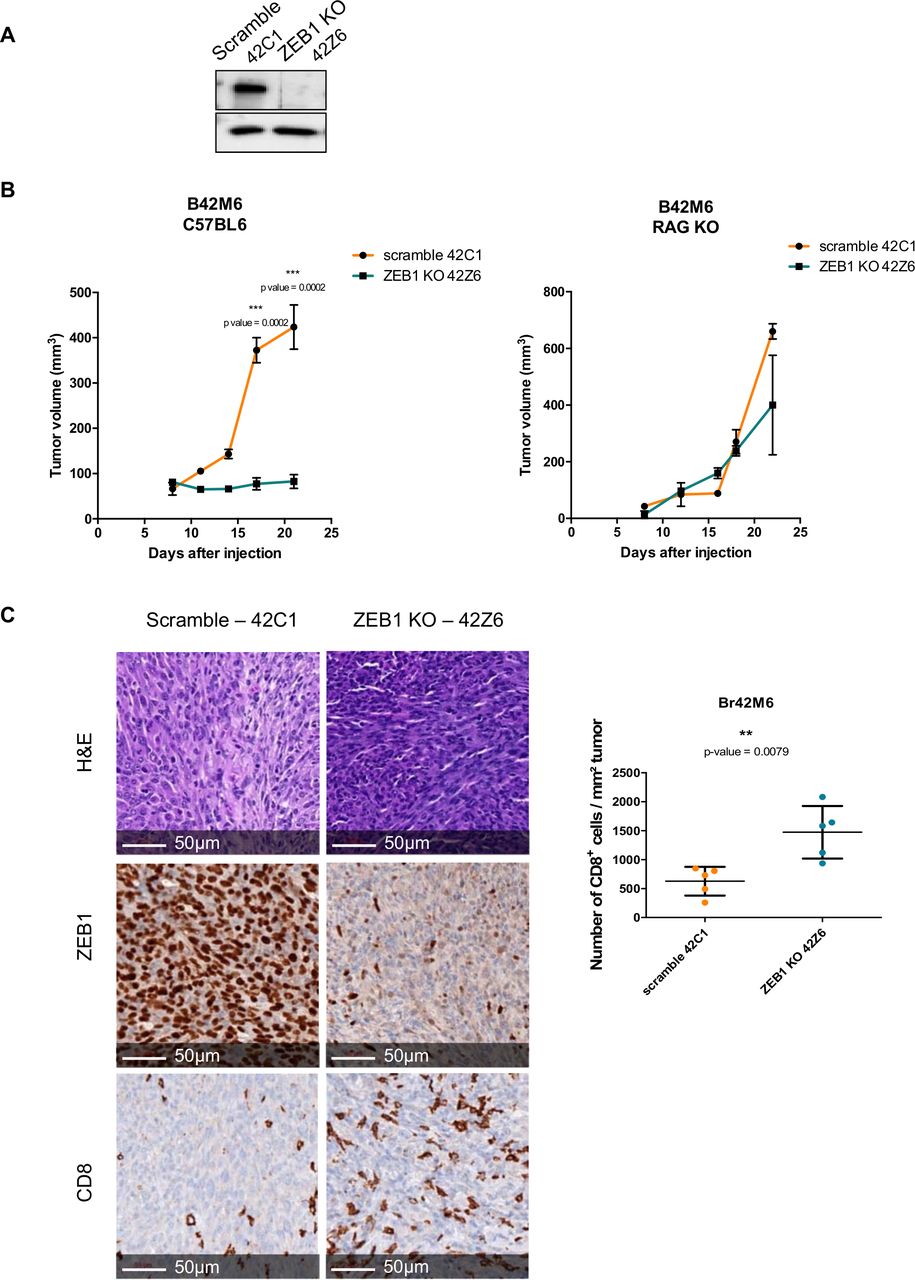
Zeb1 knock-out in melanoma cells strongly reduces tumor growth and favors CD8+ T cell infiltration. (A) Br42M6 murine melanoma cells were infected with lentiviruses expressing the Cas9 and guide RNA (sgRNA) targeting ZEB1 or scramble sgRNA. 42C1 is a scramble clone, and 42Z6 is a Zeb1 knock-out clone. Western blot analyses of ZEB1. GAPDH was used as a loading control. (B) 2.5×10⁶ 42C1 (orange) or 42Z6 (blue) cells were injected subcutaneously into C57BL6 immunocompetent mice (left, n=6–10 per group) or into RAG KO mice (right, n=3 per group). The mean tumor volume is represented (±SD, Mann-Whitney test). (C) Representative pictures of ZEB1 and CD8 immunostaining (brown, DAB) in 42C1 (scramble) and 42Z6 (ZEB1 KO) tumors. Scale bars=50 µm. Quantification of CD8 infiltration in 42C1 (scramble) and 42Z6 (ZEB1 KO) tumors. Bar chart representing the number of CD8+ T cell per mm² of tumor (mean with SD, Mann-Whitney test).
ZEB1 overexpression in melanoma cells triggers resistance while knock-out of Zeb1 improves the response to immune checkpoint blockade
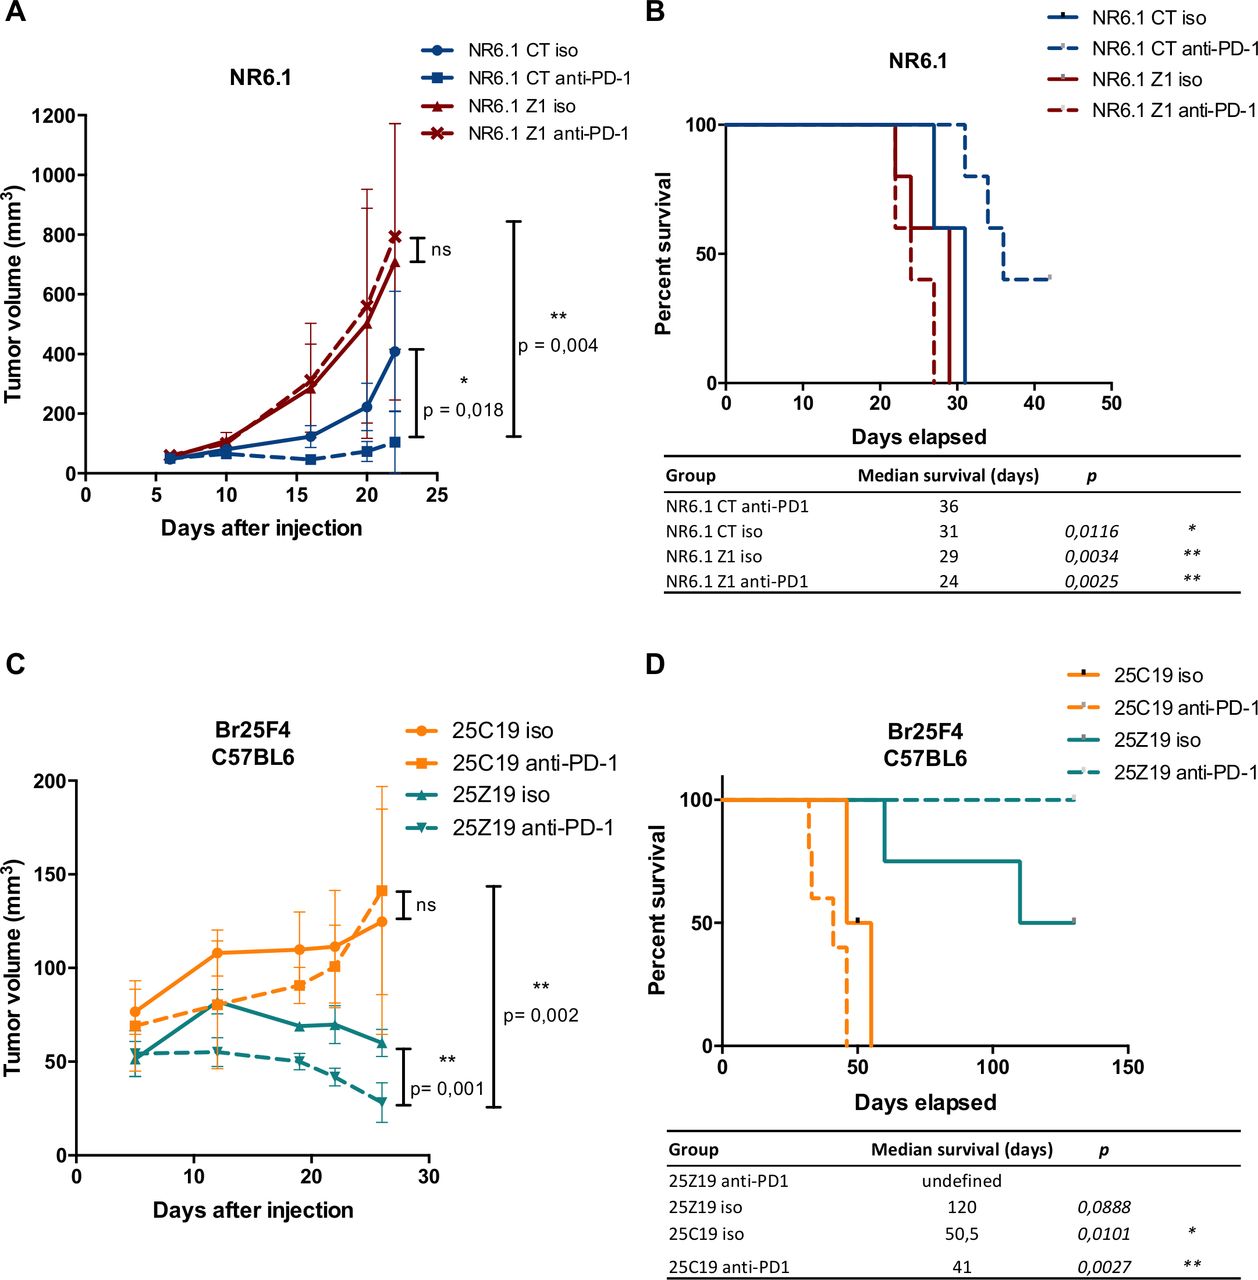
Our observations that ZEB1 expression regulates CD8+ T cell infiltration provided a rationale for investigating whether ZEB1 may regulate sensitivity to anti-PD-1 antibody therapy. As previously described for other syngeneic BRAFV600 models,34 Br16M3, Br25F4, and Br42M6 BRAFV600 cells were resistant to anti-PD-1 treatment, while NR6.1 NRAS mutated cells displayed partial response to anti-PD-1 (figure 7A,B and online supplemental figure 7E,F). ZEB1-overexpressing NR6.1 tumors were no longer sensitive to anti-PD-1 treatment (figure 7A,B), demonstrating the role of ZEB1 in the emergence of resistance to anti-PD-1 in this model. We then evaluated the sensitivity to anti-PD-1 of resistant Br25F4 cells upon Zeb1 knock-out. The growth of Zeb1 KO cells is already reduced compared with control cells, but treatment with anti-PD-1 antibody resulted in a complete tumor regression (figure 7C). Strikingly, even after 4 months, no tumor resurgence was observed (figure 7D). Overall, these data suggest that targeting ZEB1, to increase T cell infiltration, may increase effectiveness of anti-PD-1 immunotherapy.
ZEB1 overexpression in melanoma cells triggers resistance while knock-out of Zeb1 improves the response to immune checkpoint blockade. (A) NR6.1 murine melanoma cells were infected with retroviruses expressing ZEB1. 2×10⁶ NR6.1 control (red) or ZEB1-overexpressing (blue) cells were injected subcutaneously into C57BL6 immunocompetent mice (five per group) and treated with either anti-PD-1 (dashed lines) or control isotype (iso, solid lines) 5, 7, and 9 days after injection. The mean tumor volume for 5 mice is represented (±SD, Student’s t-test). (B) NR6.1 murine melanoma Kaplan-Meier survival curves with log-rank test, mice were euthanized when tumor volume reached 1500mm3 or diameter >15mm. (C) 2×10⁶ control 25C19 (orange) or Zeb1 KO 25Z19 (blue) cells were injected subcutaneously into C57BL6 immunocompetent mice (five per group) and treated with either anti-PD-1 (dashed lines) or control isotype (iso, solid lines) 5, 7, and 9 days after injection. The mean tumor volume for 5 mice is represented (±SD, Student’s t-test). (D) Br25F4 murine melanoma Kaplan-Meier survival curves with log-rank test, mice were euthanized when tumor volume reached 1500 mm3 or diameter >15mm. (*P<0.05, **p<0.01, ***p<0.001, ****p<0.0001).
Discussion
Despite recent progress in the treatment of metastatic melanoma provided by immunotherapy, the identification of melanoma cell-intrinsic mechanisms of immune escape remains a major challenge. Targeting of such targets would trigger T cell recruitment and restore response to immunotherapy.
While previous data in carcinoma (non-small cell lung cancer and breast cancer) demonstrated the role of EMT factors in immune evasion,22 23 these remained to be precisely addressed in the context of melanoma, since EMT-TFs display cell-type specific roles.20 24 We herein focused on ZEB1, given its prominent oncogenic function in melanoma. The specific role of ZEB1 in remodeling the immune microenvironment was not previously investigated in melanoma, where the characterization of immune escape mechanisms remains a major issue.
Our findings identify ZEB1 as a key determinant of T cell exclusion and melanoma immune escape. High ZEB1 expression in melanoma cells is associated with a decreased infiltration by CD8+ T cells, within the tumor zone, in a large cohort of human cutaneous melanoma. Importantly, our study emphasizes the requirement for spatial analyses of tumors, allowing to tackle the issue of ZEB1 intratumoral heterogeneity. Indeed, we developed innovative multi-immunofluorescence stainings to specifically quantify ZEB1-expressing melanoma cells. We were thus able to exclude other ZEB1-expressing cells from the microenvironment, including CAFs, endothelial cells, and immune cells (T cells, macrophages and NK cells),29 which significantly biased bulk RNA-seq analyses. Our strategy combining transcriptome and spatial analyses allowed to reliably address the crosstalk between melanoma cells and immune cells, more precisely to decipher the correlation between high ZEB1 expression in melanoma cells and decreased immune infiltration. Our findings highlight that studies on bulk tumors from public datasets, including the TCGA, may not be adequate to draw robust conclusions regarding markers shared by tumor cells and stroma, unless coupled with complementary spatial analyses.
Our current study contributes to increasing our knowledge on non-genetic, melanoma cell-intrinsic T cell exclusion mechanisms. Importantly, our results demonstrate that the ZEB1 pathway is independent from the β-catenin pathway, a major T cell exclusion mechanism in melanoma. Indeed, we showed that high ZEB1 expression in melanoma cells is not redundant with β-catenin pathway activation. Overall, ZEB1 activation would be another mechanism of T cell exclusion present in approximately 25% of cutaneous melanoma patients, in addition to β-catenin activation or PTEN loss-of-function,8 9 35 which may each occur in approximately 20% of patients.
Investigation of the underlying mechanisms in several syngeneic mouse models uncovered that the prominent role of ZEB1 is to prevent CD8+ T cell recruitment, resulting in melanoma immune evasion. Consistently, Zeb1 KO promoted CD8+ T cell recruitment and subsequent decrease in tumor growth. The state of CD8+ T cell activation, evidenced by analyses of the PD-1 immune checkpoint and the proliferation marker Ki67, also showed a tendency toward decreased activation in ZEB1high tumors in mice. We further demonstrated a defective secretion of T cell-attracting chemokines, including CXCL10, by ZEB1high melanoma cells, suggesting the intrinsic role of ZEB1 in regulating the secretome and subsequent immune cell attraction. Indeed, as a transcription factor, ZEB1 has been shown to bind to the promoters of several inflammatory response genes by ChIP-Seq in human carcinoma models.36 Our data show that ZEB1 is able to bind to the promoters of genes encoding for T cell attracting chemokines, including Cxcl10, and repress their transcription. However, CXCL10 overexpression only partially restored CD8+ T cells infiltration, indicating that additional mechanisms may sustain ZEB1-mediated immune evasion.
While our results point to an intrinsic role for ZEB1 in regulating the secretome of melanoma cells, it is still possible that a cooperation with chemokines produced by other immune cells from the microenvironment may contribute to generate an amplification loop. Indeed, a cooperation between constitutive (CCL5 produced by tumor cells) and inducible (CXCL9/10 produced by dendritic cells and macrophages) chemokines has been described in many tumor types37 38 and decreased IFNγ, CCL2, 3, and 4 levels were found in the secretome of ZEB1high tumors. Transforming growth factor TGF-β2 is also upregulated in ZEB1high tumors. The presence of TGF-β1 in the tumor microenvironment is a well-known immunosuppressive mechanism. TGF-β signaling can repress T-lymphocytes activation but also restrict T cell infiltration.39 However, TGF-β1, the isoform which is prevalent within tumors, was not differentially expressed in ZEB1high tumors. While our study focused on CD8+ T cells, the proportion or activation state of other immune populations may also be modified by ZEB1, as exemplified by the increased proportion of Tregs upon ZEB1 expression, in accordance with previous results obtained with SNAIL.40 Even if the proportions of macrophages and dendritic cells were not modified, these are heterogeneous populations and a precise phenotyping would be required in the future in order to further analyze the contribution of these different immune subpopulations.
Our results also showed that ZEB1 regulates CD8+ T cell recruitment in both a MITFhigh and a MITFlow background. Dedifferentiated MITFlow melanomas have been shown to resist T cell therapy and to display a greater immune infiltration in particular by myeloid cells.41–43 Our results suggest that ZEB1 may regulate CD8+ T cell-dependent tumor growth at least in part independently of MITF-mediated phenotype switching.
Finally and importantly, our results in mouse models indicate that ZEB1 may promote resistance to anti-PD1 immunotherapy and that targeting ZEB1 would be an interesting approach to foster the recruitment of CD8+ T cells within the tumor and increase the response to immunotherapy in melanoma. We had already obtained proof of concept that ZEB1-knockdown resensitizes resistant cells to BRAF/MEK therapy.21 Our data now suggest that ZEB1 may also constitute a putative target to increase efficacy of immunotherapy. Previous reports in patient cohorts suggested that a mesenchymal phenotype may be associated with resistance to immunotherapy in carcinoma23 44 but also in melanoma.45 ZEB1 mRNA expression, as determined by bulk RNA-Seq, was not associated with resistance to anti-PD-1 in a recently published cohort of 144 melanoma cases46 (online supplemental figure 8). However, as demonstrated in our study, bulk RNA-Seq does not allow to reliably address ZEB1 melanoma-specific expression, and precise spatial analyses will be required to address the question in patient cohorts treated with immunotherapy. In this respect, inactivation of endothelial ZEB1 expression was recently shown to sensitize tumors to anti-PD-1, indicating a putative cooperative role of various ZEB1-expressing cell types from the microenvironment.47
While targeting EMT-TFs represents an attractive treatment strategy for metastatic melanomas, it remains a challenging issue since EMT is a highly reversible plasticity process. Strategies aiming at preventing the mesenchymal transition at an early stage, or at targeting the invasive/dedifferentiated states are under investigation, including targeting of AXL,48 inhibition of the retinoic receptor RXR,12 or induction of ferroptosis.49 50 Since multiple epigenetic modifiers have been shown to regulate EMT-TF expression or to directly interact with EMT-TFs,51 the use of relevant epigenetic drugs may also hold great promise in combination with current therapies.52 53
Supplemental material
Data availability statement
Data are available in a public, open access repository. All data relevant to the study are included in the article or uploaded as supplementary information. RNA-Seq data have been deposited in the GEO repository under accession number GSE169203. Other data relevant to the study are included in the article or uploaded as supplementary information.
Ethics statements
Patient consent for publication
Ethics approval
This study was approved by a regional review board (Comité de Protection des Personnes Ile de France XI, Saint-Germain-en-Laye, France, number 12027). Participants gave informed consent to participate in the study before taking part.
Acknowledgments
The authors would like to thank Brigitte Manship for critical reading, Amélien Sanlaville for his help with FACS analyses, and Julien Marie for RAG2 KO mice.
References
Supplementary materials
Supplementary Data
This web only file has been produced by the BMJ Publishing Group from an electronic file supplied by the author(s) and has not been edited for content.
Footnotes
Contributors MP performed and analyzed all experiments with the help of VB and MG. JB contributed to immunofluorescence stainings and analyses. LT performed RNA-sequencing (RNA-seq) bioinformatics analyses. SD, JL, ML-B, and GT provided human samples and clinical data from the human sample experiments. BB and AdlF performed the pathological examination of the stainings. LL provided mouse models. YG-B, NB-V, BD, and CC helped to design and interpret data. AP provided grant support and advices. MP, JC, and SD conceived the project, designed experiments, and interpreted data. JC supervised the whole project, wrote the manuscript and acts as guarantor.
Funding This work was supported by the Ligue Nationale contre le Cancer, the LABEX DEVweCAN of the University of Lyon (ANR-10-LABX-0061), the Lyon Integrated Research Institute in Cancer (SIRIC LYriCAN INCa-DGOS-Inserm_12563), the Institut Convergence PLAsCAN (ANR-17-CONV-0002),the Institut National contre le Cancer (INCa PAIR melanoma D22044, INCA-DGOS PRTK Melpredict), the Fondation de France (project 67134), ARC (Sign’it grant Birdman), the Société Française de Dermatologie, the ERiCAN program of Fondation MSD-Avenir (Reference DS-2018-0015), the Fondation BMS, the association Melarnaud and Vaincre le Mélanome. MelBase is sponsored by the French National Cancer Institute (INCa). MP was supported by a fellowship from 'Région Rhônes Alpes' and the Association pour la Recherche contre le Cancer.
Competing interests None declared.
Provenance and peer review Not commissioned; externally peer reviewed.
Supplemental material This content has been supplied by the author(s). It has not been vetted by BMJ Publishing Group Limited (BMJ) and may not have been peer-reviewed. Any opinions or recommendations discussed are solely those of the author(s) and are not endorsed by BMJ. BMJ disclaims all liability and responsibility arising from any reliance placed on the content. Where the content includes any translated material, BMJ does not warrant the accuracy and reliability of the translations (including but not limited to local regulations, clinical guidelines, terminology, drug names and drug dosages), and is not responsible for any error and/or omissions arising from translation and adaptation or otherwise.