Article Text

Abstract
Background The aims of this study were (1) to clarify the impact of tertiary lymphoid structure (TLS) status on the outcome and immunogenomic profile of human clear cell renal cell carcinoma (ccRCC) and (2) to determine phenotypic differences in TLSs between different types of genitourinary cancer, that is, urinary ccRCC and bladder cancer.
Methods We performed a quantitative immunohistological analysis of ccRCC tissue microarrays and conducted integrated genome mutation analysis by next-generation sequencing and methylation array analysis. Since the tumor immune microenvironment of ccRCC often differs from that of other cancer types, we analyzed the phenotypic differences in TLSs between ccRCC and in-house bladder cancer specimens.
Results Varying distribution patterns of TLSs were observed throughout ccRCC tumors, revealing that the presence of TLSs was related to poor prognosis. An analysis of genomic alterations based on TLS status in ccRCC revealed that alterations in the PI3K-mTOR pathway were highly prevalent in TLS-positive tumors. DNA methylation profiling also revealed distinct differences in methylation signatures among ccRCC samples with different TLS statuses. However, the TLS characteristics of ccRCC and bladder cancer markedly differed: TLSs had the exact opposite prognostic impact on bladder cancer as on ccRCC. The maturity and spatial distribution of TLSs were significantly different between the two cancer types; TLSs were more mature with follicle-like germinal center organization and likely to be observed inside the tumor in bladder cancer. Labeling for CD8, FOXP3, PD-1, and PD-L1 showed marked differences in the diversity of the immune microenvironment surrounding TLSs. The proportions of CD8-, FOXP3-, and PD-L1-positive cells were significantly higher in TLSs in bladder cancer than in TLSs in ccRCC; rather the proportion of PD-1-positive cells was significantly higher in TLSs in ccRCC than in TLSs in bladder cancer.
Conclusion The immunobiology of ccRCC is unique, and various cancerous phenomena conflict with that seen in other cancer types; therefore, comparing the TLS characteristics between ccRCC and bladder cancer may help reveal differences in the prognostic impact, maturity and spatial distribution of TLSs and in the immune environment surrounding TLSs between the two cancers.
- urinary bladder neoplasms
- tumor microenvironment
- kidney neoplasms
- immunohistochemistry
- lymphocytes, tumor-infiltrating
Data availability statement
Data are available on reasonable request. The data will be shared on reasonable request to the corresponding author.
This is an open access article distributed in accordance with the Creative Commons Attribution Non Commercial (CC BY-NC 4.0) license, which permits others to distribute, remix, adapt, build upon this work non-commercially, and license their derivative works on different terms, provided the original work is properly cited, appropriate credit is given, any changes made indicated, and the use is non-commercial. See http://creativecommons.org/licenses/by-nc/4.0/.
Statistics from Altmetric.com
- urinary bladder neoplasms
- tumor microenvironment
- kidney neoplasms
- immunohistochemistry
- lymphocytes, tumor-infiltrating
Introduction
Recent studies have shown that B cells can form lymphoid aggregates called tertiary lymphoid structures (TLSs) in the microenvironment of the host stroma.1 B cells are surrounded by T cells within TLSs, and these structures form relatively small germinal centers, which are commonly observed in allograft rejection, autoimmune diseases and tumorous tissues.2
In malignancies, mature TLSs induce an antitumor response.3 TLSs serve as antigen-presenting cells that regulate the cellular immunity of tumors. This process means that B cells activate and instruct T cells, CD8+ T cells in particular, to recognize tumor-associated cells.4 TLSs also release antitumor antibodies that tag tumor cells, allowing them to be attacked by other cellular players of the immune system.5 However, B cells in immature TLSs may produce inhibitory factors that suppress the function of immune cells and play protumor roles.3 6 Overall, TLSs, which behave as a double-edged sword in the host-tumor interaction, are related to a good prognosis for most diseases7–9 but are related to a poor prognosis for a few conditions,10 11 depending on the cancer type; in this context, TLSs in urinary kidney and bladder cancers are not well studied.2 12
Notably, new cutting-edge immunotherapies have been developed for many solid tumors, including kidney neoplasms,13 but the immunobiology of renal cell carcinoma (RCC) seems to be unique. Despite the high sensitivity of clear cell renal cell carcinoma (ccRCC) to immunotherapy, CD8+ T cell infiltration into the tumor beds is related to a poor prognosis,14 which is not observed in other immunotherapy-sensitive tumors.15 On the other hand, bladder cancers, for which new immunotherapy is being developed, often exhibit oncological behaviors similar to other immunotherapy-sensitive tumors16 and have potentially different immunobiological properties from kidney cancer.
The aim of this study was first to investigate TLSs in clinical tissues surgically removed from ccRCC patients and to clarify the impact of TLSs on prognosis and their relation to clinicopathological factors in ccRCC. Furthermore, we elucidated the immune environment surrounding TLSs in ccRCC and unraveled the genomic/epigenomic abnormalities associated with TLSs. Second, we elaborated on the prognostic impact of TLSs in bladder cancer, uncovering the differences in TLS properties between different types of genitourinary malignancies. Herein, we clarified the TLS properties in both cancers and assessed whether TLSs could be a novel target for the development of antitumor strategies and how mature TLSs could be used to enhance the antitumor immune response.
Materials and methods
Human tumor samples
The Union for International Cancer Control tumor-node-metastasis system was used for tumor staging, and nuclear grading was carried out according to the WHO/International Society of Urological Pathology grading system. In total, 172 tumor samples were included and divided into four groups prior to the analysis: (1) ccRCC tumors treated surgically (n=105, cohort A); (2) ccRCC tumors treated with antiangiogenic tyrosine kinase inhibitors (TKIs) prior to surgery (n=8, cohort B); (3) ccRCC tumors with sarcomatoid components (n=8, cohort C); and (4) urinary bladder cancers treated surgically (n=51, cohort D). No statistical methods were used to predetermine the sample size.
All tissue microarray (TMA) sections were created as follows. First, a well-experienced board-certified pathologist (SM), who specializes in genitourinary malignancies, evaluated the suitability of the samples for TMA construction. The tumor center (TC) and invasive margin (IM) of each specimen were selected, with regard to representative areas of the WHO/ISUP grade, and 3 mm tumor cores were punched for sampling.17 18 In total, 344 cores were acquired and processed for further experiments. All samples were assigned numbers for identification to avoid investigator bias during tissue preparation and data analysis. No human samples were excluded from the analysis. All procedures were performed in compliance with the 1964 Helsinki Declaration and current ethical standards, and informed consent was obtained from the patients for the experimental use of the samples according to the hospital’s ethical guidelines.
Immunohistochemical staining
All TMA sections were stained as follows. FFPE samples were cut into 4–5 μm thick sections and placed onto silane-coated glass slides. After deparaffinization, the sections were processed for antigen retrieval. After blocking, the sections were incubated overnight with primary antibodies, followed by incubation with secondary antibodies conjugated to a peroxidase-labeled dextran polymer. The primary antibodies used were as follows: anti-Bcl6 antibody (#418181, Nichirei., Tokyo, Japan), anti-CD3 antibody (#413591, Nichirei., Tokyo, Japan), anti-CD8 antibody (#413211, Nichirei., Tokyo, Japan), anti-CD10 antibody (#413261, Nichirei., Tokyo, Japan), anti-CD20 antibody (#422441, Nichirei., Tokyo, Japan), anti-CD21 antibody (#M0784, Dako), anti-FOXP3 antibody (to label Treg cells, #ab20034, Abcam), anti-PD-1 antibody (#43248, Cell Signaling Technology), and anti-PD-L1 antibody (#13684, Cell Signaling Technology). Immunohistochemical staining was visualized using 3,3’-diaminobenzidine in 50 mM Tris-HCl (pH 5.5) containing 0.005% hydrogen peroxidase. Finally, the sections treated with 3,3’-diaminobenzidine were counterstained with hematoxylin. All stained TMA sections were scanned and visualized using a high-resolution digital slide scanner (NanoZoomer-XR C12000; Hamamatsu Photonics, Hamamatsu, Shizuoka, Japan).
TLS definition and detection
We herein identified three distinct TLS phenotypes, that is, early TLSs, primary follicle-like TLSs, and secondary follicle-like TLSs.19–22 We carried out the following protocol to detect TLSs. First, we identified all lymphocyte aggregations within the tumor. Then, to distinguish early TLSs from simple lymphocyte aggregations, we used immunohistochemistry for CD20 and CD3, thereafter identifying sets of CD20-positive and CD3-positive lymphocyte cell clusters in serial sections. In this study, we did not consider TLSs to be present when only CD20-positive cells were clustered or when only CD3-positive cells were clustered. Second, the distinction between early and primary/secondary follicle-like TLSs was demonstrated morphologically by the presence of round-shaped cell clusters. Third, we differentiated primary and secondary follicle-like TLSs using Bcl6, CD10, and/or CD21 immunosignals to identify mature germinal center organizations existing in secondary follicle-like TLSs. Bcl6/CD10 expression is vital for mature B cells,23 24 and positive CD21 signals reveal plasma cell differentiation within the germinal center organization.25
Dna extraction and sequencing
Genomic DNA was extracted from 43 fresh-frozen tissue samples that matched the TMA samples in cohort A with the DNeasy Blood & Tissue Kit (Qiagen) according to the manufacturer’s protocol.17 The DNA integrity number was 4.0, which was calculated using an Agilent 2000 TapeStation (Agilent Technologies, Waldbronn, Germany). A genomic DNA library was constructed using GeneRead DNAseq Targeted Panel V.2 (Human Comprehensive Cancer Panel) and covered more than 95% of the total exon regions of 160 cancer-related genes. The library was amplified using the GeneRead DNA I Amp Kit (Qiagen) and sequenced using MiSeq (Illumina). The FastQ files obtained from MiSeq (Illumina) were analyzed using an original bioinformatics pipeline called GenomeJack (Mitsubishi Space Software, Tokyo, Japan).
Genome-wide DNA methylation analysis
Comprehensive DNA methylation analysis was performed for 39 fresh-frozen tissue samples that matched the TMA samples in cohort A with the Infinium MethylationEPIC BeadChip (Illumina) according to the manufacturer’s protocol.18 The data were assembled using GenomeStudio Methylation software (Illumina) after background subtraction and normalization. The methylation levels of CpG sites are represented as β values ranging from 0 (completely unmethylated) to 1 (completely methylated), reflecting the methylation level of an individual CpG site. To determine the DNA methylation profiles, first, the methylation level was compared with the Illumina DiffScore, which was derived from the p values and differences in β values between the two indicated groups. Second, we selected probes with a DiffScore ranking in the top/bottom 50 of the remaining probes (online supplemental table 1), which corresponded to 75 annotated genes. Third, only genes hypermethylated in ccRCC tumors with TLSs were imported for gene ontology (GO) annotation through the Database for Annotation, Visualization, and Integrated Discovery (https://david.ncifcrf.gov/); this process revealed the enriched terms related to TLS-positive tumors in three contexts: cell components, molecular functions and biological processes.
Supplemental material
Statistical analysis
Values are presented as the means with standard errors or medians with IQRs for continuous variables and as frequencies with percentages for categorical variables. The data were compared between groups using the χ2 test, paired t-test, and Mann–Whitney U test, as appropriate. Univariate and multivariate Cox regression models with stepwise selection were used to evaluate variables associated with disease recurrence and overall mortality. Survival curves were estimated using the Kaplan-Meier method and compared with the log-rank test. Radiographic responses to treatment were evaluated according to the Response Evaluation Criteria in Solid Tumors (RECIST) V.1.1.26 Statistical significance was considered for differences with p<0.05. All analyses were performed using SPSS V.25.0 (IBM-SPSS) or JMP V.15.0 (SAS Institute).
Results
Detecting TLSs and their impact on prognosis in kidney clear-cell carcinoma
We used TMA sections harboring the TC and IMs of ccRCC tumors (figure 1A). First, we identified TLSs in a total of 210 cores from 105 individuals with ccRCC (cohort A, see the Methods section). TLSs were detected in 31% (33/105) of ccRCC patients (figure 1B); in particular, all TLSs in cohort A were early TLSs, and no follicle-like TLS phenotypes were detected, as illustrated in figure 1C. Most TLSs were noted in the IMs (figure 1D), and examination of the pathological features revealed a significantly higher tumor grade for TLS-positive tumors (table 1).
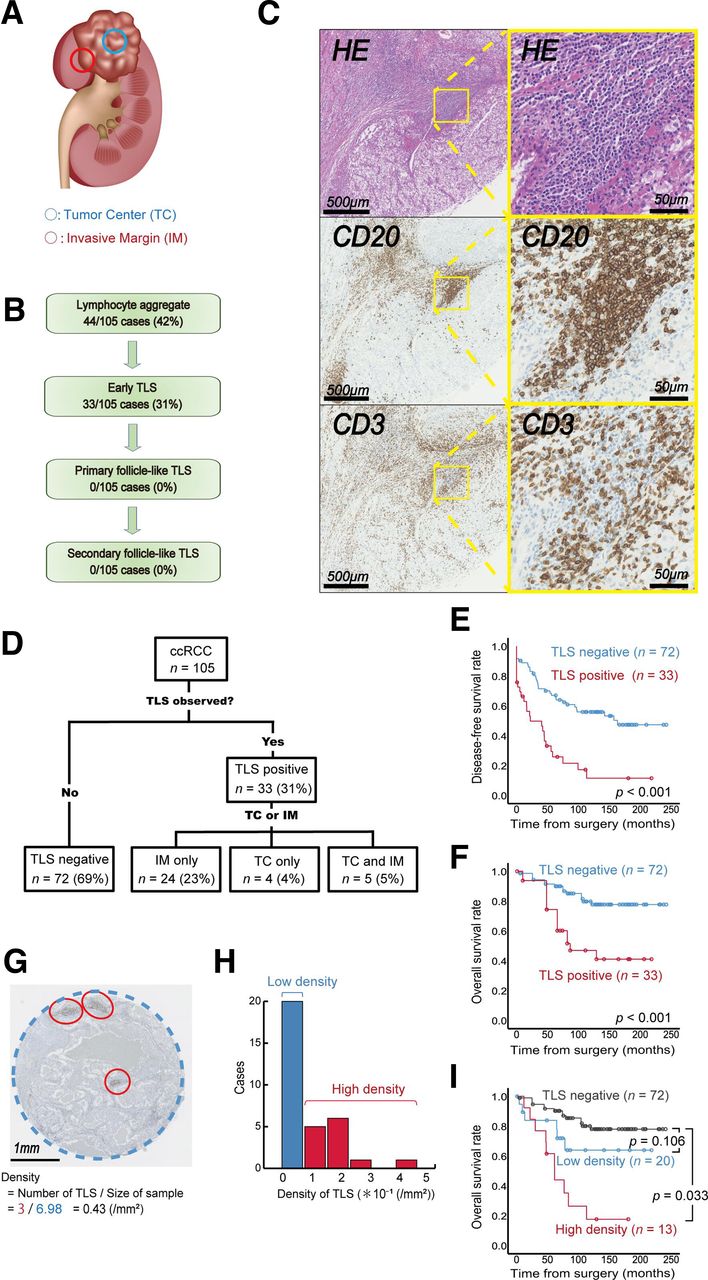
Quantitative tertiary lymphoid structure (TLS) analysis and impact on kidney cancer prognosis. (A) Schematic illustration of the regions of interest in the TLS analysis of clear cell renal cell carcinoma (ccRCC). (B) Summary of TLS detection in tumors from 105 patients with ccRCC. (C) Representative image of TLSs in serial sections with immunolabeling for CD20/CD3 and H&E staining. Zoomed-in images are of the indicated boxed regions. (D) Summary of the TLS distribution in tumors from 105 patients with ccRCC. (E–F) Kaplan-Meier survival curves for disease-free (E) and overall survival rates (F) in 105 ccRCC patients following surgery according to TLS status. (G) Tumor area occupied by TLSs. (H) Histogram of TLS density according to the occupied tumor area in 105 ccRCC patients. (I) Kaplan-Meier survival curves for overall survival in 105 ccRCC patients following surgery according to TLS density. The p value was obtained from the log-rank test.
Characteristics associated with the TLSs in 105 human ccRCC tumor samples
Next, we investigated the effect of TLSs on ccRCC patient survival following surgery. Kaplan–Meier analysis revealed a marked difference in the probability of disease recurrence (p<0.001, figure 1E) and overall mortality (p<0.001, figure 1F) for patients with different TLS statuses. However, the recurrence pattern did not show a clear trend based on TLS status (table 2). In the multivariate analysis, the presence of TLSs in the tumor was a significant factor affecting subsequent disease recurrence (HR 2.57, p=0.001) and overall mortality (HR 3.04, p=0.004) following surgery (table 3).
Characteristics of 59 patients who experienced disease recurrence according to the TLS status
Parameters associated with postoperative disease recurrence and overall mortality of ccRCC patients after adjusting for confounding variables in the univariate and multivariate Cox regression analyses
Notably, TLS-positive tumors could be quantified by using the density within tumors (figure 1G). The mean TLS density in TLS-positive ccRCC tumors (n=33) was 0.12±0.1/mm2. Individual TLS density varied and showed heterogeneity between tumors (figure 1H). Using the defined cut-off value of TLS density presented in figure 1H, we further stratified patients with TLS-positive tumors into two risk groups, the low- and high-TLS density tumor groups, enabling the quantitative prognostic stratification of patients with TLS-positive ccRCC according to TLS density (figure 1I).
Genomic and epigenomic landscapes related to TLSs
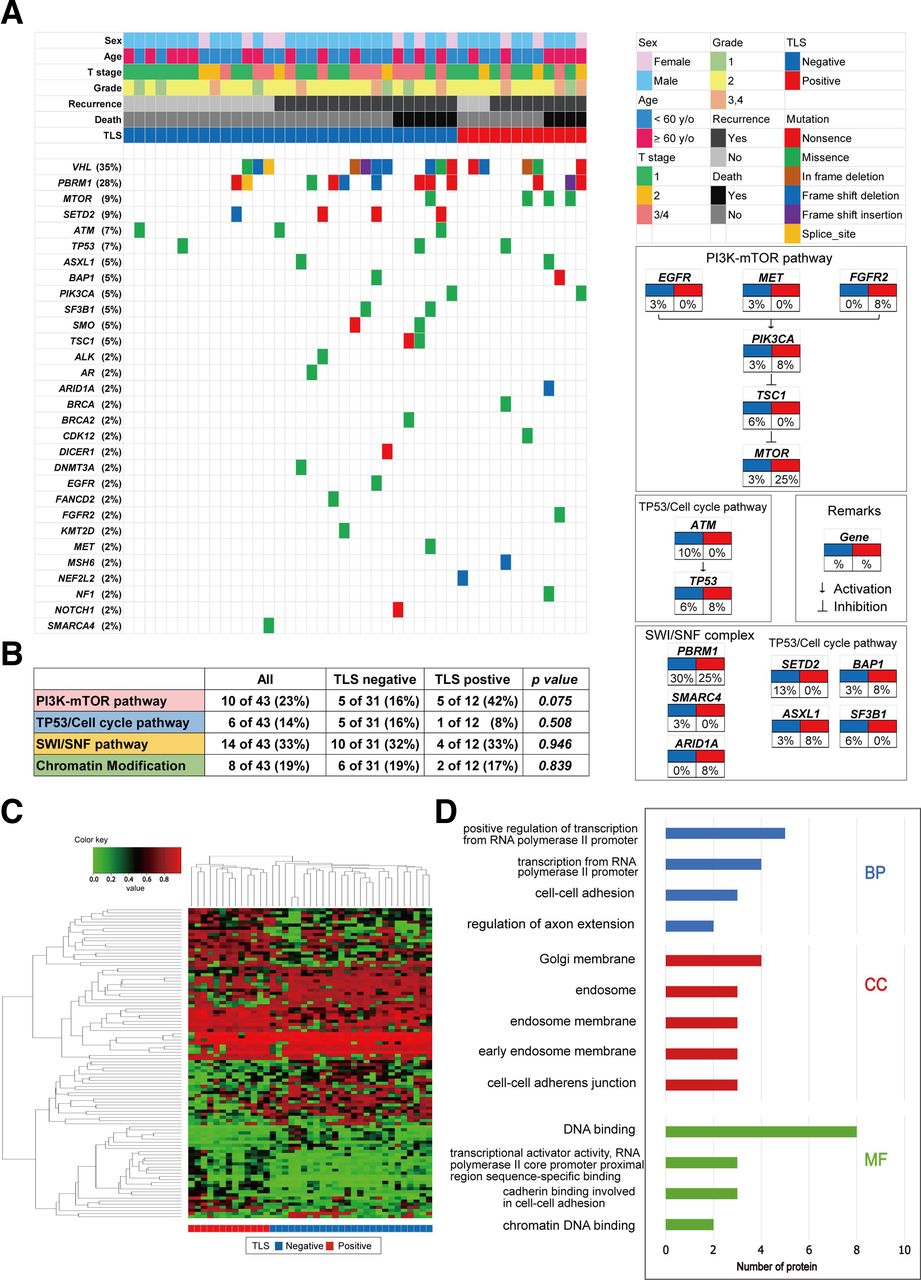
An analysis of genomic alterations underlying TLS-positive tumors revealed the prominent features of ccRCC tumors that could serve as potential biomarkers for targeting TLSs. Herein, we analyzed 43 ccRCC samples (41%) of 105 patients for alterations in 160 cancer-associated genes, depending on the presence and absence of TLSs within the tumors (figure 2A). The most frequently altered genes in our ccRCC tumor samples were VHL, PBRM1, SETD2, and MTOR, with TLS-positive tumors showing unique genetic features. When we examined typical cancer-related pathways, we found that alterations in the PI3K-mTOR pathway were highly prevalent in the TLS-positive tumor group (figure 2B), occurring in 42% of these patients compared with 16% of TLS-negative patients. However, no difference in subsets of TP53/cell cycle genes, SWI/SNF complex genes, or chromatin modifying genes was noted between the two groups (figure 2B).

Somatic genomic alterations and methylation profiles related to tertiary lymphoid structure (TLS) status in kidney cancer. (A) alteration landscape of 43 primary clear cell renal cell carcinoma (ccRCC) tumor samples. upper heatmap: sex, patient age, tumor stage, nuclear grade, disease recurrence, overall mortality, and TLS status. (B) genomic alterations in tumorigenic signaling pathways related to ccRCC development in terms of TLS status. The table shows the percentage of samples with alterations in each of the selected signaling pathways.(C) Heatmap of DNA methylation data using selected probes with a DiffScore ranking in the top/bottom 50 of TLS-positive (n=13) vs TLS-negative (n=26) ccRCC tumors.(D) Go analysis using genes hypermethylated in ccRCC tumors with TLSs. BP, biological process; CC, cell component; EGFR, epidermal growth factor receptor; FGFR, fibroblast growth factor receptor; MET, mesenchymal-epithelial transition; MF, molecular function.
Then, we examined the epigenomic landscape of genome-wide DNA methylation underlying positive TLS status in 39 ccRCC specimens. An Infinium MethylationEPIC BeadChip was used, and DNA methylation profiling of the TLS-positive (n=13) vs TLS-negative (n=26) tumor groups revealed distinct differences in methylation signatures (figure 2C). According to GO enrichment analysis, the enriched biological processes in TLS-positive tumors were the positive regulation of transcription from the RNA polymerase II promoter, transcription from the RNA polymerase II promoter, cell–cell adhesion, etc. Together, enriched cell component and molecular function terms in TLS-positive tumors included the cell–cell adhesion system (figure 2D). Taken together, these findings indicate that genetic/epigenetic background may predict whether TLS-positive ccRCC tumors exhibit aggressive behaviors.
Drug sensitivity and the immune microenvironment in TLSs under antiangiogenic treatments
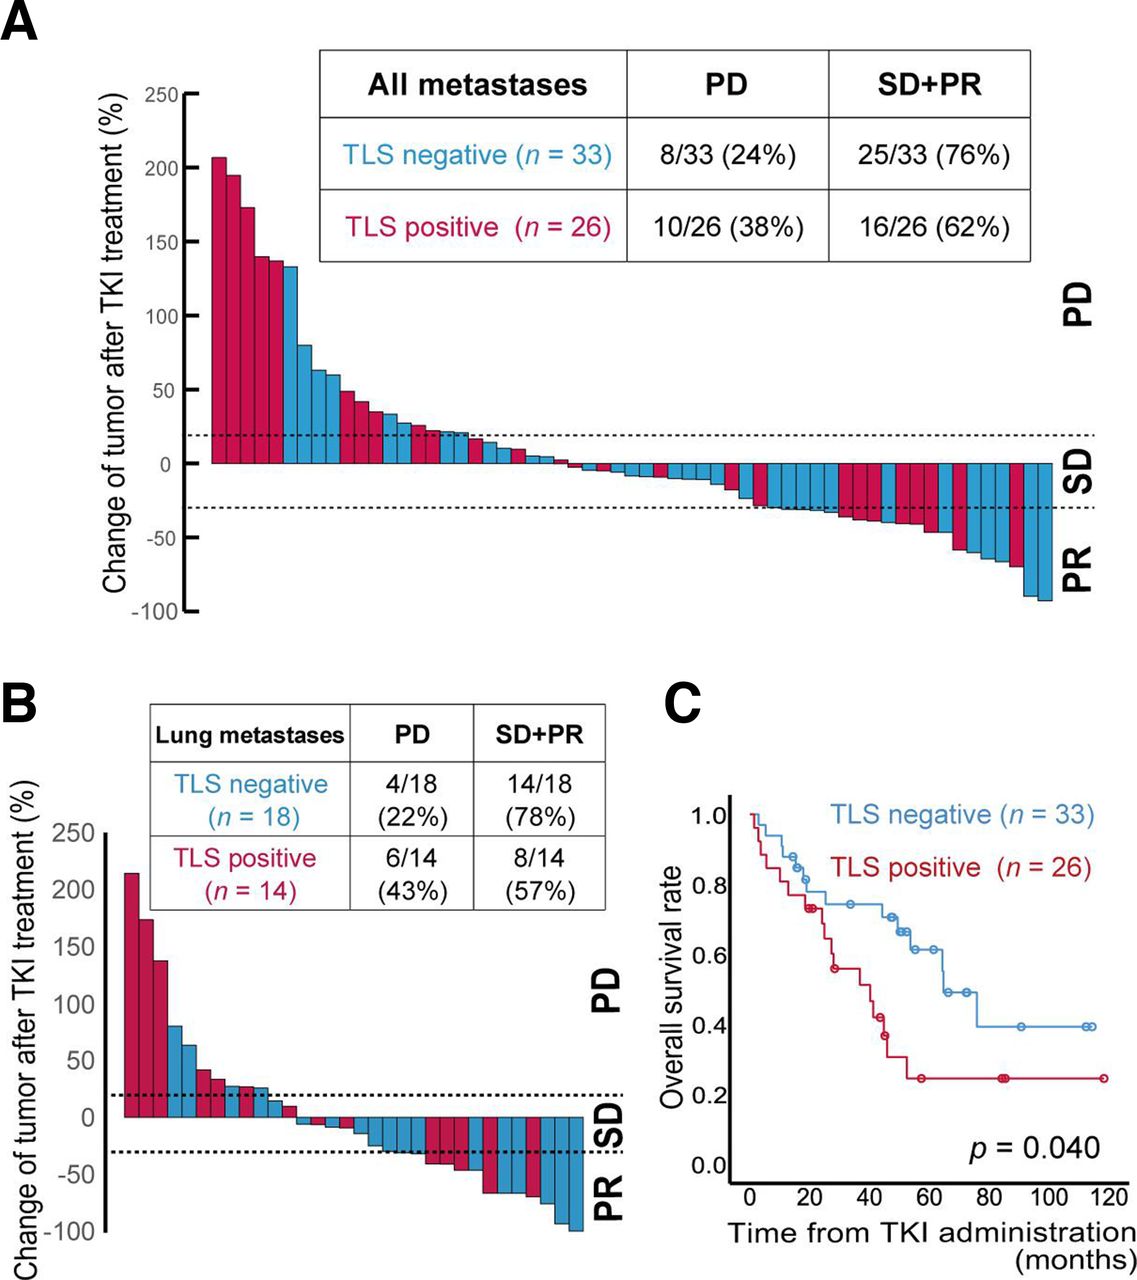
Among the 105 ccRCC patients, 59 (56%) received antiangiogenic TKIs, including sorafenib and sunitinib, following disease relapse. We investigated the relationship between sensitivity to TKI treatment and TLS status in ccRCC tumors. A waterfall plot showing the best change in overall target size measurement (ie, overall tumor burden) according to RECIST V.1.1 is shown in figure 3A. The percentage of patients who experienced progressive disease was 38% (10/26) in the TLS-positive tumor group and 24% (8/33) for the TLS-negative tumor group. The difference between the two groups was more pronounced when focusing on lung metastases (figure 3B); in this subset, the percentage of patients with progressive disease was 43% (6/14) in the TLS-positive tumor group and 22% (4/18) in the TLS-negative tumor group. In sum, Kaplan-Meier analyses revealed that TLS status was significantly associated with overall mortality following TKI treatment (p=0.040, figure 3C).

Sensitivity to anti-angiogenic tyrosine kinase inhibitor (TKI) treatments related to tertiary lymphoid structure (TLS) status.(A, B) Maximum change in target lesion size in any organ (A) or lung (B) according to TLS status in 59 clear cell renal cell carcinoma (ccRCC) patients who received antiangiogenic TKIs following disease relapse. Radiographic responses evaluated by RECIST V.1.1 criteria (C) Kaplan-Meier survival curves for overall survival rates in 59 ccRCC patients who received antiangiogenic TKIs based on TLS status. The p value was obtained from the log-rank test. PD, progressive disease; PR, partial response; SD, stable disease.
We then explored how the heterogeneity of TLSs changed after TKI treatment, which should be the basis for the second-line use of the anti-PD-1 antibody nivolumab after relapse following TKI treatment27 or for the current first-line combined use of TKIs and immunotherapy in metastatic ccRCC.28 We, therefore, examined eight ccRCC tumor samples treated with TKIs prior to surgery (cohort B, see the Methods section). In a comparison between TKI-naïve cohort A and TKI-treated cohort B, The TLS distribution was clearly ubiquitous (p=0.002, (online supplemental figure 1A) and significantly increased in density (p=0.043, (online supplemental figure 1B) in cohort B. However, all TLSs in cohort B were early TLSs, and no follicle-like TLS phenotypes were detected. Overall, changes in the diversity of immune cells that invade TLSs after TKI treatment were clear in this comparison. The labeling of CD8, FOXP3, PD-1, and PD-L1 in ccRCC specimens (online supplemental figure 1C) revealed that a drastic increase in the proportion of PD-1+ T cells in TLSs was obvious after TKI treatment (p<0.001); conversely, the proportion of infiltrated CD8+ T cell was marginally decreased in TLSs after TKI treatment (p=0.082) (online supplemental figure 1D).
Differences in TLS features in patients with sarcomatoid components
In patients with ccRCC, histological changes to sarcomatoid components are also a hot topic when considering tumorigenesis and tumor invasion. Thus, we examined eight sarcomatoid tumor samples of ccRCC (cohort C, see the Methods section) in terms of TLS status and the immune microenvironment. In the comparison between tumors with (cohort C) and without sarcomatoid components (cohort A), we first found that TLS positivity did not significantly differ between the two groups. All of TLSs in cohort C were immature (ie, early TLSs), and no differences were observed in TLS density and distribution between cohorts (online supplemental figure 2AB). On the other hand, the labeling of sarcomatoid components for CD8, FOXP3, PD-1, and PD-L1 showed marked differences in the diversity of the immune microenvironment surrounding TLSs. An obvious and drastic decrease in the proportion of CD8+ T cells in TLSs was observed in sarcomatoid tumors (p<0.001); conversely, the proportion of PD-L1-positive cells was marginally increased in TLSs in sarcomatoid tumors comparing with TLSs in ccRCC (p=0.086) (online supplemental figure 2C).
Landscapes of TLSs in bladder cancer: differences from kidney clear-cell carcinoma
The immune landscape of the tumor microenvironment of RCC often differs from that of other cancer types; for example, one typical representative is the prognostic relevance of CD8+ T cells infiltrating into tumor beds.29 In terms of the presence or absence of TLSs, some cancer types show the exact opposite results to renal cancer, with TLS positivity being associated with improved prognosis in may cancers.8 30 Thus, our next question is what element of tumor heterogeneity causes the paradoxical phenomena of TLSs in ccRCC and other cancers. Since our preliminary study revealed that the presence of tumor-related TLSs contributed to improved prognosis in our in-house bladder cancer cohort, we subsequently analyzed the difference in TLS heterogeneity between ccRCC and bladder cancer specimens (figure 4A).

Quantitative tertiary lymphoid structure (TLS) analysis and impact on bladder cancer prognosis. (A) Schematic illustration of the regions of interest in the TLS analysis of bladder cancer. (B) Summary of TLS detection in tumors from 51 patients with bladder cancer. (C) Representative image of TLSs in serial sections with immunolabeling for CD20/CD3/Bcl6/CD10/CD21 and H&E staining. (D, E) Kaplan-Meier survival curves for disease-free (D) and overall survival (E) rates for 51 patients with bladder cancer following surgery according to TLS status. (F) Kaplan-Meier survival curves for disease-free survival rates for 51 patients with bladder cancer following surgery according to TLS maturity. The p value was obtained from the log-rank test.
In total, 51 patients treated with radical cystectomy were enrolled, and 55% (28/51) of these patients had TLS-positive tumors. In the bladder cancer samples, we found follicle-like structures, including primary (18%, 5/28) and secondary (32%, 9/28) follicle-like TLSs, as illustrated in figure 4B,C. The pathological features did not show any associations with TLSs in bladder cancer (online supplemental table 2), and Kaplan-Meier analysis revealed that TLSs had the exact opposite prognostic impact on bladder cancer as on ccRCC following surgery (figure 4D,E). Interestingly, this trend continued as the maturity of TLSs increased, helping stratify the prognosis of patients with bladder cancer (figure 4F). Furthermore, multivariate analysis revealed that the presence of TLSs had a negative effect on subsequent disease recurrence (HR 0.25, p=0.009) following surgery, independent of sex and pathological T stage (online supplemental table 3).
Next, we explored the difference between the phenotypes of ccRCC and bladder cancer in terms of TLSs. First, a significantly higher proportion of patients with bladder cancer had TLS positivity (55%, p=0.005) than ccRCC patients (31%, 33/105). Second, the maturity of the TLSs in bladder cancer were markedly different from that in ccRCC, with up to 30% of TLS-positive bladder cancer presenting mature secondary follicle-like TLSs (p<0.001, figure 5A). Third, the spatial TLS distribution was significantly different between the two cancer types; TLSs were more likely to occur inside bladder cancer tumors than inside ccRCC tumors (p<0.001, figure 5B). Furthermore, a higher density of TLSs was found in TLS-positive bladder cancer specimens than in TLS-positive ccRCC specimens (p=0.016, figure 5C). Finally, the labeling of bladder cancer specimens for CD8, FOXP3, PD-1, and PD-L1 showed marked differences in the diversity of the immune microenvironment surrounding TLSs. Compared with TLSs in ccRCC, those in bladder cancer had significantly higher proportions of CD8-, FOXP3-, and PD-L1-positive cells but a significantly lower proportion of PD-1-positive cells (figure 5D). Interestingly, by examining prognostic differences based on the CD8/FOXP3/PD-1/PD-L1 status of TLSs, the presence of infiltrating PD-1+ T cells in TLSs could stratify the prognosis of TLS-positive tumors in ccRCC (p=0.012) (online supplemental figure 3AB).

Differences in tertiary lymphoid structure (TLS) status between kidney and bladder cancer. (A) Differences in TLS maturity between clear cell renal cell carcinoma (ccRCC) (cohort A) and bladder cancer (cohort D). The p value was obtained from the chi-square test. (B) Differences in TLS distribution between ccRCC (cohort A) and bladder cancer (cohort D). The p value was obtained from the χ2 test. (C) Comparison of the tumor area occupied by the TLSs in ccRCC (cohort A) and bladder cancer (cohort D). The p value was obtained from the Mann-Whitney U test. (D) Differences in TLS status according to the infiltration of CD8+/FOXP3+/PD-1+/PD-L1+ cells in ccRCC (cohort A) and bladder cancer (cohort D). The p value was obtained from the χ2 test. (E) summary of TLS status in all tumors of the ccRCC cohort (cohort a) and bladder cancer cohort (cohort D).
Our results are summarized in figure 5E. Taken together, these findings indicate that the TLS status and features of ccRCC and bladder cancer differ in a variety of aspects, which may explain the discrepancy in the impact of TLSs on prognosis in these two cancer types.
Discussion
Recently, new strategies targeting TLS neogenesis have been considered, for example, in patients who received prior T cell-based immunotherapy.12 31 Indeed, previous reports have suggested that the presence of TLSs has a positive effect on prognosis in many types of cancer.8 9 However, the negative prognostic implications of TLSs in some cancers such as hepatocellular carcinoma32 cannot be ignored. Thus, attempts to blindly increase the number of TLSs may require caution in future immuno-oncological approaches, as the potential risk for hyperprogressive disease with TLS-based approaches should be considered. However, little is known about TLSs in urinary kidney and bladder cancers.33 In this study, we proposed three major findings that can be translated to future practice.
First, the immunobiology of ccRCC is unique among malignancies.34 We herein characterized TLSs in ccRCC and revealed that the presence of TLSs was related to a poor prognosis following surgery and that TLS-positive tumors showed resistance to antiangiogenic treatments after disease relapse. These negative impacts of TLSs in ccRCC on clinical outcomes are contradictory to that observed for many immunotherapy-sensitive tumors, including bladder cancer, as shown in this study. A possible underlying cause may be because ccRCC is a representative cytokine-producible cancer, in which the mTOR pathway is vital for ccRCC tumorigenesis and development.35 36 Genetic alterations in PI3K-mTOR pathway components were highly prevalent in tumors with TLSs, producing many proinflammatory and proangiogenic cytokines.37 38 Abundant cytokines are central to the recruitment of B and T cells that form TLSs.38–40 However, excessive cytokines in aggressive tumors may create an immunosuppressive environment, thus acting as a double-edged sword in ccRCC.38
Second, histological assessments of TLSs further highlighted the uniqueness of the immunobiology of ccRCC in terms of the degree of phenotypical maturity and spatial distribution of TLSs. A comparison of ccRCC and bladder cancer specimens showed that renal TLSs stayed immature, and no follicle-like TLSs were detected with the germinal center in ccRCC. Furthermore, the TLSs in ccRCC often formed at IMs and did not often penetrate the central core into the tumor. In contrast, the TLSs in the bladder could be mature, i.e., secondary follicle-like TLSs, and extend far into the TC. Notably, the spatial distribution pattern of TLSs (eg, IM only vs TC only/TC and IM; TC only vs IM only/TC and IM) did not have any impact on prognosis in either cohort of either cancer. However, the phenotypic maturity of TLSs could stratify the prognosis of patients with bladder cancer, as shown in figure 4F, possibly revealing one of the reasons for the opposite prognostic implications of TLSs in ccRCC and bladder cancer.
Third, the assessment of infiltrating immune cells further deepened our understanding of the differences between the TLSs in ccRCC and bladder cancer. We found a higher rate of CD8- and FOXP3-positive cell infiltration into TLSs in bladder cancer samples, and both immune cell types have been reported as favorable prognostic factors in bladder cancer.41 On the other hand, we found that the TLSs in ccRCC had a significantly higher frequency of infiltrating PD-1-positive cells than those in bladder cancer, indicating obvious T cell exhaustion in the TLS cells in ccRCC. At this stage, the clinical meaning of enriched PD-L1-positive cells adjacent to TLSs in bladder cancer is currently unclear. However, since infiltrating PD-1+ T cell status can predict which patients with TLSs in ccRCC will have a poor prognosis (see online supplemental figure 3A), our results may suggest that TLSs, which may act as the forefront of tumor immunity, remain functionally impaired in ccRCC.
In summary, analyzing the landscape of TLSs between urinary kidney and bladder cancer revealed differences in the prognostic impact, phenotypic maturity and spatial distribution of TLSs and in the immune environment surrounding TLSs in both cancers. Our findings on the paradoxical TLS properties between the two cancers may help clarify the cancer-specific immunobiological mechanisms of solid tumors and act as a good indicator of the response to newly developed immunotherapies. However, some limitations remain to be addressed at this stage. First, our study was retrospective, and a limited number of patients were included in the analysis. Second, little data are currently available on the real impact of TLSs on the response to immunotherapy in both cancers. Last, the cancerous effects of TLSs on patient outcome and tumor microenvironment in malignancies need to be supported by biological evidence. Thus, further studies including prospective studies and/or validations of large datasets are needed to provide robust evidence related to TLS in the future.
Data availability statement
Data are available on reasonable request. The data will be shared on reasonable request to the corresponding author.
Ethics statements
Patient consent for publication
Ethics approval
After gaining approval from the Institutional Review Board, this study randomly collected formalin-fixed and paraffin-embedded (FFPE) tumor samples obtained at Keio University Hospital (Tokyo, Japan) from patients sorted into three different retrospective cohorts with regard to histological type, pathological T stage, and systemic therapy used.
References
Supplementary materials
Supplementary Data
This web only file has been produced by the BMJ Publishing Group from an electronic file supplied by the author(s) and has not been edited for content.
Footnotes
Contributors NT conceived this study TM and NT designed the experiments. TM performed and analysed all the experiments with the help of KT, KH, RT, TA, RK, KS, SM, TS and TK provided advise for bioinformatics analysis. EA and HN performed genetic experiments. NT and TM wrote the manuscript with inputs from RM and MO. NT and TM are responsible for the overall content as guarantor.
Funding This study was supported by Grants-in-Aid for Scientific Research (KAKENHI 21K07156 to TM; 19H03792 and 21K19414 to NT; 18K09150 to TS and 18H02939 to MO) and grants from the Kobayashi Foundation for Cancer Research (to NT), the SGH Foundation for Cancer Research (to NT), the JUA Research Grant (to NT), and the Keio Gijuku Academic Development Funds (to NT).
Competing interests No, there are no competing interests.
Provenance and peer review Not commissioned; externally peer reviewed.
Supplemental material This content has been supplied by the author(s). It has not been vetted by BMJ Publishing Group Limited (BMJ) and may not have been peer-reviewed. Any opinions or recommendations discussed are solely those of the author(s) and are not endorsed by BMJ. BMJ disclaims all liability and responsibility arising from any reliance placed on the content. Where the content includes any translated material, BMJ does not warrant the accuracy and reliability of the translations (including but not limited to local regulations, clinical guidelines, terminology, drug names and drug dosages), and is not responsible for any error and/or omissions arising from translation and adaptation or otherwise.