Article Text

Abstract
Background Immune checkpoint inhibitors as monotherapies for advanced hepatocellular carcinoma (HCC) fail to achieve satisfying results, while combination therapies show greater efficacy. Therefore, identifying new combined targets for immune checkpoint inhibitors could be promising.
Methods We combined the cancer–immunity cycle score with weighted gene coexpression network and system analyses to screen immunosuppressive targets in HCC. In vitro and in vivo experiments were used to assess the effect of zinc finger protein 207 (ZNF207) on HCC immunity. RNA sequencing, metabolomic, cytokine array analysis, dual-luciferase reporter gene assay, and ChIP quantitative PCR assay were used to investigate the role of ZNF207 in tumor immunity regulation.
Results The system analysis and experimental verification revealed ZNF207 as an immunosuppressive target in HCC. Hypoxia-induced upregulation of ZNF207 promoted HCC progression in immunocompetent mice while being associated with decreased CD8+ T-cell infiltration and increased exhaustion. Mechanistically, the mitogen-activated protein kinase (MAPK)–chemokine C-X3-C-motif ligand axis was involved in ZNF207-mediated CD8+ T-cell chemotaxis. Furthermore, ZNF207 transcriptionally regulated indoleamine 2,3-dioxygenase 1 and elevated kynurenine levels, leading to the exhaustion of CD8+ T cells. Patients with lower ZNF207 expression were more sensitive to antiprogrammed cell death protein 1 (PD1) therapy, and silencing ZNF207 could be beneficial to anti-PD1 combination therapy.
Conclusion Our study implicates ZNF207 in suppressing the HCC microenvironment and showed the feasibility of targeting ZNF207 during anti-PD1 therapy in HCC.
- combined modality therapy
- computational biology
- immunotherapy
- liver neoplasms
- tumor microenvironment
Data availability statement
Data are available in a public, open access repository. All data used or analyzed are included in this article and are available from the corresponding author upon reasonable request. The RNA sequencing data in this manuscript have been deposited in NCBI’s Gene Expression Omnibus and are accessible using accession number GSE167935.
This is an open access article distributed in accordance with the Creative Commons Attribution Non Commercial (CC BY-NC 4.0) license, which permits others to distribute, remix, adapt, build upon this work non-commercially, and license their derivative works on different terms, provided the original work is properly cited, appropriate credit is given, any changes made indicated, and the use is non-commercial. See http://creativecommons.org/licenses/by-nc/4.0/.
Statistics from Altmetric.com
Introduction
Hepatocellular carcinoma (HCC) is the third leading cause of cancer-related mortalities globally and a major threat to public health.1 In first-line and second-line clinical settings, phase III clinical trials failed to show the survival benefits of immune checkpoint blockade agents for the treatment of unresectable HCC.2 3 The objective response rates range between 15% and 20% when using these agents as monotherapies for HCC.4 The main limitations of existing immune checkpoint blockade therapies stem from multiple immune checkpoint pathways, as well as the lack of tumor infiltration by immune cells, and excessive exhaustion of immune cells.5–8 Several preliminary large phase III trials (eg, ORIENT-32, COSMIC-312, and HIMALAYA) used anti-PD1 or anti-programmed death-ligand 1 (PD-L1) agents combined with anti-CTLA4 or antiangiogenic agents (ie, combination therapies) and reported better survival compared with sorafenib monotherapy for unresectable HCC.9–11 Thus, the identification of new immune checkpoints and developing new combination treatments have become the major focus of HCC immunotherapy studies.
A comprehensive understanding of cancer–immunity interactions is essential for screening new targets for combination therapy. The cancer–immunity cycle elucidates on antitumor immune responses and offers an opportunity to understand the interactions between cancer and its immune system.12 It can be used to visualize personalized antitumor immune responses in patients with HCC, which is correlated with their clinical outcomes.13 Based on the current findings, we tried to combine the cancer–immunity cycle score with bioinformatics to systematically explore immunosuppressive targets in HCC. The gle2-binding-sequence (GLEBS) motif-containing zinc finger protein 207 (ZNF207) obtained in our systematic analysis is a member of the ZNF protein family, which plays an essential role in self-renewal, pluripotency, and differentiation of human embryonic stem cells.14–16 HCC cells have elevated expression of ZNF207, which is associated with poor prognosis.17 However, the mechanisms by which ZNF207 accelerates HCC progression are unknown, and its role in tumor immunity has not been established.
In this study, we systematically combined bioinformatic methods with experimental techniques to evaluate the immunosuppressive target ZNF207 in HCC in vitro and in vivo. Furthermore, we verified its potential as a biomarker and combination target for antiprogrammed cell death protein 1 (PD1) therapy. Lastly, we investigated the role of abnormal ZNF207 expression in HCC and its mechanism in accelerating HCC progression in terms of CD8+ T-cell regulation. This study will elaborate our understanding of the mechanisms activating HCC progression, as well as provide potential therapeutic targets for treatment and prognosis of HCC.
Methods
Data and resources
The GDC download tool (https://portal.gdc.cancer.gov) from the Cancer Genome Atlas (TCGA) database was used to download the transcriptome data and clinical data for liver cancer (TCGA-liver hepatocellular carcinoma, LIHC). The fragments per kilobase million format expression data was used for subsequent expression-related analysis; the eight liver cancer microarray datasets (GSE14520, GSE17856, GSE25097, GSE36376, GSE45114, GSE54236, GSE64041, and GSE76427) can be downloaded from the GEO database (https://www.ncbi.nlm.nih.gov/geo/). When multiple probes correspond to the same gene symbol, the mean value was considered the final value, and all data were normalized by log2.
WGCNA and hub gene screening
The R software ‘WGCNA’ package was used to construct a weight coexpression network. Normalized LIHC transcriptome expression data was used as a data matrix for WGCNA. The cancer–immunity cycle scores of HCC samples were obtained from the TIP database (http://biocc.hrbmu.edu.cn/TIP/) as clinical phenotypes for subsequent WGCNA. A fit β value=10 was selected to ensure the coexpression network is a scale-free network. The expression matrix was converted into an adjacency matrix and then converted into a topological matrix. Based on the topological overlap, the average-linkage hierarchical clustering method was used to cluster genes. According to the standard of the hybrid dynamic shearing tree, the minimum number of genes in each gene network module was set to 30. The eigengenes of each module were calculated, the modules clustered, and height set to 0.25; the gray module comprises genes that cannot be clustered into other modules. According to the eigengenes of each module, the correlation between these modules and each phenotype was calculated; the module phenotype correlation heat map was pictured; and modules with higher correlation were selected for subsequent analysis.
The protein–protein interaction (PPI) network of the interesting modules was constructed using Cytoscape v3.2.1, and then the topology heterogeneity of each node in the PPI network was analyzed. The degree value of each node was used to evaluate its importance. Finally, 10 nodes with the largest degree value in the network were selected. Simultaneously, analyzing the correlation between the genes and modules of interest, genes with a correlation >0.9 were selected. Genes meeting both the above two criteria were defined as hub genes.
Antibodies and reagents
Anti-ZNF207 (PA5-53535, PA5-30641, #703747) and anti-CD3z (4B10) (MA5-15608) antibodies were purchased from Invitrogen (Waltham, Massachusetts, USA). Anti-beta actin (ab8226) antibody was purchased from Abcam (Cambridge, UK). Anti-HIF-1α (D1S7W; #36169), anti-HIF-2α (D6T8V; #59973), anti-CD8α (D4W2Z; #98941), and anti-PCNA (PC10; 2586) antibodies were purchased from Cell Signaling Technology (Danvers, Massachusetts, USA). Mouse C-X3-C-motif ligand (CX3CL1)/fractalkine chemokine domain antibody (MAB571) was purchased from R&D Systems (Minneapolis, Minnesota, USA). Anti-glyceraldehyde 3-phosphatedehydrogenase (GAPDH) (UPS002) was purchased from Upsbiotech. Mouse anti-PD1 (BE0146) and rat IgG2a isotype control antibody (BE0089) were purchased from Bio X Cell (Lebanon, New Hampshire, USA). Bay 87–2243 (S7309), PT2385 (S8352), PF-06840003 (S8657), and SB203580 (S1076) were purchased from Selleck (Houston, Texas, USA).
Animals and tumor implantation
C57BL/6N, BABL/c, and BABL/c-nude male mice (6 weeks old, 18–20 g) were purchased from Beijing Vital River Laboratory Animal Technology and housed in a specific pathogen-free environment with a 12/12 hour day/night cycle.
To establish the subcutaneous xenograft tumor model, HCCLM3 was subcutaneously inoculated with 2×10⁶ cells/mouse on the right flank of BABL/c-nude mice. PLC/PRF/5 was subcutaneously inoculated with 5×10⁶ cells/mouse, and Hepa1–6 was subcutaneously inoculated with 2×10⁶ cells/mouse on the right flank of C57BL/6 mice. The tumor size was measured every 3 days using a digital caliper (Guanglu, Taizhou City, China). Tumor volume was calculated using the formula (length×width2/2.
For adeno-associated virus intervention, male BABL/c mice (6 weeks old, 18–20 g) were used. The mouse ascites tumor cells H22 with luciferase fluorescence were inoculated into the liver envelope of BABL/c mice at a concentration of 1×10⁵ cells/mouse to construct a mouse liver orthotopic tumor model. After 3 days of inoculation, animal chemiluminescence imaging was performed, and the mice were grouped according to the fluorescence value. In vivo imaging observation was performed 3 weeks after the intervention, before the mice were sacrificed, and liver tumors were photographed.
Proteome profiler assay (cytokine array)
Hepa1–6-shNC and Hepa1–6-shZNF207 (5×10⁶) were cultured in 10 cm dishes for 48 hours and the cell supernatant was harvested. The cells were then washed with phosphate buffered saline (PBS), lysed with IP lysate, and centrifuged at 12 000 g for 10 min. However, conditioned media and the supernatant of cell lysates were assayed using the R&D Systems Proteome Profiler Mouse XL Cytokine Array kit (ARY028) according to the manufacturer’s instructions.18 19 Protein concentration was normalized before starting the assay. Chemiluminescence was detected by a charge-coupled device (CCD)camera (ChemiDoc MP; Bio-Rad, Hercules, California, USA). The pixel density of each spot was measured using ImageJ. The spots were averaged; the background was subtracted; and the average values were reported for each cytokine.
ChIP quantitative PCR assay (ChIP-qPCR)
To measure the binding activity of ZNF207 or indoleamine 2,3-dioxygenase 1 (IDO1) in vivo, a ChIP assay was conducted with the SimpleChIP Plus Enzymatic Chromatin IP Kit (#9005, CST) according to the manufacturer’s protocol of 8024 cells. Briefly, 1×10⁷ cells were cultured in hypoxia condition (1% O2) for 24 hours or transfected with ZNF207-OE plasmid for 48 hours, then washed twice in PBS, crosslinked with formaldehyde, lysed with sodium dodecyl sulfate buffer, and sonicated. After sonication, the fragmented chromatin was added into ChIP dilution buffer and incubated overnight with anti-HIF1α (CST, 36169, USA) and anti-HIF2α monoclonal antibody (#59973, CST) or anti-ZNF207 (#703747, Invitrogen). A normal rabbit IgG (#2729, CST) was added as a negative control antibody, and the histone H3 rabbit monoclonal antibody was used as a positive control. Immunoprecipitated products were collected after incubation with protein A+G-coated magnetic beads. The bound chromatin was eluted and digested with proteinase K, then the DNA was purified for RT-qPCR analysis (the primers are listed in online supplemental materials and methods).
Supplemental material
Statistical analysis
All data analyses were done using GraphPad Prism V.8 or SPSS V.19. Two-tailed Student’s t-tests were performed when only two groups were compared. The paired t-test was used to analyze the difference in ZNF207 expression between 50 paired HCC samples. One-way analysis of variance followed by Dunnett’s post-tests was used to compare differences between multiple groups unless otherwise stated. The χ2 test was used to analyze the relationship between ZNF207 and clinical indices. Pearson’s analysis was used for correlation analysis. Kaplan-Meier analysis was used for the survival analysis.
Additional experimental procedures are described in the online supplemental materials and methods.
Results
ZNF207 is a potential immunosuppressive target in HCC
To find potential immunosuppressive targets in HCC, we used the cancer–immunity cycle scores and HCC transcriptome data for WGCNA network analysis. Cluster analysis divided all genes into 20 modules. Then, we conducted correlation analysis on all modules which revealed two clusters with similar internal expression patterns (figure 1A). Further analysis found modules in cluster 1 were positively correlated with steps 1–4 of the cancer–immunity cycle, while modules in cluster 2 were negatively correlated with steps 5–7 (figure 1B). Consistently, higher cancer–immunity cycle scores can be observed from steps 5 to 7 of the cycle in the ZNF207low expression group (online supplemental figure S1A). Respectively, brown and turquoise were the modules with the most significant differences in clusters 1 and 2. To figure out the functions of these two modules, we performed Gene Ontology annotation analysis. Unsurprisingly, genes in the brown module were enriched in immune-related signaling pathways which show a positive correlation with steps 1–4 of the cancer–immunity cycle (figure 1C), while genes in the turquoise module were mainly enriched in RNA transport, RNA splicing, and spindle assembly processes which show negative correlation with steps 5–7 of the cancer–immunity cycle (figure 1D). Although it has been reported that the RNA splicing process is related to immunity,20 its involvement in the immune process is still unclear. To identify immunosuppressive targets in HCC, we focused on the turquoise module. As described in the Methods, we screened the core genes in the turquoise module from two criteria. Both DEAH box protein 9 (DHX9) and ZNF207 met the screening criteria (figure 1E and online supplemental figure S1B–D). DXH9 has already been reported to be involved in immune response mediated by nuclear factor-κB (NF-κB)21 and regulates toll-like receptor-stimulated immune responses22; hence, we mainly focused on ZNF207. Taken together, the data show that ZNF207 may be a potential unreported immunosuppressive target.
Supplemental material
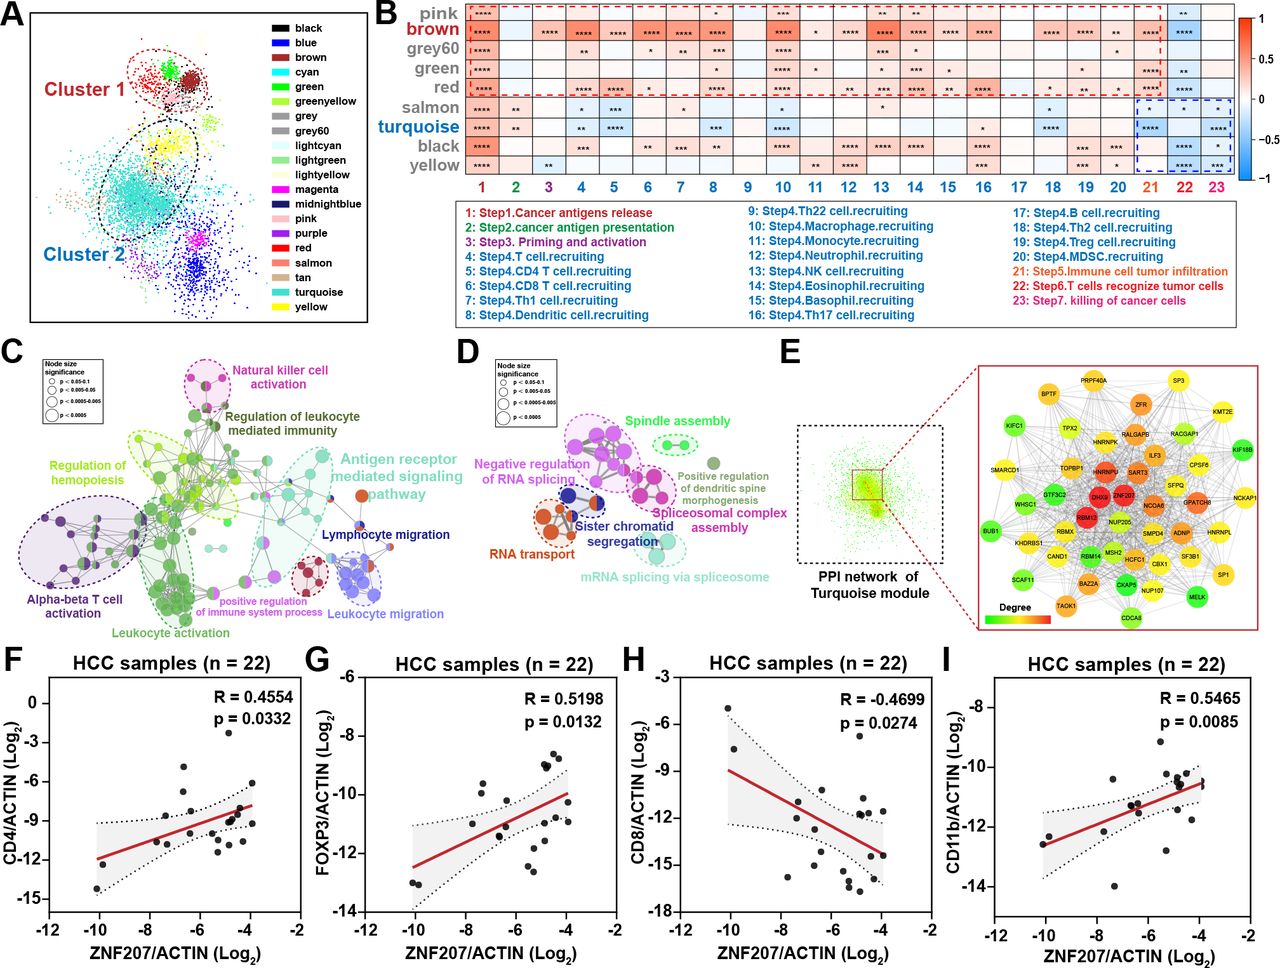
ZNF207 is a potential immunosuppressive target in HCC. (A) Liver cancer data from the TCGA database were used to construct the WGCNA coexpression network; each color represents a type of module, and each node represents a gene. Modules in clusters 1 and 2 show similar expression patterns. (B) Heatmap shows the correlation of each module with cancer immune cycle scores in two clusters. Red represents a positive correlation, while blue represents a negative correlation. The ClueGO plug-in was used to perform pathway enrichment for the core genes in (C) brown and (D) turquoise modules. Each node represents a biological process; nodes with the same color have similar functions. Node size shows the significance of enrichment. (E) PPI network of genes in the turquoise module; the enlarged image shows the core nodes in the network, and the red nodes are the core nodes in the network. (F–I) Clinical HCC samples were used to detect the correlation between immune cell marker genes and ZNF207 by quantitative reverse transcription PCR (RT-qPCR), |R|>0.3, n=22. *P < 0.05; **P < 0.01; ***P < 0.001. HCC, hepatocellular carcinoma; MDSC, myeloid-derived suppressor cells; NK, natural killer; PPI, protein–protein interaction; Treg, regulatory T cell; ZNF207, zinc finger protein 207.
Furthermore, ZNF207 was observed to be positively correlated with an immune escape signature23 and negatively correlated with the percentage of infiltrated cytotoxic T cells in HCC tumor tissue (online supplemental figure S1E,F). Elevation of ZNF207 was also observed to correlate with reduced T-cell infiltration in copy number variation analysis (online supplemental figure S1G,H). Moreover, RT-qPCR was performed on 22 clinical HCC samples and revealed strong positive correlations between ZNF207 and CD4 (R=0.4554, p=0.0332), FOXP3 (R=0.5198, p=0.0132), CD11b (R=0.5465, p=0.0085), and CD68 (R=0.4713, p=0.031). Exceptions were CD8A (R=–0.4699, p=0.0274), C2 (R=–0.6148, p=0.0023), and C3 (R=–0.6126, p=0.0024), which were associated with cytotoxic T cells and complement immune responses (figure 1F–I and online supplemental figure S1I–K). In summary, through bioinformatics analysis and preliminary experimental verification, we screened and identified ZNF207 as a potential immunosuppressive target in HCC, which may be correlated with steps of the cancer–immunity cycle (including immune cell infiltration, cancer cell recognition, and killing).
ZNF207 is highly expressed in HCC and associated with poor prognosis
The progression of HCC is usually accompanied by abnormal gene expression and poor prognosis. Expression of ZNF207 in matched HCC tissues was found to be higher than that in adjacent samples (figure 2A). Data from the Oncomine and GEO databases revealed a consistent trend (figure 2B,C, and online supplemental figure S2A,B). In HCC samples, ZNF207 showed a significant increase at both the transcriptional and translational levels (figure 2D,E, and online supplemental figure S2C). Immunohistochemistry (IHC) analysis revealed that ZNF207 was mainly overexpressed (overexpression (OE)) in the nucleus, consistent with its role as a transcription factor (figure 2F and online supplemental figure S2D). The key genes in HCC progression were usually correlated with cancer stages and patient prognosis. Patients with HCC showed more advanced stage, grade, and T stage in the ZNF207high expression group (figure 2G) as well as shorter overall and disease-free survival outcomes in multiple datasets (figure 2H and online supplemental figure S2E,F). Univariate and multivariable Cox model analysis further revealed ZNF207 as an independent prognostic factor for HCC (online supplemental figure S2G and online supplemental table S1) in online supplemental materials and methods). Overall, our findings show that ZNF207 is highly expressed in HCC and is associated with a poorer prognosis.
Supplemental material
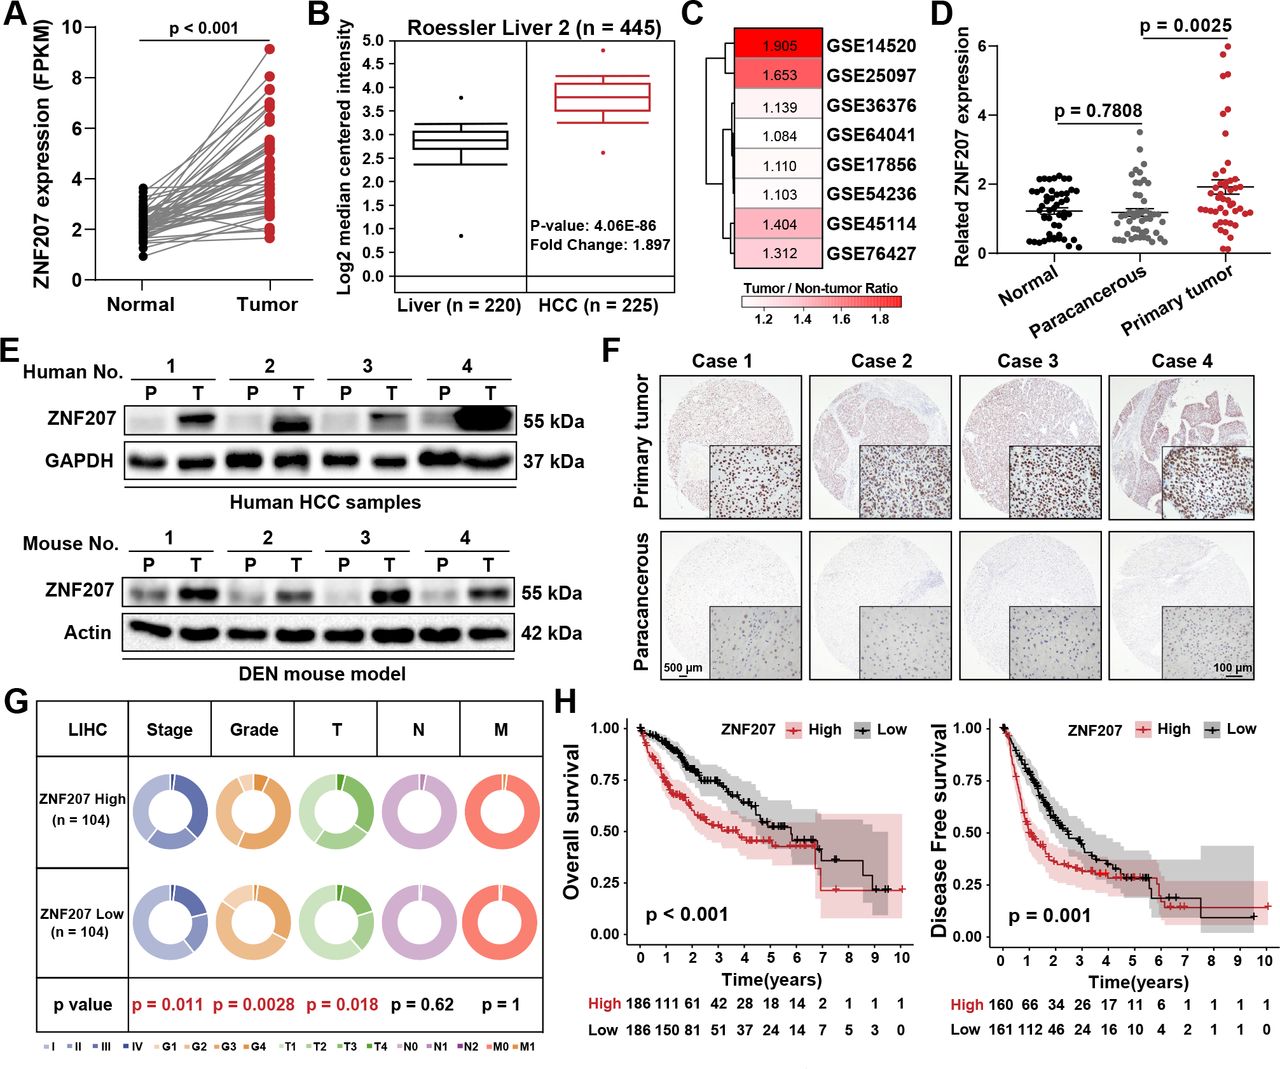
ZNF207 is highly expressed in HCC and is associated with a poor prognosis. The public databases were used to analyze the differential expression of ZNF207 in liver cancer and paracancerous tissues. (A) TCGA (n=50), (B) Oncomine (normal, n=220; tumor, n=225), and (C) GEO databases. (D) RT-qPCR was used to detect the mRNA levels of ZNF207 in cancer nests (n=50), adjacent tissue (n=50), and normal tissues of patients with HCC (n=49). (E) Western blot was used to measure ZNF207 protein level in clinical HCC (n=4) and DEN-induced orthotopic HCC samples (n=4). (F) Protein level of ZNF207 in paracancerous and primary HCC samples was detected by immunohistochemistry (n=30). (G) The circular pie chart shows the proportion difference of clinical indices (including tumor, node, metastasis stages and pathological grade) in the ZNF207high and ZNF207low expression groups from the TCGA LIHC dataset. (H) Prognostic relationship (OS and DFS) between ZNF207 and patients with HCC. DEN, diethylnitrosamine; DFS, disease free survival; FPKM, Fragments Per Kilobase of exon model per Million mapped fragments; HCC, hepatocellular carcinoma; OS, overall survival; ZNF207, zinc finger protein 207.
Hypoxia elevates ZNF207 in HCC
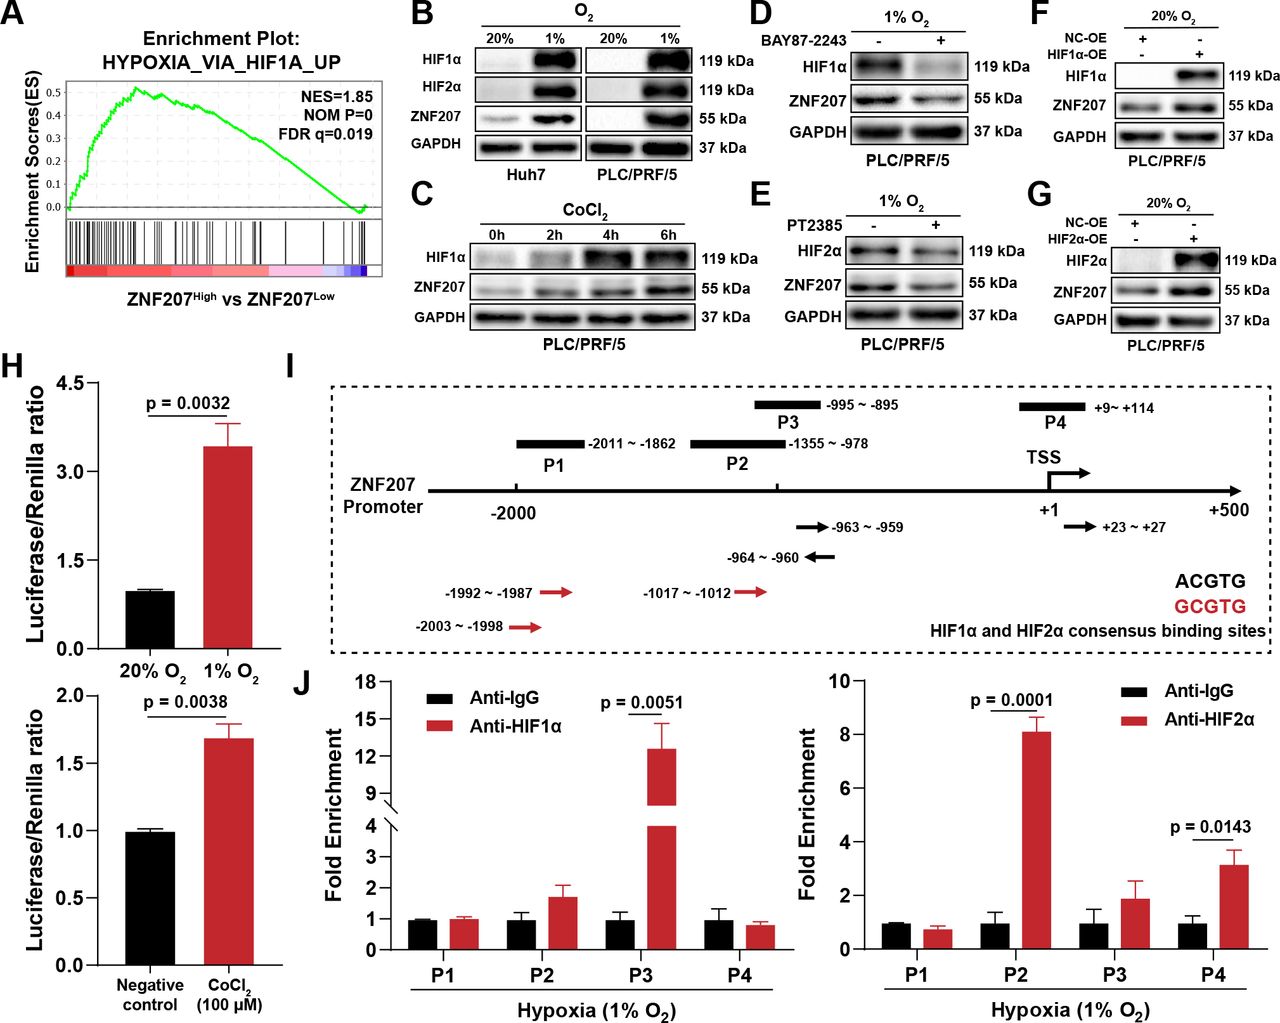
Next, we examined how ZNF207 was upregulated in HCC by gene set enrichment analysis (GSEA). We found that the ‘HYPOXIA_VIA_HIF1A_UP’ gene signature was significantly enriched in the ZNF207high group (figure 3A). Experimentally, we observed both physically- and chemically-simulated hypoxia could elevate the protein level of ZNF207 (figure 3B,C, and online supplemental figure S3A), which could be reversed by inhibitors of hypoxia-inducible factor 1α (HIF1α) (BAY87-2243) and HIF2α (PT2385). In comparison, BAY87-2243 exerted a stronger inhibitory effect on ZNF207 under hypoxia conditions (figure 3D,E). Using plasmids to overexpress HIF1α and HIF2α under normoxia conditions, we found that the effect of hypoxia on ZNF207 could be reproduced (figure 3F,G). To analyze the transcriptional regulation effect of HIF on ZNF207, we conducted a dual-luciferase reporter gene experiment. Both hypoxia and cobaltous chloride incubation enhanced the fluorescence intensity of the ZNF207 promoter gene (figure 3H). The ChIP-qPCR assay was used to confirm the candidate HIF binding sites, which could match the consensus sequence 5′-(A/G)CGTG-3′24 in the ZNF207 promoter. The ZNF207 promoter (–2000 to +200 from the translation start site (TSS)) region has six HIF consensus-binding sites (figure 3I). Chromatin fragments containing two DNA sequences, located in the promoter region of the ZNF207 –959/–964 bp relative to the TSS, were immunoprecipitated with an anti-HIF-1α antibody under hypoxia conditions. One DNA sequence located –1012/–1017 bp relative to TSS was immunoprecipitated with an anti-HIF2α antibody under both normoxia and hypoxia conditions (figure 3J and online supplemental figure S3B,C). In brief, hypoxia can elevate ZNF207 expression in HCC by transcriptional regulation.
Supplemental material

Hypoxia elevates ZNF207 in HCC. (A) HCC gene expression data from the TCGA database were grouped by ZNF207 expression to perform GSEA analysis; the enrichment plot shows the enriched pathway in the ZNF207high expression group. (B) Western blot shows ZNF207, HIF1α, and HIF2α protein levels under physical hypoxia in Huh7 and PLC/PRF/5 (1% O2, 24 hours). (C) PLC/PRF/5 cells treated with 100 µM CoCl2 for different periods and detection of ZNF207 protein level. Effects of the (D) HIF1α inhibitor (BAY87-2243, 10 µM) and (E) HIF2α inhibitor (PT2385, 10 µM) on ZNF207 under hypoxia conditions in PLC/PRF/5 cells. Plasmids were used to overexpress (F) HIF1α and (G) HIF2α to observe the changes in ZNF207. (H) Dual-luciferase reporter gene assay was used to evaluate the effect of hypoxia (24 hours) and CoCl2 (100 μM) treatment on the ZNF207 promoter. (I) The transcription binding sites of HIF1α and HIF2α in the promoter region of ZNF207 and the positions of the corresponding primers. (J) Enrichment of HIF1α and HIF2α on the ZNF207 promoter under hypoxia as detected by ChIP-qPCR. CoCl2, cobaltous chloride; GSEA, gene set enrichment analysis; HCC, hepatocellular carcinoma; ZNF207, zinc finger protein 207.
ZNF207 promotes HCC associated with CD8+ T-cell infiltration and exhaustion
To understand how ZNF207 promotes HCC progression, and whether it is related to tumor immunity, we first evaluated the effect of ZNF207 on cell proliferation in loss-of-function and gain-of-function experiments in vitro. Regardless of ZNF207-knockdown (KD) or ZNF207-OE, the cell proliferation of HCC cell lines remained unchanged (online supplemental figure S4A–C). Furthermore, ZNF207-KD or ZNF207-OE did not alter the growth rate of xenograft tumors in immunodeficient mice (figure 4A,B). These results suggest that ZNF207 is not crucial for HCC cell proliferation in an immunodeficient microenvironment. Based on previous analysis and experimental results, we hypothesized that hepatoma-intrinsic ZNF207 might promote HCC progression by regulating tumor immunity. ZNF207-KD or ZNF207-OE Hepa1–6 cells significantly affected tumor growth rate without showing a difference in cell proliferation in vitro (figure 4C,D, and online supplemental figure S4D–F). C57BL/6 mice were subcutaneous inoculated with these cells. ZNF207-KD or ZNF207-OE changed the positive cell rate of Ki67 and CD31 (online supplemental figure S4G–I), two markers often used to evaluate tumor proliferation and angiogenesis. Furthermore, we used adeno-associated virus 8 to intervene on the H22-induced orthotopic model of HCC. ZNF207-KD or ZNF207-OE adeno-associated virus 8 significantly altered tumor growth in the immunocompetent mice (BALB/c mice) (figure 4E and online supplemental figure S4J). These findings indicate that ZNF207-induced HCC progression is associated with tumor immunity.
Supplemental material
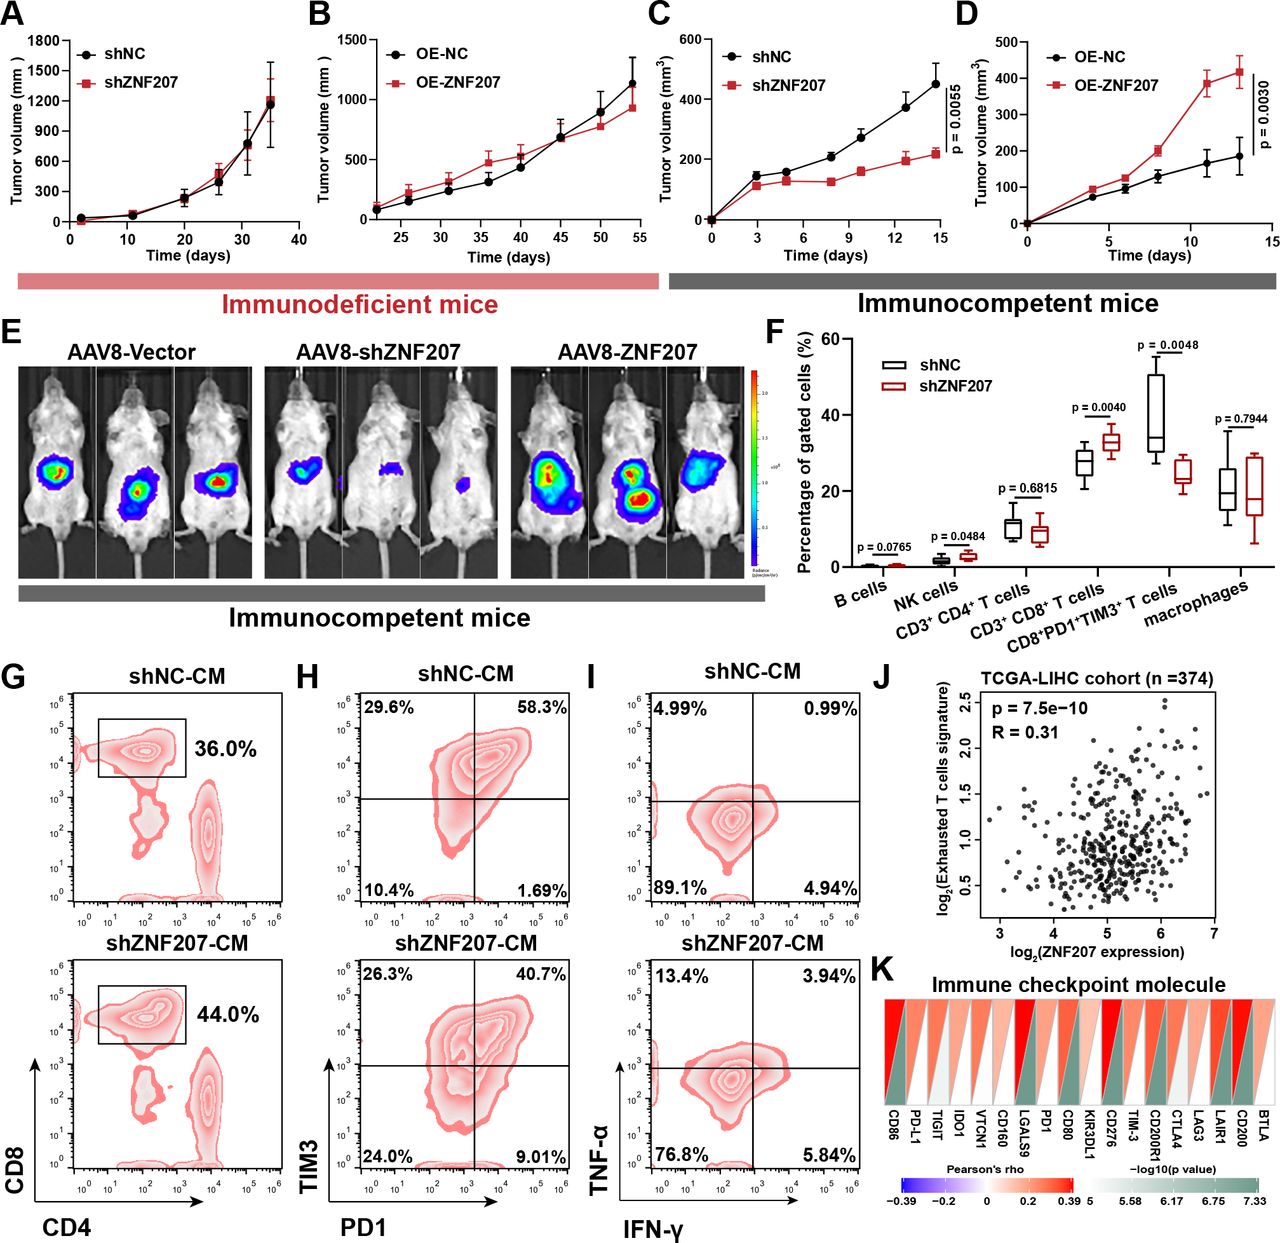
ZNF207 promotes HCC associated with CD8+ T-cell infiltration and exhaustion.In vivo xenograft growth curves of (A) ZNF207-KD (n=7) and (B) ZNF207-OE (n=6) in HCC cells (HCCLM3 for kD; PLC/PRF/5 for oe) inoculated into immunodeficient BALB/c-nude mice. In vivo xenograft growth curve of (C) ZNF207-KD (n=9) and (D) ZNF207-OE (n=10) Hepa1–6 cells in immunocompetent C57BL/6 N mice. (E) After 3 days of inoculating H22 cells at the liver capsule of BALB/c mice, ZNF207-KD and ZNF207-OE adeno-associated virus 8 was injected via the tail vein into mice (n=8), and tumor formation was observed by live imaging at the end of the experiment. (F) Flow cytometry was used to find out the difference in immune cell infiltration in ZNF207-KD tumors (n=10). Conditioned medium from ZNF207-KD Hepa1–6 cells used to study its role on CD8+ T-cell function, including (G) CD8+ T-cell chemotaxis (n=3), (H) exhaustion (n=3), and (I) IFN-γ+ TNF-α+ CD8+ T-cell percentage (n=3). (J) Correlation between ZNF207 and exhausted T-cell signature in the TCGA-LIHC dataset (n=374). (K) Correlations heatmap of ZNF207 and immune checkpoints. HCC, hepatocellular carcinoma; IFN-γ, interferon gamma; KD, knockdown; OE, overexpression; TNF-α, tumor necrosis factor alpha; ZNF207, zinc finger protein 207.
To clarify how ZNF207 promotes the progression of HCC through tumor immunity, we performed flow cytometry analysis on ZNF207-KD and control tumor tissue. ZNF207-KD enhanced CD8+ T-cell infiltration and inhibited its exhaustion (figure 4F and online supplemental figure S5A). Moreover, IHC confirmed that the proportion of CD8+ T cells was elevated in ZNF207-KD tumors (online supplemental figure 5B). Then, the conditioned medium was used to simulate the effect of ZNF207 on T-cell function in vitro. The conditioned medium obtained from ZNF207-KD Hepa1–6 cells showed no significant chemotactic effects on natural killer cells, B cells, and macrophages, while it exhibited a marked chemotactic effect on CD8+ T cells (figure 4G and online supplemental figure S5C-F). Interestingly, the conditioned medium also inhibited the exhaustion of CD8+ T cells in vitro (figure 4H and online supplemental figure S5G), which improved its proliferation and cytokine secretion levels (figure 4I and online supplemental figure S5H,I). Interestingly, ZNF207 is positively correlated with the exhausted T-cell gene signature and immune checkpoint molecules in the TCGA-LIHC dataset, consistent with experimental results (figure 4J,K). The aforementioned results indicate that ZNF207 enhances HCC progression through tumor immunity, which is correlated with infiltration and exhaustion of CD8+ T cells.
Supplemental material
ZNF207 inhibits CD8+ T-cell infiltration through the MAPK–CX3CL1 axis
To clarify the potential mechanism by which ZNF207 affects CD8+ T-cell infiltration and exhaustion, we performed RNA sequencing analysis on Hepa1–6-shZNF207 and Hepa1–6-shNC cells (online supplemental figure S6A). GSEA revealed that the immune and metabolic-related signaling pathways were significantly enriched in the ZNF207-KD group (figure 5A). Moreover, chemokine, cytokine–cytokine receptor interactions, and T-cell receptor signaling pathways were upregulated (figure 5B and online supplemental figure S6B). Subsequently, we verified the upregulation of genes in immune-related pathways by RT-qPCR (online supplemental figure S6C). The upregulation of multiple cytokines and chemokines suggests that ZNF207 may change T-cell functions by influencing cytokine secretion; therefore, we performed a cytokine array to compare 111 cytokines in the cell supernatant and lysate of Hepa1–6-shZNF207 and Hepa1–6-shNC cells. Several cytokines were reportedly closely related to T-cell chemotaxis, such as CX3CL1, CXCL1, CXCL10, and CXCL16, which were significantly increased. Specifically, we mainly focused on CX3CL1 because it had a consistent trend in the supernatant and lysate (figure 5C and online supplemental figure S6D–F). Subsequently, we confirmed the upregulation of CX3CL1 in cell supernatant by ELISA (figure 5D). Furthermore, strong negative correlations between ZNF207 and CX3CL1 were observed in human HCC samples (figure 5E). Next, we determined whether ZNF207-KD-induced CX3CL1 secretion is critical for CD8+ T cell chemotaxis. When treated with CX3CL1 neutralizers, the chemotactic effect of the conditioned medium on CD8+ T cells was weakened (figure 5F). Combination survival analysis also revealed that patients in the CX3CL1lowZNF207high group had the worst overall survival (OS) and highest HR, while the CX3CL1highZNF207low group showed the best survival outcomes (figure 5G). These findings suggest that CX3CL1 plays an important role in ZNF207-mediated CD8+ T-cell infiltration and HCC progression.
Supplemental material

ZNF207 inhibits CD8+ T-cell infiltration through MAPK–CX3CL1 axis. (A) Hepa1–6 knockdown ZNF207 cells were used for RNA sequencing and then subjected to GSEA. Three major types of signal pathways are significantly enriched. (B) GSEA diagram of immune-related signaling pathways significantly upregulated in the ZNF207-KD group. (C) Cytokine array was used to detect 111 cytokines in the CM of ZNF207-KD Hepa1–6 cells; cytokines that significantly changed are boxed in red. (D) Concentration of CX3CL1 in the ZNF207-KD CM was determined by ELISA (n=4). (E) Scatter plot shows the correlation between ZNF207 and CX3CL1 in 22 HCC samples, |R|>0.3; p<0.05 represents a significant correlation (n=22). (F) The T-cell migration experiment was used to study the chemotaxis of CM from ZNF207-KD Hepa1–6 cells, and CX3CL1 neutralizing antibody was further added to observe the changes in T-cell migration (n=3). (G) Combination survival analysis based on CX3CL1 and ZNF207 expressions using the TCGA-LIHC dataset. (H) GSEA map of MAPK signaling pathway enriched in Hepa1–6 shZNF207 group. (I) gene expression of CX3CL1 after p38 MAPK inhibitor SB203580 (10 μM) treatment in Hepa1–6 for 48 hours (n=6). (J) concentration of CX3CL1 in Hepa1–6-shZNF207 cell medium after treatment with p38 MAPK inhibitor SB203580 (10 μM) for 48 hours (n=4). CM, conditioned medium; CX3CL1, C-X3-C-motif ligand; GSEA, gene set enrichment analysis; HCC, hepatocellular carcinoma; KD, knockdown; ZNF207, zinc finger protein 207.

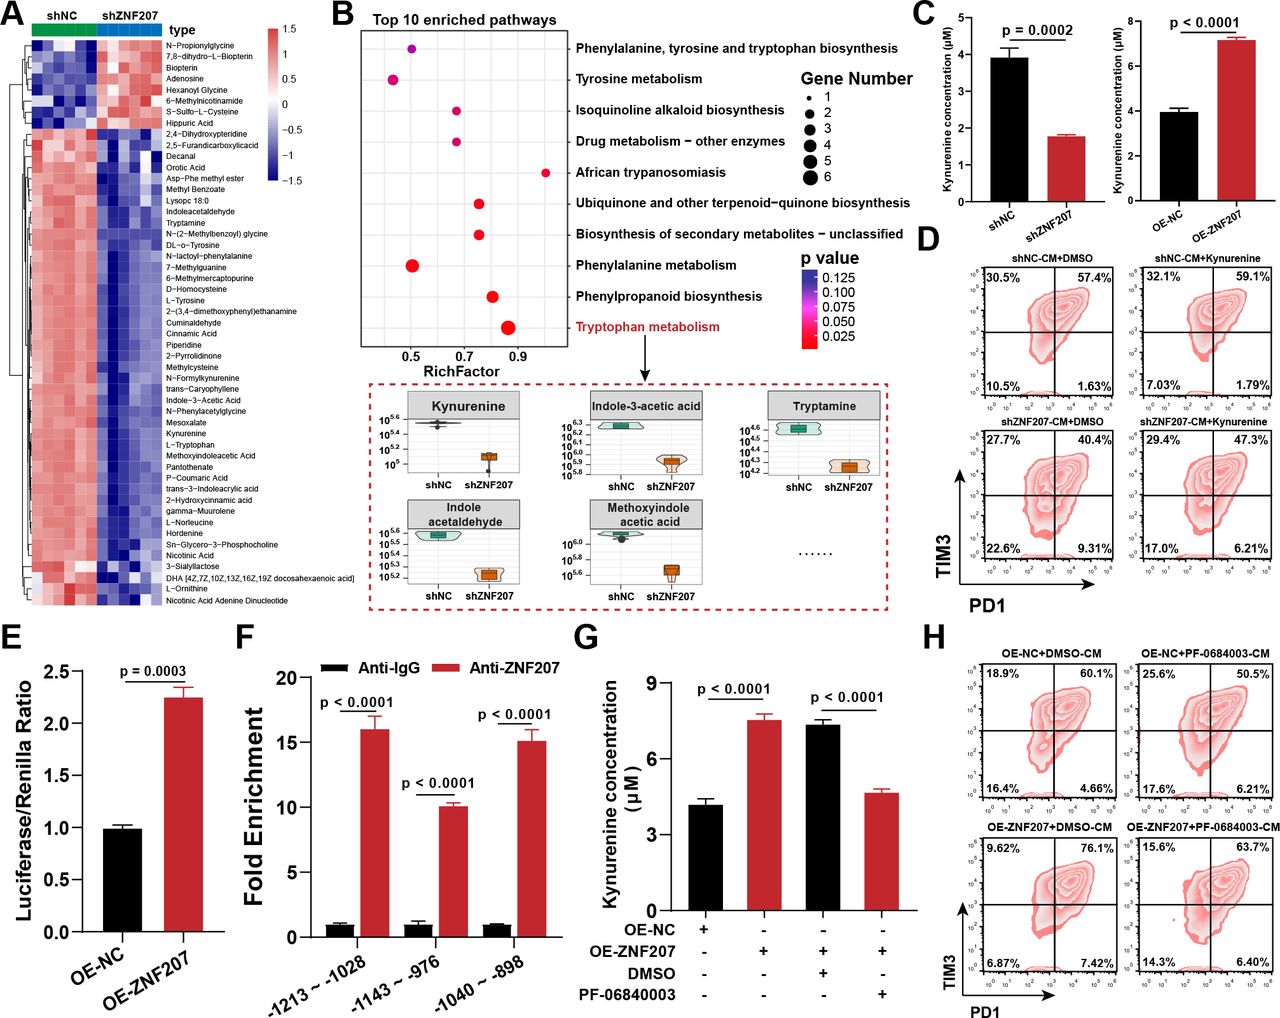
ZNF207 promotes CD8+ T-cell exhaustion by increasing kynurenine levels. (A) Heatmap of differential metabolites after ZNF207-KD, red represents elevated metabolites and blue represents decreased metabolites. (B) KEGG pathway analysis of differential metabolites after ZNF207-KD (top) and levels of enriched metabolites in tryptophan metabolism pathway (bottom). (C) Concentration of kynurenine in the CM of ZNF207-KD and ZNF207-OE cells (n=4). (D) Flow cytometry was used to detect the effect of Hepa1–6-shZNF207-CM supplemented with kynurenine on CD8+ T-cell exhaustion; PD1 and Tim3 double-positive cells are defined as exhausted T cells (n=3). (E) The dual-luciferase reporter gene experiment was used to study the transcriptional regulation of IDO1 by ZNF207. Luciferase levels of the IDO1 promoter were detected after cotransfection of the ZNF207-OE plasmid and IDO1 promoter plasmid (n=3). (F) Enrichment of ZNF207 at the IDO1 promoter region of PLC/PRF/5 after ZNF207-OE, as determined by ChIP-qPCR (n=4). (G) Concentration of kynurenine in the cell supernatant after treatment with IDO1 inhibitor PF-06840003 (2 μM) for 6 hours (n=4). (H) CD8+ T cells were treated with the CM from ZNF207-OE cells pretreated with DMSO and PF-0684003 (2 μM) for 48 hours; T-cell exhaustion was subsequently monitored by flow cytometry. CM, conditioned medium; DMSO, dimethyl sulfoxide; IDO1, indoleamine 2,3-dioxygenase 1; KEGG, Kyoto Encyclopedia of Genes and Genomes; OE, overexpression; ZNF207, zinc finger protein 207.
Previous research has shown that p38 MAPK can regulate CX3CL1 expression in human astrocytes and smooth muscle cells.25 26 Therefore, we hypothesized that a similar regulatory mechanism might exist in HCC cells. In agreement, the MAPK signaling pathway was significantly enriched in the ZNF207-KD group (figure 5A,H). Moreover, we verified the core genes in the MAPK pathway by RT-qPCR, which all showed an increased expression (online supplemental figure S6I,J). We also proved that the p38 MAPK inhibitor (SB203580) can directly inhibit CX3CL1 in Hepa1–6 cells, and the overexpression of CX3CL1 by ZNF207-KD can also be reversed by SB203580 (figure 5I,J). In brief, we showed that ZNF207 might inhibit CD8+ T-cell infiltration through the MAPK–CX3CL1 axis.
ZNF207 promotes CD8+ T-cell exhaustion by increasing kynurenine level
As previous results showed (figure 5A), apart from immune pathways, multiple metabolic pathways (mainly amino acid metabolism pathways) were significantly enriched (figure 5A and online supplemental figure S7A). Various studies have reported the influence of metabolites on T-cell function; thus, we hypothesized that ZNF207 may affect tumor metabolism in regulating CD8+ T-cell function. Therefore, we performed metabolomic analysis on Hepa1–6-shZNF207 versus Hepa1–6-shNC cells. Consistent with the pathway enrichment results, various metabolites were downregulated after ZNF207-KD, with amino acids being the largest components of the differential metabolites (figure 6A and online supplemental figure S7B,C). The Kyoto Encyclopedia of Genes and Genomes pathway enrichment analysis revealed that differential metabolites were significantly enriched in the tryptophan metabolism pathway. The metabolite levels in the tryptophan metabolism pathway, including that of kynurenine, were significantly suppressed after ZNF207-KD (figure 6B). As expected, ZNF207-KD suppressed kynurenine levels in cell supernatants while increasing in stable ZNF207 expression (figure 6C). Multiple studies have shown that kynurenine released by tumor cells can induce T-cell exhaustion,27–30 which explains a partial mechanism of how ZNF207 promotes CD8+ T-cell exhaustion in HCC. Moreover, we added kynurenine to the conditioned medium of ZNF207-KD cells to monitor CD8+ T-cell exhaustion. Indeed, kynurenine supplementation significantly induced CD8+ T-cell exhaustion (figure 6D and online supplemental figure S7D). Taken together, these data show that kynurenine is involved in the CD8+ T-cell exhaustion mediated by ZNF207.
Supplemental material

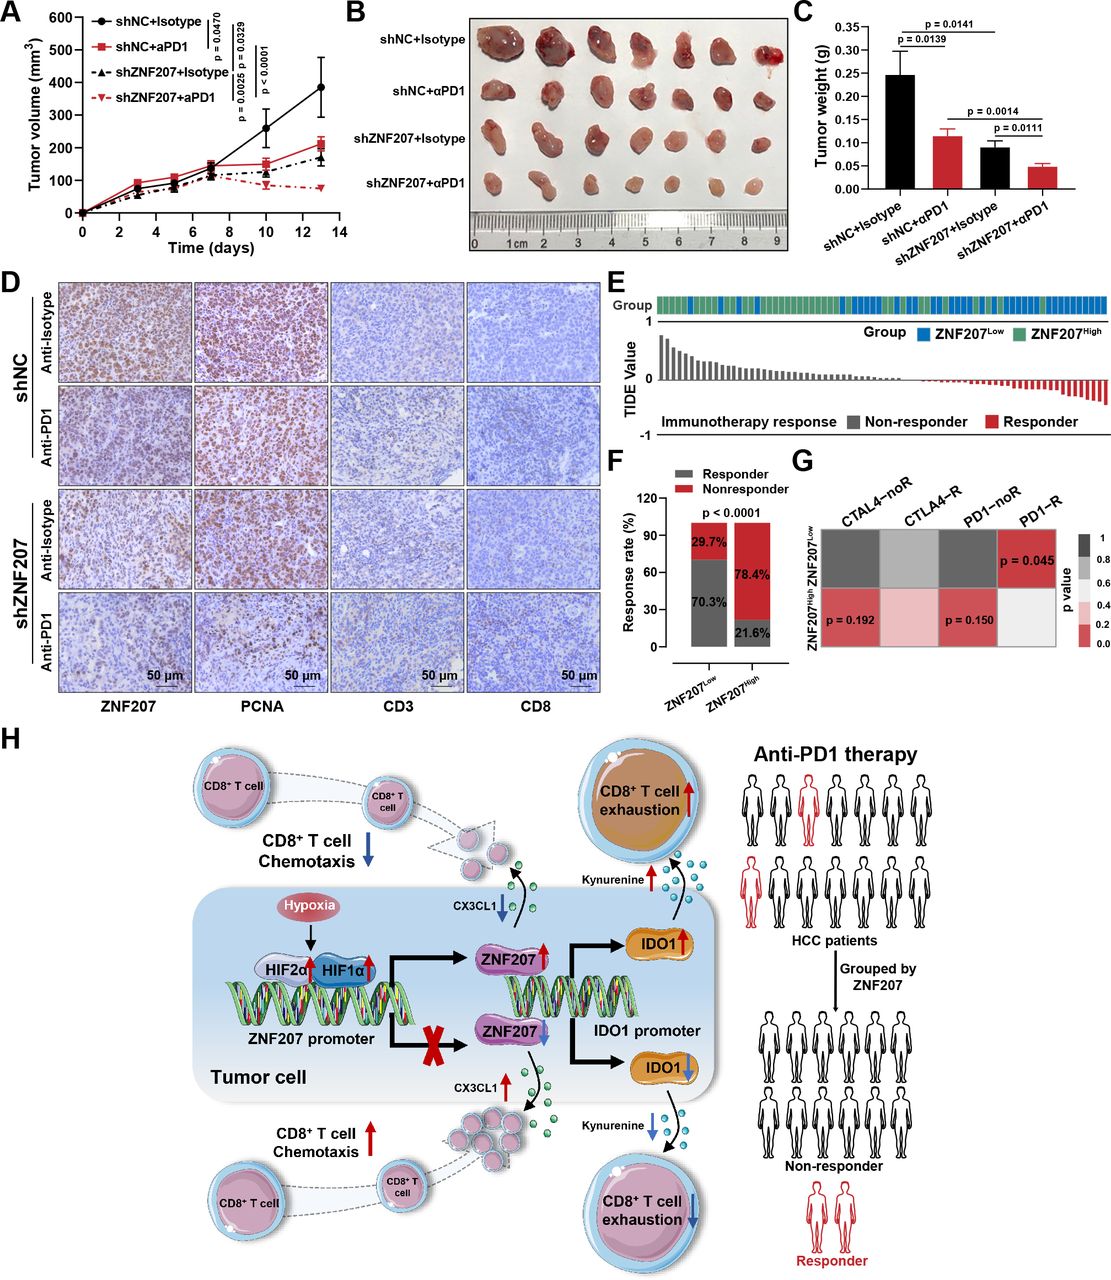
ZNF207 is a potential combination target for anti-PD1 therapy. (A) In vivo Hepa1–6 xenograft tumor growth curves of ZNF207-knockdown combined with PD1 treatment (n=7). (B) Image of the xenograft tumor at the end of the experiment (n=7). (C) Tumor weight statistic results of each group (n=7). (D) Immunohistochemistry was used to detect protein levels of ZNF207, PCNA, CD3, and CD8 in each group. (E) TIDE algorithm was used to predict the immunotherapeutic responses of patients with HCC in different ZNF207 expression groups. The histogram shows the TIDE score of each sample; gray represents patients who are not responsive to immunotherapy, and red represents patients who are responsive to immunotherapy. (F) Rates of response to immunotherapy in ZNF207high and ZNF207low expression groups. (G) Effects of CTLA4 and PD1 monoclonal antibody on patients with HCC in different ZNF207 expression groups. (H) Schematic diagram of how ZNF207 regulates tumor immunity and promotes HCC progression. HCC, hepatocellular carcinoma; PD1, programmed cell death protein 1; ZNF207, zinc finger protein 207.
ZNF207 transcriptionally regulates IDO1 to promote kynurenine production
To understand how ZNF207 changes kynurenine metabolism, we focused on the key genes in the kynurenine metabolic pathway, which were significantly downregulated in the ZNF207-KD group (online supplemental figure S7E). ZNF207 expression only elevated the mRNA levels of IDO1, but not IDO2 or TDO2 (online supplemental figure S7F,G). Based on these findings, we hypothesize that ZNF207 can transcriptionally regulate IDO1. We used a dual fluorescein reporter gene experiment to investigate this conjecture, which showed an increased fluorescence intensity when the IDO1 promoter-luciferase plasmid was cotransfected with ZNF207-OE plasmid (figure 6E). ChIP-qPCR confirmed that ZNF207 could bind to three regions (–1213→–1028 bp, –1143→–976 bp, and –1040→–898 bp relative to TSS) of the IDO1 promoter (figure 6F). Inhibition of IDO1 with a specific inhibitor PF-06840003 reversed kynurenine levels mediated by ZNF207 expression (figure 6G). In addition, PF-06840003 treatment reversed CD8+ T-cell exhaustion caused by the conditioned medium from the ZNF207-OE cell line (figure 6H and online supplemental figure S7H). The in vivo experiment showed that PF-06840003 treatment reversed the tumor growth-promoting effect of ZNF207-OE, reflecting the key role of the IDO1 pathway in ZNF207-mediated HCC growth (online supplemental figure S7I). In summary, our work preliminary proved that ZNF207 can transcriptionally regulate IDO1 to elevate kynurenine and induce CD8+ T-cell exhaustion.
ZNF207 is a potential therapeutic target in combination with anti-PD1 therapy
In this study, we found that ZNF207 could promote HCC progression by regulating tumor immunity. Therefore, we further investigated the potential of ZNF207 as a therapeutic target in combination with anti-PD1 therapy in patients with HCC. Although anti-PD1 treatment alone could inhibit tumor growth, ZNF207-KD combined with PD1 monoclonal antibody exhibited an outstanding tumor suppression effect (figure 7A–C and online supplemental figure S8A). The percentage of PCNA-positive cells in the ZNF207-KD plus anti-PD1 treatment group was the lowest, while infiltrating T cells were increased significantly (figure 7D). To further study the value of ZNF207 in predicting immunotherapy responsiveness, we used Tumor Immune Dysfunction and Exclusion (TIDE) and Submap algorithms as previously reported to predict the immunotherapeutic response rate of patients with different ZNF207 expressions from the TCGA-LIHC dataset31 32 (figure 7E). Only 21.6% of patients in the ZNF207high expression group responded to immunotherapy compared with 70.3% in the ZNF207low group (figure 7F). In addition, patients in the ZNF207low expression group exhibited a better response to PD1 monoclonal antibody treatment than the CTLA-4 monoclonal antibody (figure 7G). Next, we also evaluated the prognostic value of ZNF207 for immune-checkpoint therapy by assigning patients into either high or low ZNF207 groups in two PD1 antibody-treated cohorts. Patients in the ZNF207low expression group exhibited prolonged survival outcomes (online supplemental figure S8B–E). Receiver operating characteristic curve (ROC) analyses of the GSE78220 cohorts (PD1-treated cohort) revealed ZNF207 as a predictive biomarker for the efficacy of anti-PD1 therapy (online supplemental figure S8F). Taken together, our findings suggested that ZNF207 can be a biomarker and therapeutic target in combination with anti-PD1 therapy for HCC.
Supplemental material
Discussion
Understanding the process of tumor immunity is crucial for screening immunosuppressive targets in cancers. We used the cancer–immunity cycle score to quantify immune cycle processes with combined WGCNA and system analysis to identify ZNF207 as an immunosuppressive target in HCC. However, ZNF207 has been reported to be highly expressed in HCC, the mechanism by which ZNF207 accelerates HCC progression remained unknown.17 Compared with previously discovered functions,15 16 33 we reported its immunosuppressive function for the first time. Our in vivo animal experiment showed that ZNF207-KD combined with anti-PD1 therapy has strong therapeutic potential in HCC.
Insufficient T-cell infiltration may explain why some patients do not respond to immunotherapy.34–36 ZNF207 inhibition elevated the level of various chemokines and cytokines, such as CX3CL1, CXCL1, CXCL10, and CXCL16, which could promote T-cell chemotaxis. In our study, we showed that ZNF207 could inhibit CX3CL1 secretion via p38 MAPK. However, the direct effectors by which ZNF207 regulates p38 MAPK signaling still need to be elucidated in the future. In addition to CX3CL1, many other cytokines and chemokines may also play important roles in CD8+ T-cell migration. For instance, CXCL5, which inhibits chimeric antigen receptor T-cell infiltration into tumor tissues is reportedly significantly decreased after ZNF207-KD.37 38 Furthermore, vascular endothelial growth factor, an important angiogenesis factor that not only promotes tumor angiogenesis but also inhibits T-cell functions,39–41 was found to be suppressed in the ZNF207-KD group (online supplemental figure 6G) and showed a positive correlation with ZNF207 (online supplemental figure 6H). These findings suggest that ZNF207 can inhibit T-cell infiltration by altering chemokine levels.
In addition to inhibiting CD8+ T-cell infiltration, ZNF207 can also promote T-cell exhaustion. Mechanistically, ZNF207 silencing inhibits IDO1 transcription and kynurenine synthesis—key metabolites in tryptophan signaling reported to speed up T-cell exhaustion.27–29 42 PF-06840003, an IDO1 inhibitor, reversed CD8+ T-cell exhaustion mediated by condition medium from the ZNF207-overexpressed cell line. These data suggest that ZNF207 changes tumor immunity by affecting T-cell function. In the open-label phase I/II trial, epacadostat (a potent and highly selective IDO1 enzyme inhibitor) plus pembrolizumab in patients with advanced solid tumors was well tolerated and had encouraging antitumor activity.43 However, in a phase III, randomized, double-blind study, epacadostat plus pembrolizumab did not improve progression-free survival or OS in patients with unresectable or metastatic melanoma.44 The internal mechanism of the IDO1 inhibitor and PD1 monoclonal antibody is similar—both inhibit T-cell exhaustion—but this did not resolve the problem of T-cell infiltration. We hypothesize that despite CD8+ T-cell exhaustion decreasing after PD1 therapy or IDO1 inhibition, the T-cell infiltration is still insufficient. Therefore, it is quite difficult for T cells to inhibit tumor progression. In our study, the combination of inhibiting ZNF207 and PD1 monoclonal antibody treatment showed a strong antitumor effect. We posit that when compared with IDO1 inhibitors, inhibiting ZNF207 not only inhibits CD8+ T-cell exhaustion but also promotes T-cell infiltration through multiple cytokines. Therefore, the development of small-molecule drugs targeting ZNF207 has great potential as a combination therapy with anti-PD1.
The current research also has its limitations. For example, the xenograft tumor model cannot simulate the microenvironment of the orthotopic tumor well. In addition, we used the TIDE and Submap algorithms to predict the response of patients with HCC for the efficacy of immune checkpoint inhibitors by ZNF207 expression. However, this theoretical proof still needs to be tested in a clinical setting.
Figure 7H shows how hypoxia can transcriptionally elevate ZNF207 by HIF proteins. In conclusion, inhibiting ZNF207 enhanced CX3CL1-induced chemotaxis of CD8+ T cells into tumor tissues. In addition, silencing ZNF207 reduced kynurenine synthesis by suppressing transcriptional regulation of IDO1, which in turn reversed CD8+ T-cell exhaustion, thereby reshaping the tumor microenvironment. ZNF207 can be considered a potential biomarker and combination target for anti-PD1 therapy in HCC. The development of small-molecule drugs targeting ZNF207 may provide new possibilities for PD1 monoclonal antibody combination therapy.
Supplemental material
Data availability statement
Data are available in a public, open access repository. All data used or analyzed are included in this article and are available from the corresponding author upon reasonable request. The RNA sequencing data in this manuscript have been deposited in NCBI’s Gene Expression Omnibus and are accessible using accession number GSE167935.
Ethics statements
Patient consent for publication
Ethics approval
Ethical approval for animal experiments in this study was obtained from the Center for New Drug Evaluation and Research, China Pharmaceutical University (Nanjing, China), and all procedures were done in accordance with the National Institutes of Health Guide for the Care and Use of Laboratory Animals.
Acknowledgments
We kindly express our appreciation to Xiao Ya Hua Tu for the R scripts related to bioinformatics analysis. We are grateful to Yumeng Shen (Public Platform of State Key Laboratory of Natural Medicines) and Xicheng Chen (Public Experimental Platform of Nanjing Medical University) for their assistance with the flow cytometry analysis. The Home for Researchers editorial team (www.home-for-researchers.com) provided the language editing services.
References
Supplementary materials
Supplementary Data
This web only file has been produced by the BMJ Publishing Group from an electronic file supplied by the author(s) and has not been edited for content.
Footnotes
XW, TZ and XC contributed equally.
Contributors XW and YY developed the study concept and design. XW, TZ, XC, YW, XT and HT interpreted and analyzed the data. XW, TZ, XC, YD, HT, YW, SG, and HW performed the experiments. XW, TZ, and XT wrote the manuscript. All authors approved the final version of the manuscript. YY accepts full responsibility for the work and/or the conduct of the study, had access to the data, and controlled the decision to publish.
Funding This study was funded by the National Key New Drug Innovation Program, the Ministry of Science and Technology of China (No: 2018ZX09201017-006), the National Natural Science Foundation of China (82104219, 82003812), the Natural Science Foundation of Jiangsu Province (number BK20180575), the Fundamental Research Funds for the Central Universities (2632022ZD04), and the Outstanding Talents Research Startup Fund of Xuzhou Medical University (D2021049).
Competing interests There are no competing interests.
Provenance and peer review Not commissioned; externally peer reviewed.
Supplemental material This content has been supplied by the author(s). It has not been vetted by BMJ Publishing Group Limited (BMJ) and may not have been peer-reviewed. Any opinions or recommendations discussed are solely those of the author(s) and are not endorsed by BMJ. BMJ disclaims all liability and responsibility arising from any reliance placed on the content. Where the content includes any translated material, BMJ does not warrant the accuracy and reliability of the translations (including but not limited to local regulations, clinical guidelines, terminology, drug names and drug dosages), and is not responsible for any error and/or omissions arising from translation and adaptation or otherwise.