Article Text

Abstract
Background Targeting immune checkpoints that inhibit antitumor immune responses has emerged as a powerful new approach to treat cancer. We recently showed that blocking the tumor necrosis factor receptor-type 2 (TNFR2) pathway induces the complete loss of the protective function of regulatory T cells (Tregs) in a model of graft-versus-host disease (GVHD) prevention that relies on Treg-based cell therapy. Here, we tested the possibility of amplifying the antitumor response by targeting TNFR2 in a model of tumor relapse following hematopoietic stem-cell transplantation, a clinical situation for which the need for efficient therapeutic options is still unmet.
Method We developed appropriate experimental conditions that mimic patients that relapsed from their initial hematological malignancy after hematopoietic stem-cell transplantation. This consisted of defining in allogeneic bone marrow transplantation models developed in mice, the maximum number of required tumor cells and T cells to infuse into recipient mice to develop a model of tumor relapse without inducing GVHD. We next evaluated whether anti-TNFR2 treatment could trigger alloreactivity and consequently antitumor immune response. In parallel, we also studied the differential expression of TNFR2 on T cells including Treg from patients in post-transplant leukemia relapse and in patients developing GVHD.
Results Using experimental conditions in which neither donor T cells nor TNFR2-blocking antibody per se have any effect on tumor relapse, we observed that the coadministration of a suboptimal number of T cells and an anti-TNFR2 treatment can trigger alloreactivity and subsequently induce a significant antitumor effect. This was associated with a reduced percentage of activated CD4+ and CD8+ Tregs. Importantly, human Tregs over-expressed TNFR2 relative to conventional T cells in healthy donors and in patients experiencing leukemia relapse or cortico-resistant GVHD after hematopoietic stem cell transplantation.
Conclusions These results highlight TNFR2 as a new target molecule for the development of immunotherapies to treat blood malignancy relapse, used either directly in grafted patients or to enhance donor lymphocyte infusion strategies. More widely, they open the door for new perspectives to amplify antitumor responses against solid cancers by directly targeting Tregs through their TNFR2 expression.
- Immunomodulation
- Immunotherapy
- Immunotherapy, Adoptive
- T-Lymphocytes
- Transplantation Immunology
Data availability statement
Data are available on reasonable request. Not applicable.
This is an open access article distributed in accordance with the Creative Commons Attribution Non Commercial (CC BY-NC 4.0) license, which permits others to distribute, remix, adapt, build upon this work non-commercially, and license their derivative works on different terms, provided the original work is properly cited, appropriate credit is given, any changes made indicated, and the use is non-commercial. See http://creativecommons.org/licenses/by-nc/4.0/.
Statistics from Altmetric.com
Introduction
Regulatory T cells (Tregs) play a key role in the fine tuning of immune responses in allogeneic hematopoietic stem-cell transplantation (alloHSCT).1–5 Cell therapy using Treg infusions to prevent graft-versus-host disease (GVHD) has shown very promising results in the clinic.6–11 Conversely, we performed ex vivo Treg depletion from donor lymphocyte infusions (DLIs) in 2010 to enhance the graft-versus-leukemia/graft-versus-tumor (GVL/GVT) effect in patients who relapsed after alloSCT without previously developing GVHD.12 This initial clinical trial suggested that Treg depletion can trigger alloreactivity and its associated GVL/GVT effect. A confirmatory, randomized, double-blind trial following the same approach is currently ongoing (DLI-Boost, ClinicalTrials.gov, NCT03236129).
A major advance in our understanding of the mechanisms of action of Tregs occurred with the identification of their preferential surface expression of tumor necrosis factor (TNF) receptor-type 2 (TNFR2). Indeed, it was first demonstrated that TNFR2 is critical for the stability and suppressive functions of Tregs.13–16 In cancer, most studies have shown that Tregs are TNFR2hi and that TNFR2 antagonism can lead to solid tumor regression, mainly in TNFR2-expressing cancers, such as ovarian cancer or Sézary syndrome.17–21 In experimental alloHSCT, Chopra et al initially demonstrated that TNFR2 activation using a homemade agonist molecule can control life-threatening GVHD in mice without abrogating the GVL effect.22 Conversely, we previously showed the complete dependency of Tregs on TNF-α to maintain their suppressive capacity in vivo. We demonstrated that the protective effect of therapeutic Tregs against GVHD was completely abolished when mice were treated with a TNFR2-blocking mAb at the time of alloHSCT in a Treg-based cell therapy approach. In addition, we conclusively demonstrated in the aforementioned setting that therapeutic Tregs rely on their expression of TNFR2 and require TNF-α production by donor T cells to control the disease.23
Here, we hypothesized that blocking the TNF-α/TNFR2 pathway would provide space for a powerful and amplified GVL/GVT effect to emerge, which could be useful in the treatment of blood malignancy relapses after alloHSCT. Indeed, originally proposed to treat TNFR2-expressing solid tumors or cutaneous T-cell lymphoma,18 19 TNFR2 blockade has been underappreciated and never tested to trigger an allogeneic immune response and hence an antitumor effect in the specific setting of alloHSCT. The aim is to induce a strong GVL/GVT effect by blocking the effects of TNFR2-expressing Tregs in a targeted population preferentially consisting of patients who relapse without previously developing GVHD, as in our aforementioned clinical trial.12 24
To test this hypothesis, we developed a dedicated experimental model in which the number of donor T cells infused in recipient mice did not allow GVHD development and was also insufficient to mediate a complete GVL/GVT effect. After tumor cell infusion, this very sensitive model allowed us to evaluate the in vivo effect of treatments that target immune cells by simply detecting either clinical signs of alloreactivity or the produced GVL/GVT effects through macroscopic and/or blood tumor detection. Our data show that the in vivo administration of anti-TNFR2 treatment triggers strong alloreactivity associated with a potent GVL/GVT effect. In addition, we have also generated promissing data using samples collected from post-transplant patients with relapsing leukemia or GVHD showing that Tregs preferentially overexpress TNFR2 relative to conventional T cells. These observations provide further support for the efficiency and versatility of TNFR2-modulation strategies to block Tregs and trigger an antitumor or allogeneic immune response, as observed here, or to induce Tregs with TNFR2 agonists to dampen the immune response, as recently suggested.22
Methods
Mice
Female C57BL/6J (B6, H-2b), (B6xDBA2) F1 ((B6D2)F1, H-2bxd), (BalbCxB6) F1 ((CB6)F1, H-2bxd), and NSG (NOD.Cg-PrkdcscidIL2rgtm1Wil/SzJ) mice were obtained from Charles River Laboratories (France) and used at 10–12 weeks of age. Mice were housed under specific pathogen-free conditions.
Bone-marrow transplantation and tumor relapse models
Recipient (B6D2)F1 female mice received 10 Gy irradiation (X-ray) followed by retro-orbital infusion of 5×10⁶ bone-marrow (BM) cells and 1×10⁶ CD3+ T cells from C57BL/6 mice. BM and T-cell suspensions were prepared using leg bones and lymph nodes, respectively, as previously described.12 P815-GFP mastocytoma cells (gift from Dr G. Marodon) were also injected intravenously (one or 2×10⁴ per mouse) into the retro orbital sinus of (B6D2)F1 female mice at the time of transplantation. A20 cells were purchased from the American Type Culture Collection. A20 cells were transfected with a lentiviral vector encoding GFP gene (Vectalys) according to the manufacturer’s instructions. After Transfection, A20-GFP cells were sorted using a MoFlo Legacy instrument (Beckman Coulter, Villepinte, France) with a purity of 99%. Female (CB6)F1 recipient mice received 9 Gy of irradiation (X-ray) followed by retro-orbital infusion of 5×10⁶ BM cells and 1×10⁶ CD3+ T cells from B6 mice. In addition, 1×10⁶ A20-GFP cells were injected into the retro orbital sinus of mice at the time of bone-marrow transplantation (BMT). After semi-allogeneic BMT, GVHD symptoms and the apparition of tumors were evaluated three times per week. Clinical GVHD was evaluated as previously described.23 Each of the five following parameters was scored 0 if absent or one if present: weight loss >10% of the initial weight, hunched posture, skin lesion(s), dull fur, and diarrhea. Mice were considered to be positive for tumors if a tumor mass was visible near the eye and/or if more than 0.5% of P815-GFP, or A20-GFP cells were detected in their peripheral blood.
Histopathological examination
Liver, skin, small intestine, and colon samples were preserved in Bouin’s fixative and embedded in paraffin. For these organs, 5 µm thick sections were stained with H&E for histological examination as previously described.23 Slides were analyzed by a pathologist in a blinded fashion to assess the intensity of GVHD. GVHD lesions in each sample were scored according to a semiquantitative scoring system previously described.25
Antibody treatment
Anti-TNFR2 (TR75-54.7), anti-CTLA-4 (9H10), and anti-PD-1 (RMP1-14) mAbs were purchased from BioXCell (West Lebanon, NH). TNFR-2 blockade was achieved by performing three intraperitoneal mAb injections of 500 μg each on day 0, day 2, and day 4 after BM transplant or a single intraperitoneal 500 μg injection on d10 after BMT. CTLA-4 or PD1 blockades were achieved by performing three intraperitoneal mAb injections of 200 μg each on day 0, day 3, and day 6 after BMT.
Patients
Relapsing patients and those experiencing GVHD were transplanted in adult hematology unit from Saint Louis hospital, Paris, France and Henri Mondor hospital, Créteil, France. All patients and donors signed an informed consent for (i) registration in the Promise database and (ii) cryopreservation of biological material for research purposes. This study was conducted in accordance with the Declaration of Helsinki.
Human peripheral blood mononuclear cell isolation
Peripheral blood mononuclear cells (PBMCs) were isolated using lymphocyte separation medium (Laboratoires Eurobio, Les Ulis, France) and resuspended in phosphate-buffered saline (PBS; Life Technologies; Thermo Fisher Scientific, Waltham, Massachusetts, USA) containing 3% fetal bovine serum (FBS; Gibco, Life Technologies; Thermo Fisher Scientific).
Short-term in vivo xenogeneic human lymphocyte activation
NSG mice were used to test the effect of a blocking anti-human TNFR2 mAb (clone UTR1) on healthy donor immune cells in vivo. PBMCs isolated from two healthy donor blood samples were pretreated with either UTR1 or a control immunoglobulin of the same isotype (mIgG1) for 2 hour at 37°C (10 µg Ab/mL for 107 PBMCs). NSG mice were then injected intravenously with pretreated cells (n=3 mice/donor). After 6 days, their spleens were collected, and their content analyzed by flow cytometry.
Phenotypic analysis of immune cell populations
Spleens were harvested on day 12 and splenocytes stained with the antibodies listed in online supplemental table 1. Non-specific binding was blocked using anti-CD16/CD32 (Miltenyi Biotec). After isolation, PBMCs from healthy donors or patients were stained with the antibodies listed in online supplemental table 2). Non-specific binding was blocked using FC block (BD bioscience). For intracellular staining, cells were fixed and permeabilized with fixation/permeabilization solution (ThermoFischer), according to the manufacturer’s instructions. Data acquired with a BD LSR-Fortessa flow cytometer were compensated and exported into FlowJo (version 10.0.8, TreeStar Inc.). An unbiased analysis was performed on splenocytes using the t-distributed stochastic neighbor embedding (t-SNE) algorithm tool (Flowjo software) to reduce the flow cytometry data to two dimensions. Live cells from mice in the same group were merged. Results are shown as a t-SNE map displaying the repartition of the expression of a given marker among randomly sampled cells from the indicated parent population.
Supplemental material
Statistical analysis
Statistical analysis was performed using GraphPad Prism nine software (GraphPad Software, San Diego, California, USA). The data of control and treatment groups were compared using non-parametric tests. For Kaplan-Meier survival curves, groups were compared using the log rank test. Other data were compared using either a Mann-Whitney test (for two-by-two comparisons) or a Kruskal-Wallis test with Dunn’s multiple comparison post-test (for multiple comparisons). Statistical significance is indicated as *p<0.05, **p<0.01, ***p<0.001, and ****p<0.0001. Population statistics are displayed as the mean±SD.
Results
Anti-TNFR2 treatment triggers a GVL/GVT effect after hematopoietic stem-cell transplantation
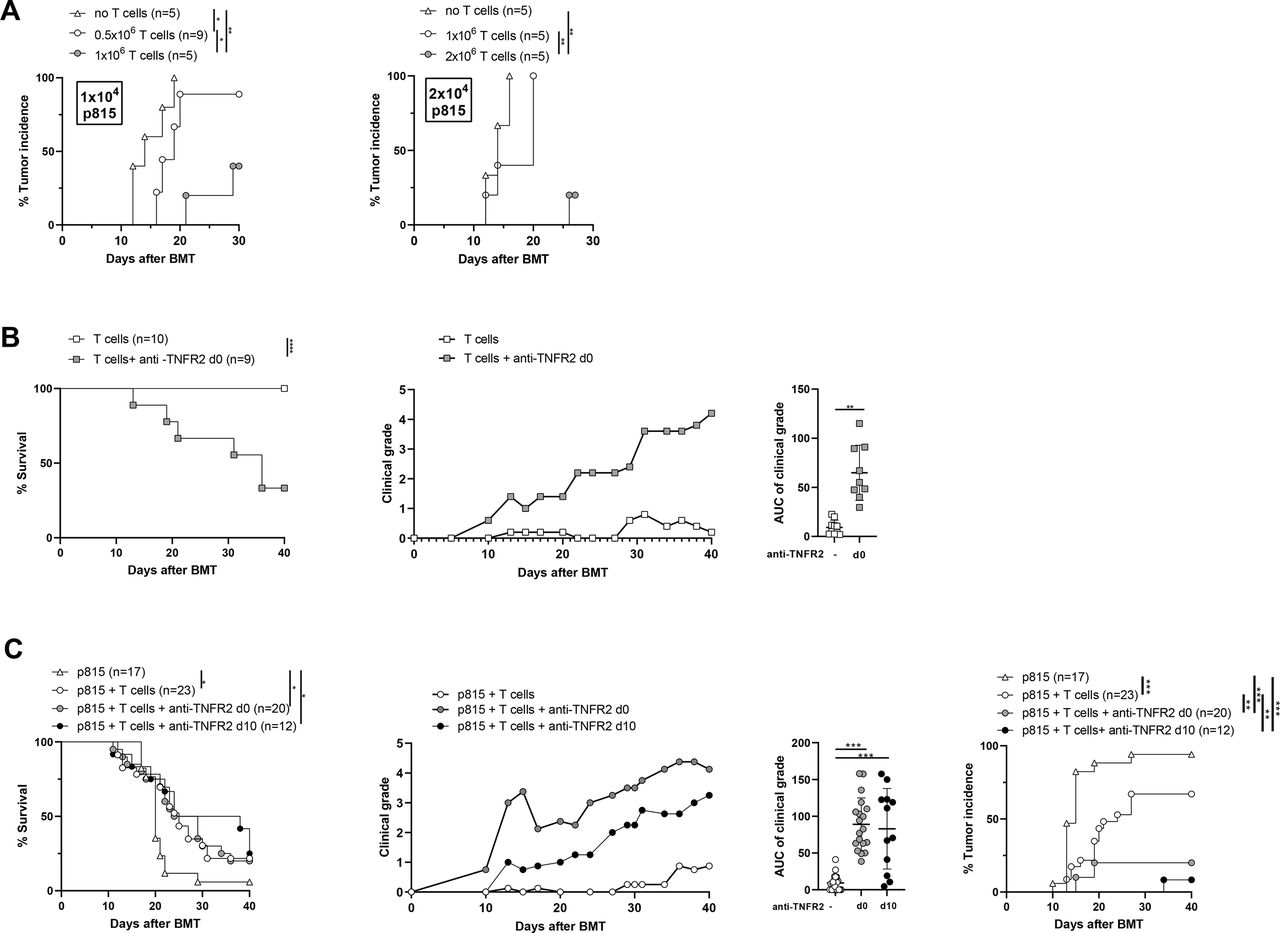
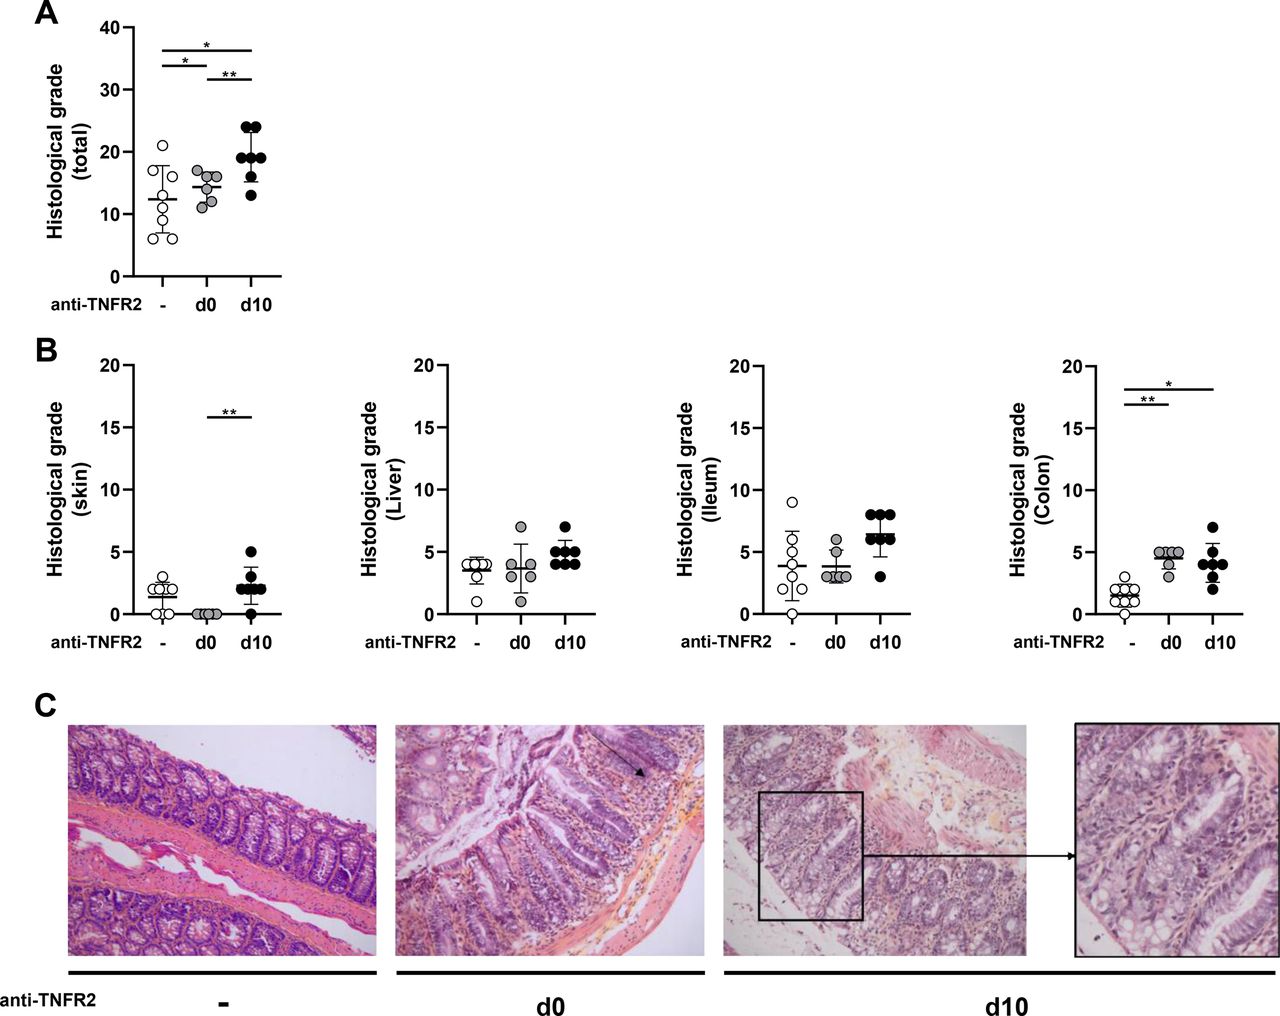
We first performed a series of experiments to define the maximum number of required tumor cells and T cells to infuse into recipient mice to develop a model of tumor relapse without inducing GVHD. The appropriate experimental conditions that mimic those of patients relapsing after alloHSCT from their initial hematological malignancy were achieved using 2×10⁴ P815 tumor cells (mastocytoma) and 1×10⁶ T cells. Indeed, we never observed any clinical signs of GVHD under these experimental conditions and the tumor incidence was 100% on day 20 (figure 1A). In the absence of P815 cells, we next evaluated whether anti-TNFR2 treatment could trigger alloreactivity with a deliberately restricted number of donor cells. We triggered an alloreactive immune response in mice receiving 1×10⁶ T cells and treated with an anti-TNFR2 mAb on day 0, day 2, and day 4. This was shown by elevated clinical grades of GVHD throughout the experiment, quantified by a significantly higher area under the curve (AUC) of the GVHD score and a lower survival rate at day 40 than for untreated mice, for which no signs of alloreactivity were detected (figure 1B). Thus, under experimental conditions in which a very low number of T cells is injected, brief treatment with anti-TNFR2 makes it possible to initiate a significant allogeneic immune response. We then reproduced these experiments to validate our hypothesis, adding P815 cells at the time of grafting to mimic the occurrence of a tumor relapse after alloHSCT (figure 1C). Tumor cells were detected in 16 of 17 mice that had no T-cell infusion, of which 94% were dead by the experimental endpoint (MST=20 days). Tumors were detected in 14 of 23 (60%) mice infused with 106 T cells, suggesting that the mortality observed for all mice (MST=25 days) was related to GVHD for only a small percentage. Indeed, no or very low clinical grade GVHD was consistently observed in this group of mice. In contrast, the administration of the anti-TNFR2 mAb on day 0, day 2, and day 4 resulted in a dramatic decrease in tumor incidence, with only 4 of 20 (20%) mice harboring P815 cells. The mortality observed in this group (MST=26.5 days) could be mainly attributed to an allogeneic immune response, as attested by elevated clinical grades of GVHD. We tested the versatility of this approach by delaying anti-TNFR2 treatment. We, thus, repeated the same experiments and compared the effect of anti-TNFR2 treatment initiated on day 0 or day 10. Remarkably, a single injection of anti-TNFR2 on d10 was sufficient to trigger a potent GVL/GVT effect. A body of clinical data suggests that delaying and reducing the dose of anti-TNFR2 treatment may be safer. Indeed, the time of death of the mice was slightly delayed (MST=31 days) and their mean GVHD clinical scores reduced throughout the follow-up, whereas the antitumor effect was preserved similarly to that of mice treated on day 0, day 2, and day 4; P815 cells were detected in only 1 of 12 mice (figure 1C). Dedicated experiments were repeated to evaluate potential histopathological manifestations after anti-TNFR2 treatment. We assessed the consequences of triggered alloreactivity on target tissues of GVHD in treated mice on d12. This allowed us to evaluate the short-term (for mice treated on d10) and more long-term (for mice treated on day 0, day 2, and day 4) histological consequences of anti-TNFR2 treatment after its administration. Two days after treatment, we observed several histological manifestations of GVHD, with a trend toward an increase in the histological grade for the skin, liver, and small intestine, and a statistically significant increase for that of the colon of d10-treated mice, leading to a significant difference on summing all of the clinical grades of the target tissues relative to those of the control group (figure 2), in accordance with clinical observations. Six days after the end of treatment, histopathological manifestations were observed only in the colons of mice treated on day 0, day 2, and day 4. Thus, anti-TNFR2 treatment rapidly led to histological signs of GVHD in target organs, demonstrating a surprisingly prompt physiopathological translation of this treatment.

TNFR2 blockade using an anti-TNFR2 mAb triggers alloreactivity and the associated graft-versus-leukemia/graft-versus-tumor (GVL/GVT) effect after alloHSCT. (A) Lethally irradiated (B6D2)F1 recipient mice received 5×10⁶ BM cells, 1 or 2×10⁶ T cells, and 1×10⁴ (left) or 2×10⁴ (right) P815 cells. The tumor incidence observed for each dose of P815 cells is depicted. (B) Female (B6D2)F1 mice underwent (total body irradiation) TBI, followed by BMT with 1×10⁶ T cells (T cell group, n=10) and treated with anti-TNFR2 mAb administered on day 0, day 2, and day 4 (T cell +anti-TNFR2 group, n=9). Survival curves, clinical grade evolution (right), and the area under the curve (AUC) of graft-versus-host disease (GVHD) manifestations are presented. The cumulative data of two independent experiments are shown. (C) Mice underwent TBI followed by BMT with 1×10⁶ T cells and 2×10⁴ P815 cells with or without anti-TNFR2 (500 μg) treatment administered on day 0, day 2, and day 4 (labeled as d0), or with a single injection on day 10 (d10). Survival curves, clinical grades, and the AUCs, as well as tumor incidence are depicted. The cumulative data of four independent experiments are shown. Kaplan-Meier survival curves were compared using the log-rank test. The AUCs were calculated for the GVHD clinical grade curve for each mouse and are presented as the mean±SD. Either Mann-Whitney or Kruskal-Wallis tests were performed, depending on the number of groups that were compared. *P<0.05, **p<0.01, ***p<0.001.

Effect of TNFR2 blockade on target organs of GVHD. (B6D2)F1 recipient mice underwent TBI followed by bone-marrow transplantation (BMT) with 1×10⁶ T cells and 2×10⁴ P815 cells with or without anti-TNFR2 (500 μg) treatment administered on day 0, day 2, and day 4 or with a single injection on day 10. On day 12, mice were sacrificed and GVHD target organs collected and analyzed. (A) the histological grades of each target organ of GVHD were summed to give a global histological score. (B) Histological grade of skin, liver, ileum, and colon. (C) Severe aGVHD lesions were observed in the colon of mice treated with anti-TNFR2, either at day 0 or day 10, as attested by the global loss of crypt morphology and crypt hyperplasia, marked crypt-cells apoptosis, and the presence of a substantial lymphocytic infiltrate (example enlarged on the right). Results are presented as the mean±SD and each plot represents one mouse. P values were determined by one-way analysis of variance. *P<0.05, **p<0.01.
We ruled out the possibility that the observed effects were limited to the P815 tumor model used in a specific genetic combination of alloHSCT by repeating the same type of experiment using A20 cells (B-cell leukemia) in the B6 background in the B6xBalb/C genetic combination. First, we reproduced the result that TNFR2 treatment given at the time of the graft leads to increased alloreactivity in this second model of alloHSCT (online supplemental figure S1A). We also observed spontaneous alloreactivity of donor T cells, leading to higher clinical grades of GVHD than in the previously used model. This was illustrated by partial induction of a GVL effect observed when A20 cells were added, although it was not statistically significant. Leukemic cells were detected in 71% of mice receiving T cells vs 100% of mice not receiving T cells. As in the P815 setting, anti-TNFR2 treatment increased the clinical manifestations of alloreactivity relative to those of untreated mice. Indeed, only 28% of mice developed leukemia when anti-TNFR2 treatment was administered on day 0, day 2, and day 4 (online supplemental figure S1B). Importantly, anti-TNFR2 treatment alone did not show any direct effect in the absence of T lymphocytes, neither on P815 nor A20 tumor development, leading to an unchanged tumor incidence (online supplemental figure S2). Thus, we demonstrated that anti-TNFR2 treatment starting on day 0 or day 10 strongly induced a potent GVL/GVT effect in a setting in which injected T cells alone were inefficient in two relapse models using two different genetic combinations of alloHSCT.
Supplemental material
Anti-TNFR2 treatment alters the phenotype of both CD4+ and CD8+ Treg populations after hematopoietic stem-cell transplantation
We evaluated the biological effects of both anti-TNFR2 modalities of treatment on T cells. First, we performed a competition experiment ex vivo to verify whether we could still detect the surface expression of TNFR2 despite treating the mice with an anti-TNFR2 mAb. The addition of various doses of therapeutic mAb to C57BL/6 splenocytes did not impair the fixation and further detection of TNFR2 at the lymphocyte membrane by flow cytometry, excluding the possibility of antigen masking by the treatment (online supplemental figure S3). Then, grafted mice were treated on day 0, day 2, and day 4, or day 10 and their spleens collected on day 12, that is, 6 or 2 days after the end of treatment and around the time of the apparition of the first tumors in control mice (figure 1C). This endpoint provided the best window to observe the influence of anti-TNFR2 administration on the immune responses of mice with yet no symptoms of tumors or GVHD, but on the verge of developing one or the other. At this specific timepoint, the frequency of CD8+FOXP3- cells was higher in day 10-treated mice than the controls (15.07%±3.33% and 11.45%±2.00%, respectively), whereas that of CD4+FOXP3- and FOXP3+ cells remained unchanged (figure 3A). Early anti-TNFR2 administration (day 0) did not induce any modification in the frequency of these lymphocyte populations. We then quantified CD107a, Grz B, and IFNγ on CD8 cells, with or without anti-TNFR2 treatment. We did not observe any alterations in Grz B expression or INFγ production (not shown). However, CD107a expression increased in CD8+FOXP3- cells, with a marked and statistically significant effect when mice were treated at day 10 (18.47%±2.98 vs 14.91±0.90 for untreated mice, p<0.05), suggesting improved cytolytic activity for CD8+ T cells.26 We then addressed the changes in expression of several lymphocyte function-related markers after anti-TNFR2 treatment using an unbiased approach. T-SNE maps were created to display the repartition of TNFR2 and KI-67 expression among randomly sampled CD4+ and CD8+ cells from summed mouse cells in each group (figure 3B, left). Importantly, proliferating cells (KI-67+) in our model were not restricted to the TNFR2+ or TNFR2- population, despite the well-described involvement of TNFR2 in NF-KB pathway-related proliferation in conventional T cells,27–29 as apparent when comparing the TNFR2 and KI-67 maps of the same group. The percentage and surface density of expression of TNFR2 were dramatically lower in both CD4+FOXP3- and CD8+FOXP3- conventional T cells after anti-TNFR2 treatment for the day 0, day 2, and day 4 group and day 10 group, compared with untreated control mice. In contrast, the frequency of KI-67+ cells was higher than that of conventional T cells of control mice for the CD8+FOXP3- population after the day 10 treatment and for both CD4+FOXP3- and CD8+FOXP3- lymphocytes after the day 0, day 2, and day 4 treatment. Thus, conventional T-cell proliferation can be triggered by anti-TNFR2, consistent with the previously described alloreactivity manifestations and despite a reduction of TNFR2 at their surface in these settings.

Mechanism of action of anti-TNFR2 treatment on conventional T cells. Splenocytes of the mice described in figure 2 were analyzed by flow cytometry. (A) percentage of Foxp3+, CD4+FOXP3-, and CD8+FOXP3- lymphocytes among live splenocytes. (B) cell clustering using a t-distributed stochastic neighbor embedding (t-SNE) algorithm performed on an « or » gate, including both live CD4+ and CD8+ cells. The localization of FOXP3+, CD4+, and CD8+ cell clusters is indicated in the subfigure on the left. The localization of TNFR2+ (in green) and KI-67+ (in purple) cells among the aforementioned lymphocyte populations were mapped following anti-TNFR2 mAb administration on day 0, day 2, and day 4 (n=6) or day 10 (n=7) or without (n=8). The gating strategy and percentage of TNFR2+ and KI-67+ cells among the CD4+FOXP3- and CD8+FOXP3- cells are shown for each group, as well as their mean fluorescence intensity. Data are plotted as the mean±SD statistical significance from the controls was determined using Mann-Whitney tests. *P<0.05, **p<0.01, ***p<0.001.
We then focused our analysis on CD4+FOXP3+ Tregs, the main targeted cell population of our anti-TNFR2 therapeutic strategy. First, t-SNE mapping revealed a slight diminution in the FOXP3-expressing cell cluster (red) associated with a statistically significant decrease in FOXP3 MFI when anti-TNFR2 was administered at d10 (figure 4A). Anti-TNFR2 treatment did not directly affect the number of Tregs, consistent with our previous observations.23 Nevertheless, we observed a decrease in FOXP3 density on Tregs after treatment, echoing the results of a recent publication showing that TNFR2 signaling prevents DNA methylation at the FOXP3 promoter.30 In addition, the t-SNE representation revealed the almost complete disappearance of various clusters of Tregs highly expressing CTLA-4, CD25, and TNFR2 after both treatment modalities, suggesting the loss of the highly suppressive cluster of Tregs in mice treated on day 0, day 2, and day 4 and those treated on day 10. In mice treated on day 10, the percentage of Tregs expressing TNFR2, CD25, and CTLA-4, as well as the levels of expression of TNFR2 and CD25 among Tregs, was lower than that of control mouse Tregs. Mice treated on day 0 showed comparable but less marked effects (figure 4A). This is consistent with a decrease in the percentage of Tregs expressing ICOS, CD39, KLRG1, NRP1, and CD103, as all are membrane markers associated with the suppressive functions and activation of Tregs31 (online supplemental figure S4).

Mechanism of action of anti-TNFR2 treatment on CD4+ and CD8+ regulatory T cells. Splenocytes of the mice described in figure 2 were analyzed by flow cytometry. (A) Cell clustering using t-distributed stochastic neighbor embedding (t-SNE) algorithm performed on the CD4+ (top) or the CD4+FOXP3+ (bottom) cell gates. The localization of Foxp3+ (in red) or CTLA-4+, CD25+, and TNFR2+ (heatmap color gradient) cells among the aforementioned lymphocyte populations was mapped following anti-TNFR2 mAb administration on day 0, day 2, and day 4 or day 10 or without. The gating strategy and percentage of FOXP3+ cells among CD4+ cells and CTLA-4+, CD25+, and TNFR2+ cells among CD4+FOXP3+ cells, as well as their mean fluorescence intensity, are plotted for each group of mice. (B) Gating strategy, percentage, and mean fluorescence intensity of FOXP3+ cells among CD8+ cells (top) and gating strategy and percentage of CTLA-4+, CD25+, and TNFR2+ cells among CD8+FOXP3+ cells (bottom) for each group of mice. Data are plotted as the mean±SD statistical significance from the controls was determined using Mann-Whitney tests. *P<0.05, **p<0.01, ***p<0.001.
A population of CD8+FOXP3+ T cells with suppressive functions that emerge in the early stages of GVHD has been identified in mice32 and ex vivo generated in humans.33 34 In our model, without any anti-TNFR2 treatment, we also identified a population of CD8+FOXP3+ T cells that exhibited elevated expression of TNFR2 (89.01%±5.10%), in addition to CD25 (28.76%±3.41%) and CTLA-4 (33.68%±5.10%) markers (figure 4B). As for CD4+FOXP3+ T cells, anti-TNFR2 treatment on d10 only tended to decrease their percentage, but markedly reduced their expression of TNFR2, CD25, and CTLA-4. We did not observe any major modifications 6 days after the end of anti-TNFR2 treatment initiated on day 0, either because the CD8+FOXP3+ population had not yet emerged at the time of treatment or because it had the time to reconstitute before the endpoint. Heinrichs et al reported that alloreactive CD8+FOXP3+ T cells moderately attenuate GVHD, while sparing the GVL effect.35 Here, we demonstrated that partially decreasing the frequency of these cells via anti-TNFR2 treatment and, more importantly, decreasing their state of activation, as illustrated by the diminution of CTLA-4+, CD25+, and TNFR2+ CD8 Tregs, did not impair the triggering of alloreactivity or the associated GVL effect.
As some cells may coexpress TNFR1 and TNFR2, we also evaluated the effect of anti-TNFR2 treatment on TNFR1 expression. First, TNFR1 was expressed by a small portion of CD4 T cells, regardless of their FOXP3 status, and anti-TNFR2 treatment did not alter TNFR1 expression in these cell populations. The same was true for CD8+FOXP3- cells. Whether TNFR1 expression can be observed in a small percentage of CD8+FOXP3+ cells (this cell population representing less than 2% of splenocytes), treatment at day 0, but not day 10, induced a slight increase in the percentage of TNFR1-expressing CD8+ Tregs. By contrast, 60% of non-CD3 splenocytes expressed TNFR1 and anti-TNFR2 treatment had no effect on these cells. In no case was the MFI of TNFR1 modified by anti-TNFR2 treatment (online supplemental figure S5). In summary, anti-TNFR2 treatment had little or no impact on TNFR1 expression by splenocytes of grafted mice.

Anti-CTLA-4 treatment triggers alloreactivity and its associated antitumor effect after alloHSCT. (A) Female (B6D2)F1 mice underwent TBI followed by bone-marrow transplantation (BMT) with 1×10⁶ T cells (n=10) and were treated with anti-CTLA-4 mAb administered on day 0, day 3, and day 6 (n=10). Survival curves, clinical grades, the AUC of clinical grade, and tumor incidence from two independent experiments are depicted. Kaplan-Meier survival curves were compared using the log-rank test. The AUCs for the GVHD clinical grade curve were calculated for each mouse and are presented as the mean±SD a Mann-Whitney test was performed. (B) On day 12, splenocytes were collected and the T cells analyzed. Each plot represents one mouse and the data are presented as the mean±SD. The cumulative data of two independent experiments is shown. The Mann-Whitney test was performed to compare the effect of anti-CTLA-4 mAb treatment with the control. *P<0.05, **p<0.01, ***p<0.001, . AUC, area under the curve; GVHD, graft-versus-host disease.
Preclinical considerations of the anti-TNFR2 strategy in light of existing therapies
The side effects and benefits of anti-PD-1 and anti-CTLA-4 mAb administration in post-transplant settings to treat relapsing patients have been previously described.36–39 Notably, severe GVHD and autoimmune complications have been observed. We, thus, evaluated anti-PD1 and anti-CTLA-4 treatment using the exact same conditions established to test anti-TNFR2 treatment. Compared with anti-CTLA4, anti-PD1 treatment only produced moderate alloreactivity and a partial antitumor effect (online supplemental figure S6). We then focused our efforts on anti-CTLA4 treatment, for which we observed important clinical effects since anti-CTLA-4 treatment increased alloreactivity, whereas tumor incidence was markedly reduced (figure 5A). Merging all the data from the experiments performed in this study (online supplemental figure S7) showed that the clinical intensity of GVHD was stronger after anti-CTLA-4 administration than after anti-TNFR2 treatment on day 0, day 2, and day 4 and that on day 10 (AUC=89 and 82 for anti-TNFR2 on day 0 and day 10, respectively, vs an AUC=126 for anti-CTLA-4, p<0.05). At the time of spleen collection (day 12), the Treg frequency among CD4+ T cells of anti-CTLA-4 treated individuals was markedly lower than that of control mice (from 8.27%±1.94% to 0.89%±1.15%) (figure 5B). In our hands, anti-TNFR2 treatment mainly modified the activation state of Tregs, without considerably modifying their frequency (figure 4), whereas anti-CTLA-4 administration led to the quasi-disappearance of the Treg population. The subpopulation of CD8+FOXP3+ Tregs among CD8+ T cells was also reduced (from 1.16±0.49% to 0.37±0.15%). Conversely, we observed an increase in both CD4+FOXP3- (16.75%±12.13%) and CD8+FOXP3- (25.12%±11.06%) T cell populations when mice were treated with anti-CTLA-4 (figure 5B), compared with untreated mice (CD4+: 6.70%±2.43%; CD8+: 12.30%±2.30%). In summary, we were unable to demonstrate any difference either in the CD4+FOXP3- or CD8+FOXP3- T-cell populations relative to those of untreated mice with an anti-TNFR2 treatment beginning on day 0. Only late treatment with anti-TNFR2 increased the frequency of CD8+ T cells (figure 3). Anti-CTLA-4 administration on day 0 led to a rapid increase in both CD4+FOXP3- and CD8+FOXP3- populations but at the expense of more severe GVHD and the quasi-complete disappearance of both the CD4+FOXP3+ and CD8+FOXP3+Treg populations.
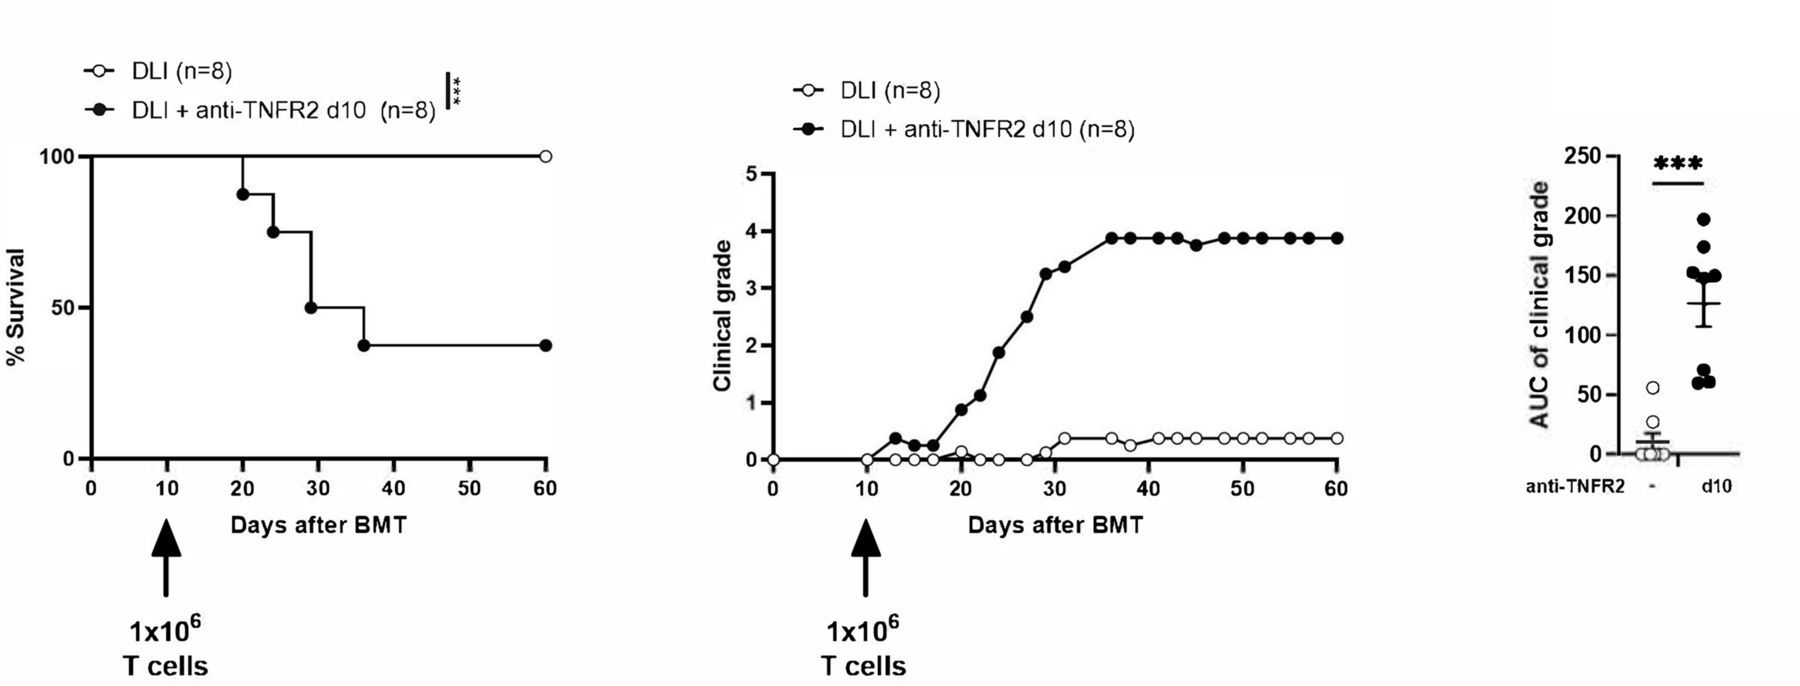
TNFR-2 blockade in donor lymphocyte infusion (DLI). Lethally irradiated (B6D2)F1 recipient mice received 5×10⁶ BM cells and were infused 10 days later with 1×10⁶ T cells (labeled as DLI, n=8) and treated with anti-TNFR2 mAb (labeled as DLI +anti-TNFR2, n=8). Survival curves, clinical grades, and the AUC of clinical grade are presented. Kaplan-Meier survival curves were compared using log-rank tests. The AUCs of the GVHD clinical grade curve was calculated for each mouse and are presented as the mean±SD. A Mann-Whitney test was performed. results are presented as the mean±SD. ***P<0.001. AUC, area under the curve; BMT, bone-marrow transplantation; GVHD, graft-versus-host disease.
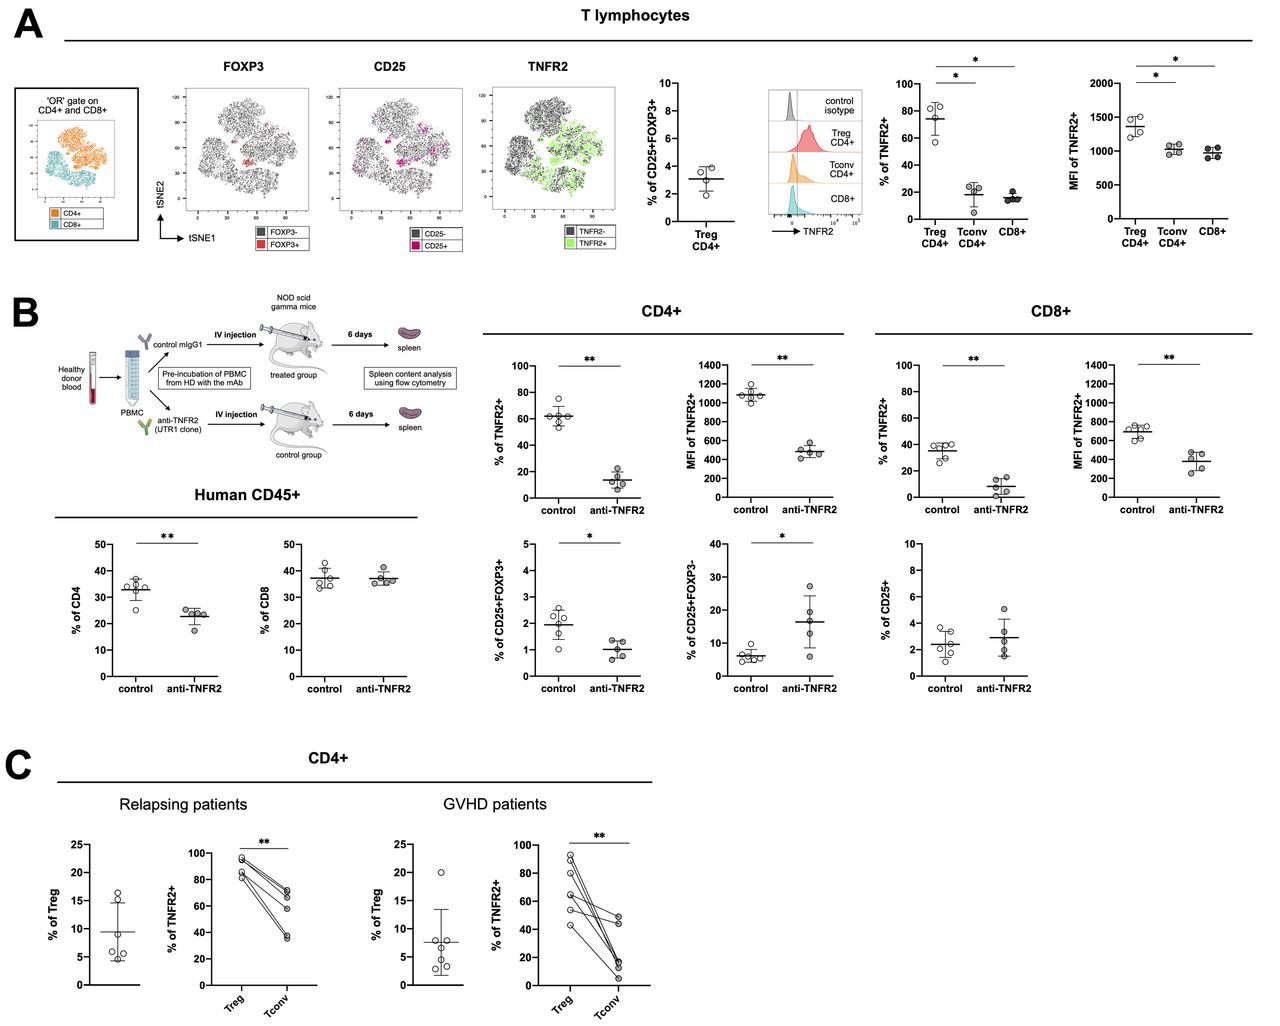
Tumor necrosis factor receptor-type 2 (TNFR2) expression on human cells from healthy donors and from hematopoietic stem-cell transplantation (HSCT) patients. (A) cell clustering using a t-distributed stochastic neighbor embedding (tSNE) algorithm performed on an « or » gate including both CD4+ and CD8+ cells collected from healthy donors (n=4). The localization of CD4+ and CD8+ cell clusters is indicated in the subfigure on the left. The localization of Foxp3+, (in red), CD25+ (in pink), and TNFR2+ (in green) cells among the aforementioned lymphocyte populations are mapped. The percentage of CD25+FOXP3+ (Treg) cells among CD4+ cells and the gating strategy and percentage of TNFR2+ cells, as well as their mean fluorescence intensity among CD4+ Tregs (CD25+FOXP3+) and Tconv (FOXP3-) are indicated. (B) Peripheral blood mononuclear cells (PBMCs) from two healthy volunteers were pre-treated 2 hours at 37°C with an anti-hTNFR2 mAb (UTR-1 clone) or a control mIgG1 and injected into NSG mice, as depicted. The spleens were analyzed on day six for the percentage of CD8+, CD4+, TNFR2+, CD25+, and Foxp3+ cells and the mean fluorescence intensity of TNFR2+ cells. (C) TNFR2 expression on CD4+ Tregs (CD25+FOXP3+) and Tconv (FOXP3-) from relapsing patients (n=6) or patients experiencing graft-versus-host disease (GVHD) (n=7) after alloHSCT. Data are plotted as the mean±SD. Statistical significance from the controls was determined using Mann-Whitney tests. *P<0.05, **p<0.01. Parts of the figure were drawn by using pictures from Servier medical art (http://smart.servier.com/), licensed under a creative commons Attribution 3.0 Unported license (https://creativecommons.org/licenses/by/3.0/).
DLIs are mostly administered after alloHSCT to treat relapses of hematological malignancy. Such delayed administration of T cells is often unsuccessful in controlling malignancy, thus leaving space for anti-TNFR2 treatment to further boost the alloreactivity of DLIs. Thus, we attempted to strengthen our observations by testing the anti-TNFR2 strategy in a model of delayed DLI. Recipient mice, therefore, received bone marrow cells on day 0 and T cells on day 10, with or without anti-TNFR2 treatment on day 10 (figure 6). In this experimental setting, we did not observe any mortality nor clinical signs of GVHD in untreated control mice. On the contrary, anti-TNFR2 treatment at the time of T-cell infusion immediately led to increased alloreactivity, shown by higher clinical grades of GVHD. This suggests that anti-TNFR2 treatment is a perfectly relevant therapeutic approach to trigger a GVL effect in the setting of delayed DLI that would have an insufficient antileukemic effect on its own.
TNFR2 is a relevant therapeutic target on human T cells in the steady state and after alloHSCT
We first evaluated TNFR2 expression in healthy volunteers (figure 7A), generating a t-SNE map of CD4+ and CD8+ T cells. Displaying FOXP3, CD25, and TNFR2 expression on the map allowed us to discriminate between conventional CD4+ and CD8+ T cells and CD4 +Tregs via their coexpression of CD25 and FOXP3. Among the four donors considered for this analysis, CD4+ Tregs represented a mean of 3.07%±0.88% of the lymphocyte population. TNFR2 expression was distributed equally between the CD4+ and CD8+ clusters, with a seemingly higher density in the CD4+ Treg cluster. The frequency and density of TNFR2 expression were indeed significantly higher than for conventional CD4+ and CD8+ T cells. We evaluated whether such preferential expression of TNFR2 by Tregs remained in vivo in settings in which conventional T cells are highly activated using cells from two of the healthy donors described above to generate a xenogeneic model. Half of the PBMCs were incubated with UTR-1, a mouse anti-human TNFR2 antagonistic mAb and the rest with a control mIgG1 for 2 hours and then used to infuse immunodeficient NSG mice. After 6 days, we collected the spleens of the grafted mice and evaluated any modifications of the CD4+ and CD8+ cell populations resulting from UTR-1 treatment (figure 7B). Among the human CD45+ cells, we noted a reduction in the percentage of CD4+ but not CD8+ T cells. Relative to the initial frequency on the CD4+ and CD8+ T cells before injection into the mice (figure 7A), the frequency of TNFR2 6 days after mouse antibody stimulation was higher on CD8+ (15.98±3.12% to 35.15%±5.97%) and markedly higher on CD4+ (18.14±8.98 to 61.98%±7.37%), consistent with the strong lymphocyte stimulation induced in the xenogeneic models (figure 7B). Interestingly, the frequencies of TNFR2-expressing CD4+ and CD8+ T cells were markedly lower after UTR-1 pretreatment under these experimental conditions. Indeed, the frequency of CD25+FOXP3+ Tregs among CD4+ T cells was lower in the treated mice (1.01%±0.32%) than the control mice (1.94%±0.55%). At the same time, the frequency of CD4+CD25+FOXP3- cells was higher (16.42%±1.93%) than that of the control group (6.13%±7.87%). These results, obtained in vivo in a short-term xenogeneic stimulation model, are encouraging in terms of the possibility to block human Tregs using an anti-TNFR2 mAb.
We conducted a preliminary preclinical study in a small cohort of grafted patients who were relapsing from their initial blood cancer or suffering from cortico-resistant GVHD (online supplemental table S1) to reinforce the relevance of a therapeutic strategy based on blocking TNFR2 (figure 7C). In the relapsing-patients, 89.77%±6.51% of 9.44%±5.16% of Tregs highly expressed TNFR2, whereas only 56.68%±16.41% of conventional T cells were TNFR2+. Such a difference in expression of TNFR2 between Tregs and conventional T cells not only confirms what we observed in our xenogeneic model in an allogeneic setting, but also validates our therapeutic strategy by suggesting that such an approach will preferentially target Tregs in this clinical setting. An alternative therapeutic approach in alloHSCT suggested by the literature consists of targeting Tregs via TNFR2 expression but using agonist mAbs to activate and expand the Treg population to decrease the allogeneic response and subsequent GVHD.22 We also studied the differential expression of TNFR2 on Tregs and conventional T cells in the context of cortico-resistant GVHD to assess the versatility of this approach, depending on the therapeutic objective. Although the percentage of TNFR2+ Tregs was lower (69.72±18,44%) than in healthy volunteers and relapsing patients, it was still higher than that of TNFR2+ conventional T cells, which in this context dropped to 23.00%±16.65%.
Overall, our results suggest that TNFR2 is a relevant marker for targeting Tregs in humans. In the context of alloHSCT, TNFR2 modulation could serve multiple strategies, from prevention and treatment of relapse (in combination or not with DLI) to the treatment of GVHD.
Discussion
Here, we demonstrate that anti-TNFR2 treatment directly triggers alloreactivity in a context in which the infused T cells alone are not able. We also establish the proof of concept that anti-TNFR2 treatment can mediate a potent GVL/GVT effect under different experimental models of hematological malignancy relapse after alloHSCT. An antitumor strategy through TNFR2 blockade was initially proposed to treat solid tumors or Sézary lymphoma but the ability of such a strategy to trigger an allogeneic immune response was never developed or tested. Our work makes a decisive contribution to validating a new indication for blockade of the TNF-α/TNFR2 pathway.
Almost all experimental models to study the GVL effect consist of the administration of a large number of T cells with tumor cells and show that an anti-GVHD treatment has no deleterious effect on the GVL effect. Clinical applications for therapeutic strategies tested in such preclinical settings would then be intended for patients who develop GVHD after the graft to treat their GVHD manifestations without jeopardizing the alloreactivity already triggered against their malignancy by the graft. On the contrary, our strategy was conceptually different and designed with the idea of treating patients who relapsed without a previous occurrence of GVHD, a clinical setting that cannot be addressed through the aforementioned experimental models, in which the excess of T cells makes it impossible for tumor cells to develop. Thus, to accurately model this clinical context in mice required that we cross titrate varying numbers of T cells and tumor cells to find the quantity of injected T cells that does not allow elimination of the tumor cells nor induce GVHD but is sufficient to mediate a strong GVL effect once boosted. This is a finely tuned model, as it is not possible to modify the number of T cells or tumor cells without losing the experimental conditions that allow the question to be addressed. We also successfully defined the experimental conditions that mimic DLI by the postponed administration of donor T cells. The development of such experimental models is an additional original contribution of this study because it makes it possible to precisely model a leukemia relapse in the absence of GVHD in a context in which immune cells, administered at the time of transplantation or later, are present but ineffective. We validated the approach of intensifying alloreactivity by a treatment targeting TNFR2 in each of these experimental models. In the clinical setting, most alloHSCT procedures are indicated to treat patients with acute myeloid leukemia (AML). Here, we used two tumor models that have been widely validated in mice: the very aggressive and difficult to eliminate P815-mastocytoma model, a tumor type clinically not eligible for alloHSCT, and the A20-B cell lymphoma, a more clinically relevant model, but which is easier to eliminate in experimental BMT. In both cases, we observed a strong GVL/GVT effect. In the future, and once human clinical grade anti-TNFR2 is developed, it will be informative to test this approach using a human cell line of AML in a model of xenogeneic GVHD performed in NSG mice.
Our results using these models clearly demonstrate the broader principle that although TNFR2 is expressed by activated T cells, higher TNFR2 expression by Tregs make them preferentially sensitive to anti-TNFR2 treatment in vivo. Indeed, we observed that blocking the suppressive effect of Tregs leads to an increase in the percentage of CD8+ FOXP3- T cells. This observation is of prime importance because CD8+ T cells are essential for the antitumor effect and the Treg/CD8 ratio was previously demonstrated to be a relevant biological marker for several cancers.40–45 In addition, although the percentage of TNFR2-expressing CD4+ and CD8+ T cells decreased, it was associated with a marked increase in their proliferation, as shown by an elevated proportion of CD4+ and CD8+ KI-67+ conventional T cells in treated mice. In other words, although the percentage of TNFR2-expressing T cells markedly decreased due to anti-TNFR2 treatment, it occurred without abolishing either the capacity of the treatment to trigger alloreactivity of donor T cells or the associated GVL/GVT effect. This observation provides an additional element in favor of the dual role for TNFR2 in conventional T cells already reported in the literature. Indeed, TNFR2 is predominantly found in activated conventional T cells, in which it acts as a costimulatory molecule, in a unique, non-redundant manner relative to CD28 costimulation.27 46 However, its expression is not only essential for optimal proliferation and activation of effector T cells but also for the induction of activation-induced cell death (AICD), which terminates the proliferative response.47 Consistent with this dual role, TNFR2−/− CD8+ T lymphocytes exhibit high resistance to AICD, leading to worsened colonic inflammation in a mouse model of colitis.48 This last observation could partially explain why CD8+ T cells were more numerous and proliferative in our alloHSCT model following TNFR2 blockade.
CD8+FOXP3+ suppressive T-cells have been previously described in both mouse and human GVHD.33 34 Although CD4+FOXP3+ CD4+ Tregs are considered to be major actors of immunosuppression in the field of alloHSCT, whereas CD8+FOXP3+ Tregs are not considered to have the same level of relevance, we studied these cells to better characterize them and eventually use them as a marker for the therapeutic effect of anti-TNFR2 treatment. Here, we show, for the first time, that the CD8+FOXP3+ T-cells that emerge spontaneously after BMT highly express TNFR2 and are also affected by anti-TNFR2 treatment. Despite the general interest in the community in CD8+FOXP3+ Treg cells, to date, there are no specific markers that allow targeting of these cells. Our results conclusively demonstrate that TNFR2 is an excellent candidate, with broad implications in the clinic. Indeed, they validate the dual interest of anti-TNFR2 treatment that targets both CD4+ and CD8+ FOXP3+ Tregs, which may be involved in cancer relapse. In addition, TNFR2 is the only target that makes it possible to block several tolerogenic cell populations: CD4 and CD8 Tregs, in this study, MDSCs,49–51 or less well-described immunosuppressive populations, such as endothelial progenitor cells,52 which also express TNFR2.
Over the last few years, we have been strongly committed to establishing a clinically effective strategy for Treg depletion to increase the post-transplant antitumor effect. We provided the key proof of concept in humans12 24 and are currently conducting a confirmatory, randomized, double-blind clinical trial to demonstrate the benefit of Treg-depleted DLI versus standard DLI (DLI-Boost, ClinicalTrials.gov, NCT03236129). The current study constitutes an exciting advance towards this objective by providing a technologically much simpler approach than the ex-vivo elimination of Tregs on CD25 expression upstream of the DLI. In addition, we previously observed that CD25-based depletion of Tregs also resulted in the unwanted partial elimination of antitumor CD8+CD25+ effector T cells.53 The anti-TNFR2 approach likely targets Tregs without impairing the activation and proliferation of CD8+ T-cells.
We also tested the advantages and complementarity that an anti-TNFR2 strategy could have relative to immune checkpoint inhibitors that have already reached the clinical stage. In the same model, we observed comparable clinical effects but different biological consequences. Indeed, anti-CTLA-4 treatment led to the almost complete disappearance of Tregs, which did not occur with anti-TNFR2, an interesting difference that could limit the development of side effects in patients relative to immune checkpoint inhibitors. Furthermore, compared with untreated mice, remaining Tregs following anti-TNFR2 treatments at day 0 or day 10 under-express CTLA-4, CD25, ICOS and NRP, and CD39, KLRG1 and CD103 when mice were treated at day 0, indicating an impaired activation/suppressive function of Tregs. These marked differences compared with anti-CTLA4 therapy suggest that more rapid Treg reconstitution after anti-TNFR2 therapy may occur, thereby limiting the risk of severe GVHD and autoimmune complications.
This approach would have the additional advantage of its great versatility. Indeed, rather than the radical ex vivo elimination of Tregs before T cell infusion, the administration of the therapeutic mAb, and therefore blockade of the suppressive effect of Tregs, could be adapted to the clinical situation of the patient, as modeled here when mice were treated on day 0 or day 10 or in a DLI approach, with comparable efficacy. Indeed, according to the supplier information, which we confirmed in our model, the half-life of anti-TNFR2 in vivo is approximately 48 hours (36 hours in our experimental model of GVHD, data not shown). Early and repeated administration of anti-TNFR2 could correspond to a preventive treatment for patients at high risk of leukemia relapse and low risk of GVHD. Conversely, a short treatment administered well after alloHSCT could trigger alloreactivity in patients at high risk of GVHD and low risk of relapse and only in cases of a documented relapse.
Importantly, this is the first time that in vivo controlled release of an allogeneic immune response has been shown to elicit an antitumor response through the direct targeting of Tregs. Of course, such an antitumor response was associated with strong GVHD in mice, but our previous clinical results have shown that, GVHD, when it occurred in patients, has always been sensitive to conventional immunosuppressive treatments, at least in ex vivo Treg-elimination strategies in DLI.12 24
We further highlighted this important translational deliverable by generating essential data showing that Tregs from healthy donors and patients with post-transplant leukemia relapse or GVHD preferentially express TNFR2 relative to effector T cells, as in autoimmune settings.54 55 These data validate two potential inverse applications of the TNFR2 strategy: blocking Tregs to increase the antitumor or allogeneic immune response or inducing Tregs with TNFR2 agonists to dampen the immune response.13 14 The results reported here represent a major breakthrough on the path to transforming controlled immunomodulation of the allogeneic immune response into clinical reality by targeting Tregs through TNFR2.
Data availability statement
Data are available on reasonable request. Not applicable.
Ethics statements
Patient consent for publication
Ethics approval
All experiment protocols were approved by the local ethics committee (authorization number APAFIS#11 511-2017092610086943) and in compliance with European Union Guidelines.
Acknowledgments
Audrey Moatti and Anaïs Debesset each received a PhD grant from the Université Paris-Est-Créteil (UPEC). We are grateful to the IMRB for providing access to their animal facility team and the flow cytometry platform team for their help.
References
Supplementary materials
Supplementary Data
This web only file has been produced by the BMJ Publishing Group from an electronic file supplied by the author(s) and has not been edited for content.
Footnotes
Twitter @fgissa
AD and CP contributed equally.
Contributors AM, CP, ML, SM, BLS, FI, AT, and JLC designed the study; AM, AD, CP, AB-F, and AT performed experiments; FC performed the histology on the GVHD target organs and analyzed the data; NHT, AB and YB designed the protocol and performed the irradiation of the mice; RR, ML and DM selected patients, AM, AD, CP, AB-F, ML, DM, BLS, FI, SM, AT, and JLC analyzed the data, AM, AT, CP, and JLC wrote the first draft of the manuscript and all authors contributed in the final version. AT and JLC are colast authors. JLC acting as guarantor.
Funding This work was supported and funded mainly by the Fédération Leucémie Espoir and partially by a grant from the French Ministry of Health (PRTK-2018).
Competing interests No, there are no competing interests.
Provenance and peer review Not commissioned; externally peer reviewed.
Supplemental material This content has been supplied by the author(s). It has not been vetted by BMJ Publishing Group Limited (BMJ) and may not have been peer-reviewed. Any opinions or recommendations discussed are solely those of the author(s) and are not endorsed by BMJ. BMJ disclaims all liability and responsibility arising from any reliance placed on the content. Where the content includes any translated material, BMJ does not warrant the accuracy and reliability of the translations (including but not limited to local regulations, clinical guidelines, terminology, drug names and drug dosages), and is not responsible for any error and/or omissions arising from translation and adaptation or otherwise.