Article Text

Abstract
Background Patients with BRAF-mutant and wild-type melanoma have different response rates to immune checkpoint blockade therapy. However, the reasons for this remain unknown. To address this issue, we investigated the precise immune composition resulting from BRAF mutation in treatment-naive melanoma to determine whether this may be a driver for different response to immunotherapy.
Methods In this study, we characterized the treatment-naive immune context in patients with BRAF-mutant and BRAF wild-type (BRAF-wt) melanoma using data from single-cell RNA sequencing, bulk RNA sequencing, flow cytometry and immunohistochemistry (IHC).
Results In single-cell data, BRAF-mutant melanoma displayed a significantly reduced infiltration of CD8+ T cells and macrophages but also increased B cells, natural killer (NK) cells and NKT cells. We then validated this finding using bulk RNA-seq data from the skin cutaneous melanoma cohort in The Cancer Genome Atlas and deconvoluted the data using seven different algorithms. Interestingly, BRAF-mutant tumors had more CD4+ T cells than BRAF-wt samples in both primary and metastatic cohorts. In the metastatic cohort, BRAF-mutant melanoma demonstrated more B cells but less CD8+ T cell infiltration when compared with BRAF-wt samples. In addition, we further investigated the immune cell infiltrate using flow cytometry and multiplex IHC techniques. We confirmed that BRAF-mutant melanoma metastases were enriched for CD4+ T cells and B cells and had a co-existing decrease in CD8+ T cells. Furthermore, we then identified B cells were associated with a trend for improved survival (p=0.078) in the BRAF-mutant samples and Th2 cells were associated with prolonged survival in the BRAF-wt samples.
Conclusions In conclusion, treatment-naive BRAF-mutant melanoma has a distinct immune context compared with BRAF-wt melanoma, with significantly decreased CD8+ T cells and increased B cells and CD4+ T cells in the tumor microenvironment. These findings indicate that further mechanistic studies are warranted to reveal how this difference in immune context leads to improved outcome to combination immune checkpoint blockade in BRAF-mutant melanoma.
- melanoma
- CD8-positive T-lymphocytes
- B-lymphocytes
- CD4-positive T-lymphocytes
- immunotherapy
Data availability statement
Data are available upon reasonable request.
This is an open access article distributed in accordance with the Creative Commons Attribution Non Commercial (CC BY-NC 4.0) license, which permits others to distribute, remix, adapt, build upon this work non-commercially, and license their derivative works on different terms, provided the original work is properly cited, appropriate credit is given, any changes made indicated, and the use is non-commercial. See http://creativecommons.org/licenses/by-nc/4.0/.
Statistics from Altmetric.com
Key messages
Patients with BRAF-mutant versus BRAF wild-type metastatic melanoma have different response rates to immune checkpoint blockade treatment. The reasons for this are currently unclear. In treatment-naive patients, we revealed that BRAF-mutant melanoma immune context is distinct from that of wild-type melanoma in both primary and metastatic disease, and this has prognostic significance. These findings indicate further mechanistic studies are warranted to reveal why the BRAF-mutant melanoma responds better to dual immune checkpoint blockade, ultimately leading to new predictive biomarkers and improved stratification of patients for therapy.
Introduction
Melanoma is one of the leading causes of cancer-related mortality worldwide. Up to 20% of patients develop advanced/metastatic disease, and historically the 10-year survival rate in patients with advanced melanoma is approximately 10%.1 Alterations in several oncogenic driver genes, including genes encoding NRAS and the serine/threonine kinase BRAF, have been identified in melanoma.2 Up to 40% of melanomas carry an activating BRAF mutation, and 90% of reported BRAF mutations result in a substitution of glutamic acid for valine at amino acid 600.3 Among these, around 70% are V600E, 20% are V600K and the remainder are rarer mutations, including V600R, V600D, V600E2, V600G, V600M, V600A and V600L.4 BRAF V600 mutations constitutively activate BRAF and downstream signal transduction in the mitogen-activated protein kinase (MAPK) pathway.5 Targeting the MAPK pathway with combined BRAF and MEK inhibition induces rapid responses and improves survival6 7 in patients with activating BRAF V600 mutations, however, disease control is often not sustained, with a median progression-free survival of approximately 12 months.8–10
Recently, immune checkpoint inhibitors (ICIs), including monoclonal antibodies (mAbs) against programmed cell death-1 (PD-1) and programmed cell death-ligand 1, have demonstrated impressive antitumor effects in melanoma. The 5-year overall survival rates are around 34%–41% and 44% in patients treated with pembrolizumab11 and nivolumab,12 respectively. The 5-year overall survival improves to 52% when treated with nivolumab plus ipilimumab, an mAb targeting cytotoxic T-lymphocyte-associated antigen 4 (CTLA4),12 but with a corresponding increase in toxicity.12 Notably, the 5-year overall survival with nivolumab-plus-ipilimumab was higher in patients with a BRAF mutation at 60%, in contrast to 48% in patients without BRAF mutations.12 This suggests that the treatment-naive immune context in melanoma with BRAF mutations is distinct from those without BRAF mutations. More interestingly, a recent study demonstrated that an interferon γ gene expression signature was a prognostic factor and was of relevance for stratifying patients with respect to clinical benefit from BRAF and MEK inhibitors.13 These data further emphasize the critical role of the immune response in determining the clinical benefit from not only ICIs but also targeted therapy. Thus, an in-depth characterization of the treatment-naive immune context in melanoma with BRAF mutations is needed. Previous in vitro studies demonstrated that the MAPK signaling pathway can induce immune evasion in human melanoma cells,14 and oncogenic BRAF promoted stromal cell-mediated immune suppression in melanoma.15 Studies also show that BRAF and/or MEK inhibitors have beneficial effects in boosting the antitumor immune response through increased immune-stimulatory cytokine levels and increased intratumoral effector T cell infiltration and activity.16–18 However, the treatment-naive immune context in BRAF-mutant melanoma has not been investigated systematically. A better understanding of the immune phenotypes associated with BRAF mutations would benefit the rational development of optimal therapy for patients with melanoma.
Materials and methods
Single-cell transcriptomic analysis
Normalized gene expression levels in log reads per kilobase of transcript, per million mapped reads and clinical metadata for single-cell RNA sequencing (scRNA-seq) measurements from patients with metastatic melanoma19 were downloaded from a published study via Gene Expression Omnibus, through accession number GSE72056. The study included measurements from a total number of 4645 cells from 19 patients: 8 patients wt for NRAS and BRAF, 5 patients with NRAS mutation, 4 with BRAF V600 mutations (BRAF-V600E=3, BRAF-V600K=1) and 2 patients with unknown mutation status. Cells annotated as malignant by the study were removed. Although the cell type identities were already determined for the 3388 non-malignant cells by this study, we took advantage of recent developments in the field and applied a reference-based strategy to re-annotate the cell types. We mapped the non-malignant metastatic melanoma single cells to a comprehensive reference of immune cell types using scArches.20 The reference dataset was generated from lung, PBMCs and bone marrow immune and epithelial cells, integrating cell types across 17 different studies as described by Wolf et al.21 We ran scArches in the default mode, but changed the loss function to the sum of squared of the errors as we were using normalized log expression values. We merged the reference dataset and the metastatic melanoma dataset using 2000 highly variable genes using scanpy.21 Briefly, scArches estimates latent spaces where the reference and query melanoma data set can be optimally aligned. Then, a weighted k-nearest neighbor (KNN) classifier is used to predict the identity of cells in a neighborhood on that latent integrated space. We used a weighted KNN classifier that predicts cell type annotation in the latent integrated space using five nearest neighbors with less than 5% prediction uncertainty.
The reference-based approach to cell type annotation resulted in the identification of more diverse cell types compared with the marker-based annotation applied by the original study.19 We then tested for differences in the abundance of cell types between cells from BRAF mutation and BRAF wild-type (BRAF-wt) samples. For each predicted cell type, we tested if there is a difference in the number of counts of BRAF-mutant cells and BRAF-wt cells using Fisher’s exact test in R.
Differential gene expression and pathway analysis using the bulk RNA-seq from The Cancer Genome Altas (TCGA) skin cutaneous melanoma (SKCM) cohort
Raw bulk RNA-seq data for TCGA SKCM primary and metastatic tumors and clinical annotation were downloaded using the TCGAbiolinks Bioconductor package.22 RNA-seq counts were filtered by expression, the log counts per million (logCPM) transformed and trimmed mean of M-values normalized23 using edgeR.24 Differential gene expression analyses were performed in each primary and metastatic cohorts using the quasi-likelihood pipeline of edgeR.25 Briefly, gene-wise negative binomial dispersion values were estimated. A quasi-likelihood negative binomial log-linear model was fitted for each gene. The p value for differential expression was determined by the quasi-likelihood F-test and adjusted for multiple hypotheses testing. Genes with a false discovery rate <0.05 were determined as differentially expressed between BRAF-mutant and BRAF-wt samples. We tested for the enrichment of MsigDB Hallmark gene set collection in BRAF-mutant cases compared with BRAF-wt cases using fry25 in limma R/Bioconductor package.26 The mutation subtypes for TCGA SKCM samples were retrieved from online supplemental table of the original study by Thorsson et al.27
Cell type analysis using the bulk RNA-seq from the TCGA SKCM cohort
To quantify differences in immune decomposition between BRAF-mutant and BRAF-wt tumors, we first quantified infiltrating immune cell types in each sample using multiple bulk RNA-seq immune deconvolution methods to leverage the strengths of various deconvolution algorithms. The abundances of immune cell types in each sample were estimated using quanTIseq,28 TIMER,29 CIBERSORT,30 MCPCounter,31 XCell,32 EPIC33 and ImmuCellAI34 deconvolution algorithms implemented in immunedeconv R package.35
To compare the infiltrating immune cell types between BRAF-mutant and BRAF-wt samples, we first fitted a logistic regression model to cell type scores estimated by each deconvolution algorithm using R package glmnet.36–39
This provided us with regression coefficients from multiple models (one model for each deconvolution approach) that reflect the association between BRAF mutation status and the cell type scores estimated by each deconvolution method.
We then borrowed strengths between different deconvolution algorithms by stacking the individual logistic regression coefficients (also called weights). We fitted a feature-weighted elastic net (fwelnet) model to stack the logistic regression models fitted to scores from individual deconvolution methods.40 This is equivalent to fitting a meta-model to individual models to borrow strengths between various deconvolution approaches. We obtained weights for each cell type in each deconvolution approach using this approach, some of which were zero. This resulted in the selection of only a subset of cell types across various deconvolution algorithms that are most likely to contribute to differences between BRAF-mutant and BRAF-wt samples, both in a positive and in a negative way. We simply took the weighted average of regression coefficients from models fitted to each deconvolution method as the final (stacked) regression coefficients, where weights are the coefficients estimated by the fwelnet model, only for cell types selected by this meta-model. We, therefore, were able to identify cell types that are most relevant to the difference between BRAF-mutant and BRAF-wt sample, and we quantified this difference by a single value obtained by stacking regression coefficients from individual models fitted to each deconvolution approach, weighted by the relevance of each deconvolution approach. The regularization parameter, the shrinkage operator, in fwelnet model was determined by 10-fold cross-validation. This model fitting process was applied to primary and metastatic cohorts separately.
Patient samples for flow cytometry and multiplex immunohistochemistry (IHC)
Patients undergoing surgical resection of melanoma metastases (as clinically indicated) were enrolled in a prospective protocol after approval from the Peter MacCallum Cancer Center (PMCC) Human Research Ethics Committee (HREC) under approval no 13/141. All methods performed in this study were carried out in accordance with relevant guidelines and regulations under this approval. Clinical data were collected prospectively from the patient, and missing data were extracted from the medical record. Online supplemental table 1 provides details of each patient’s treatment-naive melanoma metastasis.
Supplemental material
Flow cytometry
Following tumor excision, a representative fragment of tumor measuring approximately 1 cm3 was transferred fresh and sterile to the laboratory for study. Briefly, the tumor was initially divided into segments and then finely diced into RPMI1640 (Gibco) containing 1 mg/mL collagenase type 4 (Worthington Biochemical, Lakewood, New Jersey, USA), 30 U/mL DNase (Sigma-Aldrich Pty, Sydney, NSW, Australia) and incubated for 30 minutes at 37°C on a rocker. Digested tumor pieces were teased through a 100 µm sieve, the sieve irrigated with RPMI1640 supplemented with 10% heat-inactivated fetal calf serum (RP-10) and the cells collected into a 50 mL conical tube. Pelleted cells were resuspended in RP-10 and used for flow cytometry analysis.
Approximately 2×10⁵ cells were plated in V-bottom 96-well plates and spun down. First cells were stained with viability dye LIVE/DEAD Fixable Near-IR Dead Cell (ThermoFisher) diluted in phosphate-buffered saline (PBS) for 10 min at room temperature in the dark. After one wash in FACS buffer (PBS (Ca++/Mg ++free), 2% fetal bovine serum, 2 mM EDTA), the FC receptors were blocked with Human TruStain (BD Biosciences, San Diego, California, USA) for 10 min at room temperature. Cells were stained with fluorochrome-conjugated mAbs for extracellular markers for 30 min at 4°C in FACS buffer. After one wash in FACS buffer, cells were fixed with eBioscience Foxp3/Transcription Factor Staining Buffer Set (Invitrogen) and stained with intracellular antibodies for 30 min at 4°C in permeabilization wash buffer. After two washes in permeabilization wash buffer and one in FACS buffer, the cells were acquired on BD Symphony (BD Biosciences) and data analyzed using FlowJo V.10 software (Treestar, Seattle, California, USA).
Antibodies used in this study included CD45-BV510, CD8-BV605, PD-1-BV785, CCR7-BV711, CD4-AlexaFluor700, CD39-APC, LAG3-PE Dazzle594, CTLA4-PercpCy5.5, CD11c-APC, HLA-ABC PercPCy5.5 (BioLegend, San Diego, California, USA); HLA-ABC-PE, CD3 BUV395, CD45RA-FITC, CD8-BV805, CD69 PE-cy7, CD103-BV421, CD19-BV450, CD14-PE-CF594, CD56-FITC (BD Biosciences) and Foxp3-PE (eBioscience, San Diego, California, USA). A representative example of the gating strategy of antigen-presenting cells and T cells is shown in online supplemental figure 1.
Multiplex IHC
Three micrometer sections of FFPE tissue on super frost plus slides were deparaffinized and rehydrated by serial passage through changes of xylene and graded ethanol for multiplex IHC staining. Full details for staining, imaging, cell segmentation, data processing and quality control were described in a previous study.41
Selection of cell type signatures predicting survival outcomes in TCGA SKCM cohort
To identify immune cell types associated with survival differences within TCGA patients with BRAF mutation (ie, cell type that is differentially infiltrated between BRAF patients with excellent and poor survival outcomes), we applied a penalized Cox proportional hazard model37 to the scores of cell type signatures selected by the fwelnet model. The optimal value for the shrinkage penalty was selected in 10-fold cross-validation. This resulted in a subset of cell type signatures selected by the fwelnet model that are relevant to survival outcomes in BRAF cases. The same procedure was applied to BRAF-wt cases.
Statistical analyses
Data analyses and representations were performed either with the R software or Prism (GraphPad V.8.0, San Diego, California, USA). Statistical analyses for two groups were performed using the Mann-Whitney U test for the cohort with a small sample size of less than 20 and Student’s t-test for the cohort with a large sample size. Results are shown as the mean+SEM. Fisher’s exact test was used for categorical data. A p value ≤0.05 was considered statically significant. Kaplan-Meier curves and Cox proportional HRs were performed using survival42 and survminer43 R packages.
Results
Study design
In this study, we systematically examined the tumor microenvironment immune composition in melanoma samples with or without BRAF V600 mutations (figure 1). We examined data from three independent cohorts using scRNA-seq, bulk RNA sequencing (bulk RNA-seq), flow cytometry and multiplex IHC. We next used TCGA SKCM data and correlated the immune compositions with the patients’ outcome to identify immune biomarkers of prognosis in patients with melanoma with or without BRAF mutation.

Schematic illustration of the experimental design in this study. CAFs, cancer-associated fibroblasts; IHC, immunohistochemistry; ScRNA seq, single-cell RNA sequencing
Immune composition differs between BRAF-mutant and wild-type melanomas
We re-analyzed the single-cell RNA-seq profiles from a total of 4645 malignant, immune and stromal cells isolated from 19 freshly procured human melanoma tumors19: 8 patients wt for NRAS and BRAF, 5 patients with NRAS mutation, 4 with BRAF V600 mutations (BRAF-V600E=3, BRAF-V600K=1) and 2 patients with unknown mutation status. This cohort included 10 metastases to lymphoid tissues (nine to lymph nodes and one to the spleen), eight to distant sites (five to subcutaneous/intramuscular tissue and three to the gastrointestinal tract) and one primary acral melanoma. We utilized the recently developed comprehensive reference of immune cell types scArches20 (figure 2A) and annotated the 3388 non-malignant cells in the study. The reference-based approach to cell type annotation identified more diverse cell types compared with the marker-based annotation applied by the original study. The single-cell data was projected in two-dimensional space through uniform manifold approximation and projection with different BRAF status in figure 2B and labeled with different cell types (figure 2C and online supplemental figure 2). We then tested for differences in the abundance of the immune cell types between cells from melanoma samples with or without BRAF mutation (figure 2D). BRAF-mutant melanoma displayed significantly reduced CD8+ T cells and macrophages, but an increased number of B cells, natural killer (NK) cells and NKT cells (figure 2D).

Single-cell transcriptomic analysis reveals the transcriptome of cells in the tumor microenvironment of melanoma samples. (A) UMAP visualization of reference cell types. (B,C) UMAP visualization of sample mutation (B) and predicted cell types (C) using scRNA-seq data of 3388 cells isolated from metastatic melanoma sample. (D) Pair-wise comparison of predicted cell types between BRAF-mutant and BRAF-wt melanoma samples. Significantly different immune cell populations are indicated by p<0.05 using Fisher’s exact test. HPSC, hematopoietic stem cell; mDC, myeloid dendritic cells; MΦ, macrophages; NKT cells, natural killer T cells; pDC, plasmacytoid dendritic cells; UMAP, uniform manifold approximation and projection.
We then studied the differences in the gene expression and molecular signaling pathways between the BRAF-mutant and BRAF-wt tumors using the 471 melanoma tumors from TCGA SKCM. We separated the primary tumors from the metastatic tumors for the analysis, as we hypothesized the gene profile and cell type composition were different between these two types. This analysis showed more genes were differentially expressed between the BRAF-mutant and BRAF-wt tumors in the metastatic samples than in the primary samples (figure 3A). We then used the 50 hallmark gene sets of the Molecular Signatures Database (MSigDB)44 for molecular signaling pathway analysis. In line with the previous results, the 50 gene set expression variations for both BRAF-mutant and BRAF-wt tumors did not demonstrate a significant difference in the primary cohort. However, striking differences in signaling pathways were identified in the metastatic tumor cohort. Within these, transforming growth factor-ß signaling, inflammatory response, IL6-JAK-STAT3 signaling and IL2-STAT5 signaling were enriched in BRAF-mutant tumors (figure 3B). Taken together, the differences in gene expression and signaling pathways between BRAF-mutant and BRAF-wt samples were more evident when melanoma progressed to regional metastatic disease in the TCGA SKCM cohort.

Differentially expressed gene and pathway analysis using the bulk RNA-seq from TCGA SKCM cohort. (A) Differential gene expression analyses were performed in primary and metastatic cohorts using the quasi-likelihood pipeline of edgeR. The p value for differential expression was determined by the quasi-likelihood F-test and adjusted for multiple hypotheses testing. Genes with FDR < 0.05 were determined as differentially expressed between BRAF-mutant and BRAF-wt samples. (B) The enrichment of MsigDB Hallmark gene set collection in BRAF-mutant samples compared with BRAF-wt samples was tested using fry in limma R/Bioconductor package. FDR, false discovery rate; SKCM, skin cutaneous melanoma; TCGA, The Cancer Genome Atlas.
We further quantified the immune composition in each sample using various bulk RNA-seq deconvolution algorithms, including quanTIseq,28 TIMER,29 CIBERSORT,30 MCPCounter,31 XCell,32 EPIC33 and ImmuCellAI.34 To comprehensively compare the infiltrating immune cell types between BRAF-mutant and BRAF-wt samples, we first fitted a logistic regression model to cell type scores estimated by each individual deconvolution algorithm. This provided us with regression coefficients from multiple models. We then leveraged the independence of multiple deconvolution algorithms to perform feature selection by stacking the individual logistic regression coefficients, also called weights, and fitted them using a fwelnet model.40 Using this approach, we were able to obtain weights for each cell type in each deconvolution algorithm. This resulted in the selection of only a subset of cell types that are most likely to contribute to the difference, in either a positive or negative way, between BRAF-mutant and BRAF-wt samples. This model fitting approach was applied to primary and metastatic cohorts in the TCGA separately (figure 4A,B). Not surprisingly, some cell types predicted by different algorithms demonstrated opposite associations with BRAF mutation status, such as the Tregs from XCell, CIBERSORT and immuCellAI. To identify cell types that most reliably differentiate BRAF-mutant and BRAF-wt samples, we took the weighted average of regression coefficients as the final stacked regression coefficients, where weights were the coefficients estimated by the fwelnet model. As a result, we observed an enrichment of CD4+ T cells, macrophages, mucosal-associated invariant T (MAIT) cells, myeloid dendritic cells (mDCs), cancer-associated fibroblasts (CAFs), common myeloid progenitor (CMP) and hematopoietic stem cells in the BRAF-mutant samples (figure 4C). We also observed a decrease of M2 macrophages, B cells, monocytes, NK cells, neutrophils and T cells in the BRAF-mutant samples in the primary SKCM cohort (figure 4C). An enrichment of Tregs, CD4+ T cells, B cells, MAIT, endothelial cells, macrophages, monocytes and NK cells, as well as a decrease of T cells, mDCs, M2 macrophages, neutrophils and CD8+ T cells and mast cells, was observed in the BRAF-mutant samples in the metastatic SKCM cohort (figure 4D). Taken together, these results from a large cohort of bulk RNA-seq data were in line with the single-cell data and showed enrichment of B cells in the BRAF-mutant metastatic samples and enrichment of CD8+ T cells in the BRAF-wt metastatic samples. Interestingly, CD4+ T cells were enriched in BRAF-mutant samples in both primary and metastatic cohorts. The inconsistency of some cell types, such as macrophages and DCs, between scRNA-seq and bulk RNA-seq may be due to the loss of these cells during the fresh samples digestion required during single-cell RNA-seq sample preparation.

Cell type analysis using the bulk RNA-seq from the TCGA SKCM cohort. (A,B) The immune compositions in each sample were quantified using various bulk RNA-seq deconvolution algorithms, including quanTIseq,28 TIMER,29 CIBERSORT,30 MCPCounter,31 XCell,32 EPIC33 and ImmuCellAI.34 The cell type scores calculated by a logistic regression model were stacked and fitted using a feature-weighted elastic net (fwelnet) model for the primary (A) and metastatic (B) cohorts separately. (C,D) The weighted average of regression coefficients was used as the final stacked regression coefficients for the primary (C) and metastatic (D) cohorts separately. CAF, cancer-associated fibroblast; CMP, common myeloid progenitor; GMP, granulocyte-monocyte progenitor; HPSC, hematopoietic stem cell; mDC, myeloid dendritic cells; MΦ, macrophages; NKT cells, natural killer T cells; SKCM, skin cutaneous melanoma;TCGA, The Cancer Genome Atlas.
To validate the scRNA-seq and bulk RNA-seq data above, we re-analyzed multiplex IHC and flow cytometry data41 to evaluate the immune cell types in a metastatic melanoma cohort, comprising seven BRAF-mutant and nine BRAF-wt samples (online supplemental table 1). Surgical resection samples from patients diagnosed with stage III or IV metastatic melanoma were collected, digested and single-cell suspensions generated for flow cytometric analysis. Notably, BRAF-mutant samples demonstrated significantly more B cells and CD4+ T cells and less CD8+ T cell infiltrates when compared with the BRAF-wt samples (figure 5A). This result was in line with scRNA-seq and bulk RNA-seq results. We then further characterized T cell function. Interestingly, although there were less CD4+ T cells, a significant enrichment of CD4+ central memory T cells was observed in the BRAF-wt samples when compared with the BRAF-mutant samples (figure 5B). There was also a trend towards more CD8+ effector memory T cells in the BRAF-wt samples. Next, we used multiplex IHC to characterize the spatial distribution of these lymphocytes in five BRAF-mutant and five BRAF-wt samples (online supplemental table 1). We observed an increased number of CD4+ T cells in the BRAF-mutant samples, which were predominately presented in the peri-tumoral (stroma) area instead of the intratumoral area and less CD8+ T cells presented in the stroma area (online supplemental figure 3), although not significant when compared with the BRAF-wt samples (figure 5C). Taken together, these findings suggest that the CD4+ T cells in the BRAF-mutant samples, although increased in number, were decreased in the central memory type and excluded from the tumor center. The CD8+ T cells were decreased in number and effector memory phenotype in the BRAF-mutant cases.

Evaluation of immune composition using flow cytometry and IHC methods. (A) Flow cytometry analysis of B cells, DCs, NK, NKT cells, T cells, CD4+ T cells and CD8+ T cells from seven BRAF-mutant samples and nine BRAF-wt samples. (B) Cell differentiation status (naive, CM, central memory; EM, effector memory; TEMRA, T effector memory with CD45RA) of CD4+ T cells and CD8+ T cells were analyzed by flow cytometry. (C) Multiplex IHC analysis to further characterize the distribution (IT, intratumor; stroma) of CD4+ T cells, CD8+ T cells and CD4+Foxp3+ T cells using five BRAF-mutant samples and five BRAF-wt samples. Each dot represents one melanoma sample, and data show mean±SEM. Statistical analyses were performed using a Mann-Whitney U test. P values are indicated. FACS, flow cytometry; IHC, immunohistochemistry; NK, natural killer.
B cells are associated with improved overall survival of patients with BRAF-mutant melanoma
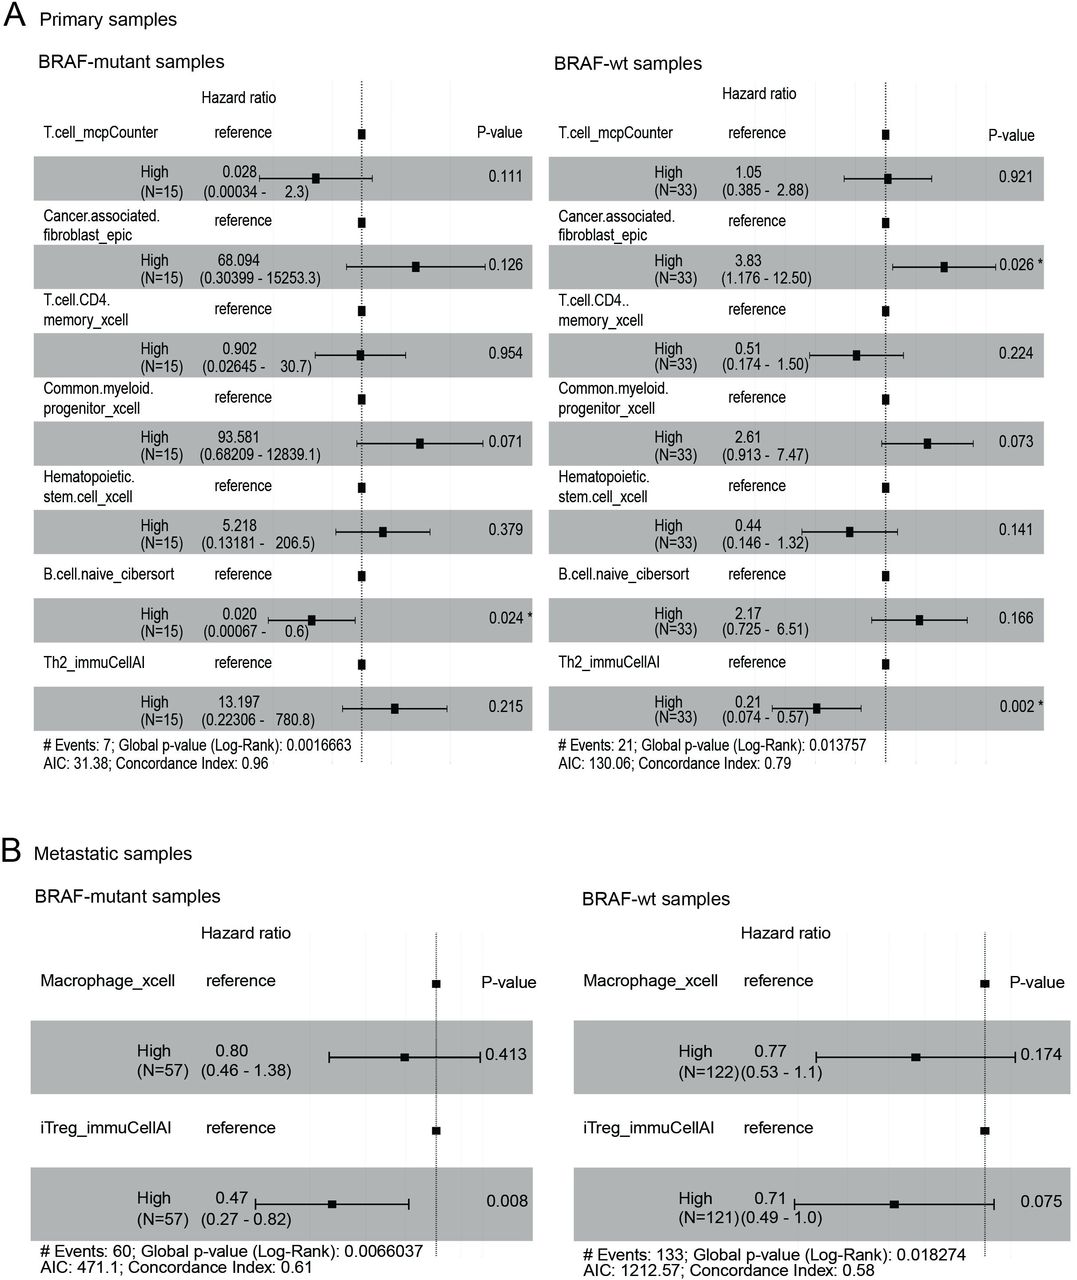
We then investigated whether immune cell types could predict patient survival. To do this, we utilized the survival data from the TCGA SKCM cohort and applied a penalized Cox proportional hazard model to the scores of cell type signature selected by the fwelnet model. In the primary samples, the B_Cell_naive_cibersort (the naive B cell signature enumerated by CIBERSORT algorithm) was associated with improved survival in the BRAF-mutant tumors (figure 6A, left panel), but this association was not significant in the BRAF-wt samples. Instead, CAF_epic was associated with inferior survival and Th2 with improved survival in the BRAF-wt samples (figure 6A, right panel). In metastatic tumors, iTreg was significantly associated with an improved prognosis in the metastatic samples (figure 6B, left panel), but not in the BRAF-wt samples (figure 6B, right panel).

Survival analysis. Penalized Cox proportional hazard model was applied to the scores of cell type signature selected by the fwelnet model using the primary (A) and metastatic (B) TCGA SKCM cohorts. SKCM, skin cutaneous melanoma; TCGA, The Cancer Genome Atlas.
To evaluate the clinical significance of these cell types, we evaluated relevant clinical factors (age, gender and AJCC stages) in a multivariate analysis model (figure 7). In the BRAF-mutant samples, increased CAFs were significantly associated with poor survival, whereas increased iTregs were significantly associated with improved survival (figure 7A). B cells were associated with a trend to improved survival (p=0.078) in the BRAF-mutant samples (figure 7A). In the BRAF-wt samples, advanced age and higher AJCC stage were significantly associated with poor survival (figure 7B). The predictive values of CAFs remained significant, whereas iTreg remained the same trend as in the BRAF-mutant samples but not significant (p=0.052) (figure 7B). Interestingly, Th2 immune cells were significantly associated with improved survival, while B cells showed no association with survival in the BRAF-wt samples (figure 7B). Taken together, CAFs and iTregs had prognostic value in melanoma regardless of BRAF mutation status, while B cells and Th2 immune cell populations were associated with improved survival in BRAF-mutant and BRAF-wt, respectively.

Multivariate survival analysis. The prognostic significances of cell types of interest were evaluated in BRAF-mutant melanoma (A) and BRAF-wt melanoma (B) when incorporating with other clinical factors (age, gender and AJCC stages). *P = <0.05, **P=<0.01.
Discussion
Melanoma is an aggressive form of skin cancer. Although it accounts for only 5% of all skin cancer cases, it leads to 80% of skin cancer-related deaths.1 The development and progression of melanoma are based on the accumulation of genomic changes, including high ultraviolet-driven mutation burdens, which contribute to the development of melanoma and make it one of the most immunogenic tumors.45 Hence, immunotherapy, such as ICIs, that harness and enhance the body’s antitumor immune response have proven to be effective treatment strategies in patients with melanoma as adjuvant therapy after complete surgical resection46 and in patients with advanced disease.11 12 However, not all patients respond well to immunotherapy11 12; thus, understanding the immune microenvironment is necessary to optimize patient treatment plan. Indeed, patients with BRAF-mutant and BRAF-wt melanoma respond differentially to combination ICI therapy.12
In this study, in order to capture the extensive heterogeneity that exists in the tumor microenvironment of V600 BRAF-mutant and BRAF-wt melanoma samples, we used data from a range of melanoma cohorts. In addition, the datasets were generated by multiple approaches, including scRNA-seq, bulk RNA-seq, flow cytometry and multiplex IHC. We identified increased CD4+ T cells (not significant in scRNA-seq) and B cells, but decreased CD8+ T cells infiltrate in the BRAF-mutant metastatic melanoma samples, using scRNA-seq, bulk RNA-seq and flow cytometry approaches. Other cell types were not able to be estimated and validated across multiple platforms due to the limitations of cell preparations or characterization differences of cell phenotypes using different technologies. For example, Dabrosin et al47 investigated the relationship between innate immune cell infiltration and BRAF mutation in 385 primary melanoma and 96 paired metastases using IHC and found that BRAF-positive primary tumors and metastases exhibited increased CD123+ plasmacytoid DC numbers compared with BRAF-negative tumors. We did not observe this difference in the single-cell RNA sequencing and bulk-RNA sequencing cohorts, which could relate to the characterization difference between the IHC and sequencing technologies.
Increased CD4+ T cells and B cell infiltration play a significant role in forming a protective antitumor response. Apart from producing cytokines and tumor-specific antibodies, intratumoral B cells are able to present B cell receptor-cognate antigens to CD4+ T cells48 and affect the clonality,49 phenotype50 and activation51 of CD4+ T cells in the tumor. The underlying mechanism whereby BRAF mutations in the tumor lead to increased B cells and CD4+ T cells infiltration remains unknown.
The decrease of CD8+ T cells infiltrate in melanoma with BRAF mutation was also observed in a Korean melanoma cohort.52 Although the potential mechanisms of this observation remain obscure, one of our hypothesis is that BRAF mutations may be associated with decreased MHC-I expression and decreased tumor antigen presentation on the tumor surface.53 Further validation with mutational status and MHC expression may provide more detailed insight to understand the mechanism of BRAF mutations in forming the melanoma microenvironment. Interestingly, Federick et al54 demonstrated that treatment with either BRAF inhibitor alone or BRAF +MEK inhibitor was associated with an increased expression of melanoma antigens and an increase in CD8+ T cells infiltrate. The finding was supported by another study showing that an influx of CD8+ T cells occurs after triple BRAF +MEK therapy.55 More specifically, a recent study using sequential tumor biopsies obtained before and during BRAF or MEK inhibitor demonstrated that treatment with BRAF/MEK inhibition in patients with melanoma allows an increased expansion of pre-existing melanoma-specific T cells by induction of T-box expressed in T cells (T-bet) and transcription factor-7 (TCF-7) in T cells.56 T-bet and TCF-7 are two transcription factors required for self-renewal and persistence of CD8+ memory T cells.57 These studies point to one approach to overcome the reduced CD8+ T cells in the BRAF-mutant microenvironment.
In this study, we further investigated the association of immune composition with the survival of patients with melanoma. CAFs and iTregs were shown to be associated with opposite outcomes in both BRAF-mutant and BRAF-wt melanoma. Interestingly, increased naive B cells were associated with a trend to improved survival (p=0.078) in patients with melanoma with BRAF mutations, but no association with survival was observed in the BRAF-wt samples. This finding was supported by another large-scale study (n=703), which investigated the individual B cell score in treatment-naive primary cutaneous melanomas.58 The association between tumor-infiltrating B cells and improved patient survival has been demonstrated in other tumor types, such as lung adenocarcinoma,59 hepatocellular carcinoma60 and ovarian cancer.61 The mechanistic role of B cells in antitumor surveillance and immunity remains largely unknown. One explanation could be the involvement of tertiary lymphoid structures (TLSs). TLSs are germinal centre-like follicle aggregates present in the tumor, with a B cell zone containing follicular dendritic cells and a T cell zone with mature dendritic cells.62 These TLSs are thought to orchestrate both local and systemic antitumor responses and are able to generate both effector and memory T cells and B cells.63 Naive B cells enter the TLSs follicle to initiate a germinal center reaction and differentiate into effector B cells, that is, memory B cells and plasma cells.64 Recent data demonstrated that B cells and TLSs promote immunotherapy response.65 The heterogeneous B cell subpopulations, including naive, follicular, memory plasmablasts and plasma B cells,66 and the variety of antibodies secreted (IgG1, IgG2, IgG3, IgG4 and IgA) may exert differential influences in the tumor microenvironment and need to be comprehensively investigated.
In summary, we identified increased CD4+ T cells and B cells but decreased CD8+ T cells in BRAF-mutant melanoma samples, especially in the metastatic setting. Further work is required to characterize the phenotypes, antigen specificities and biological functions of these immune populations, as well as the underlying mechanisms leading to differential enrichment in BRAF-mutant versus wild-type melanomas. Recently, Aoude et al67 reported an interesting association between CT—biomarker, mean of positive pixels and the tumor microenvironment in patients with melanoma. Non-invasive techniques, such as CT image parameters, are necessary for the development of prognostic or predictive biomarkers in late-stage patients. Further work is of interest to investigate the association between radiomics, such as CT image parameter, BRAF mutation status and the immune populations in the tumor microenvironment. We anticipate that such efforts will drive the rational design of improved therapeutic interventions and combinations—both immune and molecular targeted—for patients with melanoma.
In conclusion, using an orthogonal approach we showed that the immune context of BRAF mutant was distinct from that of BRAF-wt melanoma, especially in the metastatic melanoma setting. We observed significantly increased B cells and CD4 + T cells in BRAF-mutant versus wild-type disease. In contrast, metastatic BRAF-wt melanoma had significantly increased CD8 + T cells versus BRAF-mutant disease. Our results also showed an association of increased naive B cells and Th2 cells with improved overall survival in BRAF-mutant and BRAF-wt melanoma, respectively. This study characterizing cell type compositions provides an opportunity to better understand the tumor microenvironment of BRAF-mutant and BRAF-wt melanoma samples and to tailor management for patients with melanoma.
Data availability statement
Data are available upon reasonable request.
Ethics statements
Patient consent for publication
Ethics approval
This study involves human participants and was approved by Peter MacCallum Cancer Center HREC approval number 07/38. Participants gave informed consent to participate in the study before taking part.
Acknowledgments
The authors acknowledge the contribution of the Department of Health and Human Services acting through the Victorian Cancer Agency (The VCA project number TRP16020). The authors wish to thank Melanoma Research Victoria (MRV) and acknowledge the contributing MRV sites: Peter MacCallum Cancer Centre; Victorian Melanoma Service, Alfred Health; Olivia Newton-John Cancer Research Institute, Austin Health; Skin Health Institute; Border Medical Oncology Research Unit. Support from colleagues at Melanoma Institute Australia and Royal Prince Alfred Hospital are also gratefully acknowledged. Figure 1 was created with BioRender.com.
References
Supplementary materials
Supplementary Data
This web only file has been produced by the BMJ Publishing Group from an electronic file supplied by the author(s) and has not been edited for content.
Footnotes
Twitter @davidgyorki, @Twitter @ProfRScolyerMIA
MW and SZ contributed equally.
Contributors MJD and PJN designed the study. MW and SZ conducted experiments and performed the analysis. AP performed flow cytometry and analyzed the data. KT, DEG, GAM, RAS, GL, JSW, MCA, GA-Y, AW, SS and JAT curated the data. MW and SZ wrote the paper with input from all authors. All authors have read and agreed to the published version of the manuscript. PN acts as guarantor for the study.
Funding This study is funded by the Centre for Cancer Immunotherapy in Victoria Comprehensive Cancer Centre and receives support from the NHMRC program grant 1132373. RAS and GVL are supported by a National Health and Medical Research Council of Australia (NHMRC) Program Grant (APP1093017) and Practitioner Fellowships. GVL is supported by the University of Sydney Medical Foundation. MCA is supported by a National Health and Medical Research Council of Australia CJ Martin Early Career Fellowship (#1148680).
Competing interests RAS has received fees for professional services from Qbiotics, Novartis, Merck Sharp & Dohme, NeraCare, AMGEN, Bristol-Myers Squibb, Myriad Genetics, GlaxoSmithKline. GL has received professional consulting fees from Aduro Biotech, Amgen, Array Biopharma, Boehringer Ingelheim International GmbH, Bristol-Myers Squibb, Highlight Therapeutics SL, Merck Sharpe & Dohme, Novartis Pharma AG, Pierre Fabre, QBiotics Group, Regeneron Pharmaceuticals, SkylineDX BV (all unrelated to this work). PJN received research funding from Roche/Genentech, BMS, MSD, Allergan, Compugen, Crispr Therapeutics. The other authors declare no conflicts of interest.
Provenance and peer review Not commissioned; externally peer reviewed.
Supplemental material This content has been supplied by the author(s). It has not been vetted by BMJ Publishing Group Limited (BMJ) and may not have been peer-reviewed. Any opinions or recommendations discussed are solely those of the author(s) and are not endorsed by BMJ. BMJ disclaims all liability and responsibility arising from any reliance placed on the content. Where the content includes any translated material, BMJ does not warrant the accuracy and reliability of the translations (including but not limited to local regulations, clinical guidelines, terminology, drug names and drug dosages), and is not responsible for any error and/or omissions arising from translation and adaptation or otherwise.