Article Text

Abstract
Background Targeting the PD-1/PD-L1/L2 (programmed cell death protein 1/programmed cell death ligand 1/ligand 2) pathway combined with other immunosuppressive signalings, such as CD73/A2aR (A2a adenosine receptor) adenosine signaling, has emerged as a promising strategy for cancer treatment. The genetic characteristics of these immune checkpoints need to be further investigated in diffuse large B-cell lymphoma (DLBCL).
Methods We performed whole-exome sequencing/targeted deep sequencing to investigate the genetic characteristics of PD-1/PD-L1/L2 and CD73/A2aR. The immunosuppressive effect of these two pathways on the tumor microenvironment was evaluated via RNA sequencing. Single-cell RNA sequencing was further applied to investigate the dysfunctional CD8+ T cells. In addition, multiplex immunofluorescence staining was used to quantitatively assess the expression of dysfunctional CD8+ T cells in DLBCL.
Results SP140 was identified as a novel translocation partner for PD-L1, and a new inversion was detected between PD-L1 and PD-L2, both leading to the upregulation of PD-L1 expression. CD73 genetic mutations did not increase mRNA and protein expression. Patients with genetically altered CD73 tended to have a better overall survival than patients with wild-type CD73. Both PD-1/PD-L1 and CD73/A2aR signaling mediated the immunosuppressive microenvironment in DLBCL. The numbers of CD8+ T cells with PD-1 and A2aR expression were positively correlated with the number of dysfunctional CD8+ T cells (R2=0.974, p=0.013). According to the grades of dysfunctional CD8+ T cells we defined, grade 1 dysfunctional CD8+ T cells, with either PD-1+ or A2aR+, were significantly associated with poorer survival than grade 0 dysfunctional CD8+ T cells, with both PD-1− and A2aR−; and patients with grade 2 dysfunctional CD8+ T cells showed the worst clinical outcomes.
Conclusions This study describes the additional genetic basis of PD-L1 overexpression and characterizes certain genetic alterations of CD73/A2aR in DLBCL. The degree of T-cell dysfunction is correlated with clinical outcomes. Strategies that reverse T-cell dysfunction by inhibiting PD-1/PD-L1/L2, particularly in combination with CD73/A2aR, may show potential as effective therapeutic options for DLBCL.
- Hematologic Neoplasms
- Programmed Cell Death 1 Receptor
- Tumor Microenvironment
Data availability statement
Data are available in a public, open access repository. The DNA and RNA sequencing data have been submitted to the CNGB Sequence Archive of China National GeneBank DataBase (https://db.cngb.org/cnsa/) under the accession numbers CNP0001322 and CNP0001327, respectively. The gene expression data of three validation cohorts (GSE117556, GSE31312 and GSE147986) and single-cell RNA sequencing data (GSE182434) were downloaded from the NCBI GEO database (https://www.ncbi.nlm.nih.gov/geo/).
This is an open access article distributed in accordance with the Creative Commons Attribution Non Commercial (CC BY-NC 4.0) license, which permits others to distribute, remix, adapt, build upon this work non-commercially, and license their derivative works on different terms, provided the original work is properly cited, appropriate credit is given, any changes made indicated, and the use is non-commercial. See http://creativecommons.org/licenses/by-nc/4.0/.
Statistics from Altmetric.com
Key messages
What is already known on this topic
Targeting immunosuppressive pathways have emerged as promising strategies for cancer treatment. The genetic characteristics of PD-1/PD-L1/L2 (programmed cell death protein 1/programmed cell death ligand 1/ligand 2) and CD73/A2aR (A2a adenosine receptor) and the effect of these two signalings on dysfunctional CD8+ T cells need to be further investigated in diffuse large B-cell lymphoma (DLBCL).
What this study adds
Our study provided additional mechanisms of PD-L1 upregulation and characterized certain genetic alterations of CD73/A2aR in DLBCL. PD-1 combined with A2aR could define a subset of much more dysfunctional CD8+ T cells and was associated with inferior outcomes.
How this study might affect research, practice or policy
Targeting the PD-1/PD-L1 immunosuppressive pathway combined with CD73/A2aR inhibitors may provide additional clinical benefits in DLBCL.
Background
Diffuse large B-cell lymphoma (DLBCL) is the most common B-cell lymphoma. Approximately 60%–70% of patients are cured by rituximab plus anthracycline-based chemotherapy; the remaining 30%–40% of patients show relapsed or refractory DLBCL due to the highly aggressive and heterogeneous disease course.1 Hence, further understanding of the pathogenesis of DLBCL and development of new therapeutic strategies for DLBCL are necessary.
Immune checkpoint inhibitors that target PD-1/PD-L1 (programmed cell death protein 1/programmed cell death ligand 1) are effective against solid tumors and Hodgkin’s lymphoma (HL). Seven PD-1/PD-L1 inhibitors have been approved for treating HL, malignant melanoma and non-small-cell lung cancer.2–4 However, the therapeutic benefits of PD-1/PD-L1 inhibitors are limited to a small subset of patients with DLBCL. The objective response rate of nivolumab monotherapy was 36% for unselected relapsed/refractory DLBCL5 and ~10% for relapsed/refractory patients with DLBCL who were ineligible for autohematopoietic cell transplantation or who experienced failure with autohematopoietic cell transplantation, and those with infrequent 9p24.1 alterations.6 As immune checkpoint monotherapies rarely elicit effective or long-term responses, PD-1/PD-L1 inhibitors combined with other immune checkpoint inhibitors have emerged as promising strategies. The efficacy and safety of using PD-1/PD-L1 inhibitors concomitantly with different immune checkpoint inhibitors to increase the benefits of immunotherapy for DLBCL7 are being evaluated.
CD73/A2a adenosine receptor (A2aR)-mediated adenosine signaling is an important immunosuppressive pathway. High levels of extracellular adenosine are generated in hypoxic tumor microenvironments (TMEs), whereas normal microenvironments contain low adenosine levels.8 CD73, which is widely expressed in malignant cells and promotes adenosine production, is the rate-limiting enzyme in the process.9 Increased adenosine levels in the TME activate A2aR and dampen the immune response of cytotoxic T cells, macrophages, natural killer cells, and neutrophils.9 Targeting CD73/A2aR signaling restores CD8+ T-cell activity10 and enhances antitumor activity of anti-PD-1 and anti-CTLA-4 (cytotoxic T-lymphocyte-associated antigen-4) antibodies.11 12 We previously verified that CD73 expression in tumor cells and A2aR expression in tumor-infiltrating lymphocytes reduced survival,13 indicating that the CD73/A2aR axis was an additional immune escape mechanism in DLBCL. However, the genetic characteristics of CD73/A2aR, which are considered essential for understanding this immunosuppressive pathway, remain unclear.
Restoring the function of CD8+ T cells is the antitumor mechanism of checkpoint blockers. Cytotoxic T cells expressing PD-1 show a reduced ability to proliferate and produce effector cytokines; thus, PD-1 is a surrogate marker for T-cell dysfunction.14 15 However, the limited effect of anti-PD-1/PD-L1 antibodies in a majority of patients suggests that functional restoration by this pathway blockade was incomplete and defects in CD8+ T cells remained. CD8+ T cells in tumors usually express multiple checkpoints, leading to much more severe dysfunction.16 Here, we hypothesized A2aR contributes to acquiring a CD8+ T-cell dysfunctional phenotype.
In this study, we performed whole-exome sequencing (WES)/targeted deep sequencing (TDS) to investigate the genetic characteristics of PD-1/L1/L2 and CD73/A2aR in DLBCL. RNA sequencing was conducted to evaluate their immunosuppressive effect on TME. Multiplex immunofluorescence staining was also applied to quantitatively assess the expression of dysfunctional CD8+ T cells, and the associated clinical relevance was explored in patients with DLBCL.
Methods
Patient samples
Tumor biopsies of 188 patients with DLBCL were obtained from the Tianjin Medical University Cancer Institute and Hospital. Of these, 176 were taken at diagnosis and 12 were taken at relapse. Matching peripheral blood DNA samples were available for 42 patients. Formalin-fixed paraffin-embedded (FFPE) sections were also collected from another cohort of 109 primary patients with DLBCL. The study was approved by the Clinical Research Ethics Board of the Tianjin Medical University Cancer Institute and Hospital. Written informed consents were obtained.
DNA extraction and WES
DNA was extracted using the DNeasy Blood & Tissue Kit (Qiagen, Hilden, Germany). WES was performed on 42 tumor biopsies and matched germline DNA from peripheral blood using an Illumina HiSeq X10 sequencer (Illumina, San Diego, California, USA) (online supplemental methods).
Supplemental material
Targeted deep sequencing
We designed a custom panel of 307 genes (online supplemental table S1), comprising immune-related and other important genes in DLBCL. Targeted capture and sequencing were performed on 188 tumor specimens (42 of which were from the WES cohort used to improve capture efficiency) using an Illumina NovaSeq 6000 platform (Illumina). Single nucleotide variants were identified via MuTect V.1.1.4. Factera was used to detect structural variations (SVs) (online supplemental methods).
Supplemental material
Sanger sequencing
Sanger sequencing was performed to validate the identified genetic alterations and fusions. Specific PCR primers were designed using Primer3 (online supplemental tables S2 and S3). PCR amplifications were performed on an ABI 2720 thermocycler followed by Sanger sequencing on an ABI 3170 sequencer (Applied Biosystems, Foster City, California, USA).17 18
Fluorescence in situ hybridization (FISH)
PD-L1 break-apart rearrangement probes (Guangzhou Anbiping Medical Technology, Guangzhou, China) were used to analyze the PD-L1 locus. Treatment and probe hybridization were performed as previously described.19 Overlap of the probes into a fused or yellow signal was classified as normal. The rearrangement of PD-L1 was characterized by spatial separation of green and red probes. At least 100 nuclei were evaluated per sample, and alterations were called when a 20% threshold was exceeded for the number of nuclei.
RNA extraction, RNA sequencing, and quantitative real-time PCR (qPCR)
Total RNA with sufficient quantity and quality was extracted using the RNeasy Mini Kit (Qiagen) from fresh-frozen tumor tissues of 162 patients among the 188 DLBCL. Sequencing libraries were generated using the NEBNext Ultra RNA Library Prep Kit for Illumina. RNA sequencing was further conducted on an Illumina NovaSeq 6000 platform (Illumina). Detailed information on RNA sequencing and qPCR is provided in the online supplemental methods.
Single-cell RNA sequencing analysis
The processed dataset (GSE182434) of publicly available data for single-cell RNA sequencing was downloaded from the NCBI GEO database (https://www.ncbi.nlm.nih.gov/geo/).20 CD8+ T cells had been annotated in four DLBCL samples. We then used Seurat v3.1.221 to normalize and scale the expression matrices by function NormalizeData and ScaleData. The top 2000 most highly variable genes were selected for principal component analysis. The first 20 principle components were used with FindClusters function to generate different clusters. UMAP algorithm was applied to visualize cells in a two-dimensional space. Because PD-1 is our interest gene, we did not include it for the annotation of dysfunctional CD8+ T cell. Finally, five genes were used to annotate dysfunctional CD8+ T cells (CD8A, GZMB, CTLA4, LAG3, and TIGIT) according to previous publications.22–24
Multiplex immunofluorescence staining and grading of CD8+ T-cell dysfunction
FFPE sections from 109 patients with DLBCL were analyzed to evaluate the TME and dysfunctional CD8+ T cells by multiplexed immunofluorescence staining according to the Opal immunostaining protocol.25 Four-color staining was performed to visualize the expression of PD-1, A2aR, and CD8 and cell nuclei. The primary antibodies used are listed in online supplemental table S4. To precisely evaluate positive expression in cells,26 27 the absolute cell numbers stained by the markers were automatically assessed using a computer-assisted platform (PerkinElmer, Waltham, Massachusetts, USA), and the cell numbers per squared millimeter were calculated (online supplemental methods). PD-1 positivity (PD-1+) was defined as PD-1 expression on CD8+ T-cell membranes more than the median number of cells/mm2 (9 cells/mm2), and A2aR positivity (A2aR+) was defined as A2aR expression on CD8+ T-cell membranes >0 cells/mm2. Here, we defined either PD-1 or A2aR-positive expression on CD8+ T cells as dysfunctional CD8+ T cells. We further categorized dysfunctional CD8+ T cells into three grades based on the expression of PD-1 and A2aR: grade 0 dysfunctional CD8+ T cells were defined as CD8+ T cells with negative PD-1 and A2aR expression on the cell membrane, that is, PD-1−CD8+ T cells and A2aR−CD8+ T cells; grade 1 dysfunctional CD8+ T cells were defined as either PD-1+CD8+ T cells or A2aR+CD8+ T cells; and grade 2 dysfunctional CD8+ T cells were defined as PD-1+CD8+ T cells and A2aR+CD8+ T cells.
Statistical analysis
Associations between dysfunctional CD8+ T cells and clinical factors were evaluated using the χ2 test and Mann-Whitney U test. Progression-free survival (PFS) was defined as the time from the day of diagnosis to the day of disease progression, recurrence, death or the last follow-up. Overall survival (OS) was defined as the time from the day of diagnosis to the day of death or the last follow-up. The Kaplan-Meier method was used for the analysis of survival, and differences were assessed using the log-rank test. Statistical analyses were performed using SPSS 22.0. A two-tailed p<0.05 was considered statistically significant.
Results
WES of DLBCL
WES was performed on tumor biopsy specimens and matching peripheral blood DNA from 42 patients with DLBCL. The mean sequencing depth was 93×, and a mean of 96.74% of bases was covered to a depth of at least 20× (online supplemental table S5). A total of 26 178 non-silent mutations, including 21,084 missense, 736 non-sense, 683 splice site, 43 non-stop, 150 misstart, and 3563 insertion or deletion mutations were identified. The somatic non-silent mutation load per subject in DLBCL varied significantly (mean 145; range 49–239). Recurrent immune-related gene alterations were characterized (online supplemental table S6), including PD-1/L1/L2, CD73, and A2aR.
Copy number variations (CNVs) in the cohort were also investigated. A frequent copy number gain of 9p24.1, previously described with the upregulation of PD-L1/L2 in HL, was identified in three patients with DLBCL (3/42; 7%), two of which had the non-germinal center B cell-like (GCB) subtype. No CNVs affecting CD73 or A2aR were identified.
Genomic alterations of the PD-1/L1/L2 loci determined by TDS
TDS of a 307-gene panel, including PD-1, PD-L1/L2, CD73, and A2aR in a larger extension cohort (188 patients with DLBCL), indicated that the mean sequencing depth was 868×, and a mean of 98.96% for the target sequences covered (online supplemental table S7).
SP140 as a novel translocation partner of PD-L1
Studies conducted by our group and others identified several translocation partners for the PD-L1/L2 loci in DLBCL (online supplemental figure S1). We demonstrated a novel gene fusion involving the 3′ end of PD-L1 in sample DL242 by TDS (online supplemental figure S1). Genomic breakpoint coordinates were mapped to chr9:5467954 and chr2:231183400 (NCBI Build 36.1) falling within the 3′ untranslated region (UTR) of PD-L1 and the intergenic region downstream of SP140 (figure 1A,B). These were validated by Sanger sequencing using primers surrounding the fusion points between the two loci (figure 1A). Meanwhile, a FISH-based assay showed the break apart from the PD-L1 locus (figure 1C). qPCR demonstrated that PD-L1 expression was significantly upregulated due to PD-L1-SP140 genomic fusion in sample DL242 (figure 1E,F). Increased PD-L1 levels were further confirmed by immunohistochemistry (IHC) analysis (figure 1D).
Supplemental material
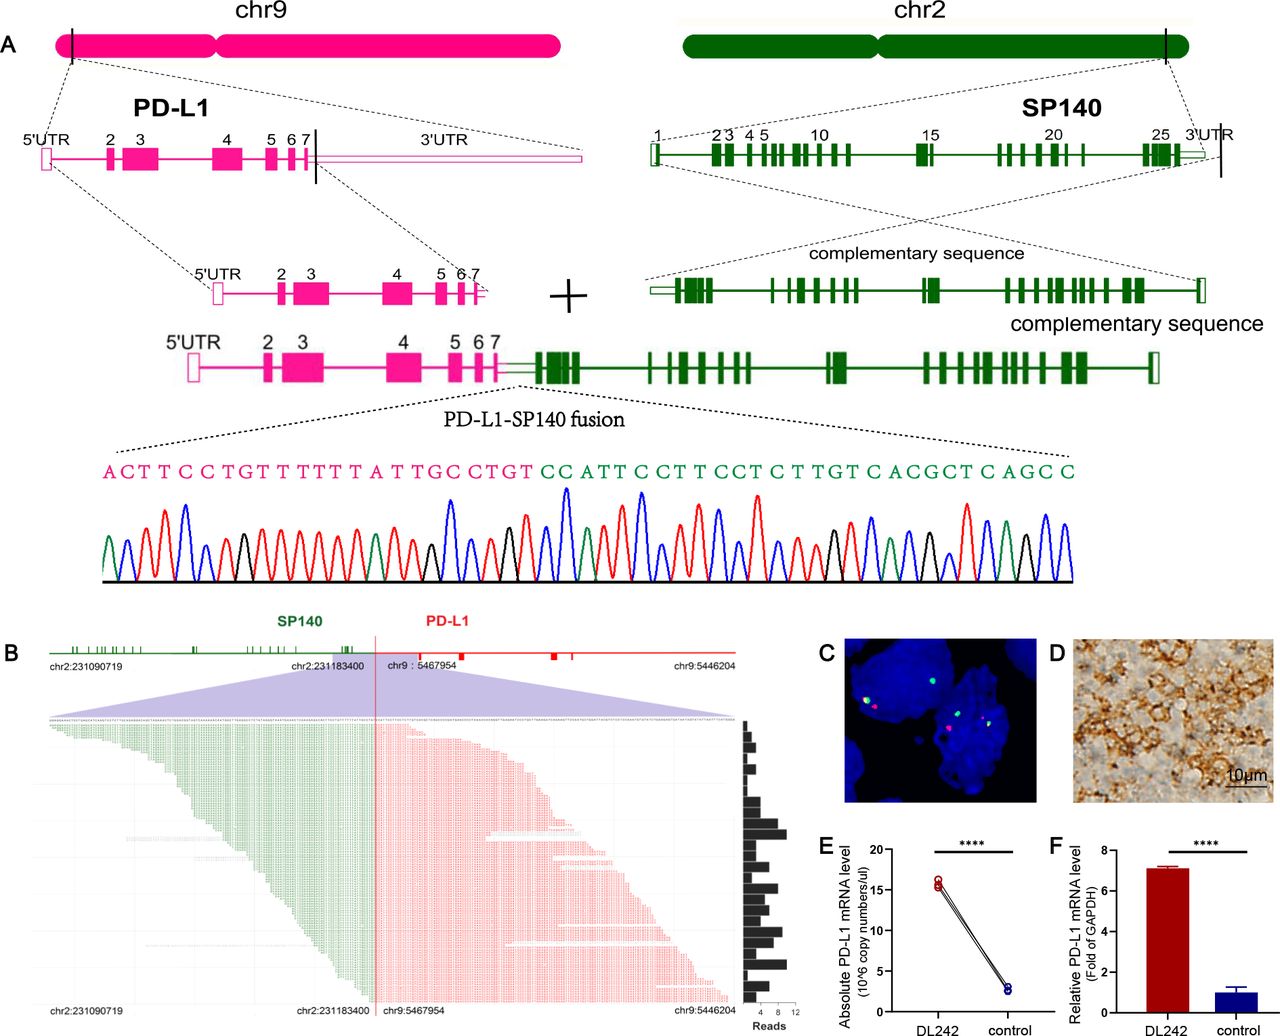
PD-L1-SP140 translocation in sample DL242. (A) Positions of the breakpoints at the two loci are indicated. Breakpoint-specific PCR and Sanger sequencing confirmed the targeting sequencing results. (B) PD-L1-SP140 fusion is supported by DNA reads. The chromosomal breakpoint is depicted by the red vertical line. Individual supporting reads are shown in the lower panel, with frequencies as a bar graph on the right. (C) FISH analysis of sample DL242 shows the PD-L1 break apart. (D) Positive expression of PD-L1 was confirmed by immunohistochemistry (captured at 400× magnification). (E, F) The absolute and relative qPCR approaches demonstrated the upregulated expression of PD-L1. Three samples of patients with lymphoproliferative diseases were used as a control. ****p<0.00001. FISH, fluorescence in situ hybridization; PD-L1, programmed cell death ligand 1; qPCR, quantitative real-time PCR; UTR, untranslated region.
PD-L1-PD-L2 inversion was another form of translocation in PD-L1/L2 loci
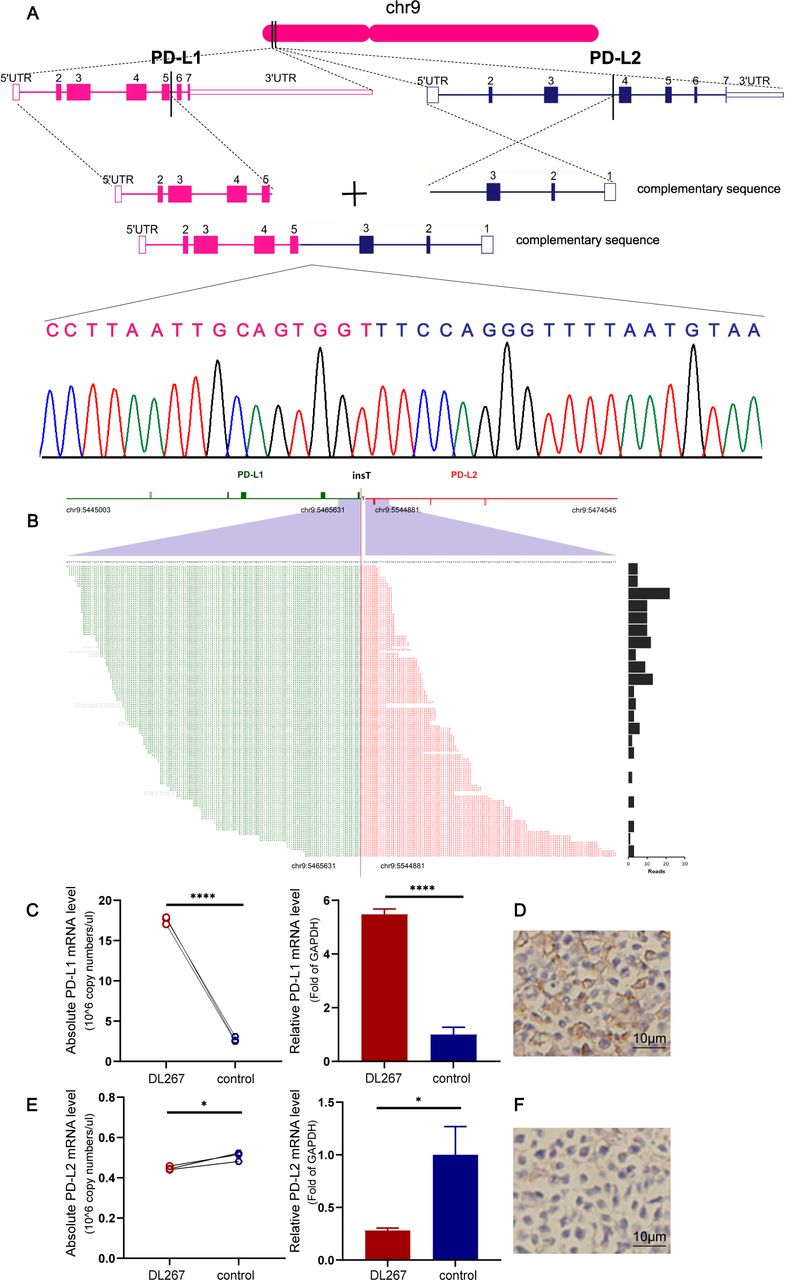
An in-frame PD-L1-PD-L2 inversion caused by the 3 portion of PD-L1 within intron 5 of PD-L1 fused with intron 3 of PD-L2 was detected in sample DL267. Sanger sequencing confirmed the detected chimeric genomes (figure 2A,B). A qPCR assay and IHC demonstrated increased PD-L1 expression in sample DL267 carrying the PD-L1-PD-L2 fusion (figure 2C,D). The chimeric transcript was predicted to generate a PD-L1 protein with a disrupted cytoplasmic tail, whereas the cytoplasmic domain had no known function. The receptor-binding site and transdomain of PD-L1 encoded by exons 3–5 were left intact.4 However, the expression of PD-L2 was downregulated (figure 2E,F).

PD-L1-PD-L2 inversion in sample DL267. (A) Positions of the breakpoints at the two loci are indicated. Breakpoint-specific PCR and Sanger sequencing confirm the targeting sequencing results. (B) PD-L1-PD-L2 inversion is supported by DNA reads. The chromosomal breakpoint is depicted by the red vertical line. Individual supporting reads are shown in the lower panel, with frequencies as a bar graph on the right. (C) Increased mRNA expression levels of PD-L1 were confirmed via qPCR. Three samples obtained from patients with lymphoproliferative diseases were used as a control. (D) DL267 was positive for PD-L1 expression by IHC. (E, F) PD-L2 expression at the mRNA and protein levels was confirmed via qPCR and IHC. The images were captured at a 400× magnification. *p<0.05, ****p<0.00001. IHC, immunohistochemistry; PD-L1/PD-L2, programmed cell death ligand 1/2; qPCR, quantitative real-time PCR; UTR, untranslated region.
Genetic mutations of PD-1/L1/L2 loci
We found frequent genetic mutations in PD-L1 and PD-L2. Two non-sense mutations and one missense mutation were identified in PD-L1 in three patients (online supplemental figure S2 and table S8). The two non-sense variants, p.Arg125* and p.Gln173*, were predicted to generate truncated proteins lacking the transmembrane domain. Another variant, c.302 T>G was located in the coding region of the immunoglobulin subtype with PD-L1 residue isoleucine 101 mutated to serine (p.Ile101Ser). In particular, the two p.Gln173* and p.Ile101Ser mutations, which were de novo mutations not reported according to the dbSNP, 1000G and COSMIC databases, were submitted to dbSNP (accession numbers: ss3983910112 (p.Gln173*) and ss3983910111 (p.Ile101Ser)). qPCR and IHC showed that PD-L1 expression was not upregulated in these altered samples (online supplemental figure S3). Two missense mutations of PD-L2 were identified in nine patients (online supplemental figure S4), of which eight harbored the same base substitution c.722 T>C, and another had the substitution c.644 C>G. Detailed information on the genetic mutations of PD-L2 is presented in online supplemental table S8. To confirm PD-L2 expression, qPCR and IHC were performed on tumor samples from five affected patients, from whom RNA and FFPE tissues were available, where increased PD-L2 expression was not reflected by mRNA and protein levels (online supplemental figure S5). Cytogenetic mutations that affected the PD-L1/L2 loci showed no difference in the distribution of subtypes. However, genetic translocations in the PD-L1/L2 loci were primarily associated with the non-GCB subtype of DLBCL (online supplemental figure S6). No alterations of PD-1 were identified.

Genetic alterations of CD73 and survival in DLBCL. (A) Distribution of CD73 alterations identified by targeted deep sequencing and validated via Sanger sequencing in genomic and protein maps showing the locations and variations of nucleotide/amino acid substitutions. The protein 3D structure of CD73 was obtained from the Missense 3D database. (B) Relative qPCR demonstrating the mRNA expression of CD73 in samples with CD73 genetic mutations. (C) CD73 expression in samples with CD73 genetic mutations was confirmed by IHC (captured at 400× magnification). (D) Overall survival of patients with altered and unaltered CD73 in six DLBCL studies according to the cBioPortal website. ***p<0.0001, ****p<0.00001. DLBCL, diffuse large B-cell lymphoma; qPCR, quantitative real-time PCR; SNP, single nucleotide polymorphism; UTR, untranslated region.

Immunosuppression of the TME mediated by the PD-1/PD-L1 and CD73/A2aR pathways in DLBCL. (A) Gene sets involved in negatively regulating the immune response were significantly enriched in the high PD-L1 expression group versus the low PD-L1 expression group by gene set enrichment analysis. (B) Gene sets involved in negatively regulating the immune response were significantly enriched in the high CD73 expression group versus the low CD73 expression group by gene set enrichment analysis. |NES| >1, p value <0.05, and FDR q value <0.05 were considered statistically significant. DLBCL, diffuse large B-cell lymphoma; DN, down-regulated genes; FDR, false discovery rate; NES, normalized enrichment score; PD-1, programmed cell death protein 1; PD-L1, programmed cell death ligand 1; TME: tumor microenvironment; UP, up-regulated genes.
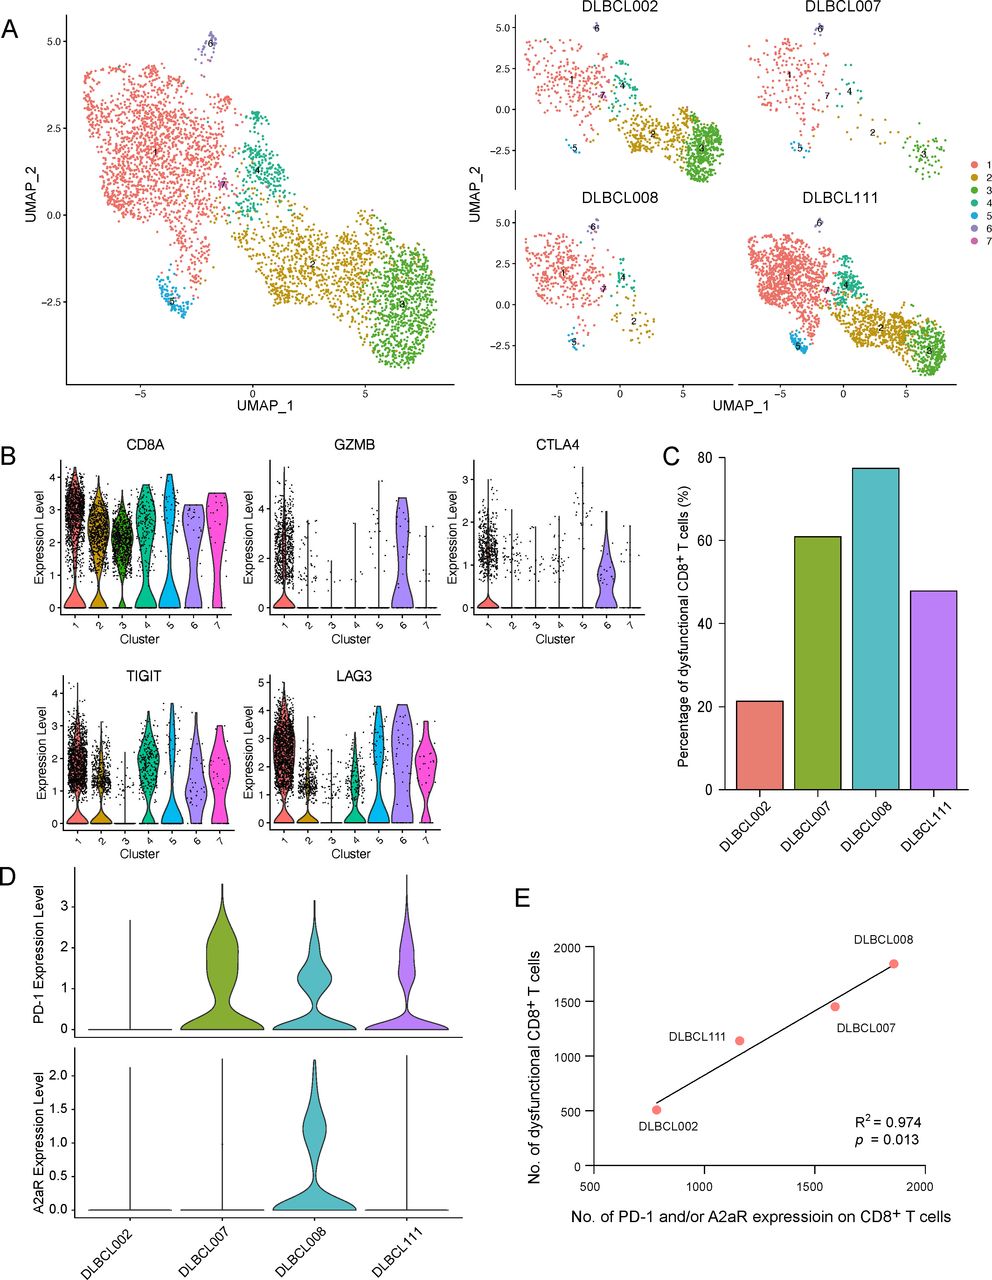
Correlation between PD-1 and A2aR expression and dysfunctional CD8+ T cells identified by single-cell RNA sequencing. (A) Total and separate UMAP plots of CD8+ T cell clusters from four diffuse large B-cell lymphoma (DLBCL) samples in the GSE182434 cohort. (B) The identification of dysfunctional CD8+ T cells according to the expression of five marker genes. (C) The percentage of dysfunctional CD8+ T cells in each patient. (D) The expression of PD-1 and A2aR on CD8+ T cells in each patient. (E) The correlation between PD-1 and A2aR expression on CD8+ T cells and dysfunctional CD8+ T cells by Spearman analysis. A2aR, A2a adenosine receptor; PD-1, programmed cell death protein 1.

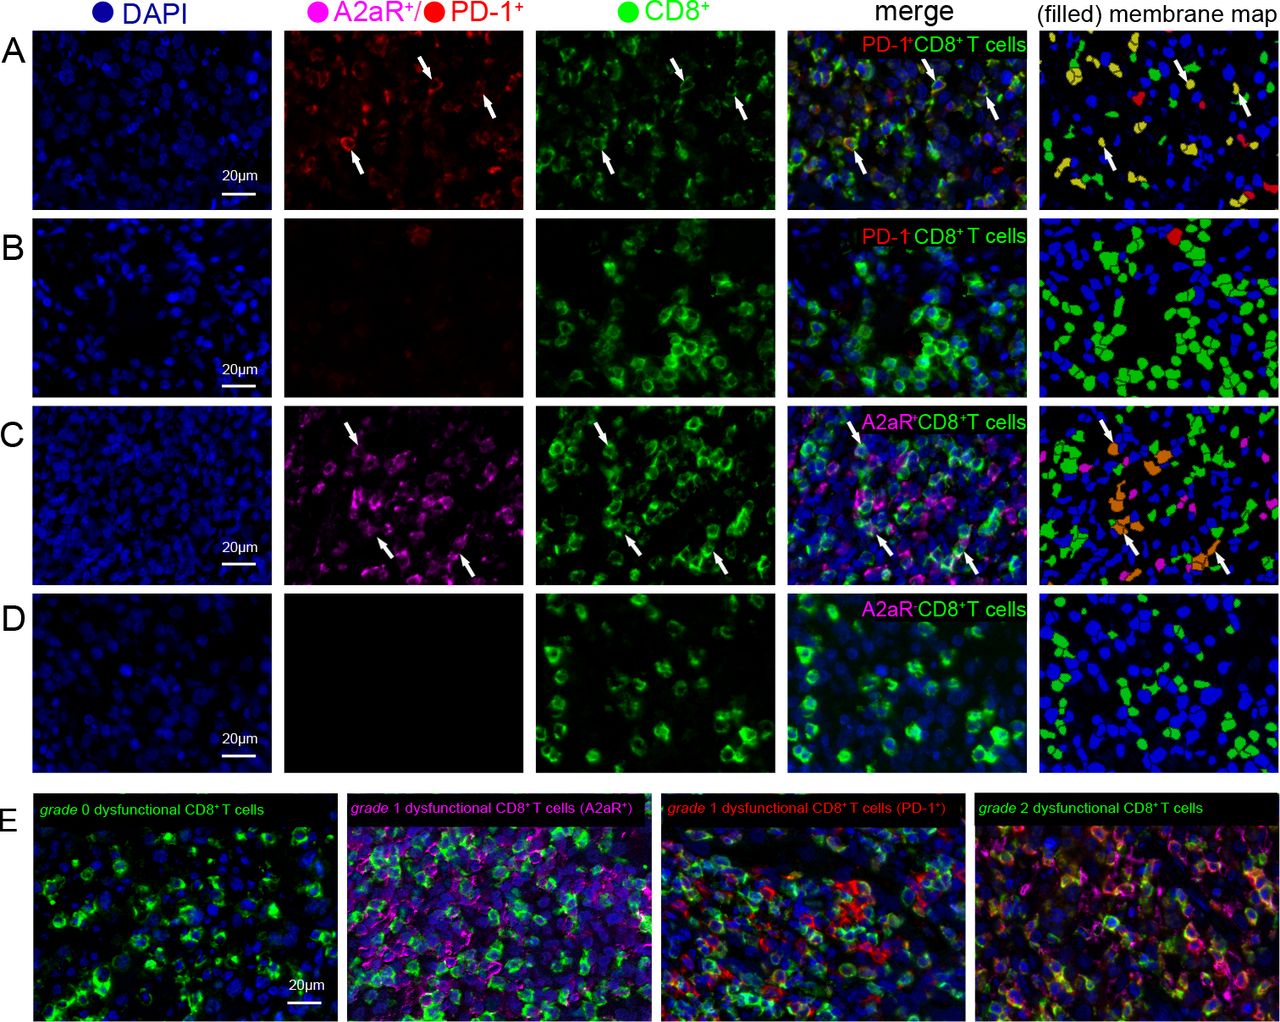
Expression of dysfunctional CD8+ T cells in DLBCL. (A) Representative multispectral images of dysfunctional CD8+ T cells (PD-1+CD8+ T cells) in DLBCL. The corresponding filled membrane map (rightmost panel) highlights interactions depicting PD-1+CD8+ T cells (PD-1+=red; CD8+=green; PD-1+CD8+=yellow). White arrows indicate the colocalization of PD-1 and CD8 in the same field. (B) Representative images of normal CD8+ T cells (PD-1−CD8+ T cells). The panels are as in (A). (C) Representative multispectral images of dysfunctional CD8+ T cells (A2aR+CD8+ T cells) in DLBCL. The corresponding filled membrane map (rightmost panel) highlights the interaction depicting A2aR+CD8+ T cells (A2aR+=purple; CD8+=green; A2aR+CD8+=orange). White arrows indicate the colocalization of A2aR and CD8 in the same field. (D) Representative images of normal CD8+ T cells (A2aR−CD8+ T cells). The panels are as in (C). (E) Representative images depicting the localization of the four different dysfunctional T-cell states according to PD-1 and A2aR expression on CD8+ T cells. Fields were imaged at 200× magnification. A2aR, A2a adenosine receptor; DLBCL, diffuse large B-cell lymphoma; PD-1, programmed cell death protein 1.
Genomic alterations of CD73/A2aR loci determined by TDS
In the TDS cohort, genetic mutations of CD73 were identified in four cases carrying two missense mutations (figure 3A; online supplemental table S8). One mutation, c.185C>T, encoded the substitution of a highly conserved alanine into valine at position 62 (p.A62V), which is located in the functional calcineurin-like phosphoesterase domain of CD73. Based on the dbSNP, 1000G, and COSMIC databases, this mutation was a novel mutation reported for the first time. The mutation site was submitted to dbSNP (accession no: ss2137544087). Another mutation, c.1136T>C, harbored by three patients was due to the substitution of methionine by tryptophan at position 379 (p.M379T). This base substitution was found in the dbSNP, 1000G, and COSMIC databases. IHC and qPCR showed no increased expression of CD73 mRNA or protein (figure 3B,C). Mutation c.185C>T was not detected due to a lack of available RNA and FFPE tissues. We further searched for mutants of CD73 via cBioPortal (https://www.cbioportal.org/), which contains four studies from published data28–31 and two from the Cancer Genome Atlas database. Survival analysis showed that patients with altered CD73 due to genetic mutations and deletions tended to have a better OS than those with unaltered CD73 (p=0.176; figure 3D), suggesting that altered CD73 may cause loss of CD73 function in DLBCL. However, in our cohort, the effect of mutated CD73 on patient survival was not assessed because the number of variants was too low for a meaningful survival comparison.
Two non-synonymous mutations were identified in A2aR (online supplemental figure S7, table S8). One, c.613C>T, was caused by the conversion of CGA (coding for arginine) to TGA (a premature stop codon) at protein position 205 (p.Arg205*), truncating A2aR. The other, 1076A>G, was caused by the alteration of AAT (a codon for asparagine) to AGT (a codon for serine) at position 359 in A2aR (p.N359S). A2aR expression was not upregulated in samples with A2aR mutations (online supplemental figure S8).
Immunosuppression of the TME mediated by the PD-1/PD-L1 and CD73/A2aR pathways
PD-1/PD-L1 and CD73/A2aR pathways promote immune escape through multiple mechanisms. Here, we examined the immunosuppressive effects of these two pathways based on the RNA level. The patients were divided into high- and low-expression groups based on the median PD-L1 expression. Gene set enrichment analysis was used to identify the biological and molecular processes related to immunosuppressive effect in the two groups. Interestingly, negative immune regulation gene sets, such as the negative regulation of immune response, the negative regulation of T-cell mediated immunity, and the negative regulation of cytokine production, were significantly enriched in the high PD-L1 expression group (figure 4A and online supplemental table S9). When the patients were divided into two groups according to the median CD73 expression, we observed similar results. Gene sets, including the negative regulation of immune system process and the negative regulation of cytokine production, were significantly enriched in the high CD73 expression group. In particular, exhausted CD8 T-cell associated genes were also markedly upregulated in this group (figure 4B and online supplemental table S9). These results were further validated in three public datasets, GSE117556 (n=928), GSE31312 (n=498), and GSE147986 (n=111) (online supplemental figures S9–11 and tables S10–12). Taken together, the findings demonstrated that both the PD-1/PD-L1 and CD73/A2aR pathways are actively involved in the negative regulation of immune response, leading to an immunosuppressive TME in DLBCL.
PD-1 and A2aR expression and dysfunctional CD8+ T cells identified by single-cell RNA sequencing
Next, we investigated the role of PD-1 and A2aR in the phenotype of dysfunctional CD8+ T cells at the single-cell RNA expression level using the publicly available dataset GSE182434.20 CD8+ T cells had been annotated in four DLBCL samples. We further classified CD8+ T cells into seven clusters by Seurat (figure 5A). According to the marker genes, cluster 1 was annotated as dysfunctional CD8+ T cells (figure 5B). We found that patient DLBCL002 without PD-1 and A2aR expression had rather low numbers of dysfunctional CD8+ T cells, whereas patients DLBCL007 and DLBCL111 with only PD-1 expression had moderate numbers of dysfunctional CD8+ T cells. Strikingly, patient DLBCL008 with both PD-1 and A2aR expression had a substantial number of dysfunctional CD8+ T cells (figure 5C,D). To observe the relationship between the expression of PD-1 and A2aR and dysfunctional CD8+ T cells more directly, we adjusted the number of total CD8+ T cells of four patients to the same level. We intuitively observed that the numbers of CD8+ T cells with PD-1 and/or A2aR expression were positively correlated with the number of dysfunctional CD8+ T cells (R2=0.974, p=0.013; figure 5E). The detailed numbers of different types of CD8+ T cells in each patient are listed in online supplemental table S13. Although PD-1 is the hallmark of dysfunctional CD8+ T cells, the findings strongly led us to speculate that A2aR also contributed to the acquisition of CD8+ T-cell dysfunction.
Dysfunctional CD8+ T cells and clinical relevance for patients with DLBCL
According to our hypothesis, we defined CD8+ T cells with either PD-1-positive or A2aR-positive expression as dysfunctional CD8+ T cells. To clarify the clinical significance of this type of CD8+ T cell, we performed multiplex immunofluorescence staining to accurately assess the expression of dysfunctional CD8+ T cells in another cohort of 109 patients with DLBCL. Among these patients, the median age was 57 years (range, 17–84 years), and 49.5% of patients were men. Forty-five patients (41.3%) were diagnosed with the GCB subtype, 56 (51.4%) were diagnosed with the non-GCB subtype, and 8 (7.3%) were unclassified. Nineteen (17.4%) had B symptoms, 52 (47.7%) were in stage III–IV, 52 (47.7%) had high lactate dehydrogenase levels, and 32 (29.4%) had an International Prognostic Index (IPI) score of >2. All patients were treated with an R-CHOP-like (rituximab plus cyclophosphamide, doxorubicin, vincristine and prednisone) treatment regimen. The numbers of CD8+ T cells with PD-1 and A2aR expression in all patients are listed in online supplemental table S14 and visualized in online supplemental figure S12 A,B. The percentage of dysfunctional CD8+ T cells (PD-1+CD8+ T cells) was 50.5% (55/109), and it was significantly associated with several clinicopathological parameters, including IPI score (p=0.004), clinical stage (p=0.027), and age (p=0.003) (online supplemental table S15). The percentage of dysfunctional CD8+ T cells (A2aR+CD8+ T cells) was 72.5 (79/109), and it was significantly associated with clinicopathological parameters, including IPI score (p=0.024) and clinical stage (p=0.002) (online supplemental table S16). Representative multispectral images of dysfunctional CD8+ T cells are presented in figure 6A–D.
Dysfunctional CD8+ T cells and clinical responses/survival for patients with DLBCL
Next, we analyzed the association of dysfunctional CD8+ T cells with clinical responses in DLBCL. We found that non-responders had significantly higher numbers of CD8+ T cells with PD-1 and A2aR expression than responders. The median numbers of CD8+ T cells showing PD-1 expression were 7 cells/mm2 and 18 cells/mm2 in the response and non-response groups, and the median numbers of CD8+ T cells showing A2aR expression were 2 cells/mm2 and 11 cells/mm2 in the two groups (p=0.020 and p=0.035, respectively; online supplemental figure S12C,D). Patients with dysfunctional CD8+ T cells (PD-1+CD8+ T cells) showed significantly shorter PFS and OS than those with normal CD8+ T cells (PD-1−CD8+ T cells) (p=0.010, p=0.017; figure 7A,B). Similarly, patients with dysfunctional CD8+ T cells (A2aR+CD8+ T cells) also experienced worse PFS and OS than those with normal CD8+ T cells (A2aR−CD8+ T cells) (p=0.026, p=0.012; figure 7C,D). The ratio of the numbers of CD8+ T cells with PD-1 and A2aR expression to the overall number of CD8+ T cells was further analyzed (10% was used as the cut-off value). Patients with high ratios of PD-1 and A2aR expression on CD8+ T cells experienced inferior outcomes compared with patients with low ratios (Figure 7E-H). We further explored the potency of different grades of CD8+ T-cell dysfunction in evaluating prognosis. According to our definition, the patients were divided into four groups with different dysfunctional statuses (figure 6E); there was a significant difference in survival, where patients with grade 2 dysfunctional CD8+ T cells experienced the worst PFS and OS compared with patients with grade 0 and grade 1 dysfunctional CD8+ T cells (p=0.027, p=0.030; figure 7I,J).

Survival analysis of patients with DLBCL. PFS and OS of patients with DLBCL based on dysfunctional CD8+ T cells (PD-1+CD8+ T cells) (A, B) and dysfunctional CD8+ T cells (A2aR+CD8+ T cells) (C, D); the ratio of the numbers of CD8+ T cells with PD-1 and A2aR expression to the number of overall CD8+ T cells (E–H); and different grades of dysfunctional CD8+ T cells (I, J). A two-tailed p<0.05 was considered statistically significant. DLBCL, diffuse large B-cell lymphoma; OS, overall survival; PD-1, programmed cell death protein 1; PFS, progression-free survival.
Discussion
Upregulated A2aR expression limits the response of cytotoxic T cells following anti-PD-1/PD-L1 treatment.32 The oral adenosine A2aR antagonist CPI-444, either alone or combined with atezolizumab, enhanced advanced solid cancer control in patients resistant to anti-PD-1/PD-L1 therapy.33 Monotherapies targeting CD73/A2aR or combined with PD-1/PD-L1 inhibitors (eg, NCT02403193 and NCT02655822) are being clinically tested for their ability to improve clinical benefits and to partially overcome resistance to PD-1/PD-L1 inhibitor therapy. Although targeting the adenosine pathway shows promising clinical activity, pathway-related genetic variants remain less understood and studied. Here, we first report CD73/A2aR genetic characteristics in DLBCL through high-throughput sequencing.
We identified two genetic mutations involving CD73 in four patients with DLBCL. CD73 expression was downregulated at both the mRNA and protein levels in samples carrying CD73 mutations. Six DLBCL studies in cBioPortal showed that patients with altered CD73 showed better OS than patients with unaltered CD73, suggesting that altered CD73 may lead to the loss-of-function of CD73 due to decreased protein expression or functionally altered proteins. Notably, the frequency of CD73 mutations is relatively low. It may be attributed to the loss-of-function mutations in CD73. The tumor is characterized by a hypoxic microenvironment, which leads to the upregulated expression of CD73 and further promotes the activation of the immunosuppressive CD73/A2aR axis. This environment is much more suitable for the growth of tumor cells. However, CD73 mutations reduced the expression of CD73 mRNA and protein, resulting in a loss-of-function of CD73. Tumor cells themselves usually do not actively cause CD73 mutations to change the primary favorable environment. A previous study demonstrated that certain A2aR nucleotide substitutions altered binding affinity and ligand dissociation rates34 and thereby enhanced or interfered with protein–protein interactions, which may have an important impact on signal transduction and targeted therapy. Therefore, it is vital to determine the genetic landscape of CD73/A2aR, although the exact effects of the genetic mutations we identified on protein structure and function and related signaling pathways need to be further investigated.
PD-L1/L2 deregulation in HL and other large B-cell lymphoma subtypes is due to the elevation of PD-L1/L2 expression via gene amplification and the utilization of an ectopic promoter/regulatory element by translocation.35–37 PD-L1 3′-UTR disruption provides an additional genetic mechanism for the upregulation of PD-L1 expression.38 As PD-L1 has a number of AU-rich elements and potential microRNA-binding sites, such as those for miR-34 and miR-200 in its long 3′-UTR,39 40 the translocation involved in this region disrupts AU-rich-element-mediated mRNA decay or microRNA-mediated translational repression, hence leading to the elevation of PD-L1 expression. We previously clarified some translocation partners of the PD-L1/L2 locus, in which the breakpoint locations were frequently located at the 3′-UTR of PD-L1/L2.41 In this study, SP140 was identified as a novel translocation partner of PD-L1 with a breakpoint at the 3′-UTR of PD-L1. Another translocation pattern we identified was involved in the inversion between PD-L1 and PD-L2, also resulting in the upregulated PD-L1 expression via an unknown mechanism. We also identified three genetic mutations of PD-L1; however, these genotype variants did not result in the upregulation of PD-L1. It should be noted that increased PD-L1 expression in DLBCL is often driven by SVs in the chromosomal region containing the PD-L1/L2 loci or within the 3′-UTR of PD-L1.42 When a mutation is located in the promoter region or in a regulatory region, it can likewise influence the transcription and activation of the PD-L1 gene. The genetic mutations of PD-L1 identified in our study were located in the exons of PD-L1, which may play a role by affecting immunoglobulin function and the transmembrane effect of PD-L1, thereby influencing the antitumor immune response.
The antitumor immune response involves the removal of tumor cells by CD8+ T cells. Activation of immunosuppressive pathways shifts activated CD8+ cytotoxic T cells toward a dysfunctional state in the TME. In this study, we defined three degrees of T-cell dysfunction based on the expression of PD-1 and A2aR. Grade 1 dysfunctional CD8+ T cells, with either PD-1+ or A2aR+, were significantly associated with poor clinical outcomes, whereas patients with grade 2 dysfunctional CD8+ T cells displayed the worst survival than those with grade 0 and grade 1 dysfunctional CD8+ T cells. Here, we do not refer to the coexpression of multiple immune checkpoints on T cells but emphasize the cooperative effect of CD8+ T-cell subpopulations expressing distinct inhibitory checkpoint molecules. Evidently, CD8+ T cells express multiple checkpoints, such as TIM-3, LAG-3, and TIGIT, wherein the level of checkpoint expression probably correlates with the degree of T-cell dysfunction. Thus, the grades of dysfunctional CD8+ T cells could be extended to as follows: grade 0 dysfunctional CD8+ T cells, defined as CD8+ T cells expressing non-immune checkpoint receptors; grade 1 dysfunctional CD8+ T cells, defined as CD8+ T cells positively expressing any one immune checkpoint receptor; grade 2 dysfunctional CD8+ T cells, defined as CD8+ T cells positively expressing any two immune checkpoint receptors; and grade 3 dysfunctional CD8+ T cells, defined as CD8+ T cells expressing at least three immune checkpoint receptors. Anti-PD-1 treatment alone only rescued fewer dysfunctional T cells,43 and blocking this single immune checkpoint was ineffective in practice. Simultaneously blocking several inhibitory receptors, including PD-1 and A2aR, and other checkpoints may be promising combination strategies.
In conclusion, our study provided additional mechanisms of PD-L1 upregulation and characterized certain genetic alterations of CD73/A2aR in DLBCL; however, further detailed mechanistic exploration is needed. PD-1 combined with A2aR could define a subset of much more dysfunctional CD8+ T cells and was associated with inferior outcomes. Targeting the PD-1/PD-L1 immunosuppressive pathway combined with CD73/A2aR inhibitors may provide additional clinical benefits and partly overcome primary and secondary resistance to PD-1/PD-L1 blockade. Clinical data presently being accumulated may support this hypothesis.
Data availability statement
Data are available in a public, open access repository. The DNA and RNA sequencing data have been submitted to the CNGB Sequence Archive of China National GeneBank DataBase (https://db.cngb.org/cnsa/) under the accession numbers CNP0001322 and CNP0001327, respectively. The gene expression data of three validation cohorts (GSE117556, GSE31312 and GSE147986) and single-cell RNA sequencing data (GSE182434) were downloaded from the NCBI GEO database (https://www.ncbi.nlm.nih.gov/geo/).
Ethics statements
Patient consent for publication
Ethics approval
This study involves human participants and was approved by the Tianjin Medical University Cancer Institute and Hospital. Participants gave informed consent to participate in the study before taking part.
Acknowledgments
We thank the Cancer Biobank of Tianjin Medical University Cancer Institute and Hospital for providing archived tissues. We thank Dr Peng Wu from the Institute of Hematology and Blood Diseases Hospital, Chinese Academy of Medical Sciences and Peking Union Medical College for aiding in protein structure analysis. We also thank the Singleron Biotechnologies for their help with the single-cell RNA sequencing analysis.
References
Supplementary materials
Supplementary Data
This web only file has been produced by the BMJ Publishing Group from an electronic file supplied by the author(s) and has not been edited for content.
Footnotes
TZ and HL contributed equally.
Contributors XW conceived and designed the study; XW and HZ supervised all aspects of the research project and interpreted the data; TZ and HL performed the research and statistical and bioinformatics analyses; TZ performed the multiplex immunofluorescence staining; HL performed the Sanger sequencing, quantitative PCR, fluorescence in situ hybridization, and immunohistochemical analyses; LJ performed the multiplex immunofluorescence analysis; ZZ performed the bioinformatics analysis; JH, LL, LQ, ZQ, and SZ collected the samples and clinical information; BM and WG reviewed the diagnosis of diffuse large B-cell lymphoma; XW, HZ and XR provided the clinical samples and material support; TZ wrote the manuscript and finalized the figures; and XW and HZ reviewed the manuscript. All authors read and approved the final version of the manuscript. XW and HZ are responsible for the overall content as guarantor.
Funding This study was supported by the Natural Science Foundation of Tianjin (grant nos 19JCYBJC26500 and 18JCZDJC45100), the National Natural Science Foundation of China (grant nos 81770213 and 81670184), National Key New Drug Creation Special Programs (grant nos 2017ZX09304-021 and 2018ZX09201015), Clinical Oncology Research Fund of CSCO (grant no Y-XD2019-162), Projects of the Tianjin Municipal Health Bureau (grant no 15KG145), National Human Genetic Resources Sharing Service Platform (grant no 2005DKA21300) and Cancer Biobank of Tianjin Medical University Cancer Institute and Hospital.
Competing interests None declared.
Provenance and peer review Not commissioned; externally peer reviewed.
Supplemental material This content has been supplied by the author(s). It has not been vetted by BMJ Publishing Group Limited (BMJ) and may not have been peer-reviewed. Any opinions or recommendations discussed are solely those of the author(s) and are not endorsed by BMJ. BMJ disclaims all liability and responsibility arising from any reliance placed on the content. Where the content includes any translated material, BMJ does not warrant the accuracy and reliability of the translations (including but not limited to local regulations, clinical guidelines, terminology, drug names and drug dosages), and is not responsible for any error and/or omissions arising from translation and adaptation or otherwise.