Article Text

Abstract
Background Immune checkpoint inhibitors (ICIs) targeting the programmed cell death 1/programmed death-ligand 1 axis have transformed the management of advanced non-small cell lung cancer (NSCLC). However, many patients do not benefit from this type of treatment, and thus several molecular biomarkers of benefit have been explored. The value of somatic copy number alterations (SCNAs) burden remains elusive.
Patients and methods We assembled a cohort of 109 patients with NSCLC treated with ICIs and available tumor samples. We performed shallow whole-genome sequencing on 89 patients to determine genome-wide SCNAs and targeted gene expression analysis on 63 patients to study immune infiltration. We analyzed SCNAs burden in different ways (ie, the fraction of the genome altered or number of events) and studied their association with ICIs benefit based on survival analysis. We correlated SCNAs burden and immune infiltration on 35 patients of our cohort and on patients with lung adenocarcinoma from The Cancer Genome Atlas (TCGA).
Results High SCNAs burden, computed in diverse ways, is negatively associated with ICIs progression-free survival (PFS), with the fraction of the genome altered (FGA) by arm and chromosome events showing the strongest association with PFS (p=0.002) (n=77). Nevertheless, we found differences in SCNAs across some clinicopathological features (sample site origin). A multivariate analysis adjusted for relevant characteristics showed that the FGA of arm and chromosome alterations was strongly associated with PFS (HR=2.21, p=3.3 x 10⁻⁵). Finally, we confirmed that SCNAs burden negatively correlates with tumor immune infiltration (n=35), although this correlation was not found for the males studied. Similar results were observed in the TCGA cohort.
Conclusions SCNAs burden is a potential biomarker of benefit to ICIs in patients with NSCLC, although there appear to be some nuances worth consideration. Further studies will be needed to establish its role as a biomarker of benefit to ICIs.
- lung neoplasms
- tumor biomarkers
- immunotherapy
Data availability statement
All data relevant to the study are included in the article or uploaded as supplementary information. SCNAs and gene expression data will be available upon request.
This is an open access article distributed in accordance with the Creative Commons Attribution Non Commercial (CC BY-NC 4.0) license, which permits others to distribute, remix, adapt, build upon this work non-commercially, and license their derivative works on different terms, provided the original work is properly cited, appropriate credit is given, any changes made indicated, and the use is non-commercial. See http://creativecommons.org/licenses/by-nc/4.0/.
Statistics from Altmetric.com
Background
Immune checkpoint inhibitors (ICIs) targeting the programmed cell death 1 (PD-1)/programmed death-ligand 1 (PD-L1) axis have transformed the treatment landscape of non-small cell lung cancer (NSCLC) and, as a result, have been implemented as standard of care. Even though ICIs have shown overall superior clinical efficacy over traditional chemotherapy, many patients do not benefit from this type of immunotherapy.1–4 Thus, different clinical and molecular characteristics have been studied as determinants of response and proposed as biomarkers.
Although PD-L1 determination is an approved biomarker for treatment selection,5 it has its limitations. Tumor mutation burden (TMB), recently approved as a biomarker, has also been associated with response6–8 and long-term benefit of ICIs9 in NSCLC, but it is also an imperfect biomarker. Both biomarkers have been investigated in NSCLC or in pan-cancer studies,10–12 nevertheless, other factors are likely to influence ICIs response.
A much less explored molecular biomarker of benefit to ICIs is the somatic copy number alterations (SCNAs) burden -in other words, the extent of the genome that has gone through alterations in its copy number. First described in melanoma, two coetaneous studies reported that high levels of aneuploidy (alterations encompassing whole arms or whole chromosomes)13 or the overall copy number loss,14 respectively, were associated with decreased ICIs benefit. Both studies inferred SCNAs from whole-exome sequencing (WES). Later, high SCNAs burden was associated with decreased benefit in NSCLC9 and gastrointestinal cancer,15 also when relying on WES data. The negative effect of aneuploidy or high SCNAs burden on the ICIs benefit has been partially attributed to its negative correlation with tumor immune infiltration, as described from RNA sequencing (RNA-seq) data of The Cancer Genome Atlas (TCGA) Consortium13 or from targeted RNA profiling (NanoString) in melanoma and NSCLC.9 14
Despite these studies, SCNAs burden has drawn little attention, particularly in NSCLC. This might be partially explained by the fact that gene-panel sequencing (the most common genetic testing in oncology) may not provide an accurate genome-wide landscape of the SCNAs. Also, some of the few landmark studies in NSCLC, which generated WES, solely reported mutations and TMB.6 8 Therefore, to elucidate the utility of SCNAs determination as a biomarker of ICIs benefit in NSCLC, we assembled a large cohort of patients treated with ICIs and employed shallow whole-genome sequencing (sWGS) (a cost-effective technique also known as low-pass WGS, that has been shown to be a robust approach for SCNAs determination from formalin-fixed paraffin-embedded (FFPE) samples) to infer genome-wide SCNAs.16–18 We then systematically explored different characteristics of the SCNAs profiles (ie, clonality or size of the copy number alterations (CNAs) events) and related them to ICIs benefit and to different clinicopathological characteristics (ie, sex, sample tissue origin). Additionally, we obtained the transcription profile of immune-related genes using an RNA-targeted panel (NanoString). Finally, we integrated genomic and transcriptomic data to study their interplay.
Methodology
Patient cohort
All patients included in our cohort were diagnosed with advanced NSCLC and treated at the Vall d’Hebron Hospital. Patients’ ICIs treatment initiation occurred between January 2013 and January 2020; the patients retrospectively selected based on their treatment (had to be treated with ICIs) and tissue surplus availability for additional molecular testing. The study methodologies conformed to the standards set by the Declaration of Helsinki. Detailed clinical information regarding the cohort and each patient can be found in online supplemental tables S1 and S2.
Supplemental material
Supplemental material
Data were retrieved from digital clinical records of the patients selected by type of treatment. Patients’ characteristics, such as age, sex, smoking history, histology, metastases location (bone, liver, and central nervous system) prior to ICIs, were recorded.
sWGS
sWGS, also known as low-pass whole-genome sequencing, was performed on DNA extracted from FFPE tumor samples (Maxwell 16 FFPE Plus LEV DNA Purification Kit, Promega, Madison, Wisconsin, USA). In addition, genomic DNA was extracted from whole blood using the DNeasy blood and tissue kit (Qiagen) to be used as reference.
Libraries from FFPE tumor tissue and normal peripheral blood DNA were constructed using the KAPA hyper kit (Roche) and sequenced on a NovaSeq 6000 platform (Illumina, paired end, 2×150) at the National Genomic Analysis Center (CNAG, Barcelona, Spain) to a goal of 6× mean target coverage.
Sequence alignment
Sequencing reads were aligned to the GRCh38 reference genome using the mem algorithm of the BWA V.0.7.17 software. Duplicates were marked using the MarkDuplicates tool from Picard V.2.21.2.
SCNAs calling and processing
BAM files were transformed into WIG using HMMcopy’s19 readCounter with the window parameter set to 500,000 and the quality set to 20. Next, ichorCNA20 was used to call SCNAs, with the following parameters: ploidy: 2, 3, normal: 0.5, 0.6, 0.7, 0.8, 0.9, maxCN: 5, includeHOMD: False, chrTrain: 1:22, estimateNormal: True, estimatePloidy: True, estimateScPrevalence: True, scStates: 1, 3, txnE: 0.9999, txnStrength: 10000, maxFracCNASubclone: 1, chrs: 1:22, chrTrain: 1:22. A custom panel of normals built from 12 blood samples served as a reference.
An amplitude filter of ±0.1 was applied to the candidate SCNAs identified. Thus, we considered to be gained those regions identified as gained or amplified by ichorCNA and whose amplitude was greater than 0.1, while we considered to be deleted those regions called as deleted by ichorCNA and whose amplitude was lower than –0.1.
SCNAs were classified as clonal or subclonal based on the subclone status of each alteration reported by ichorCNA.
SCNAs were divided into chromosome, arm or focal, as based on the following criteria: SCNAs were considered to be focal when involving a region smaller than 50% of a chromosome arm. SCNAs affecting more than 50% of a single chromosome arm were classified as arm-level alterations. Finally, those affecting both chromosome arms and encompassing at least 50% of the entire chromosome were considered to be chromosome-level alterations.
SCNAs burden calculation
SCNAs burden was computed as the number of events or as the fraction of the genome altered for each of the SCNA categories specified. The number of events was computed as the number of alterations and deletions in a sample. The fraction of the genome altered was computed as the sum of the sizes of these alterations.
Purity filtering
The purity of most samples was assessed by the pathologist, and only those where it was above 20% were sent for sequencing. Additionally, the tumor fraction of all samples was estimated using ichorCNA. Those lower than 10% were discarded.
PFS calculation
Progression-free survival (PFS) was computed as the number of days between the start of the first line of ICIs administered to the patient and the end of the treatment line. When treatment was terminated due to progression, the event (progression) was considered to have occurred. When treatment termination was due to other reasons (eg, toxicity or protocol), the patient was censored at the time of ICIs termination.
Association between SCNAs in individual segments and PFS
ichorCNA was run using a segment size of 0.5 Mb as described above. Thus, the SCNA status of each of these segments was retrieved. Next, we iterated these segments and for each of them, samples were divided into three categories based on whether they had it gained, deleted or unaltered. Using log-rank tests, the effect of carrying alterations in the segment was then assessed by comparing separately the PFS of unaltered samples to samples with gains and deletions. Additionally, in order to study the association between carrying alterations in each of these 0.5 Mb segments and the overall SCNAs burden of the patients, the fraction of the genome altered (FGA) arm + chromosome burden (FGAa+c) of patients carrying no alterations in a given segment was compared with those carrying gains and deletions separately using Kruskal-Wallis H-tests.
Associations between SCNAs in specific genes and PFS
A list of genes related to antigen presentation and other relevant pathways was downloaded.21 For each gene in the list, patients were divided based on their SCNA status (gained, deleted or unaltered). The PFS of these three groups of patients was compared using log-rank tests. Additionally, the median PFS of each group was calculated. Genes were selected when patients with deletions or gains presented statistically significant PFS differences in comparison to patients with no alterations and, at the same time, the median PFS of patients with no alterations was between that of patients with gains and that with deletions.
Survival models
Univariate and multivariate Cox proportional-hazards models were built using the lifelines Python library (doi:10.5281/zenodo.4579431) with the step-size parameter set to 0.5. Categorical variables were transformed into dummy variables, and numerical variables were standardized.
Kaplan-Meier curves were produced using the lifelines Python library and log-rank tests to compare curves were performed using the lifelines.statistics logrank_test function.
Cross-validation
Cross-validation was applied in those Cox-proportional hazards models used to identify the SCNAs burden that best associated with ICIs benefit and to study the association between FGAa+c and ICIs benefit when stratifying patients by relevant clinical features.
To do so, a threefold cross-validation was performed using the k_fold_cross_validation function of the lifelines Python library. This process was repeated 10 times for each feature, using seeds from 0 to 9 defined using the seed function of the random Python library. Thus, threefold cross-validation performed 10 times led to 30 Cox proportional-hazards survival models per feature. For each of these models, the Harrell’s Concordance Index was retrieved and the mean concordance per feature was computed.
Clustering of SCNA profiles
The SCNA status was obtained for each of the 0.5 Mb segments that the genome was divided into when running ichorCNA as described above. Next a matrix was built with sorted segments noted in the rows, patients as columns and the SCNA status noted in the cells. Deleted segments were assigned a 1, unaltered segments a 2 and gained or amplified segments a 3. Next, the patients were clustered by means of the cluster.hierarchy.linkage function from the SciPy22 Python library. The parameter method was set to ward. All other parameters were left as default. Only clusters with a minimum of five patients were considered in the survival analysis.
NanoString normalization and quality controls
Gene expression by NanoString was carried out, as previously described by Frigola et al.9 In fact, 21 samples from this study were already included in the Frigola et al publication.9
NanoString outputs were normalized following the NanoString Gene Expression Data Analysis Guidelines. During this process, the housekeeping normalization score and the positive normalization score were used as quality measures. Samples with extreme normalization scores (>10 or <0.1 and >3 or <0.3 for the housekeeping and the positive normalization scores, respectively) were thereby discarded.
The number of housekeeping genes below the limit of detection was used as an additional quality filter. Thus, samples with more than two housekeeping genes below the highest negative probe expression value were discarded as well.
Expression signatures computation
Gene expression signatures, characteristic of different immune cell populations, were obtained from Danaher et al.23 T cell-inflamed gene expression profiles (GEP) signature was obtained from Ayers et al .24
The value of each of these signatures per sample was computed as the geometric mean of the expression values of all genes included in the signature. Next, the values of all samples for each signature were standardized.
Clustering of expression signatures profiles
A matrix was built with patients noted in the columns and immune cell type expression signatures noted in the rows. Next, the patients were clustered using the cluster.hierarchy.linkage function from the SciPy22 Python library. The parameter method was set to ward. All other parameters were left as default.
Association between expression signatures and patients’ PFS
For each expression signature, patients were stratified into tertiles. Kaplan-Meier curves were drawn up and the PFS’s of the first and the last tertile were compared using log-rank tests.
Correlation between expression signatures and SCNAs burden
For those patients for which both sWGS and NanoString data were available, the correlation between FGAa+c and the abundance of different expression signatures was assessed using Spearman’s rank correlations.
TCGA data obtention and analysis
RNA-seq, immune-related gene expression signatures (Bindea25 and CIBERSORT26) and ABSOLUTE aneuploidy27 scores were downloaded from Thorsson et al.28 Danaher immune cell types signatures23 were calculated from the RNA-seq data, and Spearman's rank correlations were used to assess their correlations in lung adenocarcinoma.
Multiple test correction
Multiple test correction was performed using the multiple tests function from the statsmodels Python library. Method was set to fdr_bh. The default option was used for all other parameters.
Results
Cohort description
We assembled a cohort of 109 patients with advanced NSCLC treated with ICIs and mature follow-up. Characteristics of the cohort are shown in online supplemental tables S1 and S2. The overall median PFS in our cohort was 162 days (5.4 months). Seventy-seven patients (70.6%) had adenocarcinoma histology, 96 (88.1%) were current or former smokers and 71 (65.1%) were males. Ninety-three patients (85.3%) were treated with ICIs as monotherapy. Forty (36.7%) and 50 (45.9%) patients were treated with ICIs in their first or second line of therapy, respectively, whereas 19 (17.4%) patients were treated in ≥3 line.
We performed sWGS on 91 tumor samples (mean coverage 6.52, SD 1.36) from 89 patients (2 patients had two samples in two different sites) and obtained RNA-targeted NanoString transcription profiles of 63 tumor samples (online supplemental table S2). Twelve sWGS samples were excluded for quality reasons including low purity and three NanoStrings failed the quality controls (see methodology). Forty-three patients were present in both cohorts and of these 43 patients, 35 remained after appropriate quality controls.
Chromosomal alterations panorama in our cohort
On average, the analysis of unique samples from 77 patients with sWGS data revealed that patients in our cohort had 44.9% (min: 2.3%, max: 96.4%, SD: 18.8%) of their genomes affected by SCNAs (24.3% by gains and 20.7% by deletions). As expected, differences across samples were observed. To explore these differences in more detail, we divided the genome into 0.5 Mb segments, and performed an unsupervised hierarchical clustering, based on their alteration status and annotated the most relevant clinical features (sex, smoking, sample site origin, histology) (figure 1A).
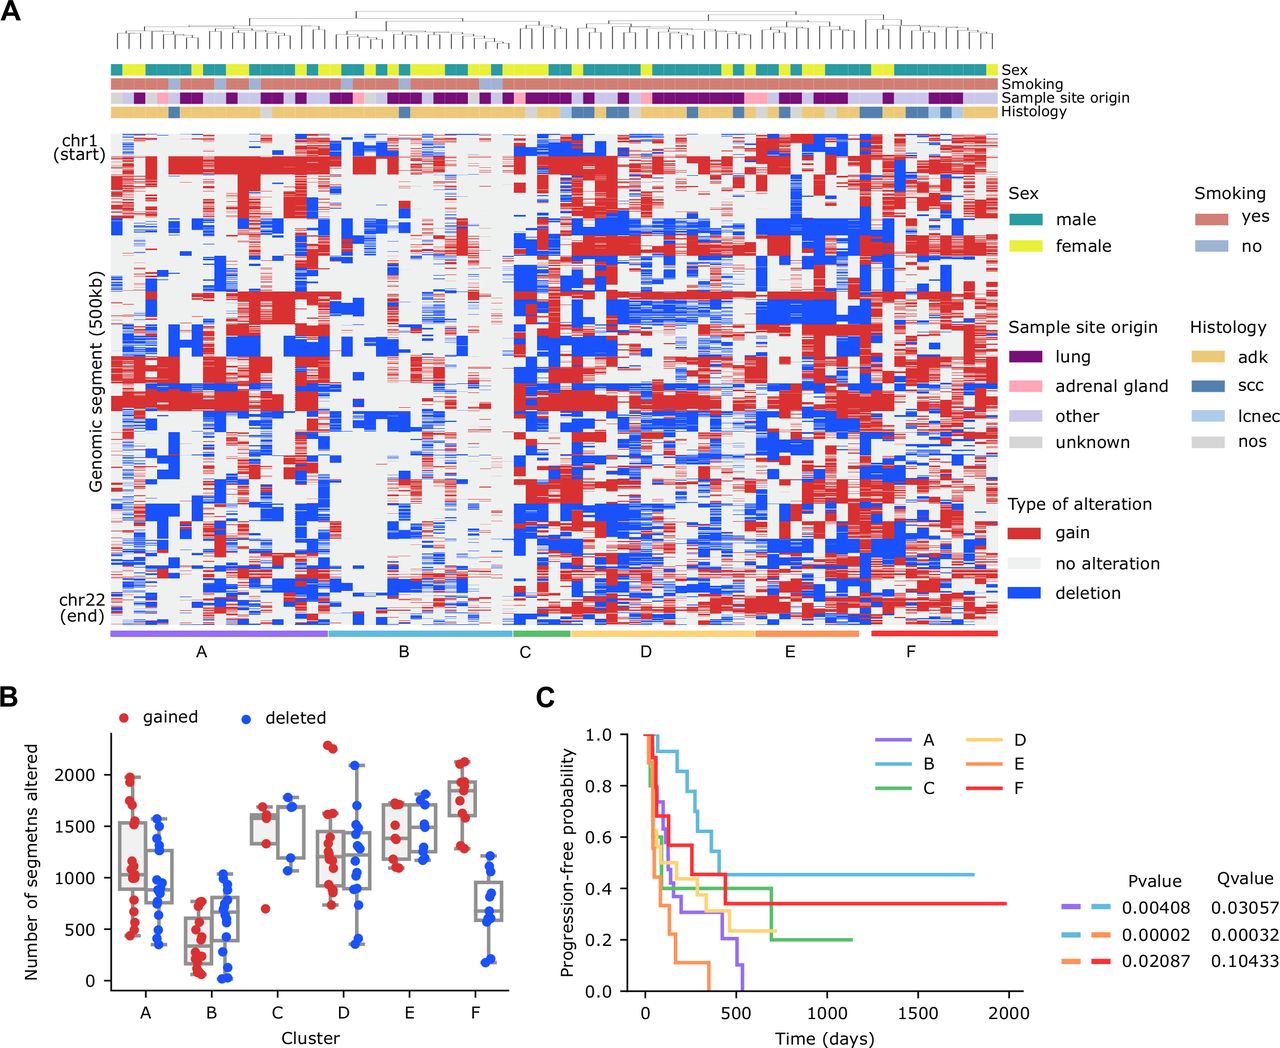
Genome wide somatic copy number alterations landscape by shallow whole-genome sequencing in a cohort of patients with non-small cell lung cancer treated with immune checkpoint inhibitors. (A) Hierarchical clustering of patients (n=77) based on the copy number alterations profile of 500 Kb genomic segments encompassing the 22 autosomes. (B) Number of gained (red) or deleted (blue) segments per patient across the six clusters defined in panel (1A). (C) Kaplan-Meier survival curves (using progression-free survival as endpoint) in the six clusters defined in panel (1A). Long-rank tests were used to determine differences between clusters. Results of all statistically significant comparisons are shown.
The resulting clusters had alterations in different regions of the genome but also differed in the number of segments altered (figure 1B). For example, the median of segments with SCNAs for cluster B was 528.5 (of a total of 4826 segments), whereas cluster A and E had medians of 995.5 and 1436, respectively.
Survival analysis based on these clusters indicated substantial differences in PFS between some of the clusters (cluster A vs B, cluster B vs E and cluster E vs F, log-rank test, Q=0.031, 3 x 10⁻⁴, and 0.104, respectively) (figure 1C, online supplemental table S3). For instance, patients in B cluster exhibited a median PFS of 406 days, whereas patients in cluster A or E presented a median PFS of 126 and 49 days, respectively. These results suggest that the total burden and/or the presence of specific SCNAs associate with PFS in NSCLC.
Supplemental material
SCNAs burden is a biomarker of ICIs PFS
Owing to the differences in PFS (figure 1C) across the clusters defined in figure 1A, we further explored the value of SCNAs burden as a biomarker of ICIs benefit in 77 patients with sWGS data available that had passed the quality control and purity thresholds. First, we computed the burden of SCNAs as the sum of the number of events or as the FGA and used univariate Cox proportional hazards models to study their association with PFS. We found that the FGA negatively associated with PFS (p=0.008), whereas the number of alterations did not, even though it was close to (p=0.052) (figure 2A).

SCNAs burden characterization. (A–D) P values of the association between PFS and the SCNAs burden measured in different ways assessed using univariate COX proportional hazards models. Dashed line indicates p=0.05; p 0.01 (–log)=4.61, p 0.005 (–log)=5.30. (E) FGAa+c per sample across sample site origin. (F) FGAa+c per sample according to sex. (G) P values of univariate COX proportional hazards models in lung and metastatic samples separately. Dashed line indicates p=0.05; p 0.01 (–log)=4.61, p 0.005 (–log)=5.30. (H) P values of univariate COX proportional hazards models in males and females separately. (I) Q values of the association between PFS and the alteration status of each genomic segment (0.5 Mb). Dashed line indicates Q=0.10. (J) Correlations between alterations in each statistically significant segment identified in panel 2I and the FGAa+c. FGA, fraction of the genome altered; PFS, progression-free survival; SCNAs, somatic copy number alterations.
Next, we explored whether this association was specific to SCNAs with particular characteristics (ie, clonality, size), as some differences in melanoma have been described.13 14 We evaluated the relevance of SCNAs clonality by using ichorCNA to distinguish between clonal and subclonal events. Univariate Cox regression analyses indicated that FGA of all alterations, regardless of their clonality, showed the strongest negative association with PFS (p=0.008 and was the best predictor; cross-validated c-index=0.64), although FGA of clonal events was also strongly associated with ICIs PFS (p=0.017) (cross-validated c-index=0.63) (figure 2B). Conversely, subclonal events per se were not informative of benefit to ICIs (p=0.201) (figure 2B).
We then explored whether the burden of gains or deletions associated differently with ICIs PFS, as it had been suggested in patients with melanoma.14 We found that the burden of all SCNAs associates with ICIs PFS (p=0.008) more strongly than the burden of gains (p=0.015) or deletions (p=0.043) separately (figure 2C).
Finally, we analyzed whether the size of the alteration could influence the association with benefit to ICIs, as indicated in a previous study also in melanoma.13 Thus, we considered focal, arm and chromosome alterations separately. A univariate Cox regression analysis revealed that the FGA of arm and chromosome events negatively associated with PFS, whereas no association was observed for focal events (figure 2D). Then, we combined arm and chromosomal alterations and found that the resulting FGA was the one that showed the most statistically significant association with PFS (p=0.002). Importantly, most of these characteristics had predictive value (cross-validated c-index of FGA arm +chromosome=0.65 and of FGA arms=0.66). Hereafter, we used the term FGAa+c to refer to the FGA arm + chromosome burden, which in turn was most strongly associated with PFS and hence we utilized it in subsequent analyses.
We studied the interplay between FGAa+c and several clinicopathological characteristics, including sex, smoking status, tumor histology, age, days elapsed between sample collection and ICIs start and sample site origin. Smokers had higher FGAa+c than non-smokers (p=0.049) (online supplemental figure S1A). Interestingly, we also observed that the FGAa+c burden of samples obtained from the primary tumor was lower than that found for metastatic samples (p=0.026) (online supplemental figure S1B). This trend was observed across sites, with the exception of the pleurae, and reached statistical significance in the case of the lymph node (p=0.016) and the liver (p=0.025) (figure 2E). The remaining clinicopathological features analyzed showed no association with FGAa+c (figure 2F, online supplemental figure S1C,D).
Supplemental material
Furthermore, we explored whether any of these clinicopathological features might possibly affect the association between FGAa+c and PFS. For this, we divided our cohort into subgroups of patients, based on each of the characteristics stated above, and assessed this association for each of these subgroups if they included at least 15 patients. The association between FGAa+c and ICIs PFS was maintained when restricting the analysis to current or former smokers (p=3 x 10⁻⁴), adenocarcinomas (p=0.007), males (p=0.045), females (p=0.005), primary tumor samples (p=0.019), metastatic samples (p=0.026) and patients treated with ICIs monotherapy (p=1.8 x 10⁻⁴) (figure 2G,H, online supplemental figure S1E). Of note, the association between FGAa+c and PFS was more evident in females than in males even though the number of female patients was smaller (29 vs 48, respectively) (figure 2H). Additionally, the predictive value was substantially higher in females than in males (cross-validated c-index=0.74 and 0.60, respectively). Also, we evaluated the association of FGAa+c with PFS stratifying patients by the line of therapy in which they received ICIs. Most patients were treated in first (n=30) or second line (n=34) of therapy. FGAa+c was negatively associated with PFS when patients were treated in second line of therapy (p=0.009) and a similar trend was observed in patients treated in first line of therapy (p=0.078), even though the size of these groups was relatively small. In fact, when patients treated in first and second line of therapy were taken together this association was highly significant (p=4.6 x 10⁻⁴, n=64).
Importantly, the fact that we observed differences in FGAa+c between the primary and the metastatic sites and that the association with PFS was maintained in both groups, suggested that the sample site origin could be a confounding factor that should be considered when using the SCNAs burden as a biomarker. To illustrate this, we first built a multivariate Cox proportional hazards model and confirmed the strong association between FGAa+c and ICIs PFS (p=4.2 x 10⁻⁴; HR=1.93) when adjusting for relevant clinicopathological features except for the sample site origin (online supplemental table S4). However, when additionally adjusting for this feature, the significance (p=3.3 x 10⁻⁵) and HR (2.21) of this association increased substantially (online supplemental table S5).
Supplemental material
Supplemental material
Besides differences in total burden, the PFS differences between the clusters, presented in figure 1A, could be influenced by specific alterations, which in turn might also affect ICIs PFS. Thus, we searched for genomic segments whose alterations associated with PFS. Despite alterations in many segments (both deletions and gains) being significantly associated with PFS (figure 2I), there was a strong correlation between most of the alterations and a higher FGAa+c (figure 2J). Thus, it is difficult to determine whether their association with PFS is due to simple correlation or whether such association might have a biological meaning. Nevertheless, we identified some segments whose alterations associate with PFS but do not correlate with higher FGAa+c, and may merit additional exploration (figure 2J, online supplemental table S6).
Supplemental material
Because there is growing evidence that tumors evade the immune system by altering the copy number of genes involved in the antigen presenting machinery and related pathways, we also evaluated its significance in our cohort using a published gene list.21 For several genes, both gains and deletions equally associated with worse ICIs PFS (online supplemental figure S1F). This could be due to the fact that patients carrying these alterations had a higher overall SCNAs burden which would be the actual cause of their diminished benefit to ICIs. Thus, we searched for genes that associated with ICIs PFS in a certain way when gained or deleted and for which the median PFS of the patients carrying no alterations was in between that of patients with gains and that with deletions (online supplemental figure S1F). Interestingly, we identified HHLA2, whose gain was associated with decreased PFS compared with patients with no alteration (log-rank test, Q=0.099 (online supplemental figure S1G)).
Immune infiltration characteristics in our cohort and benefit to ICIs
A tumor’s immune infiltration has also been associated with benefit to ICIs.9 24 29–31 We, therefore, assessed it for 60 samples that passed the quality control using a gene expression-targeted panel (encompassing 770 transcripts) enriched in immune-related transcripts. We inferred the abundance of different immune cell types23 and performed a hierarchical clustering of the patients (figure 3A). We identified three main clusters with apparent differences in immune cell type levels, which we associated with ICIs PFS. Even though we did not observe statistically significant differences in PFS between the three groups (figure 3B), their median PFS was quite different: cluster B (the less infiltrated) had substantially worse median PFS (98 days) than clusters A or C (215 and 230 days, respectively).
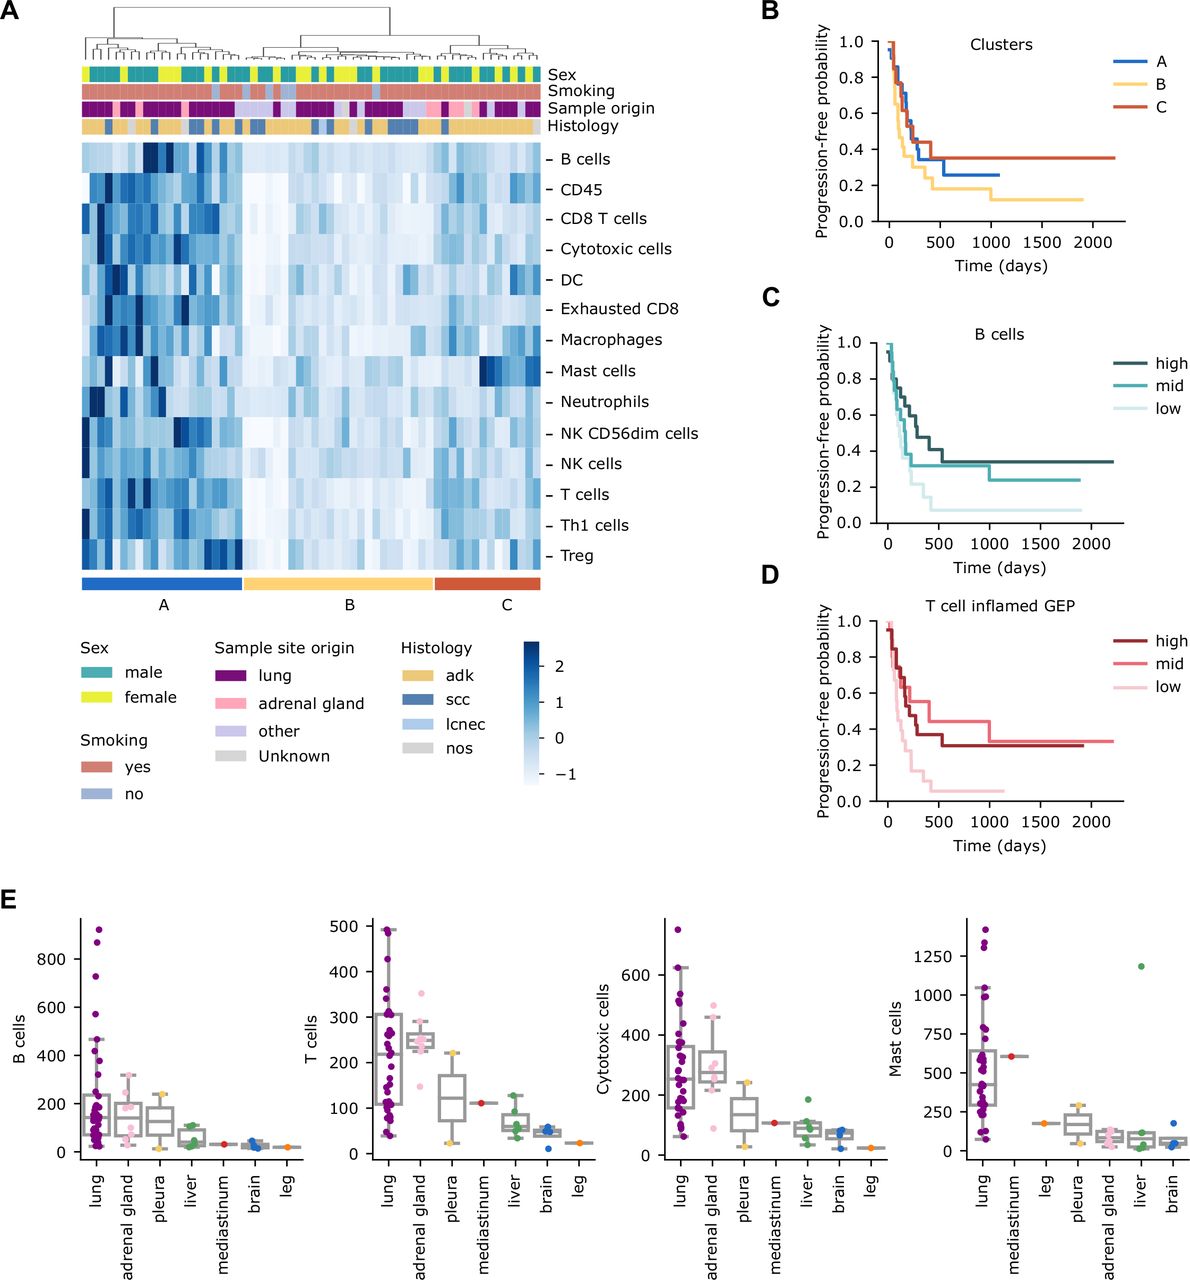
Immune infiltration profile of patients with non-small cell lung cancer treated with immune checkpoint inhibitors. (A) Hierarchical clustering of patients (n=60) based on the abundance of different immune cell types. (B) Kaplan-Meier survival curves (using PFS as endpoint) of the three clusters defined in panel (3A). (C) Kaplan-Meier survival curves of PFS in the groups resulting from dividing the cohort into tertiles based on the B-cell abundance levels. (D) Kaplan-Meier survival curves of PFS in the groups resulting from dividing the cohort into tertiles based on the T cell-inflamed GEP signature levels. Long-rank tests were used to determine differences across groups in Kaplan-Meier survival curves. (E) Levels of the indicated immune cell type per patient across sample site origins. PFS, progression-free survival.
We then analyzed whether any specific immune cell type associated with PFS. For this analysis, we stratified patients into tertiles, based on each immune cell type abundance, Only B cells reached statistical significance when comparing the lowest and highest tertiles (figure 3C) (log-rank test, p=0.043), although this comparison did not reach statistical significance when multiple test correction was applied (log-rank test, Q=0.421). Different compendiums of immune-related transcripts such as the T cell-inflamed GEP signature have been associated with PFS from ICIs treatment.24 Thus, we explored its significance in our cohort. Unsurprisingly, the patients in the lowest tertile had decreased PFS compared with those in the intermediate and highest tertiles (figure 3D) (log-rank test, p=0.038, and 0.040, respectively).
Of note, we have described differences in FGAa+c between primary tumor and metastatic samples (figure 2E, online supplemental figure S2B). For this reason, we examined the abundance of the different immune cell types across sample sites. Primary tumors exhibited higher levels for most of the cell types analyzed (p=7 x 10⁻⁴, 0.004, 0.001 and 3.2 x 10⁻⁷ for B cells, T cells, cytotoxic cells and mast cells, respectively) (online supplemental figure S2A). Nevertheless, we observed different trends when each metastatic site was considered independently (figure 3E, online supplemental figure S2B). For example, adrenal glands presented levels of immune infiltration similar to the primary tumor for most of the immune cell types (figure 3E, and online supplemental figure S2B).
Supplemental material
Immune infiltration negatively correlates with FGAa+c
Previous studies indicated that SCNAs burden negatively correlates with immune infiltration9 13 14 which, in turn, might partially explain the curtailed benefit in patients with high SCNAs burden. For 35 patients with transcription information, we also had sWGS available from the same biopsy to study their interplay. Our analysis corroborated the finding that the levels of several immune types negatively correlated with FGAa+c (figure 4A,B and online supplemental figures S3 and S4).
Supplemental material
Supplemental material

Negative correlation between somatic copy number alterations burden and immune infiltration. (A) Spearman correlations between the indicated immune cell type and FGAa+c in our cohort. (B) Q value obtained from Spearman correlation between the indicated immune cell type and FGAa+c in our cohort considering all samples, males and females separately. Dashed line indicates Q=0.10. (C) Q value obtained from Spearman correlation between the indicated immune cell type (Danaher signatures) and aneuploidy scores in the TCGA cohort considering all lung adenocarcinoma (LUAD) samples (n=560), males (n=263) and females (n=297) separately. Dashed line indicates Q=0.10. FGA, fraction of the genome altered; TCGA, The Cancer Genome Atlas.
Notably, in a previous section, we showed that the FGAa+c was a better indicator of ICIs benefit in females than in males (figure 2F), and thus we explored whether the negative correlation between SCNAs burden and immune infiltration might be different between the two sexes. This correlation was indeed stronger in females and missing in males (figure 4B, online supplemental figure S3). Even though both groups were well-balanced (17 and 18 individuals, respectively), our sample size was small; therefore, we used TCGA data to validate this observation.
To do so, we downloaded the ABSOLUTE27 aneuploidy score (which we considered to be equivalent to the FGAa+c), the RNA-seq data and two pre-computed immune infiltration scores (Bindea25 and CIBERSORT26) for patients with NSCLC adenocarcinoma from Thorsson et al.28 From the RNA-seq data, we computed the abundance of the different immune cell types using the Danaher signatures,23 as we did for the NanoString data. Then, we assessed the correlation between the aneuploidy score and the different immune cell types for the entire cohort and also stratifying patients according to sex. Consistent with the results obtained in our cohort, aneuploidy levels negatively correlated with several immune cell types (figure 4C, online supplemental figure S4), and this correlation was still evident when restricting the analysis to female patients, although missing or greatly reduced in the case of male patients (figure 4C, online supplemental figure S4).
Discussion
Despite being approved by regulatory agencies and being the focus of multiple research studies, TMB and PD-L1 are limited biomarkers of benefit to ICIs in NSCLC, so that other factors quite likely influence the response. On the other hand, the research on SCNAs burden in this context is restricted to very few studies. Here, we used sWGS to determine SCNAs genome-wide and to understand their association with ICIs benefit. Compared with other methodologies (WES, WGS, or gene-panel sequencing), sWGS is inexpensive, requires little computational resources, requires merely a small quantity of DNA as the starting material and is intended for this specific purpose. Therewith, SCNAs burden determination by sWGS has multiple practical advantages and may serve as a complement to the aforementioned biomarkers.
Our data indicate that SCNAs burden, determined by sWGS, associates with ICIs PFS in NSCLC, consistent with previous observations in a smaller cohort of NSCLC using WES.9 We explored multiple SCNAs characteristics to identify those that better associated with PFS to ICIs and showed that the FGA by events spanning large regions of the genome (FGAa+c) was the strongest predictor of ICIs benefit. Nevertheless, it is worth mentioning that the association between SCNAs burden and ICIs benefit was not limited to FGAa+c, but that SCNAs burden, computed in diverse ways, also associated with PFS following ICIs treatment.
The importance of SCNAs burden (or aneuploidy) as a biomarker of response to ICIs has been attributed to its negative correlation with several immune cell types,13 which might partially explain the lack of benefit of ICIs. Based on a relatively large cohort of patients with NSCLC, our data indicate that FGAa+c negatively correlates with several immune cell types consistent with previous observations in a smaller cohort of NSCLC.9 Of particular interest is our observation that sexual dimorphism plays a role in the interplay between FGAa+c and tumor immune infiltration, since the negative correlation here was exacerbated in females but absent in males. Importantly, we obtained a similar result in lung adenocarcinoma when analyzing TCGA data. Furthermore, FGAa+c seemed to be a better indicator of the benefit of ICIs in females than in males. In fact, it has been recently shown that females and males present differences in the tumor microenvironment composition and that the TMB might have a higher predictive value in females.32 Based on our observations, this might also be true for the SCNAs burden. It is possible that, owing to the differences in the tumor microenvironment composition,32 the mechanisms by which tumor cells evade the immune system might be different in males and females. Thus, the role that chromosomal instability may play in this process could be different between the sexes. It is worth noting, that the association between sex and ICIs benefit remains controversial. In fact, it has been suggested that the association might be cancer-type dependent and that molecular biomarkers might help to explain these differences.33 In a recent study analyzing clinicopathological features, female sex—among other characteristics—was associated with increased PFS following ICIs treatment in NSCLC.34
We also report here, that although overall immune infiltration tended to be higher in patients experiencing therapeutic benefit, its association with ICIs-related benefit was not statistically significant. Only B cell levels associated with increased PFS, consistent with a recent report in lung adenocarcinoma using also NanoString,29 although this association in our cohort did not reach statistical significance after multiple test correction. Beyond its negative correlation with immune cell infiltration, it is possible that high SCNAs burden is indicative of chromosome instability, known to endow tumor cells with greater plasticity,35 and thereby offering a broader repertoire of mechanisms to avoid immune system detection (ie, loss of antigen-presenting machinery or depletion of neoantigens).36–38
We also found that CNAs in multiple segments were associated with ICIs benefit. However, the occurrence of most of them correlated with overall high SCNAs levels, making it difficult to discriminate between a simple correlation or a biological meaning. Further clarification is needed here. We also explored alterations in antigen-presenting machinery and immune-related genes. We found that gains of HHLA2 are associated with diminished PFS. Mechanistically, HHLA2 has been described to be another immune checkpoint,39 thus, it is possible that tumors with gain of this gene might be less dependent on the PD-1/PD-L1 axis, so drugs targeting it would be less effective. Nevertheless, this observation warrants further exploration.
In addition to analyzing SCNAs burden’s role as a biomarker, we also studied its interplay with different biological characteristics. Importantly, we observed that FGAa+c is generally higher in metastatic lesions than in primary lung tumors, with liver metastases having the highest burden. However, we observed different trends across metastatic lesions, although it is fair to say that due to the sample size, this data must be interpreted with caution. In fact, a recent study using a metric for chromosomal instability found brain metastases to have higher burden than matched primary tumors,40 and other researchers have found an increase in SCNAs burden in metastases compared with unpaired primary tumors.41 In our cohort, infiltration levels also seem to be different between primary tumors and metastases. Our results indicate that metastases are generally less infiltrated than the primary tumors, with the exception of the adrenal glands, which present a pattern more similar to primary tumors. Interestingly, brain metastases were shown to be less infiltrated in a larger cohort of patients with NSCLC.42 Our data illustrate that differences between metastases and primary tumors exist not only in the case of brain metastases. Nevertheless, these observations should be confirmed in a larger cohort.
Beyond the limitations acknowledged throughout the discussion here, our study does not allow us to conclude whether SCNAs burden is a prognostic biomarker or whether it is predictive of ICIs benefit, as we did not have a non-ICIs treated cohort. It is worth highlighting that a high copy number load was recently associated with better outcomes in colorectal cancer treated with bevacizumab.43 As vascular endothelial growth factor (VEGF) inhibitors are being tested in combination with ICIs in NSCLC, it would be worth exploring the value of SCNAs burden as a biomarker in this clinical setting. Finally, we did not evaluate the value of combining TMB, PD-L1 and SCNAs burden, as this was beyond the goal and scope of our study which comprised an in-depth investigation of SCNAs burden and ICIs benefit. Some studies have proposed that combining TMB and SCNAs improved the prediction accuracy of the benefit achieved through ICIs treatment in NSCLC, although it should be noted, that these suggestions were based on gene-panel sequencing.9 44 45
Conclusions
Our data highlight that SCNAs burden, determined by sWGS, is an interesting biomarker of ICIs benefit in NSCLC, although a larger cohort including patients treated with other therapeutic regimens will be needed to establish its clinical value and potential. Considering also its practicability through low sequencing and computation-associated costs, this biomarker will most likely be an attractive focus in future biomarker studies. We confirmed its negative correlation with several immune cell types and additionally observed that this correlation may be different in males and females. In fact, the SCNAs burden appeared to be a more robust biomarker of ICIs-benefit in females. We also identified differences regarding the SCNAs burden and immune infiltration levels between primary and metastatic lesions, although distinct metastatic sites may behave differently.
Data availability statement
All data relevant to the study are included in the article or uploaded as supplementary information. SCNAs and gene expression data will be available upon request.
Ethics statements
Patient consent for publication
Ethics approval
This study involves human participants and was approved by the Hospital Institutional Review Board (PR(AG)308/2016). Participants gave informed consent to participate in the study before taking part.
Acknowledgments
We acknowledge the CELLEX Foundation for providing research facilities and equipment. We thank Dr Javier Gonzalo from VHIO for project management support. We thank our patients and their families for agreeing to participate in this study.
References
Supplementary materials
Supplementary Data
This web only file has been produced by the BMJ Publishing Group from an electronic file supplied by the author(s) and has not been edited for content.
Footnotes
Twitter @Frigola_Joan
Correction notice This article has been corrected since it was first published online to correct the misspelling of author name Patricia Iranzo.
Contributors Conception and design of the study: JF, CC, EF, RA; acquisition of data: PI, CC, AC, AM-M, SC, NP, EF, JH, JJ, RA, AN, MS, AV; data curation: JF, PI, CC, AC, RA, MS, NP; formal analysis: JF, CC, RA; visualization: JF, CC, RA; interpretation of data: JF, CC, EF, RA; review & editing: all authors; original draft: RA; guarantors: EF, RA.
Funding This work was supported by Merck Healthcare KGaA, Darmstadt, Germany (Grant for Oncology Innovation to the Vall d’Hebron Institute of Oncology (VHIO), Barcelona, Spain), Fundación Cientifica Asociación Española Contra el Cancer-AECC (grant number GCB14142170 to EF); the Catalan Government/AGAUR (2017–SGR–1738 to EF). Merck Healthcare KGaA reviewed the manuscript for medical accuracy only before journal submission. The authors are fully responsible for the content of this manuscript, and the views and opinions described in the publication reflect solely those of the authors.
Competing interests EF reports the following conflicts of interest: advisory role or speaker’s bureau: AbbVie, AMGEN, AstraZeneca, Bayer, Beigene, Blueprint medicines, Boehringer Ingelheim, Bristol Meyers Squibb, CME outfitters, Eli Lilly, Glaxo smith kline, Janssen, Medscape, Medical trends, Merck KGaA, Merck Sharp & Dohme, Merck Serono, Novartis, Peervoice, Peptomyc, Pfizer, priME Oncology, Puma, Regeneron, Roche, Sanofi, Syneos Health, Springer, Takeda, Touchtime. Board: Grifols, independent member. Research funding: Fundación Merck Salud, Grant for Oncology Innovation, Merck Healthcare KGaA. CC and JF: partial support through the Grant for Oncology Innovation, Merck Healthcare KGaA. AM-M provided consultation, attended advisory boards and/or speaker’s bureau for the following organizations: Bristol Myers Squibb, Lilly, F. Roche, MSD oncology, Pfizer, Boehringer Ingelheim, AstraZeneca. AN reports advisory role, speaker’s bureau or travel compensation: Bristol Myers Squibb, F. Hoffmann La Roche AG, Pfizer, Boehringer Ingelheim, Oryzon Genomics, Pfizer, AstraZeneca. SC Bristol Myers Squibb Recipient F, Hoffmann La Roche AG, Pfizer, Boehringer Ingelheim, MSD Oncology, Amphera. AC reports advisory role and/or travel compensation: Bristol Myers Squibb Recipient, F. Hoffmann La Roche AG, Pfizer, Boehringer Ingelheim, MSD Oncology, Kyowa Kirin, Celgene, Leo Pharma, Medscape, Kern Pharma. PI reports advisory role and/or travel compensation: Bristol Myers Squibb Recipient, F. Hoffmann, La Roche AG, Merck Sharp & Dohme, Boehringer Ingelheim, MSD Oncology, Rovi, Kyowa Kirin, Grunenthal Pharma SA, Pfizer, Medscape, Kern Pharma. NP reports advisory role and/or travel compensation: MSD oncology, Merck Sharp & Dohme, Bristol-Myers Squibb Recipient, F. Hoffmann La Roche AG, Pfizer, Boehringer Ingelheim, Grunenthal Pharma S.A Kern Pharma. AV reports advisory role: Bayer, Bristol Meyers Squibb, Guardant health, Merck, Novartis, Roche; consultant: Sysmex; technology transfer Dx field: Ferrer; Institutional preclinical research grant: Bristol Meyers Squibb, Cellestia Biotech, Chittern, Debio, Novartis, Roche and Sysmex.
Provenance and peer review Not commissioned; externally peer reviewed.
Supplemental material This content has been supplied by the author(s). It has not been vetted by BMJ Publishing Group Limited (BMJ) and may not have been peer-reviewed. Any opinions or recommendations discussed are solely those of the author(s) and are not endorsed by BMJ. BMJ disclaims all liability and responsibility arising from any reliance placed on the content. Where the content includes any translated material, BMJ does not warrant the accuracy and reliability of the translations (including but not limited to local regulations, clinical guidelines, terminology, drug names and drug dosages), and is not responsible for any error and/or omissions arising from translation and adaptation or otherwise.