Article Text

Abstract
Background The field of cancer immunology is rapidly moving towards innovative therapeutic strategies, resulting in the need for robust and predictive preclinical platforms reflecting the immunological response to cancer. Well characterized preclinical models are essential for the development of predictive biomarkers in the oncology as well as the immune-oncology space. In the current study, gold standard preclinical models are being refined and combined with novel image analysis tools to meet those requirements.
Methods A panel of 14 non-small cell lung cancer patient-derived xenograft models (NSCLC PDX) was propagated in humanized NOD/Shi-scid/IL-2Rnull mice. The models were comprehensively characterized for relevant phenotypic and molecular features, including flow cytometry, immunohistochemistry, histology, whole exome sequencing and cytokine secretion.
Results Models reflecting hot (>5% tumor-infiltrating lymphocytes/TILs) as opposed to cold tumors (<5% TILs) significantly differed regarding their cytokine profiles, molecular genetic aberrations, stroma content, and programmed cell death ligand-1 status. Treatment experiments including anti cytotoxic T-lymphocyte-associated protein 4, anti-programmed cell death 1 or the combination thereof across all 14 models in the single mouse trial format showed distinctive tumor growth response and spatial immune cell patterns as monitored by computerized analysis of digitized whole-slide images. Image analysis provided for the first time qualitative evaluation of the extent to which PDX models retain the histological features from their original human donors.
Conclusions Deep phenotyping of PDX models in a humanized setting by combinations of computational pathology, immunohistochemistry, flow cytometry and proteomics enables the exhaustive analysis of innovative preclinical models and paves the way towards the development of translational biomarkers for immuno-oncology drugs.
- lung neoplasms
- tumor microenvironment
- biomarkers, tumor
- immunohistochemistry
Data availability statement
Whole exome sequencing, RNA sequencing and scanned images are available in a public open accces repository. Request for the image analysis algorithm are available upon reasonable request. All data directly relevant to the study are included in the article or uploaded as supplementary information. RNASeq and whole exome Seq Data are available via https://www.ncbi.nlm.nih.gov/sra, PDX model image data is available via IDR (https://idr.openmicroscopy.org/tissue/). All further data relevant to the study are either uploaded as supplementary information or can be requested from senior authors JS (animal models), FF (digital and conventional pathology) or DM (digital pathology/image analysis).
This is an open access article distributed in accordance with the Creative Commons Attribution Non Commercial (CC BY-NC 4.0) license, which permits others to distribute, remix, adapt, build upon this work non-commercially, and license their derivative works on different terms, provided the original work is properly cited, appropriate credit is given, any changes made indicated, and the use is non-commercial. See http://creativecommons.org/licenses/by-nc/4.0/.
Statistics from Altmetric.com
Key messages
What is already known on this topic
One bottleneck in oncology is the translation of preclinical models in rodents to clinical reality. The currently used preclinical models are not well characterized towards their feasibility to discover predictive biomarkers for immunotherapies.
What this study adds
With a deep phenotypic characterization of 14 humanized non-small cell lung cancer patient-derived xenograft (PDX) this study indicates that PDX have distinct hot versus cold phenotypes as a model immanent feature. The hot and cold phenotype influences their response to immune checkpoint inhibitors. PDX models in humanized mice might enable to converge on preclinical efficacy testing and clinical development of companion diagnostics.
How this study might affect research, practice and/or policy
This study will enable the routine use of humanized mice and PDX for immuno-oncology drug development projects.
Background
The complexity of treatment options for non-small-cell lung cancer (NSCLC) and the need for predictive biomarkers has dramatically increased since the advent of immunotherapy. Biomarkers for compounds targeting specific genetic aberrations differ significantly from biomarkers for immunomodulating drugs, as the latter are continuous, time-dependent and context-dependent and need to consider multiple factors.1 2 Currently, biomarker research is lagging the mechanistic understanding of novel drugs modulating the immune component of the tumor. A major need is a translational approach integrating well-characterized preclinical platforms with clinically relevant biomarker strategies, thereby enabling a seamless transition into early clinical research.
Cancer research relies strongly on animal models, often based on human tumor cells transplanted into immune-compromised mice.3 The current gold-standard for preclinical mouse models of cancer are patient-derived xenografts (PDX).4–6 Since the foundation of international initiatives taking care of the systematic characterization of PDX covering the breadth and depth of the different cancer types, the predictive value of this model platform has tremendously increased.7 The availability of large, well-characterized PDX collections has enabled in vivo screening formats that allow the investigation of numerous compounds in a tumor panel reflecting patient heterogeneity: The single mouse trial format (SMT) is defined by a group size of n=1 per treatment arm and model. This study paradigm supports the identification of responsive subpopulations, thus enabling the discovery of predictive biomarkers urgently needed in the immuno-oncology landscape.8
Nevertheless, PDX models can only partially reflect the tumor in-situ, since human tumor cells interact with a murine microenvironment. This gap is likely to contribute to the high attrition rate of cancer drugs in early clinical development, often not meeting their primary endpoints while preclinical data has been encouraging.9–11
In 2002 the NOD.Cg-PrkdcscidIl2rgtm1Wjl/SzJ (NSG) mouse and their relatives have been made available to the scientific community.12 These novel mouse strains, harboring an unprecedented degree of immune suppression, enabled the development of so-called humanized mice. Although, the recapitulation of the human immune system is still incomplete, their capability to predict antitumoral activity of immune-modulating compounds has been proven at least for T cell-based therapy.13–16
In this study, we aimed to combine three well-accepted preclinical assets: PDX, SMT format and humanized NSG (huNSG) to develop a preclinical research platform expanding the screening for innovative immune-oncology drug candidates by tools for the concomitant development of biomarkers that support stratification in early clinical trials.
Material and methods
PDX characterization in humanized mice
NSCLC PDX models were implanted subcutaneously in 4–6 week-old female NSG or huNSG (Charles River, France) under isoflurane anesthesia. Tumor growth was determined by a two-dimensional measurement with calipers twice a week. Analyses of the PDX models were performed when tumor size reached 400–500 mm³: tumors were sampled for subsequent analysis by flow cytometry, histology, and cytokine determination. Hematopoietic organs such as peripheral blood (PB), bone marrow (BM) and spleen were analyzed by flow cytometry.
Patient with NSCLC samples
A series comprizing 52 formalin-fixed paraffin embedded (FFPE) samples of completely anonymized archival surplus material (Institute for Pathology, Hanover Medical School) representing the full spectrum of common histological variation in diagnostic NSCLC evaluation was processed immunohistochemically as described below for comparison with the PDX-derived samples.
Treatment experiments in vivo
Implantation was performed as described above. Animals bearing 80–100 mm³ tumors, were distributed into experimental groups following the principle of the single mouse trial.8 The day of randomization and treatment start was designated as day 0. Both compounds and the combination were applied intraperitoneally. Details are listed in online supplemental table 1. Tumor volume and body weight were determined twice weekly.
Supplemental material
Evaluation of antitumoral activity
The relative volume of an individual tumor on day X was calculated by dividing the absolute volume mm3 of the respective tumor on day X by the absolute volume of the same tumor on the day of randomization (=day 0). Tumor inhibition on a particular day (test/control (T/C)) was calculated from the relative volume of a test group and the relative volume of a control group.
Human PD-L1 and human CD45 immunohistochemistry
After antigen retrieval, 5 µM thick FFPE tissue sections were incubated with anti-human programmed cell death ligand 1 (PD-L1) Antibody (1:200, Cat #13,684S, Cell Signaling, USA) or anti-human CD45 Antibody (1:300, Cat# AB40763, Abcam, UK) for 60 min at 37°C, followed by 3,3′-Diaminobenzidin (DAB) staining and hematoxylin counterstaining. Slides were scanned at 0.253 µm/pixel resolution (40×) with an Aperio AT2 scanner (Leica Microsystems, Wetzlar, Germany).
Image analysis
Digitalized images of the immunohistochemistry (IHC) slides were evaluated to determine the percentage of PD-L1-positive areas using the OSANO software.17 A computerized analysis for digitized whole-slide images of the samples was used to quantify the PD-L1 and CD45 expression using color classification and morphological image processing techniques. The tissue classification was performed as described before on digitalized images of the H&E slides.18
Flow cytometry
BM, spleen, tumor or PB cells (5×10⁵ to 1×10⁶) from tumor bearing animals were harvested and incubated with the primary antibody or isotype control and the mean fluorescence intensity was analyzed by flow cytometry (FC). Staining was performed in the presence of CD16/CD32 Abs to block non-specific staining. Antibody information are listed in online supplemental table 2. Samples were analyzed on an Attune Acoustic Focusing Cytometer NXT (Applied Biosystems) which recorded 50,000 events.
Bead-based bioplex assay
Tumor tissue was analyzed according to manufacturer’s instructions. For human cytokine detection the Bio-Plex Pro Human Chemokine Panel (# 171AK99MR2, Bio-Rad, USA) was used and for the detection of mouse cytokines the Bio-Plex Pro Mouse Cytokine 23-plex Assay (#M60009RDPD, Bio-Rad) was utilized. All analyses were performed on the Bio-Plex 200 system (#171000201, Bio-Rad)
Statistical analysis
Student’s t-test, two-tailed and Mann-Whitney followed by Tukey’s multiple comparisons test were used to calculate the reported p values. For the comparison of the FC data, the statistical significance was determined using the Holm-Sidak method, with alpha=0.05. For the comparison of the cytokine data the ratio paired t-test was applied. Each row was analyzed individually, without assuming a consistent SD. The scheme in the figure for describing the p value was the following: ****p<0.0001, ***p=0.0001 to 0.001; **p=0 0.001 to 0.01; *p=0.01 to 0.05; ns : p≥0.05. Descriptive analyses were assessed whenever appropriate and were obtained using GraphPrism software (www.graphpad.com).
EMT score
The epithelial-mesenchymal transition (EMT) score was built on a gene set published by Taube et al.19 It describes a gene signature based on changes depending on EMT-related genes like Snail, Twist, or E-cadherin. Based on the RNA expression levels of the respective genes the 14 NSCLC PDX models received a specific EMT score which was calculated following Rudisch et al20 by performing gene-wise scaling of expression values and afterwards obtaining the average of the genes in the EMT signature.21
Three-dimensional stack production
The FFPE samples were cut into 3 µm thick slides. Five slides were cut consecutively, leaving an interval of 80 µm the next five slides were cut. This was repeated throughout the block. The first slide of each section was stained with H&E and the second slide was stained for huCD45 following the protocol described above.
Results
The NSCLC PDX models retain the histological features of the donor patient tumor
The panel of NSCLC PDX models was based on 14 primary tumors covering the most common subtypes. The basic characteristics of the PDX and the essential donor patient information are listed in online supplemental tables 3 and 4. The PDX models maintained their typical histopathologic appearance during serial passage (n=4) in immune compromised mice, visually displaying identical features (figure 1A). We confirmed this observation by objective tissue class quantification on representative H&E whole slide scans from donor patients and the respective PDX. The proportions of the main tissue classes tumor, stroma and necrosis is conserved during model establishment and proved to be persistent in individual tumor models (figure 1B).

(A) Histological features of the selected non-small cell lung cancer PDX and corresponding patient tissue. H&E stains were prepared from formalin-fixed paraffine embedded samples of donor patient tissue as well as the fourth passage in NOD.Cg-PrkdcscidIl2rgtm1Wjl/SzJ mice of PDX derived thereof. Whole slides were scanned and 10 × magnification jpegs extracted of the scans (scale bar included). (B) A tissue classification algorithm was used to estimate the percentage of tissue classes within one scanned H&E stained slide. For each donor patient (pt) and for each PDX one H&E stained whole slide image was analyzed. The results are plotted as percentage of analyzed area. CA carcinoma; LXFA, lung cancer xenograft Freiburg, adenocarcinoma; LXFE, lung cancer xenograft Freiburg, epithelial; LXFL, lung cancer xenograft Freiburg, large cell; PDX, patient-derived xenograft.
The immune cell infiltration pattern is an immanent feature of the model and can be used to classify the NSCLC PDX models into hot and cold tumors
We evaluated the influence of the tumor implantation on the engraftment of human immune cells and vice versa the influence of the human immune cells on tumor growth. The FC analyses of PB, BM and spleen of the tumor bearing versus non-tumor bearing mice revealed no major differences between both groups (online supplemental figure 1A). Inversely, the presence of human immune cells did not alter the growth characteristic of the NSCLC PDX models. This is exemplarily shown in online supplemental figure 1B, where lung cancer xenograft Freiburg, adenocarcinoma (LXFA) 983 mean tumor volume over time is plotted in NSG, Naval Medical Research Institute (NMRI) nu/nu and huNSG.
Supplemental material
The 14 PDX models were implanted subcutaneously into huNSG (one tumor per model per mouse) and the human immune cells in tumor, BM, spleen and PB were quantified by FC (figure 2A, online supplemental figure 2A). By applying the threshold of 5% tumor-infiltrating lymphocytes (TILs) we defined two groups, hot and cold tumors, which show a highly significant difference in TIL percentage (p<0.00012). Comparing the immune cell infiltration in different organ systems between those two groups, only the CD4 +fraction in the spleen showed significant differences (p<0.04). The CD4+/CD8 +ratio in tumor tissue tended to be higher in mice bearing cold tumors (not significant (n.s.)). Notably, in BM and spleen the CD4+/CD8 +ratio was significantly lower in cold tumors (online supplemental figure 2B, p<0.04). Of note, the engraftment of human immune cells in PB prior to tumor implantation was similar in the individual huNSG mice receiving cold or hot tumors (online supplemental figure 2C). The FC analysis of one sample per model was representative for the model per se as shown in independent experiments for LXFA 983, LXFA 1674 and lung cancer xenograft Freiburg, large cell (LXFL) 526 (online supplemental figure 2D).
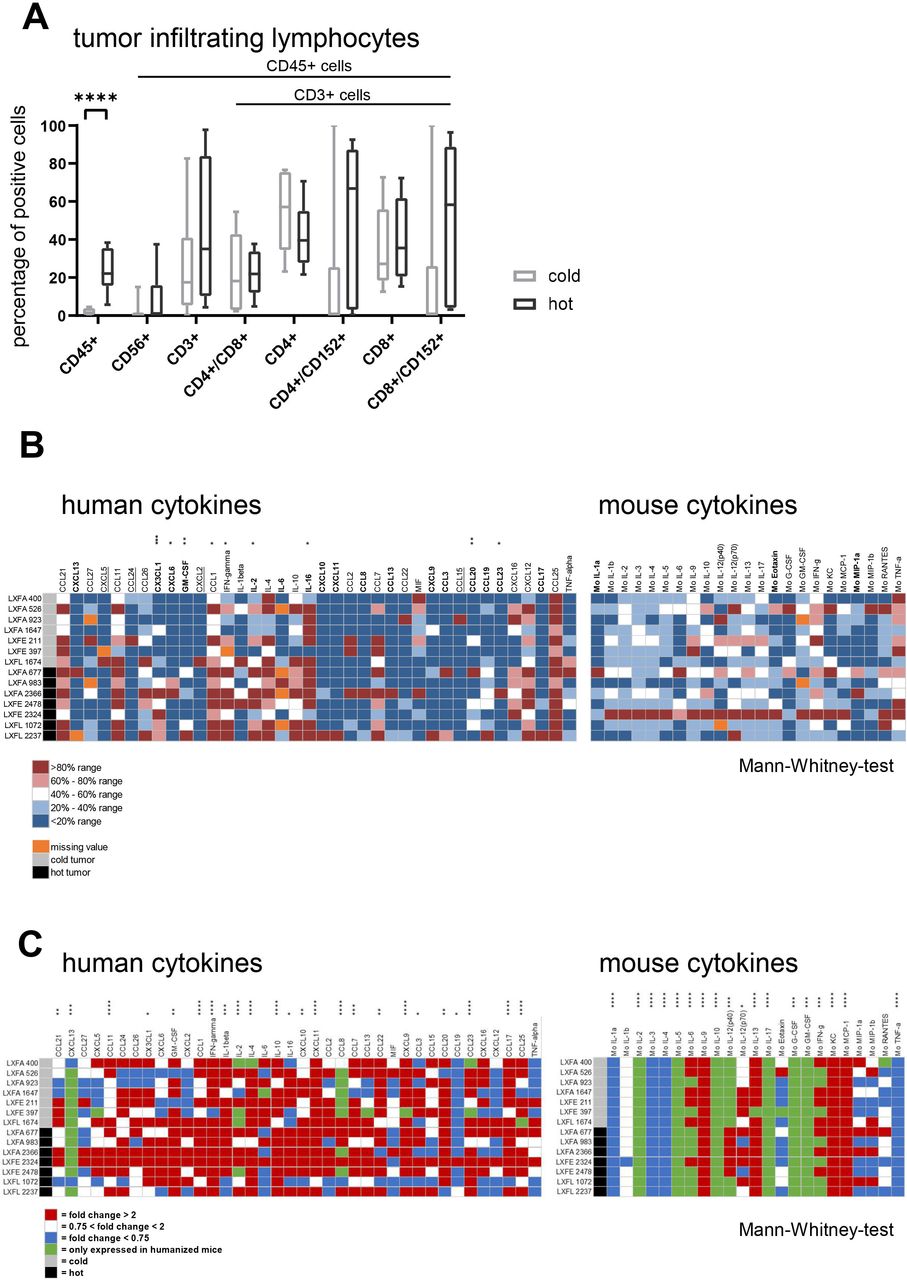
(A) Flow cytometry analysis of human immune cells in tumor of humanized NOD.Cg-PrkdcscidIl2rgtm1Wjl/SzJ mice when tumor volume has reached 400–500 mm³. A total of 14 animals bearing 14 different models was analyzed. The individual data points are plotted as box plots with minimum and maximum as whiskers and median depicted as the line in the box. The percentage of CD45 +cells in the tumor tissue was used as classification criterion into cold (<5%) and hot (>5%) tumors, respectively. Following this criterion seven models were assigned to the group of cold tumors and the remaining seven to the group of hot tumors. (B) The levels of 38 human and 23 mouse cytokines in the tumor tissue of hot and cold tumors was determined for all 14 models. The absolute value of pg protein/mg tissue is plotted per cytokine and tumor model. The cytokines with a greater than twofold higher mean expression in hot tumors compared with cold tumors are highlighted in bold letters, the cytokines with a greater than twofold higher mean expression in cold tumors compared with hot tumors are underlined. The stars indicate statistical difference between the cold and the hot tumor group for a specific cytokine (Mann-Whitney test). (C) The influence of the presence of human immune cells in the murine host was determined by calculating the fold change of 38 human and 23 mouse cytokines in the humanized versus the non-humanized setting per model and plotted as heatmap. The stars indicate statistical difference between the non-humanized and the humanized tumor group for a specific cytokine (Mann-Whitney test). G-CSF, granulocyte colony stimulating factor; GM-CSF, granulocyte-macrophage colony-stimulating factor; IFN, interferon; IL, interleukin; LXFA, lung cancer xenograft Freiburg, adenocarcinoma; LXFE, lung cancer xenograft Freiburg, epithelial; LXFL, lung cancer xenograft Freiburg, large cell; TNF, tumor necrosis factor.
The hot and cold tumors display a specific human cytokine pattern
The hot and cold tumors displayed distinct cytokine profiles. Four human cytokines were greater than twofold higher expressed in cold tumors, whereas 17 human cytokines showed a greater than twofold higher expression in hot tumors, nine of them displaying a statistically significant difference. Only three murine cytokines were upregulated more than twofold in the hot tumors and none in the cold tumors (all n.s., figure 2B). Among the upregulated human cytokines in the hot tumors, were interleukin (IL)-16 and CXCL-13 which are known to be chemotactic for activated T cells. In addition, neutrophil attracting cytokines CX3CL-1 and CXCL-6 were enhanced alongside with pro-inflammatory cytokines interleukin (IL)-2, IL-6 and granulocyte-macrophage colony-stimulating factor (GM-CSF) (online supplemental figure 3). The enhanced mean expression levels in the cold tumors were accompanied by a wide distribution and therefore their biological implications remained to be elucidated. The three upregulated mouse cytokines IL-1a, Eotaxin and MIP-1a do have a pro-inflammatory impact, indicating that the murine part of the tumor microenvironment participates in the recruitment of the human immune cells (online supplemental figure 3). The influence of the presence of the human immune cells in the murine host was determined by calculating the fold change between the non-humanized and the humanized setting per model (figure 2C) for the human as well as the murine cytokine panel. Several mouse cytokines were exclusively expressed in the presence of human immune cells: Mo IL-2, Mo IL-5, Mo IL-10, Mo IL-17, Mo G-CSF, Mo GM-CSF. In addition, another group of murine cytokines was highly upregulated in most of the tumor models: Mo IL-6, Mo IL-9, Mo-IL-12, Mo IL-13, Mo interferon (IFN)-γ, Mo keratinocyte derived cytokine (KC), Mo monocyte chemattract chemokine (MCP-1). Most of those cytokines have a pro-inflammatory effect. Explicitly, IL-17 is described to enhance fibroblast proliferation and its secretion of pro-inflammatory cytokines. Nevertheless, the enhanced secretion of IL-10 and IL-13 indicates a counter-regulation towards immune cell homeostasis. Along those lines, a downregulation of Mo IL-1a and b, Mo IL-3, Mo IL-4 and Mo tumor necrosis factor (TNF)-α was observed. The effectiveness of this regulation mechanism can be seen inter alia in the similar growth characteristics of the individual tumor models in the presence of absence of human immune cells using the example of LXFA 983 (online supplemental figure 1B). Twenty-four of the 38 human cytokines were either specifically or statistically significant higher expressed in the presence of human immune cells. Remarkably pro-inflammatory and partly antitumoral proteins as CXCL-13, IFN-γ, CCL8 and CXCL9 are highly upregulated in the presence of human immune cells. No differences could be observed between the hot and cold tumors regarding the mouse cytokine regulation as a function of human immune cell presence.
Supplemental material
Hot and cold tumors are characterized by different molecular features
Comparing the different molecular characteristics in the hot versus the cold tumors, we found comparable tumor mutational burden in both groups: 16.54 alterations/MB in hot versus 16.74 alterations/MB in cold tumors. The EMT score was twofold higher in hot tumors (14.65±0.72, cold vs 31.89±0.52, hot, n.s.). Regarding the mutational landscape of the NSCLC PDX models the hot tumors displayed a higher frequency of mutations in the ERB2, KRAS and MET genes, whereas the cold tumors had a higher frequency of MYCL, PTEN, RB1 and TSC2 mutations. Investigating the RNA expression levels of the same gene set confirmed more than twofold differences in mean expression levels for four genes: EGFR (p<0.005) and ROS1 (n.s.), whereas MYCL (p<0.04), and MYCN (n.s.) showed higher expression levels in cold tumors (online supplemental figure 4).
Supplemental material
The PD-L1 protein expression on the tumor cells is associated with the density of infiltrating human immune cells
To examine the PD-L1 expression at tissue level in the 14 NSCLC PDX models, IHC was performed on tumor tissue grown in NSG and huNSG, respectively (figure 3A). The influence of the presence of human immune cells was determined by calculating the fold change of the DAB +area in the humanized versus the non-humanized setting per model. A more than threefold increase of the PD-L1 expression was specifically detected in hot tumors. In contrast, most of the cold tumors downregulated PD-L1 in the presence of human immune cells (figure 3B). The hot tumors expressed significantly more PD-L1 than the cold tumors measured by DAB +area (figure 3C; p<0.0071).
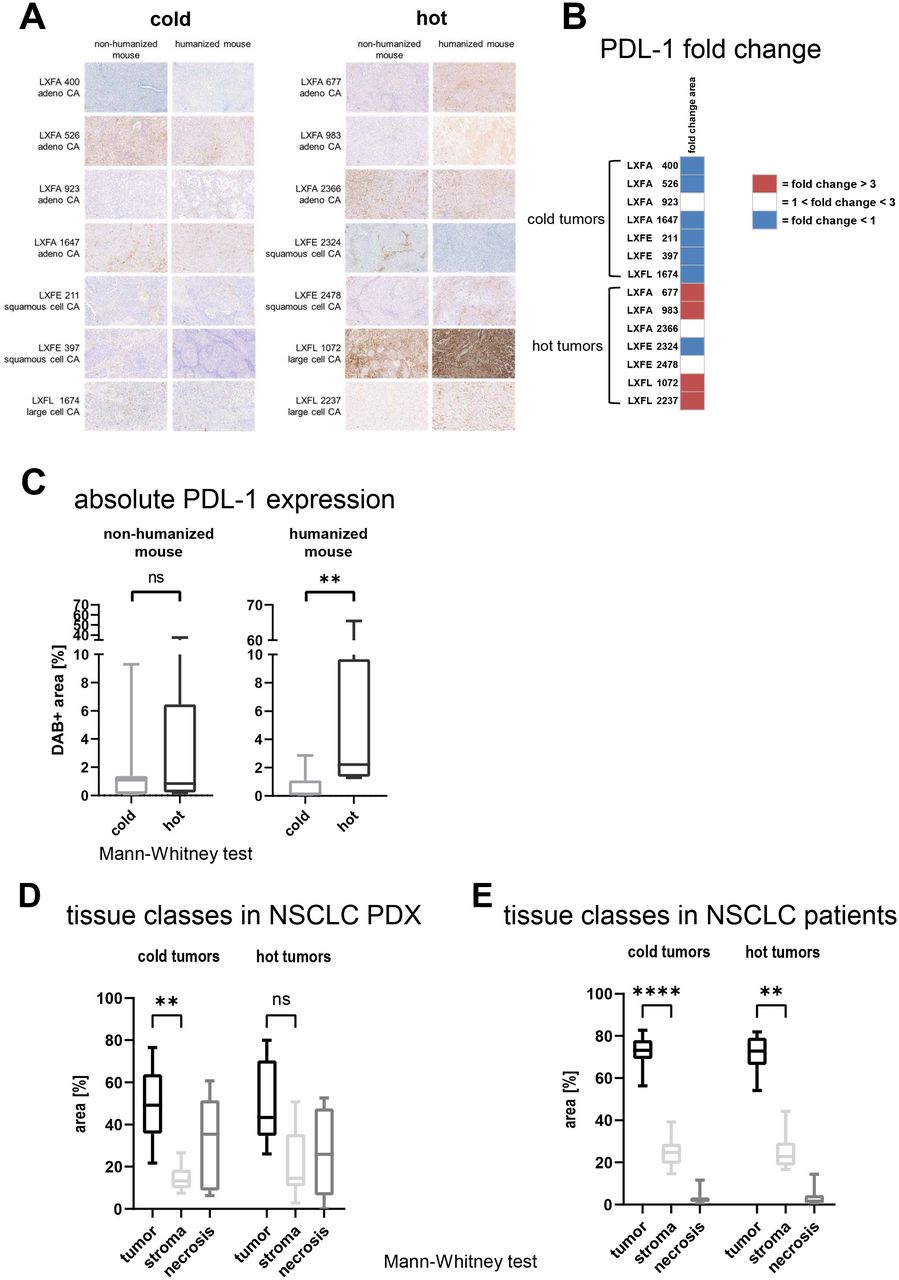
The PD-L1 expression was determined by IHC in 14 different NSCLC PDX in the presence or absence of human immune cells. (A) Whole slide scans were prepared, and representative 10× magnification jpegs were extracted of the scans (scale bar included). Quantification of the PD-L1 expression determined by IHC in a panel of 14 NSCLC PDX models, seven cold and seven hot tumor models. The DAB +area was determined using the OSANO software by analyzing one whole slide per tumor model in the presence and absence of human immune cells (total of 28 slides) (B) The influence of the presence of human immune cells in the murine host was determined by calculating the fold change of the DAB +area in the humanized versus the non-humanized setting per model and plotted as heatmap. (C) The comparison of the PD-L1 expression depicted as relative DAB +area (=percentage of analyzed area) on cold versus hot tumors. The individual data points are plotted as box plots with minimum and maximum as whiskers and median depicted as the line in the box. (D) Using whole slide images of H&E stained slides, the percentage of the tissue classes tumor, stroma and necrosis were measured by a tissue classification algorithm in 14 NSCLC PDX models propagated in humanized NOD.Cg-PrkdcscidIl2rgtm1Wjl/SzJ, seven cold and seven hot tumor models. The results are plotted as percentage of analyzed area. For each model one whole slide scan was analyzed (n=7 for cold and hot tumors, respectively). The individual data points are plotted as box plots with minimum and maximum as whiskers and median depicted as the line in the box. (E) Using whole slide images of H&E stained slides, the percentage of the tissue classes tumor, stroma and necrosis were measured by a tissue classification algorithm in 52 patient with NSCLC samples, 34 cold and 18 hot tumor models. The results are plotted as percentage of analyzed area. For each model one whole slide scan was analyzed (n=34 for cold and n=18 for hot tumors, respectively). The individual data points are plotted as box plots with minimum and maximum as whiskers and median depicted as the line in the box. DAB, 3,3′-Diaminobenzidin; IHC, immunohistochemistry; LXFA, lung cancer xenograft Freiburg, adenocarcinoma; LXFE, lung cancer xenograft Freiburg, epithelial; LXFL, lung cancer xenograft Freiburg, large cell; NSCLC, non-small cell lung cancer; PD-L1, programmed cell death ligand 1; PDX, patient-derived xenograft.
Cold tumors display a higher tumor/stroma ratio than hot tumors
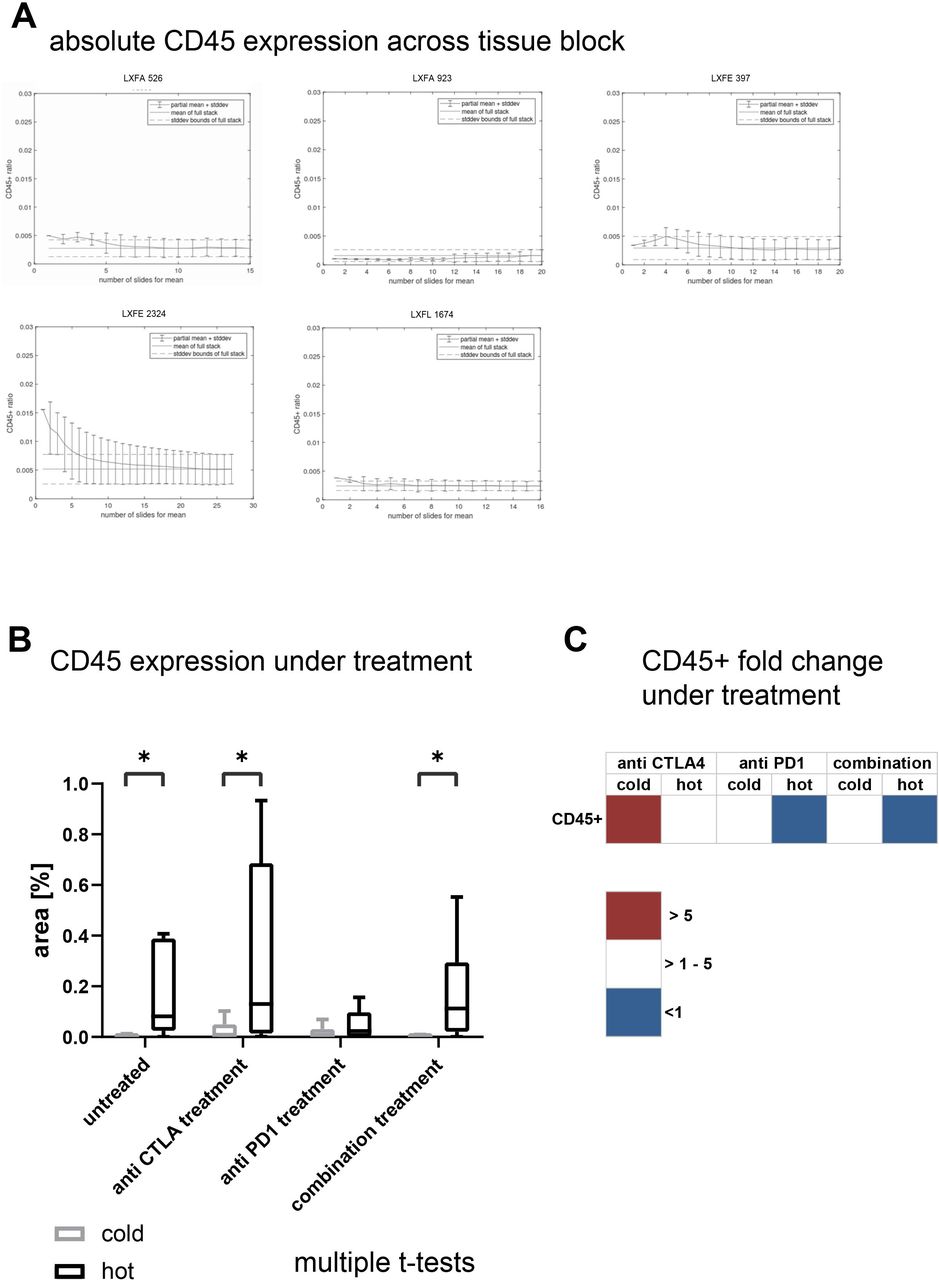
We determined the distribution of the three major tissue classes, tumor, stroma, and necrosis, in our NSCLC PDX panel. First, we investigated the variability of the distribution of tissue classes throughout one block. We analyzed five blocks of different untreated NSCLC PDX models following the scheme depicted in online supplemental figure 5A and plotted the tissue composition across the different slides (online supplemental figure 5B). As a measure for heterogeneity throughout the block, we compared the mean tumor/necrosis ratio and the mean tumor/stroma ratio of one slide with the mean of the full stack (online supplemental table 6). The percentage of tumor and stroma within one slide was stable across the block and specific for a certain tumor model. In contrast, the percentage of necrosis varied across the block for some of the models, namely LXFL 1674 and lung cancer xenograft Freiburg, epithelial (LXFE) 2324. Conversely, the increase of necrosis was associated with a corresponding decrease of tumor tissue. We concluded that tissue sections for this type of analyses should preferably be prepared from the central portions of the tumor, as these regions were the ones with the least variance among the different models.
Supplemental material
After the systematic evaluation of the robustness of our workflow, we examined one whole slide image (WSI) per setting from the middle of the individual block in the subsequent analyses. The comparison of the tissue composition in all 14 models revealed that the tumor tissue was the most prominent tissue class. The cold tumors depicted less stroma as the hot tumors, which led to a statically significant difference between the tissue class tumor versus stroma specifically in the cold tumor group (figure 3D, p<0.001). Of note, the difference between the stroma content in the cold versus the hot tumors was statistically not significant.
A corresponding analysis was performed on clinical samples from 52 patients with NSCLC. The subgrouping into cold and hot tumors was built on an image analysis-based quantification of CD45 +cells. Consistent with the FC analysis of the samples derived from PDX models, the difference between TILs in hot and cold tumors was statistically significant (online supplemental figure 5C, p<0.0001). Moreover, the tissue composition in the clinical samples was very similar to the composition observed in the PDX panel. Along those lines, the difference between the tissue classes tumor and stroma was more prominent in the cold tumors compared with the hot tumors (figure 3E, p<0.0001 and p<0.0025).
Cold tumors are slightly more susceptible to checkpoint inhibitor treatment as hot tumors
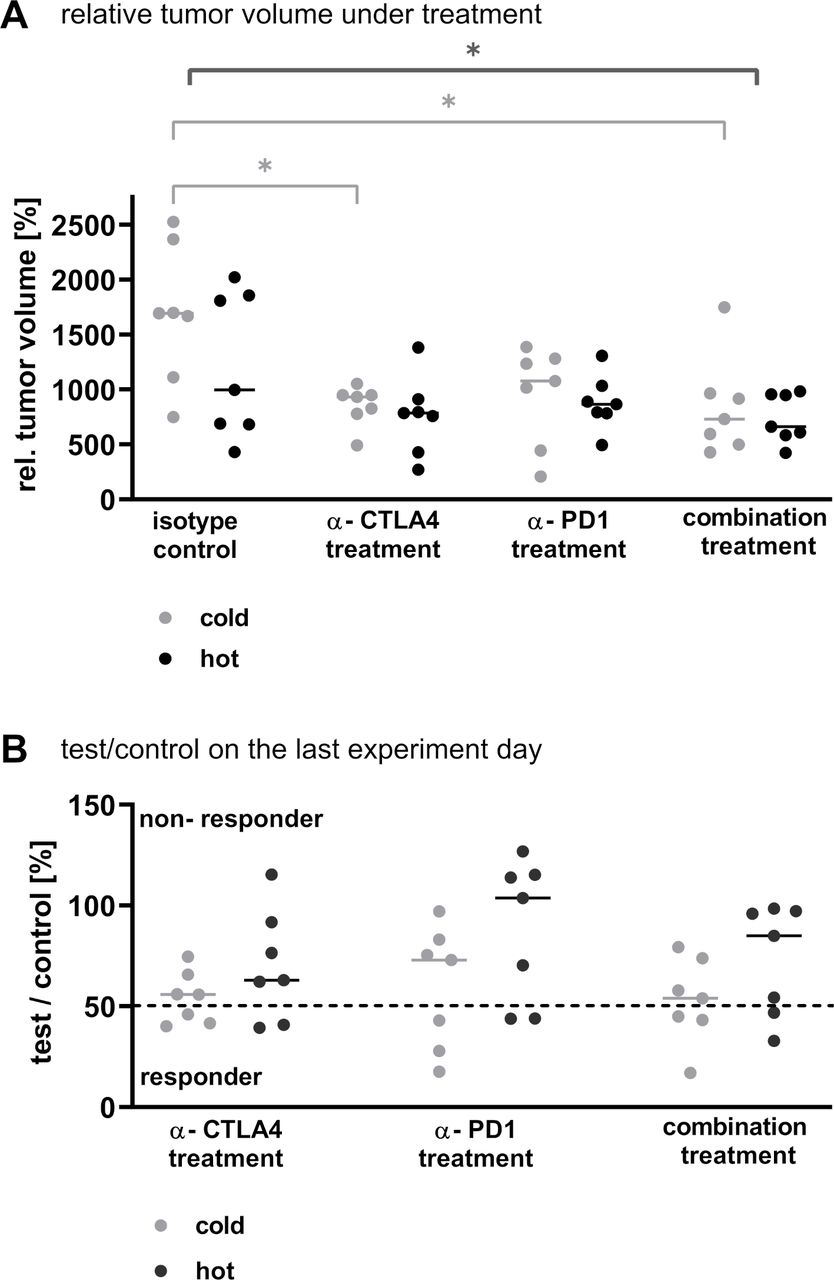
Both checkpoint inhibitors delayed tumor growth in monotherapy and combined therapy within the 14 models at varying degrees (figure 4A). Across all models, the combination treatment was the most effective therapy, followed by anti-cytotoxic T-lymphocyte-associated protein 4 (CTLA-4) treatment alone (p<0.012 and p<0.035, respectively). This holds true when examining specifically the cold tumors (p<0.024 and p<0.045, respectively). On the contrary, within the group of hot tumors the relative tumor volumes in the different treatment arms did not differ significantly. These results were supported by the examination of the T/C values on the last experiment day: In all treatment arms, three cold but only two hot tumors could be defined as responders (T/C value <50% partial remission, figure 4B).

The sensitivity towards checkpoint inhibitor treatment of NSCLC PDX in monotherapy and combined therapy was tested in 14 NSCLC PDX models in the single mouse trial format. (A) The relative tumor volume at the last experiment day, with the tumor volume measured on the first day of treatment set as 100%, was plotted for the different treatment arms. Each dot represents one animal bearing a different NSCLC PDX model. The line is indicating the median of the respective group. The statistics in dark gray represent the analysis of all tumors per treatment arm (hot and cold). (B) The test/control value on the last experiment day was plotted for each treatment arm separately for the cold and the hot tumors. Each dot represents one tumor. The line is indicating the median of the respective group. The dotted line marks a test/control value of 50% indicating the threshold for responder versus non-responder. CTLA-4, cytotoxic T-lymphocyte-associated protein 4; NSCLC, non-small cell lung cancer; PD-1, programmed cell death 1; PDX, patient-derived xenograft.
The treatment with checkpoint inhibitors increased the TIL rate predominantly in cold tumors
Under treatment with checkpoint inhibitors the immune cell population was upregulated mostly in the cold tumors whereas the hot tumors showed a less pronounced increase in immune cell infiltration. Therefore, the difference in CD45 +percentage, defining the hot and cold tumors in the untreated animals, was reduced to a degree that only in the anti-CTLA-4 treated group this value depicted a statically significant difference (p<0.041, figure 5A). Of note, in the most efficacious combination treatment arm, the percentage of CD45+/CD8 +cells was significantly higher in the hot tumors (p<0.029, multiple t-tests). To better understand the influence of the treatment on the immune cell infiltration, we plotted the fold changes between the untreated and the respective treatment arm for the different immune cell types in cold and hot tumors (figure 5B). It became obvious, that although the differences in absolute values were not apparent, specifically the cold tumors displayed a marked relative increase of immune cell infiltrates under treatment. Explicitly, the activated CD4 +and CD8+cells as well as the CD4/CD8 ratio was increased >100-fold in the cold tumors. In parallel, anti-programmed cell death 1 (PD-1) treatment reduced the rate of CD45 +cells to 56% and of the activated CD8 +cells to 59% of the untreated control. The examination of the hematopoietic organs revealed no obvious differences of human immune cell infiltrates in all settings (online supplemental figure 6A,B).
Supplemental material
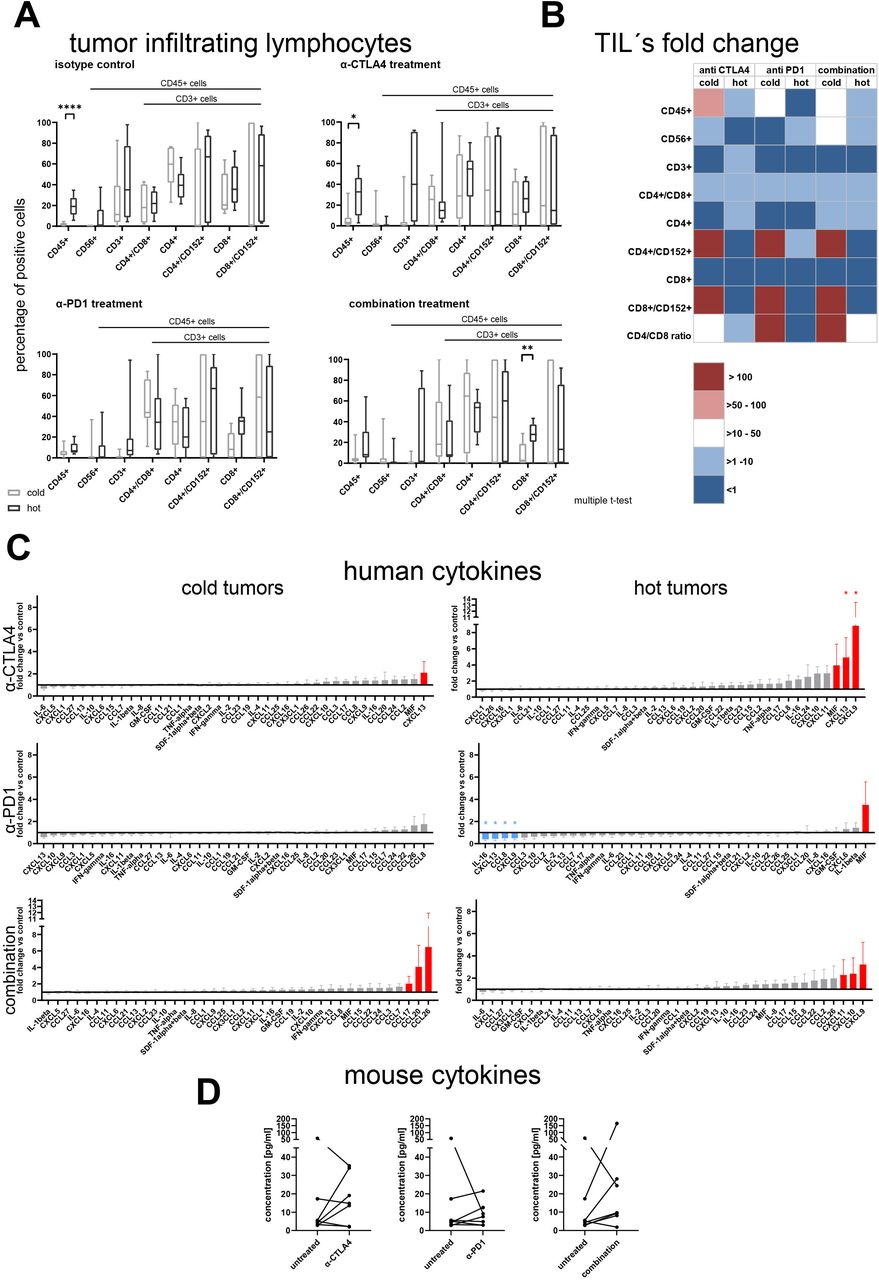
(A) Flow cytometry analysis of human immune cells in tumor of tumor bearing humanized NOD.Cg-PrkdcscidIl2rgtm1Wjl/SzJ mice at the last experiment day. A total of 42 animals bearing 14 different patient-derived xenograft models was assigned to different treatment arms and analyzed for infiltration of human immune cells. The individual data points are plotted as box plots with minimum and maximum as whiskers and median depicted as the line in the box. The difference between cold and hot tumors was significant for CD45 +in the group receiving isotype control or anti CTLA-4 treatment and for CD8 +cells in the combination treatment arm (p<0.00013, p<0.041 and p<0.029, multiple t-tests). (B) The fold change of the different immune cell populations in comparison to the respective untreated control arm was calculated per individual experiment and model. The mean values of the fold changes for the cold and the hot tumors were plotted as a heatmap. (C) Human cytokine and chemokine secretion of hot and cold tumors under treatment with different CPi’s. The fold changes for the cold and the hot tumors were plotted as a column bar graph with mean and SE of the mean. The fold changes >2 are highlighted in red, the fold changes <0.5 are highlighted in blue. Per analyte a ratio paired t-test was performed to determine statistical significance between the absolute values of the untreated control and the respective treatment arm. (D) Murine G-CSF levels in hot tumors under treatment with different CPi’s. The absolute values of murine G-CSF was plotted as before–after graph for the three different treatment arms. A ratio paired t-test was performed to determine statistical significance between the absolute values of the untreated control and the respective treatment arm. CPi, checkpoint inhibitor; CTLA-4, cytotoxic T-lymphocyte-associated protein 4; G-CSF, granulocyte colony stimulation factor; IL, interleukin; IFN, interferon; PD-1, programmed cell death 1; TIL, tumor-infiltrating lymphocytes; TNF, tumor necrosis factor.
Hot and cold tumors displayed an explicit cytokine pattern under treatment with checkpoint inhibitors
The human cytokines were regulated differently depending on the characteristic of the tumor and the treatment arm (figure 5C). In the cold tumors anti-CTLA4 treatment induced an upregulation of CXCL13, which was inter alia observed in the group of hot tumors. Anti-PD-1 monotherapy had no influence on the human cytokine profile of the cold tumors. In contrast the most effective combination arm induced an upregulation of CCL17, CCL20 and CCL26 (all n.s.). In the group of hot tumors, the anti-CTLA-4 monotherapy induced an increase in CXCL13 (p<0.037) expression but as well elevated levels of CXCL9 (p<0.02) and MIF (n.s.). In contrast anti-PD-1 treatment led to a decrease of four cytokines: CXCL9 (p<0.04), CXCL13 (p<0.047), CCL8 (p<0.04) and IL-16 (p<0.012). The combined checkpoint inhibitor (CPi) treatment led to an increase of CXCL9, CXCL10 and CXCL11 in the tumor tissue (all n.s.). The expression of murine granulocyte colony stimulation factor (G-CSF) was modulated in the group of hot tumors (figure 5D). Anti-CTLA-4 treatment induced an increase of G-CSF levels in the hot tumors leading to a mean fold change of 2.6 for the monotherapy and 3.4 in the combination arm (all n.s.). The expression pattern of the other murine cytokines was not markedly influenced by the treatment: the fold changes ranged between 0.6 and 1.9 (online supplemental figure 7).
Supplemental material
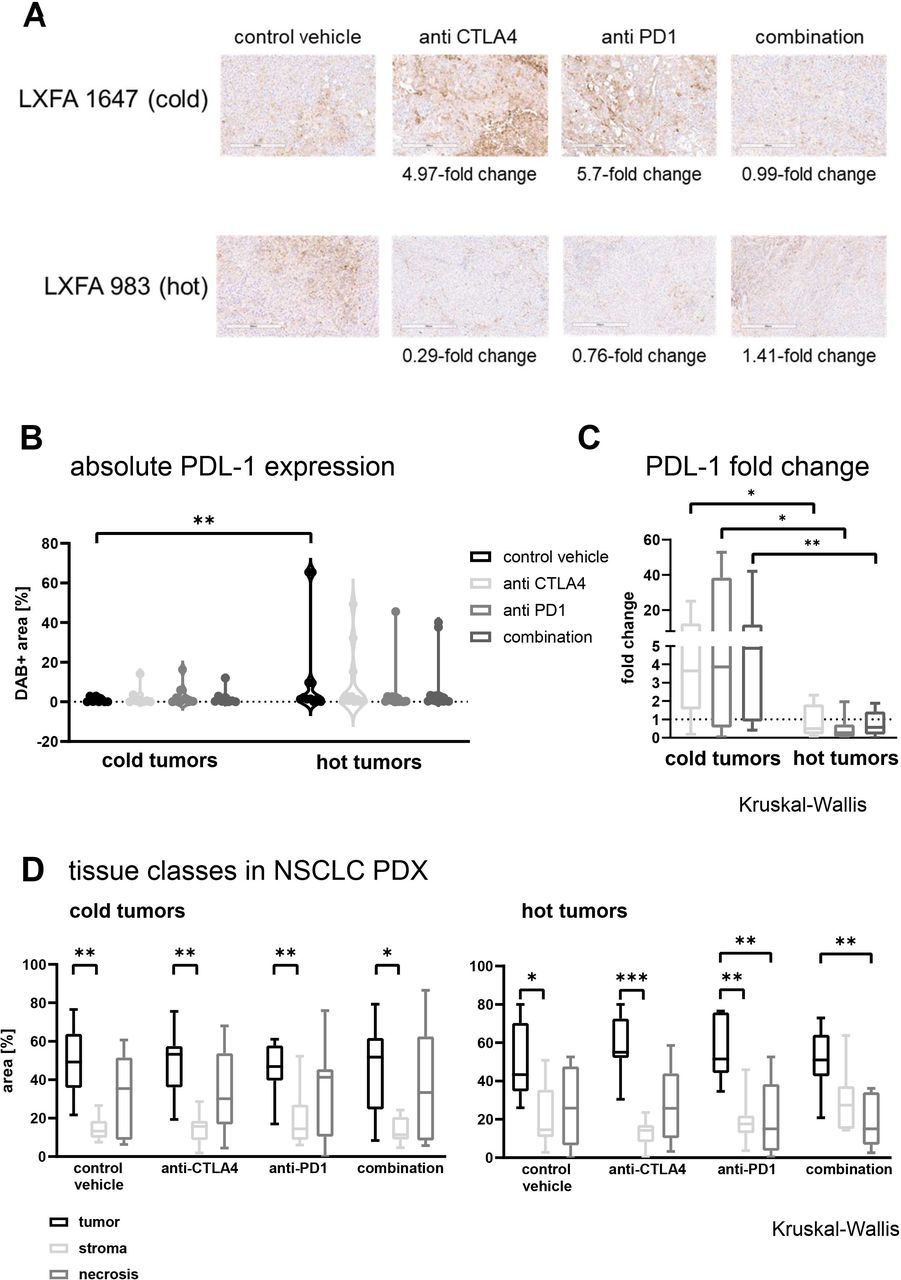
The expression of PD-L1 is modulated inversely in cold and hot tumors under treatment with checkpoint inhibitors
To determine the PD-L1 expression level, an IHC was performed on tumor tissue treated with anti-CTLA-4, anti-PD-1 or the combination thereof (figure 6A). In general, CPi treatment induced an upregulation of PD-L1 expression in cold tumors, whereas in hot tumors a moderate downregulation was observed. The absolute PD-L1 expression was significantly higher in hot tumors as in cold tumors of the untreated arms (p<0.008). The modulation of the PD-L1 expression under CPi treatment reduced the difference in the expression level to a non-significant level (figure 6B). The comparison of the fold changes in the cold versus the hot tumor group for the applied treatment regimen revealed statistically significant differences with p values of p<0.018 (anti-CTLA-4), p<0.014 (anti-PD-1) and p<0.008 for the combination (figure 6C). Of note, neither the fold change under treatment nor the PD-L1 expression level in the untreated tumors was predictive for the responsiveness towards any of the investigated treatments (online supplemental figure 8).
Supplemental material

The PD-L1 expression was determined by IHC in 14 different NSCLC PDX in the presence of human immune cells and under treatment with two different checkpoint inhibitors in monotherapy and combined therapy. The DAB +area was determined using the OSANO software by analyzing one whole slide per tumor model and setting: humanized untreated, humanized anti CTLA-4 treatment, humanized anti PD-1 treatment and humanized combination treatment, a total of 56 slides. (A) Representative 10× magnification jpegs were extracted of the scans (scale bar included) for one cold and one hot tumor model in the different treatment arms. (B) The fold change of PD-L1 expression versus the respective untreated control was calculated per model and plotted separately for cold and hot tumors. The individual data points are plotted as box plots with minimum and maximum as whiskers and median depicted as the line in the box. The dotted line a y=1 depicts the inflection point of downregulation (<1) towards upregulation (>1) of PD-L1. (C) The absolute values for the PD-L1 expression depicted as relative DAB +area (=percentage of analyzed area) within the different treatment arms was plotted separately for cold and hot tumors. The individual data points are plotted as violin plots with individual data points. (D) Using whole slide images of H&E-stained slides the percentage of the tissue classes tumor, stroma and necrosis were measured by a tissue classification algorithm, in 14 NSCLC PDX models. The tissue classes for cold and hot tumors in the different treatment arms are plotted as percentage of analyzed area. For each model and each treatment arm one whole slide scan was analyzed (n=7 for cold and hot tumors, respectively). The individual data points are plotted as box plots with minimum and maximum as whiskers and median depicted as the line in the box. CTCLA-4, cytotoxic T-lymphocyte-associated protein 4; DAB, 3,3′-Diaminobenzidin; LXFA, lung cancer xenograft Freiburg, adenocarcinoma; PD-1, programmed cell death 1 ; PD-L1, programmed cell death ligand 1; NSCLC, non-small cell lung cancer; PDX, patient-derived xenograft.
The distribution of the three major tissue classes was altered under treatment with CPi’s
The treatment with CPi’ had diverging impact on the proportion of the three major tissue classes tumor, stroma and necrosis. In the cold tumors the ratio between the three classes was stable across all treatment arms. In the hot tumors, anti-CTLA-4 treatment reduced the stroma content while enhancing the percentage of tumor area. Furthermore, anti-PD-1 treatment induced a reduction of necrosis, which was also true for the combination treatment (figure 6D).
The IHC based detection of TILs using whole slide image analysis mirrors the FC results of the SMT testing
To complement our data set using a clinically relevant technology, we determined the infiltration of human CD45 +cells by IHC. Like the tissue class quantification, we investigated the heterogeneity of immune cell infiltrate throughout one block in five representative NSCLC PDX models. As a measure for heterogeneity across the block, we plotted the mean percentage (±SD) of immune cells across the slides compared with the mean percentage (±SD) of the complete block. Despite LXFE 2324 the mean of the individual slide was within the range of the SD of the full stack (figure 7A). Again, following the validation step, we examined one WSI per setting in all subsequent analyses. The comparison of the percentage of DAB +nucleic area as a measure for immune cell infiltrates confirmed the FC data of the 14 NSCLC PDX models (figure 7B). The difference in immune cell infiltrates between cold and hot tumors was statistically significant in the untreated tissue. Specifically, under anti-PD-1 treatment the difference between the two groups became less prominent. Analogous to the FC data we compared the fold change of human immune cell infiltrates in the different treatment arms in cold and in hot tumors (figure 7C). Although the changes were more subtle as compared with the FC analysis, the trend was very similar: the immune cell infiltrates increased primarily in the cold tumors under treatment with checkpoint inhibitors while they stayed stable or even decreased in the hot tumors.
Using whole slide images of DAB stained anti-CD45 immunohistochemistry slides the presence of CD45 +cells in the slide was quantified as percentage of the DAB positive nuclei area of total nuclei area. (A) For five samples from untreated non-small cell lung cancer patient-derived xenograft the full stack as described in M&M was analyzed and the mean percentage and SD of part stacks plotted versus the mean percentage and SD of the full stack. (B) The percentage of DAB-stained CD45 positive area in relation to the full sample area for cold and hot tumors in the different treatment arms are plotted as percentage of analyzed area. For each model and each treatment arm one whole slide scan was analyzed (n=7 for cold and hot tumors, respectively). The individual data points are plotted as box plots with minimum and maximum as whiskers and median depicted as the line in the box. (C) The fold change of the CD45 +cell infiltration determined by percentage of DAB +area in comparison to the respective untreated control arm was calculated per individual experiment and model. The mean values of the fold changes for the cold and the hot tumors was plotted as a heatmap. CTLA-4, cytotoxic T-lymphocyte-associated protein 4; DAB, 3,3′-Diaminobenzidin; LXFA, lung cancer xenograft Freiburg, adenocarcinoma; LXFE, lung cancer xenograft Freiburg, epithelial; LXFE, lung cancer xenograft Freiburg, epithelial.
Discussion
The advent of immuno-oncology has revolutionized the landscape of cancer treatment.22–26 In parallel to the increasing number of patients benefitting from these new therapies, there is an increasing need for robust and predictive preclinical models reflecting interactions between tumors and their microenvironment. The identification of potential stratification markers, the evaluation of possible combination therapies and the identification of new targets needs to start in the preclinical space. Although syngeneic models have undeniable advantages, the need for an in vivo model expressing human specific targets in crosstalk with human immune cells is a necessity.27 28 In the current study, we developed and validated a preclinical in vivo platform by combining PDX and humanized mice as two gold standards for oncology and immunology. Within a panel of 14 NSCLC PDX, it was possible to identify hot and cold tumors similar to the clinical setting.29 In line with data from clinical studies in patients with NSCLC was the observation that the T cell subtypes displayed a very similar distribution in both classes.30 Interestingly, the percentage of natural killer cells was similarly low in cold and hot tumors, likewise mimicking the clinical situation (figure 2A).31 32 Furthermore, five out of seven biomarkers were differentially expressed in the hot and cold tumors: cytokine levels (figure 2B), PD-L1 expression and tumor/stroma ratio (figure 3), EMT score (online supplemental figure 4) and vascularization (online supplemental table 4). A treatment experiment in the SMT format revealed a response pattern very comparable to the clinic (figure 4).24 33 None of the investigated biomarkers was predictive towards CPi treatment. Nevertheless, the tumor models displayed a unique signature under treatment depending on their TIL rate (figures 5–7). Again, this reflects the clinical situation where a predictive biomarker has yet to be defined and the trend is moving towards defining exclusionary biomarkers related to lack of benefit and/or risk of adverse effects.1 2 34 35 The integration of different readouts is one advantage of the preclinical setting to enhance the possibility to identify early on predictive biomarkers.
The ability of PDX panels to mirror the landscape of the disease is well described by us and other groups.36 37 The possibility to quantify the observation that the histological features of the patient tissue are maintained in the mouse, increases the impact of this otherwise descriptive feature. The fact that FC as a gold standard in preclinical oncology and image analysis of WSIs as a read-out applicable in clinical routine diagnostic setting led to the same conclusions, highlight the translational value of the platform. The translational significance of the image analysis tool itself, was verified in a panel of human NSCLC samples from an unrelated cohort, confirming the robustness of the deep learning algorithm (figure 3E, online supplemental figure 5C). Although the relevance of TIL rate as a predictive marker for susceptibility towards CPi treatment remains to be fully elucidated,38 the fact that the former can be defined as a model immanent feature similar to the molecular make-up or the histological architecture of a specific PDX underpins the role of these models as a gold standard in an immuno-oncology setting. The treatment with CPIs turned immunologically ‘cold’ into ‘hot’ tumors, which explains the higher treatment sensitivity of the former group. The increased activity of the CPi combination treatment is a strong indicator supporting this assumption.23 It remains to be elucidated if the ‘cold’ tumors defined in this study based on TIL density may be composed of a mixture of ‘cold’, ‘immune-excluded’, and ‘immunosuppressed/immune desert’ tumors.
The use of PDX models inevitably raises the question how to tackle the intratumoral heterogeneity.5 39 In our study, we determined the degree of heterogeneity within one tumor by analyzing the distribution of the three major tissue classes and the distribution of CD45 + cells throughout the complete tumor sample (figure 7, online supplemental figure 5B). This validation strategy enables the use of PDX in preclinical I-O studies and improves the reliability of IHC markers as a translational readout in preclinical studies. As most of the companion diagnostics for patient stratification are based on IHC, this implies a strategic advantage to facilitate the transition of innovative drugs from the preclinical to the early clinical space.25 Nevertheless, those technical features must be re-evaluated for new targets as the robustness of the system not only rests on the characteristics of the model but also on the target expression pattern.40 41
To the best of our knowledge this is the first time that the feasibility of the SMT was systematically evaluated in an immuno-oncological setting applying computational pathology tools integrated with immunological (cytokine) profiling.12 The advantages of this screening format came into effect when testing immune modulating compounds to a similar extend as described before for traditional oncological drugs.42 Originally, designed as an in vivo screening platform,4 the SMT in combination with functional readouts can provide mechanistic insights into the mode of action and support the development of predictive biomarkers. The fact that there was no direct correlation between the PD-L1 expression level in tumor tissue and the sensitivity towards CPi treatment is in line with observations from clinical groups who aim to develop biomarkers for patient stratification in NSCLC and other cancer types.2 43–45
The use of large cytokine panels for functional analyses proved to be very promising. The increase in CCL26 under the most effective combination treatment can be most likely linked to an increase in hypoxia as cells expressing this chemokine independent of hypoxia are not present in the huNSG model.46 This hypothesis is additionally supported by the fact that the percentage of necrosis is particularly increased in the cold tumors of the combination treatment arm. The biological implications of the increased CXCL13 levels under CTLA-4 treatment cannot be fully elucidated, as the myeloid derived suppressor cells compartment targeted by this chemokine is heavily under-represented in the huNSG model (figure 5C,D).47 By the parallel evaluation of mouse and human cytokine levels it was possible to discriminate between cytokines derived from human tumor or immune cells and from the non-human tumor microenvironment. The species-specificity of the respective platforms enabled the deconvolution of this very complicated crosstalk.48–50 Although, the knowledge around cross-reactivity of human and mouse cytokines and their receptors is fragmented, it is essential to characterize the animal model in depth. With the systematic analysis of mouse models in different settings the interpretation of the results will gain translational value.51 52
Taken together, the successful development of biomarkers for immuno-oncology needs a deep mechanistic insight and understanding of biomarker expression in the context of mode of action. PDX models in huNSG have a high potential to close this gap between preclinical efficacy testing and clinical development of early companion diagnostics.
Supplemental material
Supplemental material
Data availability statement
Whole exome sequencing, RNA sequencing and scanned images are available in a public open accces repository. Request for the image analysis algorithm are available upon reasonable request. All data directly relevant to the study are included in the article or uploaded as supplementary information. RNASeq and whole exome Seq Data are available via https://www.ncbi.nlm.nih.gov/sra, PDX model image data is available via IDR (https://idr.openmicroscopy.org/tissue/). All further data relevant to the study are either uploaded as supplementary information or can be requested from senior authors JS (animal models), FF (digital and conventional pathology) or DM (digital pathology/image analysis).
Ethics statements
Patient consent for publication
Ethics approval
Mouse experiments were approved by the German Committee on the Ethics of Animal Experiments of the regional council (Permit Numbers: G-13/13 and G18/12). This study was carried out in strict accordance with the recommendations in the Guide for the Care and Use of Laboratory Animals of the Society of Laboratory Animals (GV SOLAS) in an AAALAC accredited animal facility.
Acknowledgments
We thank Nicole Krönke for excellent technical assistance and Hagen Klett for IT support.
References
Supplementary materials
Supplementary Data
This web only file has been produced by the BMJ Publishing Group from an electronic file supplied by the author(s) and has not been edited for content.
Footnotes
Contributors Conceptualization: EO, DB, AG, DM, FF and JS. Methodology: EO, DB, AG, SG, GN, DM, FF and JS. Validation: KL, AE and KK. Formal analysis: EO, DB, KL, AE and JS. Resources: GN, DM, FF and JS. Data curation: EO, DB, AG, NB, DL, AL, AB, VK, AE, KK and SG. Writing, original draft preparation: EO, AG and JS. Writing, review and editing: DM and FF. Visualization: DB, AG and NB. Supervision: DM, FF and JS. Project administration: JS. Funding acquisition: DM, FF and JS. Guarantor: JS
Funding This study was funded by the German Ministry of Education and Research (BMBF; approval #031B0006A-C).
Competing interests None declared.
Provenance and peer review Not commissioned; externally peer reviewed.
Supplemental material This content has been supplied by the author(s). It has not been vetted by BMJ Publishing Group Limited (BMJ) and may not have been peer-reviewed. Any opinions or recommendations discussed are solely those of the author(s) and are not endorsed by BMJ. BMJ disclaims all liability and responsibility arising from any reliance placed on the content. Where the content includes any translated material, BMJ does not warrant the accuracy and reliability of the translations (including but not limited to local regulations, clinical guidelines, terminology, drug names and drug dosages), and is not responsible for any error and/or omissions arising from translation and adaptation or otherwise.