Article Text

Abstract
Background Cancer immunotherapeutic strategies showed unprecedented results in the clinic. However, many patients do not respond to immuno-oncological treatments due to the occurrence of a plethora of immunological obstacles, including tumor intrinsic mechanisms of resistance to cytotoxic T-cell (TC) attack. Thus, a deeper understanding of these mechanisms is needed to develop successful immunotherapies.
Methods To identify novel genes that protect tumor cells from effective TC-mediated cytotoxicity, we performed a genetic screening in pancreatic cancer cells challenged with tumor-infiltrating lymphocytes and antigen-specific TCs.
Results The screening revealed 108 potential genes that protected tumor cells from TC attack. Among them, salt-inducible kinase 3 (SIK3) was one of the strongest hits identified in the screening. Both genetic and pharmacological inhibitions of SIK3 in tumor cells dramatically increased TC-mediated cytotoxicity in several in vitro coculture models, using different sources of tumor and TCs. Consistently, adoptive TC transfer of TILs led to tumor growth inhibition of SIK3-depleted cancer cells in vivo. Mechanistic analysis revealed that SIK3 rendered tumor cells susceptible to tumor necrosis factor (TNF) secreted by tumor-activated TCs. SIK3 promoted nuclear factor kappa B (NF-κB) nuclear translocation and inhibited caspase-8 and caspase-9 after TNF stimulation. Chromatin accessibility and transcriptome analyses showed that SIK3 knockdown profoundly impaired the expression of prosurvival genes under the TNF–NF-κB axis. TNF stimulation led to SIK3-dependent phosphorylation of the NF-κB upstream regulators inhibitory-κB kinase and NF-kappa-B inhibitor alpha on the one side, and to inhibition of histone deacetylase 4 on the other side, thus sustaining NF-κB activation and nuclear stabilization. A SIK3-dependent gene signature of TNF-mediated NF-κB activation was found in a majority of pancreatic cancers where it correlated with increased cytotoxic TC activity and poor prognosis.
Conclusion Our data reveal an abundant molecular mechanism that protects tumor cells from cytotoxic TC attack and demonstrate that pharmacological inhibition of this pathway is feasible.
- tumor escape
- immunotherapy
- cytokines
- immunomodulation
- CD8-positive T-lymphocytes
Data availability statement
Data are available in a public, open access repository. Gene Expression Omnibus public functional genomics data repository (accession code GSE202305).
This is an open access article distributed in accordance with the Creative Commons Attribution Non Commercial (CC BY-NC 4.0) license, which permits others to distribute, remix, adapt, build upon this work non-commercially, and license their derivative works on different terms, provided the original work is properly cited, appropriate credit is given, any changes made indicated, and the use is non-commercial. See http://creativecommons.org/licenses/by-nc/4.0/.
Statistics from Altmetric.com
WHAT IS ALREADY KNOWN ON THIS TOPIC
Tumor-intrinsic resistance to T cell (TC)-released cytokines, such as tumor necrosis factor (TNF)-α, has recently emerged as a major mechanism of tumor immune evasion. Yet, a deeper characterization of the genes that are responsible for this effect is needed.
WHAT THIS STUDY ADDS
Salt-inducible kinase 3 (SIK3) is a novel regulator of tumor-intrinsic resistance to cytotoxic TC attack.
SIK3 confers tumor cell protection from TC-released TNF by sustaining the expression of pro-survival and anti-apoptotic genes under the control of nuclear factor kappa B (NF-κB).
A TNF/SIK3/NF-κB-mediated gene signature correlated with significantly reduced patient survival in pancreatic cancer.
HOW THIS STUDY MIGHT AFFECT RESEARCH, PRACTICE AND/OR POLICY
Pharmacological inhibition of SIK3 might be an effective strategy to sensitize cancer cells to TC-based immunotherapies by rewiring tumor cell responses to TC-secreted TNF.
Background
Immunotherapeutic strategies that enhance T-cell (TC) activation and cytotoxicity have shown significant clinical success in several cancer indications.1 Nevertheless, a large proportion of patients do not benefit from these interventions due to the occurrence of primary, adaptive, or acquired resistance to cancer immunotherapy (CIT).2 Resistance mechanisms to CIT may have different origins, such as the onset of an immunosuppressive microenvironment that dampens the activity of immune cells against cancer.3 Alternatively, tumor-intrinsic resistance mechanisms may render tumor cells invisible, or refractory to the attack of cytotoxic TCs.4 Tumor-intrinsic unresponsiveness to TC-released perforin-granzyme B, Fas ligand, or proinflammatory cytokines, such as interferon-γ (IFN-γ) and tumor necrosis factor (TNF)-α, has recently emerged as a major mechanism of tumor immune evasion.3 5–10 So far, therapeutic approaches have largely focused on targeting immune modulatory ligand–receptor interactions between tumor cells and TCs in order to increase cytotoxic TC function. However, successful tumor immune rejection might be as much determined by the tumor cells’ individual response towards TC insult. Thus, a better understanding of the mechanisms that tumor cells exploit to evade the immune system is needed.
To address this, we conducted a genetic screening for genes that mediate tumor-intrinsic resistance to TC attack. We found that salt-inducible kinase 3 (SIK3) counteracts TC-mediated cytotoxicity by promoting TNF-induced nuclear factor kappa B (NF-κB) nuclear translocation and stabilization, leading to increased tumor cell survival and resistance against CIT. A TNF/SIK3/NF-κB-mediated gene signature was found in a vast majority of patients with pancreatic cancer with increased cytotoxic TC responses and correlated with significantly reduced patient survival. Thus, we reveal a novel molecular mechanism that protects tumor cells from cytotoxic TC attack.
Methods
Cell lines
Human pancreatic ductal adenocarcinoma cell line PANC-1 (ATCC® CRL-1469™; source: male), human breast carcinoma cell line MCF7 (ATCC® HTB-22™, source: female), human embryonic kidney cell line HEK293T (ATCC® CRL-1573™, source: female) and colonic cancer cell line SW480 (ATCC® CCL-228™, source: male) were acquired from American Type Cell Culture (ATCC). PANC-1 and MCF7 were cultured under standard conditions in Dulbecco’s Modified Eagle Medium (DMEM) media supplemented with 10% fetal calf serum, 100 U/ml penicillin G and 100 µg/ml streptomycin at 37 °C in a humidified atmosphere under 5% CO2. HEK293 and SW480 were cultured under standard conditions in Roswell Park Memorial Institute Medium (RPMI1640) media supplemented with 10% fetal calf serum, 100 U/ml penicillin G and 100 µg/ml streptomycin at 37 °C in a humidified atmosphere under 5% CO2. PANC-1-luc cells were generated after transfection with a pEGFP-luc plasmid (provided by Dr. Rudolf Haase, LMU Munich, Germany) and selected for the G418-resistance gene. TransIT (Mirus, Madison, USA) was used as transfection reagent according to the manufacturer’s instructions. PANC-1 NF-κB reporter cells were generated using transfection with a pGL4.32 luc2/NF-κB-RE/hygro plasmid (Promega, Madison, USA), selection with hygromycin and serial dilution for clonal selection. Lipofectamin 3000 (Thermo Scientific) was used as transfection reagent according to the manufacturer’s instruction.
Primary cell cultures
Primary melanoma M579 cells (isolated from an inguinal lymph node of a male patient with melanoma) were kindly provided by Professor Michal Lotem (Hadassah Hebrew University Medical Center, Israel) and cultured under standard conditions in complete melanoma media (60% DMEM, 20% RPMI1640, and 20% Ham’s F12 Nutrient Mixture) supplemented with 10% fetal calf serum, 1% 4-(2-hydroxyethyl)-1-piperazineethanesulfonic acid (HEPES), 100 U/mL penicillin G and 100 µg/mL streptomycin at 37°C in a humidified atmosphere under 5% CO2.
Tumor-infiltrating lymphocyte (TIL) isolation, expansion and culture
PANC-TIL and PANC-TIL2 were isolated from male patients with poorly differentiated pancreatic adenocarcinoma (PAAD) (PDAC) and enriched in CD8+ TCs by flow cytometric cell sorting. TIL209 and TIL412 were isolated from inguinal lymph nodes of patients with melanoma and were kindly provided by Professor Michal Lotem (Hadassah Hebrew University Medical Center).Tumors were dissected and small pieces were cultured in 24-well tissue culture plates in complete lymphocyte media (CLM) with 6000 IU/mL interleukin (IL)-2 for 14 days.11 The wells were checked for dense lymphocyte growth, and subsequently, the TILs were either frozen or expanded directly. Melanoma and PDAC-derived TILs were rapidly expanded using a modified version of the Rosenberg protocol.11 12 TILs were thawed in RPMI medium with 10% human serum and 50 U/mL benzonase. Subsequently, they were incubated for 2 days (6×10⁵ cells/mL in CLM with 6000 IU/mL IL-2) at 37°C and 5% CO2. Mitotically inactivated feeder cells were generated from peripheral blood mononuclear cell buffy coats of healthy donors (three different donors) by irradiation with 60 Gy (Gamacell 1000). TILs were cocultured with feeder cells in a 1:100 ratio (eg, 2×10⁶ TILs and 200×106 feeders) in 400 mL expansion medium (CLM/AIM-V 50/50) supplemented with 30 ng/mL OKT3 antibody and 3000 IU/mL IL-2 for 5 days without moving in a G-Rex 100 cell culture flask. Afterwards, 250 mL supernatant was replaced with 150 mL of fresh expansion medium supplemented with 3000 IU/mL IL-2 (for the complete 300 mL). On day 7, the TILs were resuspended in the medium and distributed into 3 G-Rex 100. One hundred fifty millilitres of AIM-V with 5% AB serum and 3000 IU/mL IL-2 (for the complete 250 mL) was added. On day 11, 150 mL of AIM-V with IL-2 was added to each flask. On the 14th day of rapid expansion, TILs were collected and counted. TILs were frozen in aliquots of 20×106 in freezing media A (60% AB serum and 40% RPMI1640) and B (80% AB serum and 20% DMSO (Dimethyl sulfoxide).
After sufficient expansion TILs were aliquoted and cultured in CLM: RPMI1640, 10% human AB serum (Valley Biomedical), 1% HEPES, 100 U/mL penicillin G, 100 µg/mL streptomycin, and 0.01% beta-mercaptoethanol) supplemented with 3000 IU/mL IL-2 at 37°C in a humidified atmosphere under 5% CO2 for 48 hours. Subsequently, TILs were deprived of IL-2 (CLM without IL-2) for 24 hours in the same setting before experiments.
Reverse small interfering RNA (siRNA) transfection
Briefly, for siRNA transfections, RNAiMAX (Thermo Scientific) was used. Two hundred microlitres of 250 nM siRNA solution was added to each well of a six-well plate. Four microlitres of RNAiMAX transfection reagent was diluted in 200 µL of RPMI (Merck Millipore) and incubated for 10 min at RT. Four hundred microlitres of RPMI was added, and 600 µL of RNAiMAX mix was given to the wells coated with siRNA and incubated for 30 min at RT. PANC-1 (2×10⁵, wild type (WT) or PANC-1-luc), or 4×10⁵ M579 cells were resuspended in 1.2 mL DMEM medium containing 10% FCS, seeded in the siRNA-RNAiMAX containing wells, and incubated for 72 hours at 37°C, 5% CO2. For 96-well plate transfection, the aforementioned protocol was proportionally scaled down. All siRNAs were purchased from Dharmacon (Horizon). SIK3 siRNA deconvolution experiment was performed using siGENOME siRNA reagents–set of 4. The SIK3 siRNA sequence 1 was used for all other experiments.
Luciferase-based cytotoxicity assay
Tumor cells expressing the luciferase reporter gene were reverse transfected with the indicated siRNA. For the viability setting, only culture medium was added to tumor cells. For the cytotoxicity setting, either TILs, survivin-specific TCs, the supernatant of activated TILs (conditioned medium) or recombinant tumor necrosis factor (rHuTNF) was added to transfected tumor cells at desired effector to target (E:T) ratios or concentration and incubated for 20 hours at 37°C, 5% CO2. After coculture, the supernatant was removed and the remaining tumor cells were lysed using 40 µL/well of cell lysis buffer for 10 min. Luciferase assay buffer (60 µL/well) was added and luciferase activity was measured using a microplate reader (TECAN, Männedorf, Switzerland). Luciferase activity is proportional to the amount of remaining live tumor cells. When indicated, raw data were normalized to negative controls. In some cases, data were shown as cytotoxicity:viability ratio. In this case, raw values were first normalized to negative control (siCtrl or DMSO) and then the ratio between the condition with TCs (cytotoxicity) versus condition with culture medium (viability) was calculated. Anti-epithelial cell adhesion molecule (EpCAM) x CD3 and anti-CD19 x CD3 bispecific antibodies (BsAbs) were generated at DKFZ by Dr. Gerd Moldenhauer.
RNAi screening
The primary RNAi screening was conducted as described,13 using a sublibrary of the genome-wide siRNA library siGENOME (Dharmacon; GE Healthcare, Munich, Germany) comprising 2887 genes (online supplemental table S1).8 In short, each well contained a pool of four non-overlapping siRNAs targeting the same gene. Positive and negative siRNA controls were added in each 384-well plate. Read-out was performed using the Mithras reader (Berthold, Bad Wildbad, Germany) with 0.1 s counting time. In addition to the luciferase-based primary screening, PANC-1 WT cells were reversed transfected with the siRNA library and an additional viability screening was conducted using the CellTiter-Glo (CTG) assay (Promega). Raw relative luminescence units from the primary screening were processed using the cellHTS2 package in R/Bioconductor. Values from both conditions were quantile normalized against each other using the aroma.light package in R. Differential scores (cytotoxicity vs viability) were calculated using the locally estimated scatterplot smoothing (LOESS) local regression fitting. To identify candidate hits, the following thresholds were applied on the −z-scores of the samples: for the viability setting, genes showing a –z of >2.0 or –z of <1.0 were excluded. For the cytotoxicity setting, programmed death ligand 1 (PD-L1) was used as threshold score. Additionally, genes having a score of >2.55 or <−1.55 in the CTG-based viability screening were filtered out from the candidate list. For the secondary screening, a customized library containing 155 selected siRNA pools from the primary screening was used in 96-well plates, and siRNA transfected tumor cells were in parallel challenged with TILs (E:T=25:1) and survivin-specific TCs (E:T=5:1).
Supplemental material
In vivo experiments
Short hairpin (sh)Ctrl-M579 tumor cells were generated by viral transfection using NTS2 viral partcles (Mission PLKO.1 puro non-targeting shRNA High titer, SHC016H; Sigma). SIK3-specific shRNA (shSIK3)-M579 tumor cells were generated using SIK3 sh3 (clone: 37452-TRCN0000037452, target sequence: GCCAGGCTTTATCTTATCAAA; Sigma). Tumor cells were subjected to puromycin selection prior to usage. NOD/SCID gamma chain knockout (NSG) mice were subcutaneously injected with 3×10⁵ shSIK3-M579 or shCtrl-M579 cells each into the right and left flanks of one mouse, respectively. After 3, 10, 17, and 24 days, mice received 1×10⁶ TIL209 intravenously. Tumor volumes were determined using the following formula: tumor volume (mm2)=(width2×length)/(π/3).
TIL supernatants
TILs (1×10⁶) were stimulated with 25 µL of Human T-Activator CD3/CD28 Dynabeads (Thermo Scientific), distributed in a 96-well plate (U-bottom) at 120 µL/well. Alternatively, 1.2×10⁵ TILs were stimulated with 2.4×10³ PANC-1 cells. After 24 hours of stimulation (polyclonal or tumor stimulation), plates were centrifuged at 450×g for 5 min and 100 µL/well of the supernatant was collected for cytokine detection or for further functional assays.
Functional neutralization and blocking assays
Anti-TNF (500 ng/ml; Abcam, anti-TRAIL (1 µg/ml; Abcam) anti-FASL (10 µg/ml; Biolegend) or respective isotype control monoclonal antibodies (mABs) (Abcam, Biolegend) were pre-incubated with the supernatant of activated TILs (polyclonal activation) for 1 h. Antibody-treated supernatants were used to stimulate siRNA transfected PANC-1-luc cells. For SIK inhibition 2 x 10⁵ PANC-1-luc cells/well were incubated overnight in a 96 well plate. HG-9-91-01 was added at the indicated concentrations simultaneously with TILs (E:T = 50:1) or rHuTNF (final concentration:100 ng/ml; Prof. Daniela Männel, University of Regensburg). After 24h stimulation, luciferase-based cytotoxicity assay was performed. For blockade of TNFR-I, anti-TNFR-I mAb (20 µg/ml; Hycult biotech, Uden Netherland) or isotype control was incubated with rHuTNF (50 ng/ml) (for 1 h at 37 °C, 5% CO2. Antibody-treated rHuTNF media or control medium were used to stimulate PANC-1-luc cells for 24h before analysis.
RNA sequencing
PANC-1 cells were transfected either with Ctrl or SIK3-specific siRNA and treated with 100 ng/mL rHuTNF for up to 4 hours or left untreated. Afterwards, tumor cells were harvested using the RNeasy mini kit (Qiagen) according to the manufacturer’s instructions. RNA from unstimulated siRNA-transfected tumor cells was used as negative control. RNA-seq libraries were generated using the ScriptSeq Complete Kit (Illumina, San Diego, USA) according to the manufacturer’s instructions. Libraries were sequenced paired-end (2×75 bp) on a HiSeq 3000 at the BSF Biomedical Sequencing Facility (CeMM Research Center for Molecuar Medicine, Austrian Academy of Sciences, Vienna, Austria). Raw fastq data were quality controlled using FastQC (http://www.bioinformatics.babraham.ac.uk/projects/fastqc/) and mapped to the annotated GRCh38 assembly of the human genome using STAR V.2.514 and the following parameters: --alignSJoverhangMin 8 --alignSJDBoverhangMin 1 --alignMatesGapMax 1000000 --alignIntronMax 1 000 000, and --quantMode GeneCounts. Differentially expressed genes were analyzed using edgeR15 and visualized using software packages in R. Gene set enrichment analyses were done using EnrichR.16 RNA sequencing data have been deposited in the Gene Expression Omnibus (GEO) public functional genomic data repository under accession code GSE202305.
Assay for transposable-accessible chromatin with sequencing (ATAC-seq)
Chromatin accessibility mapping was performed using the ATAC-seq method as previously described,17 with minor adaptations. Briefly, in each experiment, ~50 000 sorted cells were pelleted by centrifuging for 10 min at 4°C at 500×g. After centrifugation, the pellet was carefully lysed in 50 µL resuspension buffer supplemented with NP-40 (Sigma), Tween-20, and Digitonin (10 mM Tris–HCl pH 7.4, 10 mM NaCl, 3 mM MgCl2, 0.1 % NP-40, 0.1% Tween-20, 0.01% Digitonin), and incubated for 3 min on ice. Then, 1 mL of ice-cold resuspension buffer supplemented with 0.1% Tween-20 was added, and the sample was centrifuged at 4°C at 500×g for 10 min. The supernatant was discarded, and the cell pellet was carefully resuspended in the transposition reaction (25 µL 2× TD buffer (Illumina), 2.5 µL TDE1 (Illumina), 16.5 µL phosphate-buffered saline (PBS), 5 µL nuclease-free water, 0.5 µL 1% Digitonin (Promega), and 0.5 µL 10% Tween-20 (Sigma)) for 30 min at 37°C on a shaker at 1000 rpm. Following DNA purification with the Clean and Concentrator-5 kit (Zymo) eluting in 23 µL, 2 µL of the eluted DNA was used in a quantitative 10 µL PCR reaction (1.25 µM forward and reverse custom Nextera primers,17 1× SYBR green final concentration) to estimate the optimum number of amplification cycles with the following programme: 72°C 5 min, 98°C 30 s, 25 cycles: 98°C 10 s, 63°C 30 s, 72°C 1 min; the final amplification of the library was carried out using the same PCR programme and the number of cycles according to the Cq value of the quantitative PCR (qPCR). Library amplification using custom Nextera primers was followed by solid-phase reversible immobilization (SPRI) size selection with AmpureXP beads to exclude fragments larger than 1200 bp. DNA concentration was measured with a Qubit fluorometer (Life Technologies). The libraries were sequenced using the Illumina NextSeq550 platform using a High Output Kit (75 cycles) in paired-end mode. ATAC-seq data have been deposited in the GEO public functional genomic data repository under accession code GSE202305.
TNF–SIK3–NF-κB-mediated gene expression index
Dataset: RNA-Sequencing data (RSEM values for 20 501 genes ranging from 0 to 106) from the second analysis pipeline (RNASeq V.2) for the PAAD cancer type together with matching clinical data was downloaded fromThe Cancer Genome Atlas (TCGA) Data Portal with the TCGA2STAT R package in V.1.2.18 The original SIK3/TNF-mediated signature consists of 205 genes, but only 184 genes (90%) were available on the PAAD dataset. Only primary tumor samples were used for statistical analysis. A TNF/SIK3-mediated gene expression index was calculated as described further.
Quantification and statistical analysis
Statistical analyses were conducted using Prism software V.6.0 (GraphPad Software, La Jolla, California, USA). Results were reported as mean±SEM (SE of the mean) as indicated in the figure legends unless otherwise stated. We performed analyses of significance using Student’s t-test assuming equal variance. Continuous biological variables were assumed to follow a normal distribution. A p value of <0.05 was considered to indicate statistical significance. All experiments with representative images have been repeated at least twice and representative images are shown.
For statistical analysis of the TNF–SIK3–NF-κB-mediated gene expression index, an estimation of the extent of regulation of the SIK3/TNF-mediated signature on the PAAD profiles was performed by calculating a single representative value (index) for each sample from the signature consisting of 184 genes by fitting a standard additive model with independent gene and sample effects using Tukey‘s median polish procedure as previously described.19 20 The survival probability was estimated by the Kaplan-Meier method, and differences were compared using the log-rank test. Both methods were applied as implemented in the R package survminer V.0.3.1.21 The data matrix was scaled to standard units (z-scores) in order to make the expression values for selected genes comparable as the expression level of the genes varies.
Results
High-throughput screening reveals multiple immune modulatory genes in human pancreatic cancer cells
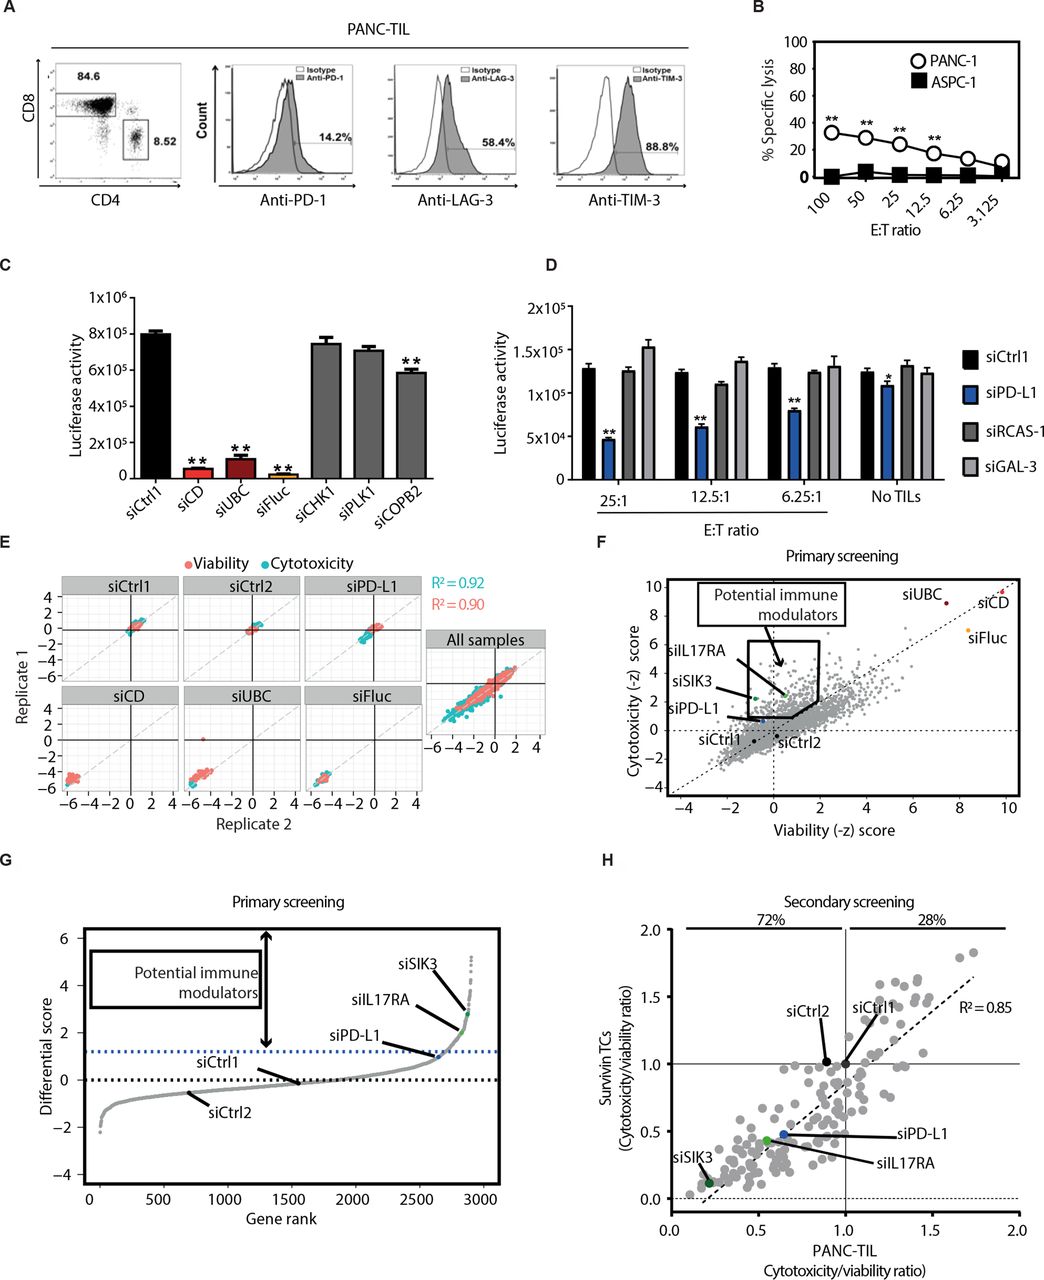
To systematically identify genes that regulate tumor response towards TC attack, we adapted a high-throughput siRNA-based screening approach that was developed in our laboratory.8 13 Due to its particular immune-resistant phenotype, we focused on pancreatic cancer. We targeted 2887 genes, including a broad spectrum of kinases, G-protein-coupled receptors (GPCRs) and other surface molecules (online supplemental table S1)8 in PANC-1-luc cells using a siRNA library followed by coculture with patient-derived and HLA-matched tumor-infiltrating lymphocytes (PANC-TIL). PANC-TIL mainly consisted of CD8+ TCs and showed an exhausted phenotype, as detected by expression of PD-1, LAG-3, and TIM-3 (figure 1A).22 We observed modest killing activity on coculture of PANC-TIL with HLA-201+ PANC-1 cells, but not with HLA-201− ASPC1 cells (figure 1B). Blockade of major histocompatibility complex I (MHC-I) resulted in impaired cytotoxicity of PANC-TIL towards PANC-1 cells (online supplemental figure S1A), demonstrating that tumor cell killing occurred via T-cell receptor (TCR) engagement. Notably, MHC-I blockade did not completely abrogate tumor cell killing, suggesting that TCR-independent killing mechanisms may concomitantly occur in this coculture model. Additionally, PANC-TIL secreted IFN-γ on coculture with tumor cells (online supplemental figure S1B). The screen was run in the presence (cytotoxicity setting) or in the absence (viability setting) of cytotoxic TCs to exclude genes whose knockdown intrinsically affected cell viability. We detected >97% reduction of luciferase activity in PANC-1-luc cells after transfection with luciferase-specific siRNA, demonstrating efficient delivery of siRNAs in tumor cells (figure 1C). To identify positive controls for the viability setting, several known essential genes were knocked down in tumor cells.23–26 Among them, transfection with siRNAs targeting ubiquitin C or a cocktail of siRNAs targeting multiple essential genes (siCD) strongly impaired tumor cell viability (figure 1C). To identify positive controls for the cytotoxicity setting, several tumor-associated immune modulators27–29 were depleted in tumor cells using siRNAs. Of note, PD-L1 knockdown resulted in increased tumor cell death in the presence of cytotoxic TCs while having modest impact in the absence of TCs. PD-L1 knockdown was observed at both mRNA and protein levels (online supplemental figure S1C,D).
Supplemental material

HT screening reveals multiple immune modulatory genes in human pancreatic cancer cells. (A) Characterization of PANC-TILs used for the primary HT screen. TILs were isolated from HLA-A201+PDAC biopsies, enriched in CD8+ subset and subjected to rapid expansion protocol. Left panel: CD4 and CD8 expression. Right panel: flow cytometry analysis for the exhaustion markers PD-1, LAG-3 and Tim-3 in CD3+CD8+ subpopulation. (B) Chromium release assay after 6-hour coculture of HLA-A201+ PANC-1 or HLA-A201− ASPC-1 target cells with PANC-TIL using different E:T ratios. (C) Selection of viability controls (condition without PANC-TIL). PANC-1-luc cells were transfected with siRNA sequences, and luciferase-based cytotoxicity assay was performed (see the Methods section). (D) Selection of cytotoxicity controls. PANC-1-luc cells were transfected as in (C) with siRNA sequences targeting known immune modulators and subsequently cocultured with PANC-TIL at the indicated E:T ratios or culture medium. Luciferase-based cytotoxicity assay was performed. (E) Performance of viability and cytotoxicity controls in the primary HT screening. PANC-1 luciferase activity was measured in 384-well format after transfection with the siRNA library and the indicated control siRNA. Technical replicates were plotted against each other. Blue dots: cytotoxicity readout (with PANC-TIL), red dots: viability readout (without PANC-TIL). (F) Dot plot showing −z-scores of plate-normalized luciferase activity from transfected PANC-1-luc cells after coculture with TILs (cytotoxicity −z-score) or with culture medium (viability −z-score), using an siRNA library of 2887 genes plus controls. Cytotoxicity −z-score: influence of gene knockdown on TIL-mediated killing. Positive values: decreased cell viability. The black box shows genes which were considered as potential negative immune modulators. (G) Differential score between cytotoxicity and viability −z-scores using local regression (LOESS) rank. Genes with differential score higher than PD-L1 knockdown were selected. (H) Secondary screening using both PANC-TIL and antigen-specific surviving TCs. An siRNA library with the top 155 hits from the primary screening was used to transfect PANC-1-luc cells. Tumor cells were cocultured with indicated TC source for 20 hours and luciferase activity was measured. Cytotoxicity:viability ratio was calculated (see the Methods section). R2 is the Pearson correlation of cytotoxicity:viability ratios between survivin-specific TCs and PANC-TIL-based screens. (A–D) Graphs show representative data of at least two independent experiments. (B–D) graphs show mean±SEM. P values were calculated using two-tailed Student t-test. *P<0.05, **P<0.01. E:T, effector to target; HT, high throughput; PDAC, pancreatic ductal adenocarcinoma; PD-L1, programmed death ligand 1; siCD, siRNAs targeting multiple essential genes; siFluc, luciferase-specific siRNA; siUBC, siRNA targeting ubiquitin C; TC, T cell; TIL, tumor-infiltrating lymphocyte.
Robust technical performance of the screen was reflected in the high correlation scores between replicates (Pearson correlation: cytotoxicity readout=0.92, viability readout=0.90) as shown in figure 1E. Performance of the non-targeting control siRNAs, positive immune checkpoint control and positive viability control siRNAs, included on each screening plate, is also summarized in figure 1E. Altogether, these data confirmed the reliability and robustness of the screen. To identify genes with immune modulatory function, we excluded those hits whose knockdown markedly affected tumor cell viability per se as determined through a viability set-up (figure 1F). Genes were ranked according to their performance in the cytotoxicity versus viability readout, and only genes whose downregulation showed a stronger immune checkpoint phenotype than PD-L1 knockdown were selected (figure 1G). This procedure revealed 155 genes, among which IL17RA was already described as a tumor-associated immune modulatory receptor.30 To confirm the immune modulatory potential of this primary hit list, we performed a secondary screen. In addition to PANC-TIL, we used antigen-specific TC clones recognizing the survivin protein (survivin TCs),13 which is expressed by PANC-1 cells31(figure 1H). Immune modulatory activity against both the antigen-specific TC clone and patient-derived TILs was confirmed for 70% of the primary hits, resulting in 108 genes with potential immune regulatory function expressed by human pancreatic cancer. Overall, we detected a high correlation between the two TC sources (Pearson correlation=0.85)
SIK3 modulates intrinsic tumor resistance to cytotoxic TCs in several coculture models of human cancer
One of the genes showing the strongest phenotypes in the primary and secondary screen was SIK3 (figure 1F–H). SIK3 is a serine/threonine kinase involved in cell cycle progression and tumorigenesis and is overexpressed in several tumors such as breast, colorectal, and ovarian cancer.32 33 Yet, its role in cancer immune evasion has not been addressed so far.
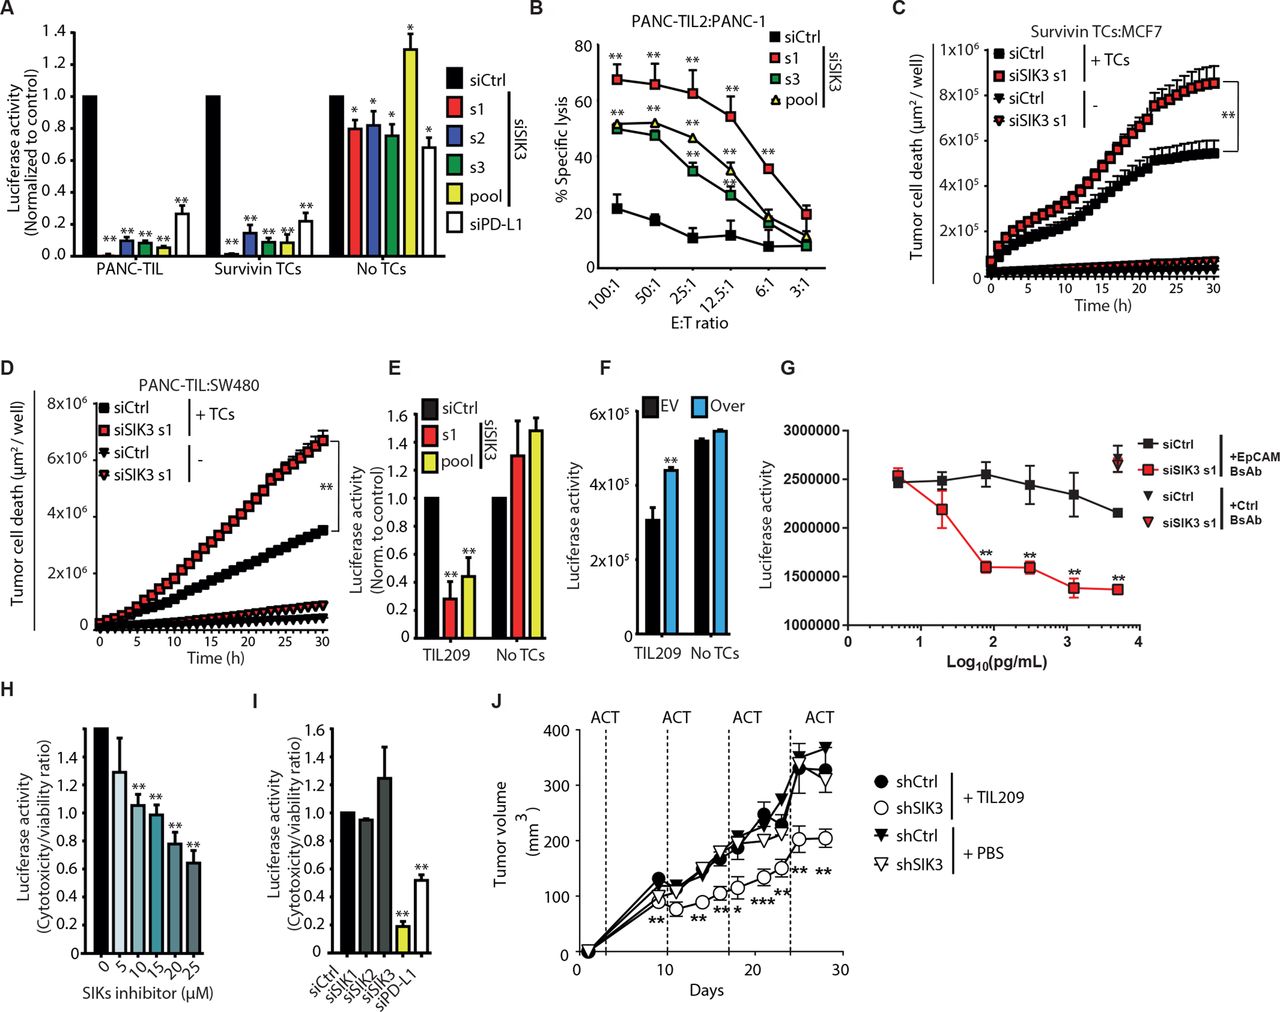
To validate on-target selectivity of SIK3-targeting siRNAs used for the screen, we transfected PANC-1-luc cells either with the three non-overlapping SIK3-specific siRNAs or with the siRNA pool used in the screen. Each of the single siRNA sequences induced an efficient SIK3 knockdown at both mRNA (online supplemental figure S2A) and protein (online supplemental figure S2B) levels, and reproduced the immune modulatory effect observed in the screen (figure 2A). In accordance with the screening results, SIK3 silencing provided a stronger tumor lysis than PD-L1 depletion (online supplemental figure S2C) with no major effect on tumor cell viability in the absence of TCs. This was confirmed by another luciferase-independent assay (WST-1) of cell viability (online supplemental figure S2D).

SIK3 inhibits TC-mediated killing across solid tumors. (A) Luciferase-based cytotoxicity assay using different siRNA sequences targeting SIK3 or controls. Data were normalized to siCtrl. (B) Chromium release assay for the detection of TC-mediated cytotoxicity of PANC-1 cells after 6-hour coculture with PANC-TIL2. (C,D) Real-time live cell microscopy for the evaluation of tumor cell death using YOYO-1 dye. Seventy-two hours after siRNA transfection, MCF-7 (C) and SW480 (D) were cocultured either with survivin TCs or with TILs, respectively. Graph shows the area of YOYO-1+ dead cells/well (µm2/well). (E) M579-luciferase expressing melanoma cells were transfected with indicated siRNAs and cocultured with HLA-201+-matched melanoma TILs. TC-mediated cytotoxicity was assessed as in (A). (F) M579 cells were transfected with SIK3 ORF (Over) or EV. TC-mediated cytotoxicity was assessed as in (A). Data were normalized to siCtrl1. (G) siSIK3 or siCtrl PANC-1-luc cells were cocultured with EpCAM×CD3 (EpCAM BsAb) or control CD19×CD3 (Ctrl BsAb) bispecific antibodies in the presence of CD8+ TCs from healthy donors. TC-mediated cytotoxicity was measured as in (A). (H) PANC-1-luc cells were cocultured with PANC-TIL in the presence of increasing concentrations of the pan-SIK inhibitor HG-9-91-01. TC-mediated cytotoxicity was measured as in (A). (I) Luciferase-based cytotoxicity assay of siRNA-transfected PANC-1-luc cells challenged with PANC-TIL after knockdown of SIK family member proteins or controls. Cytotoxicity:viability ratio was calculated (see the Methods section). (J) shCtrl or shSIK3 M579 melanoma cells were coengrafted subcutaneously in NSG mice subjected to ACT of TIL209 or PBS (n=9). Mean±SEM tumor volume. Statistical difference was calculated using unpaired Mann-Whitney U test. Data information: (A,E,H) cumulative data of three independent experiments and (B–D,F,G,I,J) representative data of at least two independent experiments. Columns show mean±SEM. P values were calculated using two-tailed Student t-test. *P<0.05, **P<0.01. E:T, effector to target; EV, empty vector; shSIK3, SIK3-specific shRNA; SIK3, salt-inducible kinase 3; TC, T cell; TIL, tumor-infiltrating lymphocyte.
Chromium release assay was conducted as a luciferase-independent standard test for specific TC lysis of PANC-1 cells after coculture with a different TIL derived from primary PDAC (PANC-TIL2) (figure 2B), which confirmed increased TIL-mediated killing of SIK3 knockdown tumor cells. SIK3 also regulated immune responsiveness in other cancer entities since its silencing in breast (MCF-7) and colorectal (SW480) cancer cell lines caused a strong increase of tumor cell death after coculture with survivin-specific TCs or TILs, respectively (figure 2C,D). In a primary melanoma coculture model, abrogation of SIK3 potentiated TIL-mediated cytotoxicity (figure 2E), whereas overexpression of SIK3 dampened the cytotoxic potential of TIL209 (figure 2F). In addition to improving antigen-specific TC-mediated cytotoxicity, SIK3 knockdown also increased EpCAM×CD3 bispecific antibody-induced cytotoxicity (figure 2G).
In order to investigate a direct functional role of SIK3 kinase activity in cancer immune evasion, we treated TC–tumor cocultures with increasing concentrations of HG-9-91-01, an SIK family kinase inhibitor,34 which recapitulated improved TIL-mediated killing in a dose-dependent manner (figure 2H). As this compound targets the family members SIK1 and SIK2 in addition to SIK3, we evaluated the individual impact of SIK isoforms in modulating TC-mediated cytotoxicity. However, knockdown of SIK1 and SIK2 did not improve TC-mediated killing compared with SIK3 knockdown (figure 2I). To confirm the role of SIK3 in mediating cancer resistance against immune attack in vivo, we stably knocked down SIK3 in human M579 tumor cells using shSIK3. We engrafted shSIK3 and WT cells into immune-deficient NSG mice and treated them by intravenous injections of TIL209. SIK3-proficient tumors were resistant against TIL209 treatment, while the growth of SIK3-deficient tumors was significantly delayed by TIL therapy (figure 2J).
SIK3 regulates tumor cell sensitivity to cytotoxic TC effector molecules
Cancer cells can exploit several mechanisms to evade immune-mediated destruction. These mechanisms may either dampen immune cell activity or decrease tumor sensitivity to effector molecules expressed by immune cells. SIK3 impairment in tumor cells did not improve TC activity, indicated by the production of effector molecules like IFN-γ, perforin or granzyme B in TC (online supplemental figure S3A-C). Hence, we hypothesized a role of SIK3 in mediating tumor cell resistance towards cytotoxic TC molecules. SIK3-depleted tumor cells were efficiently killed by the conditioned medium from activated TILs (Sup TILs), while their SIK3-proficient counterparts were resistant against this challenge (figure 3A,B). Of note, supernatant of unstimulated TCs did not alter tumor cell survival after SIK3 siRNA transfection (figure 3A). In line with its function as immune modulator, PD-L1 knockdown did not sensitize tumor cells towards TC effector molecules (figure 3B). Therefore, SIK3 is an intrinsic mediator of tumor cell resistance towards cytotoxic molecules released by activated TCs.
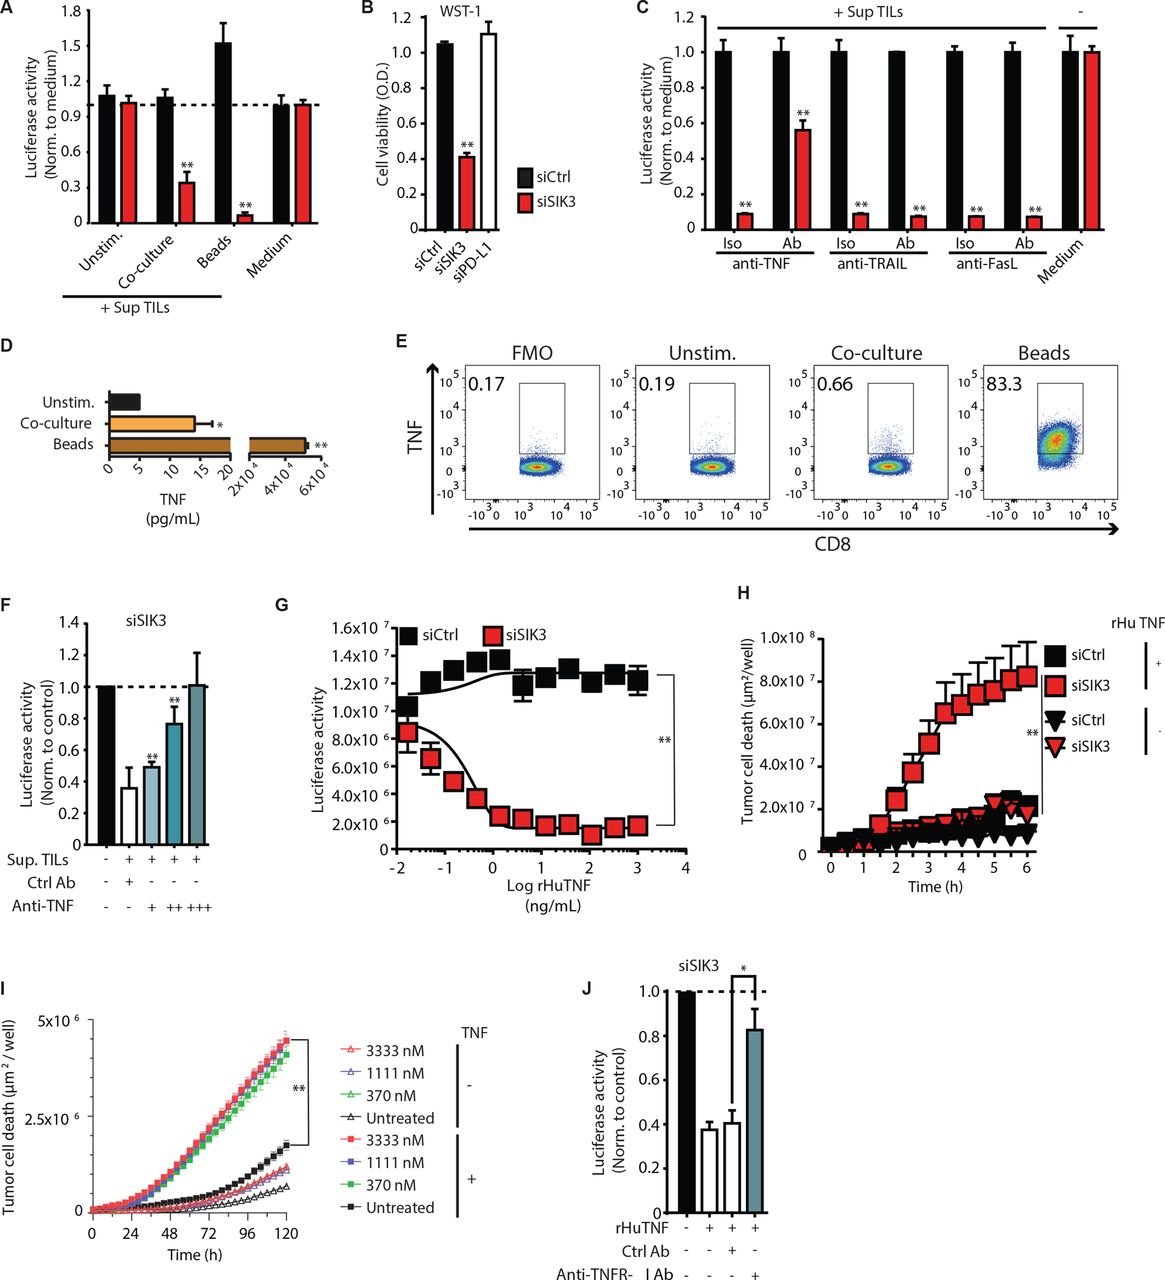
SIK3 mediates resistance to TNF secreted by activated TCs. (A) SIK3 depletion sensitizes tumor cells to conditioned media from activated TCs. PANC-1-luc cells were transfected with the indicated siRNAs. After 72 hours, cells were treated with the supernatant of unstimulated, tumor-activated or polyclonally activated TILs (by anti-CD3/CD28 beads), and tumor cell survival was determined by analysis of luciferase activity. (B). WST-1 assay for the assessment of cell viability of siRNA-transfected PANC-1 cells after challenge with the conditioned of polyclonally activated TILs. (C) Identification of TC effector molecules upstream of SIK3. PANC-1-luc cells were transfected with indicated siRNAs for 72 hours and subjected to the supernatant of polyclonally activated TILs. Stimulation was conducted in the presence of anti-TNF, anti-TRAIL or anti-FasL Ab or Iso controls. luciferase-based cytotoxicity assay was conducted to determine cytotoxicity of tumor cells on the indicated treatment. (D) Luminex assay for the detection of secreted TNF from PANC-TIL. TILs were cocultured either with PANC-1 cells or polyclonally stimulated. Unstimulated TILs were used as negative control. (E) Catch assay for the detection of TNF-secreting CD8+ TCs from TILs. TCs were stimulated either with PANC-1 cells or with anti-CD3/CD28 beads for 12 hours. Unstimulated TILs were used as negative control. (F) TNF neutralization rescues siSIK3 tumor cells from conditioned medium-induced cytotoxicity. Supernatant from polyclonally stimulated TCs was incubated with 100 (+), 300 (++) or 900 (+++) ng/mL of anti-TNF neutralizing Ab. Iso control (Ctrl AB) was used at a concentration of 900 ng/mL. Afterwards, siSIK3 transfected PANC-1-luc cells were subjected to the pretreated supernatant for 24 hours and cytotoxicity was measured using luciferase-based cytotoxicity assay. Data normalized to siCtrl. (G). Dose–response effect of rHuTNF treatment on the viability of siRNA transfected PANC-1-luc cells. Tumor cells were stimulated with indicated concentrations of rHuTNF for 24 hours, and cytotoxicity was measured by analysis of luciferase activity. (H) Effect of 100 ng/mL TNF treatment on the viability of transfected PANC-1 cells. Cell death was evaluated using real-time live cell microscopy, measuring the nuclear incorporation of YOYO-1 dye. The graph shows the area of YOYO-1+ cells/well (µm2/well). (I) Effect of pharmacological SIK3 inhibition on TNF-induced apoptosis of PANC-1 cells. PANC-1 cells were treated with different concentrations of HG-9-91-01 before the addition of 100 ng/mL rHuTNF for 120 hours. Cell death was evaluated as in (I). (J) Effect of TNFR-I blockade on siSIK3 transfected PANC-1-luc cells after treatment with the 100 ng/mL of rHuTNF. Luciferase intensity was measured as in (F). Data information: representative data of at least two independent experiments. Columns show mean±SEM. P values were calculated using two-tailed Student t-test. *P<0.05, **P<0.01. Ab, antibody; Iso, isotype; rHuTNF, recombinant tumor necrosis factor; SIK3, salt-inducible kinase 3; TC, T cell; TIL, tumor-infiltrating lymphocyte; TNF, tumor necrosis factor; TRAIL, tumor necrosis factor-related apoptosis-inducing ligand.
SIK3 regulates the response of tumor cells to TNF
To investigate whether SIK3 mediated the resistance against a distinct TC effector molecule, we blocked TNF, TRAIL, and FasL in the supernatant of activated TCs and assessed the response of SIK3-deficient tumor cells. Neutralization of TNF considerably diminished the cytotoxic potential of the TC supernatant on SIK3-depleted cells, while neutralization of FasL and TRAIL did not reduce tumor cell lysis in SIK3-deficient cells (figure 3C).
TNF is secreted by cytotoxic CD8+ TC on TCR activation and is an important cytokine in cancer rejection by tumor-specific TCs.35 36 Stimulation of TILs with tumor cells or anti-CD3/CD28 beads resulted in TNF production by CD8+ TCs (figure 3D,E). On TNF neutralization, we observed a complete rescue of TC-induced tumor cell death in SIK3-depleted cells (figure 3F). The same treatment in control tumor cells did not alter cell viability in comparison to isotype control (online supplemental figure S3D). Treatment with rHuTNF was sufficient to induce tumor cell lysis of SIK3-deficient tumor cells, while the same treatment triggered slight tumor proliferation of SIK3-proficient (siCtrl) tumor cells (figure 3G). Real-time live-cell microscopy revealed massive cell death of SIK3-depleted PANC-1 cells within the first 6 hours of TNF treatment (figure 3H and online supplemental video 1). These observations were also confirmed in MCF-7 breast cancer cells (online supplemental figure S3E). Blockade of SIK-3 kinase with HG-9-91-01 enhanced tumor cell cytotoxicity on TNF stimulation (figure 3I). To assess the relevance of SIK3 for protection against TNF-mediated cytotoxicity, we investigated whether SIK3 inhibition by HG-9-91-01 improved tumor cell destruction after rHuTNF treatment in 94 human cancer cell lines covering a broad variety of different tumor entities. Forty-seven cell lines showed increased tumor cell destruction on SIK3 inhibition (online supplemental figure S3F and online supplemental table S2).
Supplementary video
TNF mediates its biological effects by binding to two distinct receptors: TNFR-I and TNFR-II.37 38 PANC-1 cells expressed TNFR-I but not TNFR-II (online supplemental figure S3G). TNFR-I blockade in SIK3-depleted tumor cells abrogated TNF-induced cytotoxicity (figure 3J) but did not significantly alter tumor cell viability in siCtrl-transfected PANC-1 cells (online supplemental figure S3H). These data demonstrate that SIK3 determines the fate of tumor cells after TNFR-I stimulation.
SIK3 prevents TNF-induced apoptosis by modulating NF-κB nuclear translocation and chromatin accessibility
TNFR-I activation induces multiple downstream signaling events such as apoptosis via caspase cleavage but also activation of prosurvival transcription factors such as NF-κB.39 We observed increased cleavage of both caspase-8 and caspase-9 after SIK3 depletion in tumor cells following rHuTNF treatment (figure 4A,B). SIK3-depleted cells showed increased levels of phosphorylated c-Jun N-terminal protein kinase (figure 4C). JNK phosphorylation occurs on TNF stimulation and mediates apoptosis in the absence of activated NF-κB,40 which is a potent negative regulator of TNF-induced apoptosis.41 42 On the contrary, SIK3 overexpression resulted in increased NF-κB nuclear translocation as detected by ELISA of nuclear lysates from PANC-1 cells (figure 4D). Furthermore, SIK3 knockdown or functional inhibition led to a dramatic reduction of NF-κB activation on rHuTNF stimulation (figure 4E,F). Coculture of PANC-1 cells carrying a reporter gene for NF-κB activation with antigen-specific TCs confirmed that TC-induced NF-κB activation was regulated by SIK3 (online supplemental figure S4A). Taken together, these data demonstrate that SIK3 modulates resistance to apoptosis by promoting NF-κB nuclear translocation and stabilization after TNFR-I activation in tumor cells.

SIK3 prevents TNF-induced apoptosis via NF-κB activation. (A–C) siRNA-transfected PANC-1-luc cells were treated with 100 ng/mL of rHuTNF. At the indicated time points, tumor cells were harvested and total protein fraction was isolated. Luminex assay was performed for active caspase 8 (A), active caspase 9 (B), and pJNK (C). Graphs show MFI of analyte-specific beads after normalization to Glyceraldehyde-3-phosphate dehydrogenase (GAPDH). (D) PANC-1 cells were transiently transfected either with SIK3 overexpressing vector (Over) or with control vector (EV) for 48 hours. Afterwards, ELISA was performed for detection of nuclear p65 subunit of NF-κB. (E) PANC-1 cells were transfected with indicated siRNAs for 72 hours and treated with 100 ng/mL rHuTNF or culture medium for the indicated time points. p65 NF-κB ELISA was conducted as in (D). (F) Effect of pharmacological SIK3 inhibition on NF-κB activity. PANC-1 cells expressed luciferase under the control of an NF-κB promoter. Reporter PANC-1 were treated with different concentrations of HG-9-91-01 before the addition of 10 ng/mL rHuTNF for 8 hours. Cells were lysed and luciferase activity was measured. Data are shown as percent of NF-κB activity normalized to PANC-1 cells treated with 10 ng/mL rHuTNF without inhibitor. (G) Principal component analysis based on all identified chromatin accessible sites over all samples comprising siRNA transfected PANC-1-luc cells that were either untreated or treated with 100 ng/mL of rHuTNF for 4 hour or 24 hours. (H) Numbers of significant differentially accessible regions between comparison of SIK3 knockout and WT PANC-1 cells treated with rHuTNF for 4 or 24 hours (Benjamini-Hochberg corrected padj <0.05, log2 fold change >1, normalized mean accessibility ≥10). (I) M (log ratio) and A (average) (MA)-plot showing the log2 fold change and mean accessibility in the comparisons from (H). Significant differentially accessible regions are colored in dark violet. (J) Representative IGV genome browser snapshots of the TRAF1 locus for SIK3 knockdown and WT PANC-1 cells treated with rHuTNF for 4 or 24 hours. (K) Motif analysis of individual comparisons from (H). color code of heatmap indicates significance (z-score of log10 p value) of de novo identified transcription factor motifs in differential peaks from the respective pairwise comparisons. (L) ATAC-seq signal at motif-centered peaks containing the de novo discovered motifs of BORIS, NF-κB, and IRF from (K). X-axis shows distance from motif center in bp, y-axis number of normalized reads. (M) Kyoto Encyclopedia of Genes and Genomes (KEGG) pathway enrichment of genes in the vicinity of differential accessible chromatin regions from comparisons in (H). (A–C,E) Cumulative data of three independent experiments. (D,F) Representative data of at least two independent experiments. Columns show mean±SEM. P values were calculated using two-tailed Student t-test. *P<0.05, **P<0.01. ATAC-seq, assay for transposable-accessible chromatin with sequencing; bp, base pair; EV, empty vector; IRF, interferon regulatory factor; MFI, median fluorescent intensity; NF-κB, nuclear factor kappa B; pJNK, c-Jun N-terminal protein kinase; rHuTNF, recombinant tumor necrosis factor; SIK3, salt-inducible kinase 3; TNF, tumor necrosis factor; WT, wild type.
To better understand the role of SIK3 in TNF signaling, we determined the effect of TNFR-I stimulation on the chromatin landscape in SIK3-proficient and SIK3-deficient PANC-1 cells using the assay of transposase accessible chromatin (ATAC-seq). PANC-1 (siCtrl) treatment with 100 ng/mL rHuTNF resulted in remarkable changes in chromatin accessibility genome-wide, while SIK3 knockdown strongly impacted the molecular response of PANC-1 cells to TNF (figure 4G). On 4-hour of stimulation with rHuTNF, SIK3 silencing resulted in differential loss of more than 6000 and gain of more than 2500 open chromatin regions, respectively (figure 4H,I). Among the genetic loci depending on SIK3 activity, we identified regions critical for tumor cell initiation, progression, invasion, apoptosis resistance, and proliferation of pancreatic cancer, such as NFATC1,43–46 TRAF1,47 or ELOVL748 (figure 4J). De novo motif analysis within differentially accessible chromatin regions revealed enrichment of several transcription factor-binding sites (figure 4K). Notably, SIK3 knockdown caused a massive loss of accessible chromatin signal at NF-κB and interferon regulatory factors (IRFs) consensus binding sites (figure 4L). Finally, differentially accessible sites were located near genes involved in multiple related tumorigenic pathways, including a loss of TNF signaling (figure 4M). These data demonstrated a central role of SIK3 in modulating chromatin accessibility of tumor cells on TNF stimulation—likely in an indirect manner—by modulating transcription factors from the NF-κB, IRF and other TF families.
SIK3 sustains the expression of NF-κB target genes after TNF treatment
To extend these data, we performed transcriptome analyses in control or SIK3-depleted PANC-1 cells with or without rHuTNF treatment. SIK3 knockdown altered gene expression to some degree in the absence of TNF stimulation (online supplemental figure S4B–D). However, after 4 hours of rHuTNF treatment, a marked reduced transcription of NF-κB target genes was the most pronounced alteration in SIK3-depleted cells (figure 5A). Among the differentially expressed genes, several canonical antiapoptotic and prosurvival genes were further analyzed in more detail, both at RNA and protein levels. Expression of TNF-α induced protein 3 (A20),49 50 inhibitor of apoptosis 2 (cIAP2),51 52 and FLICE-like inhibitory protein (cFLIP)53 was strongly enhanced by TNF treatment in siCtrl cells, whereas SIK3-deficient cells showed reduced expression of those genes at baseline and impaired upregulation on TNF treatment. Myeloid leukemia cell differentiation protein (MCL1),54 55and X-linked inhibitor of apoptosis protein (XIAP)56 RNA and protein expressions did not increase on TNF treatment in siCtrl cells, yet expression levels were remarkably lower in siSIK3 transfected cells both at baseline and on TNF treatment as compared with siCtrl (RNAseq, online supplemental figure S4E; qPCR, figure 5B; and western blot (WB), figure 5C). Taken together, these data indicated that SIK3 protected tumor cells from TNF-induced apoptosis by upregulating several proapoptotic and prosurvival genes under the control of NF-κB. To investigate whether any of these target gene conferred resistance to TNF treatment in the absence of SIK3, we stably upregulated them in PANC-1 cells and subsequently silenced SIK3. Successful gene overexpression was confirmed both at RNA and protein level (online supplemental figure S4F,G). Luciferase-based cytotoxicity assay showed that overexpression of cFLIP, XIAP, and MCL1 partially protected tumor cells from TNF-mediated cytotoxicity in SIK3-depleted cells, whereas overexpression of cIAP2 did not show significant rescue in the same experiment. Coherent with its role as negative regulator of the NF-κB signaling, overexpression of A20 exacerbated the cytotoxic effect of TNF in SIK3-depleted cells (figure 5D).57–60 Notably, none of the tested genes led to complete rescue from TNF-induced cytotoxicity on overexpression, indicating that upregulation of a single gene in the TNF–SIK3–NF-κB pathway may not be sufficient to protect SIK3-depleted tumor cells from TNF-induced cytotoxicity.

SIK3 sustains tumor-promoting gene signature after TNF stimulation (A) Two-dimensional hierarchical clustering of 386 genes that were significantly regulated by TNF after 4 hours and significantly affected by SIK3 knockdown. The right panel shows representative gene enrichment analysis for genes having reduced or missing induction by TNF after SIK3 knockdown (fold change ≥2, normalized counts per million >2, false discovery rate (FDR) ≤0.05). (B) qPCR for the detection of NF-κB target genes on 100 ng/mL rHuTNF treatment and SIK3 knockdown in PANC-1 cells. Data were normalized to GAPDH. (C) Assessment of protein expression of NF-κB target genes on 100 ng/mL rHuTNF treatment and SIK3 knockdown in PANC-1 cells. Left panel: representative WB experiment, right panel: relative quantification of protein expression normalized to GAPDH. (D) Luciferase-based cytotoxicity assay for the impact of the overexpression of NF-κB target genes in SIK3 knockout PANC-1 cells. Overespression was performed as described in online supplemental material and methods. Afterwards, cells were transfected with SIK3 siRNA for 72 hours and subsequently subjected to 100 ng/mL rHuTNF for 24 hours. (E) Volcano plot showing differentially expressed genes (from RNA-seq, rHuTNF treatment in siCtrl vs siSIK3 cells) that also have a significant differentially accessible region (determined by ATAC-seq) in their vicinity are highlighted and colored due to their role in tumor biology (see also online supplemental tables S3 and S4).(B) Representative data of at least two independent experiments. (C) Cumulative data of two independent experiments. (D) Cumulative data of at least three different experiments. WB quantifications were obtained by combining two independent experiments. Columns show mean±SEM. P values were calculated using two-tailed Student’ t-test. *P<0.05, **P<0.01. ATAC-seq, assay for transposable-accessible chromatin with sequencing; EV, empty vector; NF-κB, nuclear factor kappa B; ns, not significant; rHuTNF, recombinant tumor necrosis factor; SIK3, salt-inducible kinase 3; TNF, tumor necrosis factor.
Integration of data from RNA-seq and ATAC-seq revealed a large overlap of differentially SIK3-regulated open chromatin regions and differentially expressed genes (figure 5E). Among them, multiple genes activated by SIK3 have been linked with tumor-promoting functions (online supplemental table S3), while genes associated with tumor suppression were largely repressed by SIK3 (online supplemental table S4). Taken together, these data demonstrated a pivotal role of SIK3 in regulating the ability of NF-κB in inducing its target genes on TNF stimulation.
SIK3 promotes NF-κB activation via inhibitory-κB kinase (IKK)α/β/NF-kappa-B inhibitor alpha (IκBα) phosphorylation and its nuclear retention via histone deacetylase 4 (HDAC4) inhibition
Based on these observations, we hypothesized a role of TNF in activating SIK3 via its upstream regulator, the liver kinase B1 (LKB1).61 62 We found that treatment of PANC-1 cells with rHuTNF induced only modest phosphorylation of LKB1 (figure 6A). Next, we knocked down LKB1 in PANC-1 cells and subjected them to TNF treatment. LKB1 knockdown efficiency was successfully confirmed at the mRNA level (online supplemental figure S5A). In contrast to SIK3 knockdown, downregulation of LKB1 did not improve TNF-mediated cytotoxicity of PANC-1 cells (online supplemental figure S5B). Additionally, LKB1 downregulation did not impair, but rather improved NF-κB activation in TNF-treated PANC-1 cells (online supplemental figure S5C). Taken together, these data did not confirm the existence of a TNF–LKB1–SIK3 axis in this tumor model.

Mechanisms of TNF-induced NF-κB activation by SIK3. (A) Upper panel: immunoblot analysis of pLKB1, LKB1 and β-actin (loading control) in PANC-1 wild-type cells UT or stimulated for 1–60 min with TNF. Lower panel: quantification of pLKB1 expression normalized to total LKB1. (B) Left panel: immunoblot analysis of upstream regulators of NF-κB. Right panel: quantification of pIKKα/β expression normalized to total IKKα+IKKβ and quantification of pIκBα normalized to total pIκBα. (C) Left panel: immunoblot analysis of NF-κB, acNF-κB and histone H3 (nuclear loading control). Right panel: quantification of nuclear acNF-κB expression normalized to nuclear histone H3 expression. (D). Effect of pharmacological SIK3 inhibition on HDAC4 phosphorylation. PANC-1 cells were treated with different concentrations of HG-9-91-01 for 3 hours in the presence of 10 ng/mL rHuTNF. Whole cell lysates were analyzed in an meso scale discovery (MSD) assay with anti-HDAC4 capture and anti-pHDAC4 detection antibodies. Data are shown as percent of HDAC4 phosphorylation normalized to UT PANC-1 (DMSO only). (E) HDAC4 knockdown rescues siSIK3 PANC-1 cells from TNF-induced cytotoxicity. TNF-induced killing of PANC-1-luc cells determined by the luciferase activity of remaining tumor cells. PANC-1-luc cells were transfected with indicated siRNAs for 72 hours and stimulated with 100 ng/mL of rHuTNF for 24 hours. (A–E) Representative data of two independent experiments. WB quantifications were obtained by combining two independent experiments. Columns show mean±SEM. P values were calculated using two-tailed Student t-test. *P<0.05, **P<0.01. acNF-κB, acetylated NF-κB; HDAC4, histone deacetylase 4; IKK, inhibitory-κB kinase; LKB1, liver kinase B1; NF-κB, nuclear factor kappa B; pLKB1, phosphorylated LKB1; SIK3, salt-inducible kinase 3; TNF, tumor necrosis factor; UT, untreated.
Next we sought to investigate the mechanism by which SIK3 regulates NF-κB activation. Canonically, TNF activates NF-κB via IKKα and IKKβ phosphorylation that induces IκBα phosphorylation and its subsequent degradation.63 64Coherently, TNF treatment induced phosphorylation of IKK proteins within 5 min from the stimulus in PANC-1 cells (figure 6B). Additionally, reduced levels of total IκB and relative increased levels of pIκB were observed. Strikingly, SIK3-depleted tumor cells showed marked impairment of IKKα/β and IκB protein phosphorylation (figure 6B). These data indicate a role of SIK3 in promoting the upstream signaling cascade of TNF-induced NF-κB activation by sustaining, likely indirectly, IKKα/β protein phosphorylation.
Acetylation of NF-κB is a post-translational modification that stabilizes NF-κB nuclear retention and gene expression.65 66 Consistently, we observed increased acetylated NF-κB (acNF-κB) on rHuTNF stimulation in SIK3-proficient cells (siCtrl). However, SIK3-deficient cells failed to increase acNF-κB after rHuTNF treatment (figure 6C). Among the regulators of NF-κB acetylation, HDAC4 decreases NF-κB activation by deacetylating the NF-κB p65 subunit.62 67 Notably, SIK3 phosphorylates HDAC4 and inhibits its activity.62 We confirmed that HDAC4 is negatively regulated by SIK3, as phosphorylation of HDAC4 was abrogated by the SIK3 inhibitor HG-9-91-01 (figure 6D). Therefore, we hypothesized that SIK3 increases NF-κB acetylation and nuclear stabilization by inhibiting HDAC4 protein levels. To prove this hypothesis, we silenced HDAC4 in SIK3-depleted tumor cells and evaluated tumor cell cytotoxicity after rHuTNF treatment. Indeed, SIK3/HDAC4 double-deficient PANC-1 cells showed decreased TNF-induced cytotoxicity compared with tumor cells transfected with SIK3-specific siRNA alone (figure 6E). Thus, on TNF stimulation, SIK3 stabilizes NF-κB activation, at least partially, through NF-κB acetylation and HDAC4 inhibition. Taken together, these data indicate a dual role of SIK3 in promoting NF-κB signaling by both positively modulating its upstream regulators and concomitantly inhibiting its nuclear repressors.
TNF/SIK3-inducible gene expression signature is associated with poor prognosis in patients with pancreatic cancer
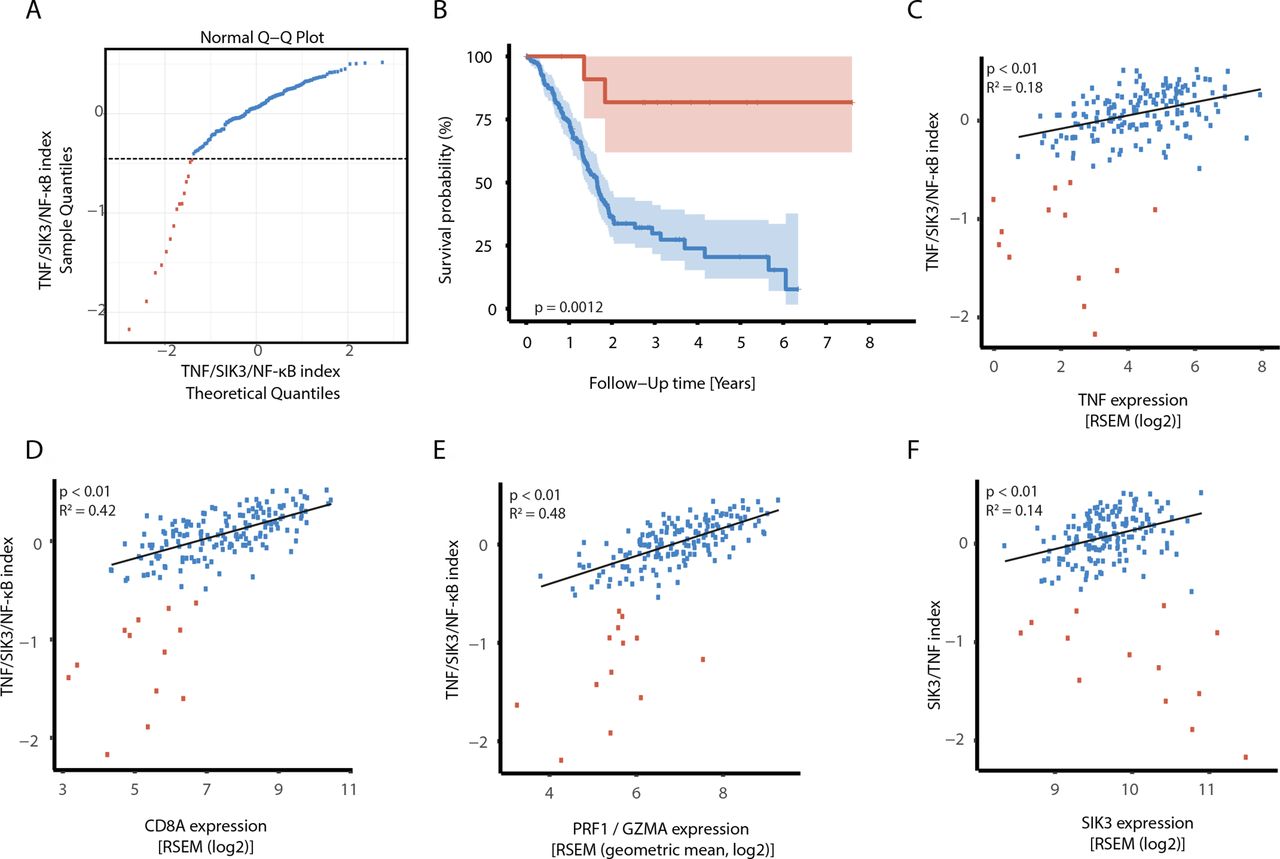
Comparative transcriptome analysis of TNF-stimulated SIK3-proficient and SIK3-deficient cells revealed altogether 386 genes that were significantly regulated by SIK3 after TNF stimulation (figure 5A) in pancreatic tumor cells. Among those, 205 genes were attributable to NF-κB activation. We investigated the expression of these genes in the PAAD dataset of the TCGA. One hundred eighty-four of the genes were also covered in this dataset and were condensed to a single index per patient as previously described,20 yielding to quantitative NF-κB indices for 178 patients with primary PAAD. The majority of patients showed high index expression (figure 7A, blue dots), whereas a smaller group of patients showed impaired signature expression (figure 7A, red dots). Notably, the deficiency in TNF/SIK3-inducible NF-κB gene signature expression correlated with improved survival (p=0.0012). More than 75% of patients with low index were still alive after 7 years, while the median overall survival in the index high group was less than 2 years (p=0.0012) (figure 7B).
A TNF/SIK3/NF-κB gene signature is associated with poor prognosis in PDAC. (A) Two populations with distinct TNF/SIK3/NF-κB gene signature (index) are observed in patients with PDAC. Q–Q plot of the distribution of the TNF/SIK3 index and a standard Gaussian distribution. The value −0.6 was used as cut-off value to separate index high from index low patients. (B) Patients with low TNF/SIK3/NF-κB index show improved survival than the high TNF/SIK3/NF-κB group. Kaplan-Meier curves with CIs for the index high and low groups. Samples with a low signature index (<−0.6) are shown in red, whereas samples with a high signature index (>0.6) are colored in blue. The estimated p value of 0.0012 indicates a significant better survival in the index low group. (C–F) Expression of selected genes on the x-axis against the TNF/SIK3/NF-κB index signature index on the y-axis. Samples with a signature index of <−0.6 (=low index group) are represented by red circles. In this group, individual samples were numbered for comparison among different graphs. Samples with a signature index of >−0.6 (=high index group) are represented by blue circles. For the high index subgroup, a linear least-squares regression line was fit. We tested whether the slope of this line significantly differs from zero (no correlation) and shows the corresponding p values. (C); TNF correlation coefficient in high index group: 0.423; p value high index <0 .01. (D) CD8A correlation coefficient in the high index group: 0.646; p value of regression <0.01. (E) Geometric mean of perforin (PRF1) and granzyme (GZMA) correlation coefficient in the high index group: 0.695; p value high index <0.01. (F) SIK3 correlation coefficient in the high index group: 0.373; p value high index <0.01. Q–Q, quantile–quantile.
A high index significantly correlated not only with increased expression of SIK3 and TNF but also particularly with increased CD8+ TC infiltration and cytotoxic TC activity, as determined by granzyme B and perforin expression (figure 7C–F). This indicates a direct link between TC activity in situ and NF-κB activation in the majority of pancreatic cancers. Thus, these data further corroborate the notion that a TNF–SIK3–NF-κB axis promotes tumor progression and that abrogation of this pathway may be beneficial for patients with cancer.
Discussion
The complete success of CIT is hindered by various resistance mechanisms that may originate from the tumor microenvironment or directly from the tumor cells.2 Recent studies showed that aberrant response to TC-released cytokines is a major mechanism of tumor-intrinsic resistance to immunity.3 5 6 68 In this work, we show for the first time that tumor cells exploit SIK3 to counteract TC attack by promoting prosurvival gene expression after TNF stimulation. SIK3 was identified by a genetic screen for factors that determine the fate of tumor cells after the encounter of cytotoxic TCs. In contrast to canonical immune modulators, SIK3 critically regulated tumor sensitivity towards TC attack rather than TC activation.
Here, we introduce SIK3 as a molecular switch of TNF responses in cancer. We show that SIK3 sustains TNF-induced NF-κB activation, nuclear translocation, and retention. Along this line, other groups described a modulatory function of SIK family members towards NF-κB activation.67 Nevertheless, the role of SIK3 in modulating TNF-induced NF-κB activation in the context of cancer immunity has never been reported before. TNF stimulation in SIK3-proficient cancer cells led to profound changes in chromatin accessibility with remarkable alteration of gene expression. Coherently, regulation of chromatin accessibility determines tumor resistance to TC-mediated cytotoxicity.69 70 In line with other studies,41 71 72 we showed that NF-κB activation led to massive expression of prosurvival and antiapoptotic genes. Notably, ablation of SIK3 reverted the expression of this gene signature, resulting in massive cell death after TNF stimulation. Overexpression of some of those differentially regulated genes in SIK3-depleted cells conferred only partial protection from TNF-induced cytotoxicity. Based on this observation, we speculate that several SIK3-dependent prosurvival and antiapoptotic genes simultaneously orchestrate protection of tumor cells from TNF or TC-mediated cytotoxicity.
To identify the molecular mechanisms by which SIK3 regulated NF-κB activation, we observed that TNF treatment led to modest but significant activation of the SIK3 upstream kinase LKB1. LKB1 activation from TNF–TNFR1 has never been reported. However, Lombardi et al detected higher pLKB1 in macrophages after activation of TLR4 and IL1R,73 two receptors sharing multiple intracellular signaling nodes with the TNFR1 pathway.74 Despite the increased LKB1 activation by TNF, knockdown of LKB1 neither increased the sensitivity of tumor cells to TNF nor decreased NF-κB activity. These observations might be explained by the role of LKB1 in modulating the activity of at least 13 different known targets,75 which overall may have a different impact than the sole inhibition of SIK3. Additionally, LKB1 is a known negative regulator of the NF-κB signaling pathway.76 77 Hence, we could not confirm a role of LKB1 in activating SIK3 and, in turn, NF-κB on TNF stimulation. Among other reported upstream regulators of SIK3, AKT is activated on TNF stimulation.78–80 Although we did not address the role of AKT in this work, we hypothesize that SIK3 activation on TNF might occur by this alternative pathway.
To identify the mechanism by which SIK3 influences NF-κB activity, we investigated whether SIK3 modulated known regulators of NF-κB. Strikingly, we observed impaired phosphorylation of IKK and IκBα proteins on SIK3 knockdown. The mechanism by which SIK3 modulates those proteins remains unclear. Yet, SIK3 may promote mTOR activation,81 which in turn promotes phosphorylation of the IKK complex.82 83 Alternatively, several NF-κB target genes, such as cFLIP, cIAP2, and XIAP, may generate a feedback loop that in turn sustains the NF-κB pathway by acting on its upstream regulators.51 84 85Hence, we propose an indirect role of SIK3 in controlling the upstream regulators of the NF-κB pathway.
On activation, several factors influence the duration and the strength of NF-κB activity.63Among them, HDAC4 is a direct target of SIK kinases,67 86–88 and its phosphorylation by SIK kinases leads to its inactivation.86 Additionally, HDAC4 physically interacts with p65 subunits of NF-κB and reduces NF-κB stability by deacetylation.66 67 To link these studies, we showed that knockdown of HDAC4 rescued SIK3-depleted cells from TNF-mediated killing. Thus, we propose a dual role of SIK3 in regulating NF-κB by both promoting IKKα/β and IκBα phosphorylation on the one side and by sustaining NF-κB nuclear retention by inhibiting HDAC4 on the other side.
Despite our validations on the NF-κB transcription factor, chromatin accessibility analysis suggests that additional transcription factors are involved in regulating the observed effects, which we do not rule out. As several of the inferred transcription factors, such as IRF and bZIP family members, are interacting with the NF-κB pathway,89–91 the observed effects might to some extent be direct effects of NF-κB modulation by SIK3.
To confirm the pivotal role of the TNF–SIK3–NF-κB axis in cancer, we investigated the impact of a TNF–SIK3–NF-κB induced gene signature on patients’ survival. The majority of patients with pancreatic cancer showed high gene signature expression, which correlated with poor prognosis. However, patients who were unable to upregulate this gene signature showed prolonged survival. Interestingly enough, SIK3 and TNF expressions did not positively correlate with gene index expression. Whereas we did not further investigate the reasons behind this observation, we speculate that the impaired signature expression may arise from genetic alterations within the TNF–NF-κB pathways that render tumor cells unable to upregulate this signature even in the presence of TNF and SIK3. Taken together, these data confirm that SIK3 protects tumor cells from TC attack by taking advantage of TC-released TNF to promote profound changes of chromatin accessibility followed by transcription of numerous genes that counteract cytotoxic agents and cytokines released by TCs.
With this work, we sought to provide the rationale of SIK3 as a therapeutic target for CIT. Previously, several studies described roles of SIK3 in promoting cell proliferation, cancer progression, and metastasis.20 32 33 61 92 93 Hence, SIK3 blockade might decrease tumor proliferation and invasiveness on the one hand and increase tumor susceptibility to TC attack on the other hand. SIK3 expression is not restricted to tumor cells, but SIK3 mRNA is also present in a variety of healthy tissues hinting to possible adverse effects of systemic SIK3 blockade.94 Yet, abrogation of SIK3 alone did not show a major impact on cell viability, indicating that SIK3 inhibition would induce cytotoxicity only in tissues where TNF is secreted, such as inflamed cancer tissues. Additionally, novel pan-SIK kinase inhibitors did not exert strong toxicity in mice.95 Such inhibitors have been widely tested in the context of macrophage biology, where they can induce the tolerogenic M2 phenotype.73 Thereby, SIK2 has been shown to be the driver of this phenotype.67 73 95–97 Thus, the usage of pan-SIK inhibitors may not be appropriate for cancer treatment, while SIK3-specifc inhibitors might elicit tumor sensitization to immune attack without inducing an immune tolerogenic microenvironment.
Although current cancer therapeutic strategies aim to reinforce TC functionality by acting on immune modulators or cytokine pathways, sensitizing tumor cells to the insult of the immune system may be used as a complementary approach to immunotherapy. In line with these considerations, a recent study showed that lowering TNF cytotoxicity threshold in tumor cells augments the impact of immunotherapy in preclinical models.5 On the other hand, blockade of TNF failed to show clinical success because of its dual role in cancer.98 Our work suggests that rewiring tumor response to TNF, by SIK3 inhibition, is a more efficacious strategy to exploit the TNF pathway for anticancer immunity.
Data availability statement
Data are available in a public, open access repository. Gene Expression Omnibus public functional genomics data repository (accession code GSE202305).
Ethics statements
Patient consent for publication
Ethics approval
All in vivo experiments were conducted according to the Federation of European Laboratory Animal Science Associations guidelines.
Acknowledgments
We thank M Lotem for provision of melanoma-derived TIL209 and TIL412; D Männel, Institute of Immunology, University Regensburg, for provision of recombinant tumor necrosis factor; and H Smetak for help with manuscript editing and submission. We also thank the Cooperation Program in Cancer Research of the Deutsches Krebsforschungszentrum and Israel's Ministry of Science, Brigitte Wild, for excellent technical support.
References
Supplementary materials
Supplementary Data
This web only file has been produced by the BMJ Publishing Group from an electronic file supplied by the author(s) and has not been edited for content.
Footnotes
AS and ANM contributed equally.
Contributors AS, ANM, TM, VV, FCD, JS, MX, AH, SSt, SSp, NH, JM, KMJ, AR, MWK, DM, OR, CMF, CS, and SP conducted experiments; IP, RO, SP, and ANM generated T cells; AS, NK, TM, MBr, MBo, and PB designed, conducted, and analyzed the genetic screen; CG, MR, AS, CS, and PB analyzed genome or transcriptome data; RS and CK analyzed the patient’s data; PB and AS designed the study; AS and PB drafted the manuscript; AS, ANM, FCD, JS, MX, AH, SSt, SSp, NH, JM, MR, CS, and PB revised the manuscript. AS, PB and ANM are the guarantors of this study.
Funding This project was funded by the Deutsche Forschungsgemeinschaft (German Research Foundation) Collaborative Research Program (SFB/TR 221 and Forschergruppe 2127). AH received funding from the European Union's Horizon 2020 research and innovation programme under the Marie Sklodowska-Curie grant agreement No 861190.
Competing interests This work was supported by iOmx Therapeutics AG (Martinsried, Germany).
Provenance and peer review Not commissioned; externally peer reviewed.
Supplemental material This content has been supplied by the author(s). It has not been vetted by BMJ Publishing Group Limited (BMJ) and may not have been peer-reviewed. Any opinions or recommendations discussed are solely those of the author(s) and are not endorsed by BMJ. BMJ disclaims all liability and responsibility arising from any reliance placed on the content. Where the content includes any translated material, BMJ does not warrant the accuracy and reliability of the translations (including but not limited to local regulations, clinical guidelines, terminology, drug names and drug dosages), and is not responsible for any error and/or omissions arising from translation and adaptation or otherwise.