Article Text

Abstract
Background CD19-directed chimeric antigen receptor T-cell therapy (CAR-T) represents a promising treatment modality for an increasing number of B-cell malignancies. However, prolonged cytopenias and infections substantially contribute to the toxicity burden of CAR-T. The recently developed CAR-HEMATOTOX (HT) score—composed of five pre-lymphodepletion variables (eg, absolute neutrophil count, platelet count, hemoglobin, C-reactive protein, ferritin)—enables risk stratification of hematological toxicity.
Methods In this multicenter retrospective analysis, we characterized early infection events (days 0–90) and clinical outcomes in 248 patients receiving standard-of-care CD19 CAR-T for relapsed/refractory large B-cell lymphoma. This included a derivation cohort (cohort A, 179 patients) and a second independent validation cohort (cohort B, 69 patients). Cumulative incidence curves were calculated for all-grade, grade ≥3, and specific infection subtypes. Clinical outcomes were studied via Kaplan-Meier estimates.
Results In a multivariate analysis adjusted for other baseline features, the HT score identified patients at high risk for severe infections (adjusted HR 6.4, 95% CI 3.1 to 13.1). HThigh patients more frequently developed severe infections (40% vs 8%, p<0.0001)—particularly severe bacterial infections (27% vs 0.9%, p<0.0001). Additionally, multivariate analysis of post-CAR-T factors revealed that infection risk was increased by prolonged neutropenia (≥14 days) and corticosteroid use (≥9 days), and decreased with fluoroquinolone prophylaxis. Antibacterial prophylaxis significantly reduced the likelihood of severe bacterial infections in HThigh (16% vs 46%, p<0.001), but not HTlow patients (0% vs 2%, p=n.s.). Collectively, HThigh patients experienced worse median progression-free (3.4 vs 12.6 months) and overall survival (9.1 months vs not-reached), and were hospitalized longer (median 20 vs 16 days). Severe infections represented the most common cause of non-relapse mortality after CAR-T and were associated with poor survival outcomes. A trend toward increased non-relapse mortality in HThigh patients was observed (8.0% vs 3.7%, p=0.09).
Conclusions These data demonstrate the utility of the HT score to risk-stratify patients for infectious complications and poor survival outcomes prior to CD19 CAR-T. High-risk patients likely benefit from anti-infective prophylaxis and should be closely monitored for potential infections and relapse.
- receptors, chimeric antigen
- hematologic neoplasms
- translational medical research
Data availability statement
Data are available on reasonable request. For original data and material, please contact marion.subklewe@med.uni-muenchen.de.
This is an open access article distributed in accordance with the Creative Commons Attribution Non Commercial (CC BY-NC 4.0) license, which permits others to distribute, remix, adapt, build upon this work non-commercially, and license their derivative works on different terms, provided the original work is properly cited, appropriate credit is given, any changes made indicated, and the use is non-commercial. See http://creativecommons.org/licenses/by-nc/4.0/.
Statistics from Altmetric.com
Key messages
What is already known on this topic
Infections after CD19-directed chimeric antigen receptor T-cell therapy (CAR-T) are common in the real-world setting and arise as a result of multifactorial immunosuppression.
What this study adds
The CAR-HEMATOTOX represents an easy-to-apply score that helps to identify patients at high risk for severe infections and poor clinical outcomes prior to lymphodepletion. Post-CAR-T infection risk is driven by prolonged neutropenia and steroid use, but reduced by fluoroquinolone prophylaxis in high-risk patients.
How this study migh affect research, practice or policy
These data provide the rationale for prospective studies evaluating HT-adapted anti-infective prophylaxis and/or early G-CSF support. High-risk patients should be closely monitored for potential infections and relapse.
Background
Chimeric antigen receptor T-cells (CAR-T) directed against the target antigen CD19 have emerged as a powerful treatment modality for relapsed/refractory large B-cell lymphoma (R/R LBCL).1 2 However, their clinical benefit comes at the cost of a unique toxicity profile that includes cytokine release syndrome (CRS) and immune effector cell-associated neurotoxicity syndrome (ICANS).3 Prolonged cytopenias and infectious complications represent further challenging CAR-T-related side effects. They are both common and substantially contribute to the long-term toxicity burden of CAR-T.4 Infections in particular drive non-relapse mortality in the real-world setting.5
A combination of factors give rise to the high risk of infection in CAR-T patients. First, patients are often already heavily pretreated and display profound B-cell aplasia and diminished hematopoietic reserve prior to lymphodepletion. Other host risk factors include the underlying malignancy, a history of infection or prior stem cell transplantation, and the cytotoxic fludarabine/cyclophosphamide lymphodepletion itself. Second, the acute immunotoxicities (eg, CRS and ICANS) and their respective management (eg, corticosteroids) add to the already high net-state of immunosuppression.6–8 Third, CAR-T patients are prone to delayed and prolonged cytopenias. Neutropenia is typically biphasic and can persist long after lymphodepletion and resolution of acute CRS.9–11 Together with B-cell depletion and hypogammaglobulinema, both expected on-target/off-tumor side effects of CD19-directed CAR-T, patients thus present with profound and prolonged immune deficits. These can persist for years due to the nature of CAR T-cells as a living drug.12 Still, most infections are observed early and especially occur in the first 30 days after CAR-T with previous studies reporting an infection rate ranging between 20% and 40%.7 8 13 14 In terms of infection type, bacterial infections represent the dominant pathogen in the first month after CAR-T, while viral infections are more common after the first month.8 13 Even though fungal infections are rare (2%–7%), they are often life-threatening and are associated with severe neutropenia and CRS.11 15
In light of the growing number of indications for CAR-T across the hematological disease spectrum as well as the potential for outpatient administration of CAR T-cells,16 adequate risk-stratification prior to therapy initiation has become increasingly pertinent. We have recently described the CAR-HEMATOTOX (HT) model, which integrates parameters associated with pre-CAR-T hematopoietic reserve (eg, absolute neutrophil count (ANC), hemoglobin, platelet count) and inflammation (eg, C-reactive protein (CRP), ferritin) to predict CAR-T related hematotoxicity.10 The score is determined prior to lymphodepleting chemotherapy (eg, day −5 prior to CAR-T) and thus enables early risk-stratification of hematological toxicity. Patients with an elevated HT score (HThigh, ≥2) exhibited a prolonged duration of severe neutropenia, while patients with a low score (HTlow, 0–1) displayed only transient neutropenia (12 vs 5.5 days). HThigh patients also more frequently developed an aplastic phenotype of neutrophil recovery (40% vs 2%).10 We therefore postulated that the HT score may help identify patients at risk for post-CAR-T infectious complications. As recent studies have implicated pre-CAR-T inflammation as a negative prognostic marker,17 18 we also investigated the prognostic value of the score.
Methods
Patients and data collection
In this multicenter retrospective observational study, infectious complications were studied in 248 adult patients receiving standard-of-care axicabtagene ciloleucel (Axi-cel, n=138) or tisagenlecleucel (Tisa-cel, n=110) for R/R LBCL. Patients were treated between May 2018 and June 2021 across six international CAR-T centers (LMU Munich, Tübingen, Erlangen, Berlin Charité, Vall D’Hebron Barcelona, Moffitt Cancer Center). Patients received lymphodepletion with fludarabine and cyclophosphamide according to the manufacturers’ instructions.1 2 Clinical metadata were extracted from medical records and databases, and was collected with IRB approval (LMU: Project Nr. 19-817, Moffitt Cancer Center: Advarra Pro00024557). CRS and ICANS were graded according to American Society for Transplantation and Cellular Therapy (ASTCT) consensus criteria.19 Infections were studied between the day of CAR-T transfusion (day 0) until day 90. Information concerning the use of antibacterial prophylaxis (eg, fluoroquinolone) and early intravenous antibiotics (days 0–10), including the respective day of initiation and antibiotic class, was obtained for the entire study cohort. Institutional guidelines for toxicity management across the participating centers are outlined in online supplemental tables S1 and 2.
Supplemental material
CAR-HEMATOTOX
The score was preferentially calculated on the day of lymphodepletion (day −5) with a leniency period of up to 3 days for laboratory markers as previously described.10 One point was allotted for the following criteria: ANC <1200/µL, hemoglobin <90 g/L, platelet count 75–175 ×109/L, CRP ≥3.0 mg/dL, and ferritin 650–2000 ng/mL. Two points were provided for a platelet count <75 ×109/L/L and ferritin >2000 ng/mL. HThigh patients were defined by a sum score ≥2, HTlow patients by a sum score of 0–1. An online CAR-HEMATOTOX calculator can be found on the German Lymphoma Alliance (GLA) website: https://www.german-lymphoma-alliance.de/Scores.html. The clinical phenotypes of neutrophil recovery were divided into three groups: quick versus intermittent recovery versus aplastic.10
Infection categorization and classification of severity
An episode of infection was defined as bacterial, viral or fungal based on microbiologic or histopathologic data or as a clinical syndrome of infection (eg, pneumonia, cellulitis, cystitis) based on retrospective chart review. Infection onset was specified as the day on which the diagnostic test was performed. Infections prior to CAR-T transfusion were excluded. In the case of multiple positive blood cultures for different organisms on the same day, these were defined as separate events. The clinical source of infection was based on a combination of symptomology, microbiologic isolates and radiographic findings. Respiratory tract infections were subcategorized into either upper or lower respiratory tract infections. Lower respiratory tract infections were defined by pathogen detection in bronchoalveolar lavage, or new/changing pulmonary infiltrates on imaging. Invasive fungal infections were graded according to the Infectious Diseases Society of America (IDSA) consensus guidelines.20 In the absence of clinicals signs or microbiologic data, fever alone was not counted as an infection event.
Infection severity was classified on a 5-grade scale as mild, moderate, severe, life-threatening or fatal as previously established.8 21 Mild infections required no treatment. Moderate infections required oral antimicrobial treatment with the exception of bacteremia due to possible skin contaminants (eg, Diphtheroid, Bacillus, or coagulase-negative Staphylococcus spp). Severe infections were defined as requiring intravenous anti-infective agents and/or hospitalization. Patients with life-threatening infections developed complications considered to be life-threatening such as hemodynamic instability, respiratory insufficieny, or sepsis. Fatal infections were defined as infections determined to be the primary cause of death.
Statistical methods
Multivariate adjusted analysis was performed as binary logistic regression for the primary endpoint of grade ≥3 infection including HT risk groups and the host factors sex, age, ASCT, lactate dehydrogenase (LDH), disease entity as candidate predictors. Separate analyses were performed using post CAR-T factors (eg, CAR product, severe CRS/ICANS, Intensive Care Unit (ICU) admission, tocilizumab/corticosteroid/Granulocyte-colony stimulating factor (G-CSF) use, antibiotic prophylaxis, neutropenia) and the individual HT score components as candidate predictors. For time-dependent variables (eg, corticosteroid use, neutropenia duration), discriminatory thresholds were determined from receiver operating characteristic (ROC) curves by optimizing the respective Youden J statistic.
Cumulative risk curves were calculated as the time-to-first-infection from Kaplan-Meier estimates, censoring the observation time on the date of progression, last follow-up, or death. Concomitant hazard ratios (HRs) were calculated comparing HT risk groups using a multivariate Cox proportional-hazards model, adjusting for either pre-CAR-T or post-CAR-T factors. Competing risk analysis was not performed due to the low incidence of loss to follow-up or death. To account for multiple infections per patient, infection densities were determined by computing the mean number of infections per 100 patient days considering the total days at risk.
Statistical significance between groups was explored by non-parametric Mann-Whitney test for absolute values and Fisher’s exact test for comparison of percentages. Non-relapse mortality was defined as death after cellular therapy without prior relapse or progression. Kaplan-Meier curves for progression-free (PFS) and overall survival (OS) were compared using the log-rank test, while a univariate Cox regression was applied to study HRs comparing HT risk groups. Statistical analysis and data visualization was performed using GraphPad Prism (V.9.0), SPSS (V.26.0), or R Statistical Software (V.4.1.0).
Results
Early post-CAR-T infections are common in the real-world setting
Infectious complications were studied during the first 90 days following CD19 CAR-T in a derivation cohort of 179 patients (cohort A) and a second independent validation cohort comprised of 69 patients (cohort B) (online supplemental table S3). Consistent with prior real-world reports, our patient cohort was heavily pretreated with a median of three prior treatment lines and median LDH of 281.5 U/L prior to lymphodepletion (table 1).5 22 In terms of the HT score prior to lymphodepletion, 133 patients were HThigh (54%) and 115 patients were HTlow (46%). HThigh patients displayed an elevated LDH compared with their HTlow counterparts (346 vs 252 U/L, p=0.0004) indicating that the score may reflect tumor burden. As expected, the individual score components were increased in HThigh patients (online supplemental table S4). Of interest, the majority of patients treated in the US exhibited a low HT score (61/109, 56%), while only 39% of the European patients were HTlow (34/139, p=0.01). The toxicity profile was comparable to other real-world reports with a severe CRS (≥3°) rate of 9% and severe ICANS (≥3°) rate of 15%.23 While the severe CRS/ICANS rate was balanced between HT high vs low patients, tocilizumab was more frequently applied in HThigh patients (64% vs 48%, p=0.01), suggesting a higher rate of clinically actionable CRS. ICU admission rates were higher in HThigh compared with HTlow patients (20% vs 10%, p=0.03). Most patients developed an intermittent phenotype of neutrophil recovery (41%, online supplemental figure S1A). The clinically significant aplastic phenotype was observed almost exclusively in HTHigh patients (38% vs 1%, p<0.0001, online supplemental figure S1B). As expected, an elevated HT score was associated with a significantly prolonged median duration of severe neutropenia (ANC<500/µL) in the first 60 days after CAR-T (13 vs 6 days, p<0.0001, online supplemental figure S1C). Reflecting the greater extent of neutropenia, HThigh patients more frequently received G-CSF (51% vs 33%, p=0.005) (table 1).
Baseline demographic and clinical characteristics of CAR T-cell treated patients
In the first 10 days after CAR-T, 73% and 12.5% of patients developed either neutropenic or non-neutropenic fever respectively, highlighting the ubiquitous nature of CAR T-cell-associated fever syndromes (figure 1B). This resulted in intravenous antibiotic use in 213 patients (86%) with a median time to initiation of 2 days (IQR 1–4) (online supplemental table S5). The most frequently used intravenous antibiotic was piperacillin/tazobactam (54%), followed by cefepime (26%), meropenem (17%), vancomycin (13%), and linezolide (5%). A total of 152 patients (61%) received oral (PO) antibacterial prophylaxis with the fluoroquinolone ciprofloxacin, which was initiated by day 0 in all but two patients (online supplemental table S5). In our patient cohort, 45% (112/248) developed an infectious complication with an average of 1.7 infections per patient (online supplemental figure S2A,B). Severe (grade 3) infections represented the most common severity grade accounting for 37.5% of all infections, while life-threatening and fatal infections accounted for 11.6% and 6.3%, respectively (figure 1C). Of the seven early fatal infections, the causal pathogen was identified as fungal in three cases and bacterial in three cases (online supplemental table S6). One COVID-19 death occurred in a CAR-T patient with viral transmission of SARS-CoV-2 in the outpatient setting. Bloodstream infections represented the most common source of infection (27%), followed by gastrointestinal tract (21%) and lower respiratory tract (18%) infections (figure 1D). The overall infection density per 100 patient days was 0.89 and bacteria were the most commonly isolated microorganism (figure 1E).

Post-CAR-T infectious complications are common in the real-world setting. (A) Cohort description: Cohort A includes 179 patients derived from the publication describing the CAR-HEMATOTOX model10 (Hamburg and Lyon did not participate in this study). Cohort B represents an independent validation cohort of 69 patients. Infections were graded on a five-grade scale with grade ≥3 infections indicating severe infections. (B) Overview of fever syndromes occurring within the first 10 days after CAR-T. (C) The maximum infection grade is depicted in the 112 patients (45%) that developed an infectious complication. The y-axis indicates the absolute number of patients that developed the respective infection grade, while the x-axis describes the infection grade (grades 1–5). The relative distribution of infection grades in percent is superimposed on the top of the bars. (D) Clinical source of infection of the 193 infection events. (E) Infection densities per 100 patient days are displayed for fungal, viral, bacterial and all subtypes of infections occurring during the first 90 days after CAR-T. (F, G) Cumulative incidence curves describing the time-to-first-infection in the first 90 days after CAR T for all-grade (F) and severe (grade ≥3) (G) infections. Cumulative incidences are depicted for all infections (gray), as well as in cohort A (dark blue, n=179) and cohort B (brown, n=69). The p value by Mantel-Cox log-rank test comparing cohorts A vs B is depicted on the graph inset. CAR-T, chimeric antigen receptor T-cells; CRP, C-reactive protein; GI, gastrointestinal; NNPF, non-neutropenic fever; NPF, neutropenic fever; CNS, central nervous cystem; HT, CAR-HEMATOTOX.
The cumulative 90-day incidence for all-grade and severe infections was 43.5% and 24.4%, respectively (figure 1F–G). While severe infections were distributed equally between patient cohorts (figure 1G), they were more common in patients treated in Europe (online supplemental figure S2C,D). The majority of infections were observed in the first 30 days after CAR-T (>80%) with a median time to first infection of 7 days (95% CI 5 to 8 days). When studying infection subtypes, bacterial infections displayed the highest cumulative 90-day incidence at 26.0% (online supplemental figure S2E). Viral and fungal infections presented with a lower incidence of 10.5% and 8.2%, respectively (online supplemental figure S2F,G). An overview of microbiologic isolates is provided in online supplemental table S7. Taken together, these data underline the high incidence of early post-CAR-T infections in the real-world setting. Infection rates peaked during the time period in which patients exhibited coincident immunotoxicity.
A high CAR-HEMATOTOX score is associated with an increased incidence and severity of post-CAR-T infections
The overall infection rate was significantly higher in HThigh patients (56% vs 33%), especially for severe infections (40% vs 8%, p<0.0001) (figure 2A). The calculated infection densities were elevated in HThigh patients for all infection subcategories (figure 2B). For example, HThigh patients displayed an infection density of 1.23 and 0.69 per 100 patient days for all-type and bacterial infections, respectively. Conversely, the respective infection density was 0.52 and 0.23 for HTlow patients. When studying the distribution of infection grades, the majority of infections in HTlow patients were either mild or moderate (77%, online supplemental figure S3). On the other hand, HThigh patients predominantly exhibited grade ≥3 infections (72%, online supplemental figure S3)—including 13 HThigh patients (18%) that developed life-threatening and 6 HThigh patients (8%) that developed fatal infections during the first 90 days.
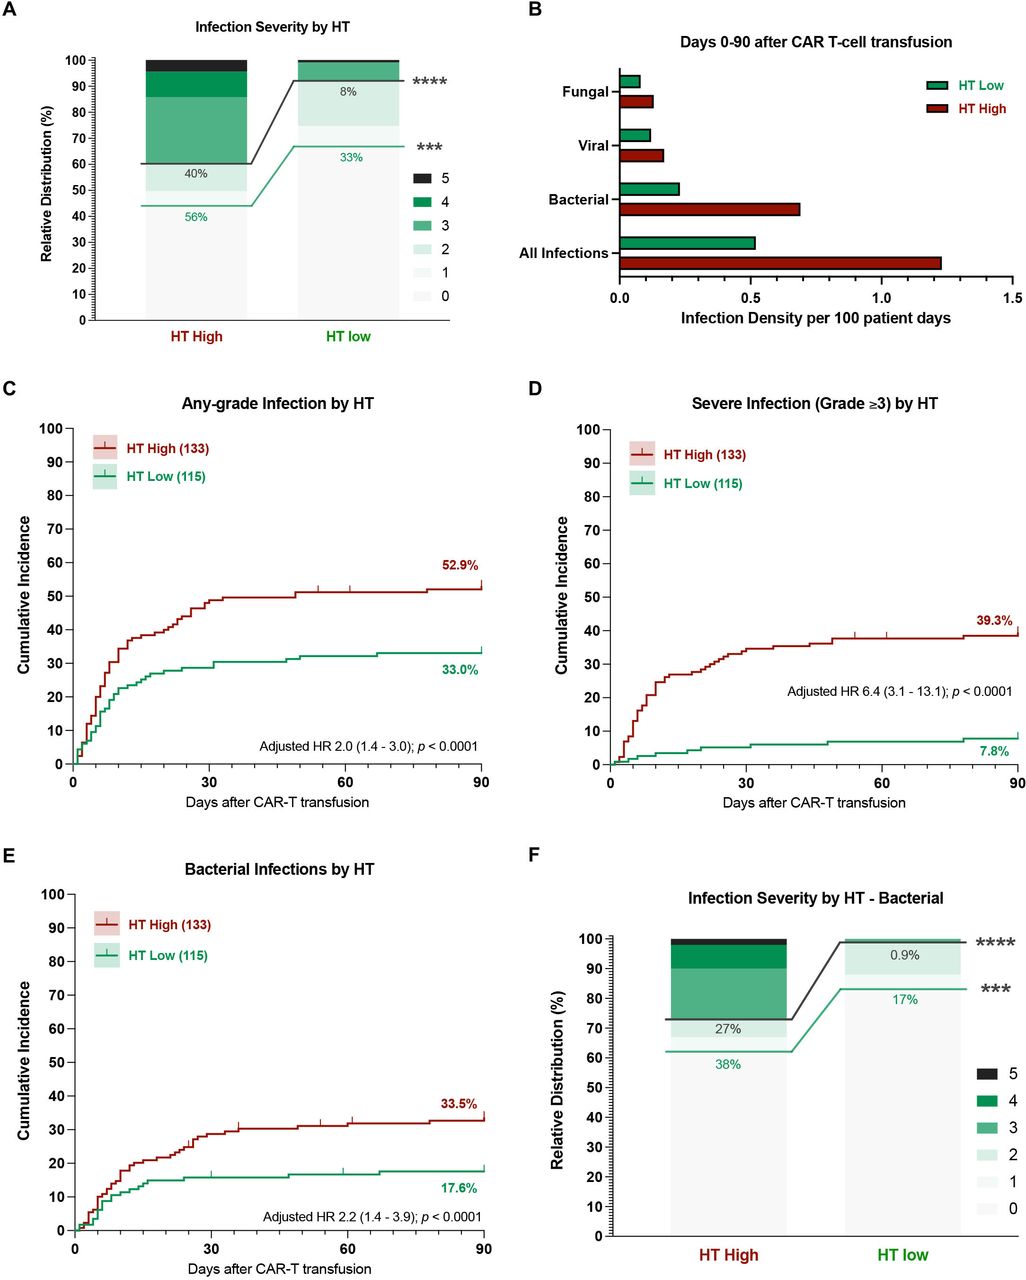
A high CAR-HEMATOTOX score results in a higher incidence and severity of post-CAR-T infections. (A) Relative distribution of infection grades for all infection subtypes comparing HT high versus low patients. Infection grades (1–5°) are color-coded in shades of green with the connecting green and gray lines and percentage numbers comparing all-grade and grade ≥3 infections, respectively, in HT high versus low patients. Significance values were determined by Fisher’s exact test (*p<0.05, **p<0.01, ***p<0.001, ****p<0.0001). (B) Infection densities per 100 patient days for the first 90 days after CAR-T by HT score. (C–G) Cumulative incidence curves (D0-90) by HT score for any-grade (C), grade ≥3 (D), and bacterial (E) infections. HRs adjusted for other host factors were calculated by Cox proportional-hazards model. (F) Relative distribution of infection grades for bacterial infections comparing HT low versus high patients. CAR-T, chimeric antigen receptor T-cells; HT, CAR-HEMATOTOX.
In our patient cohort, the cumulative incidence of infection was significantly higher in HThigh patients—particularly for severe infections (figure 2C,D). When adjusting for other baseline patient features, the calculated HR for a high HT score was 2.0 (95% CI 1.4 to 3.0) for all-grade and 6.4 (95% CI 3.1 to 13.1) for grade ≥3 infections (figure 2C,D). Furthermore, HThigh patients displayed a significantly increased risk for bacterial infections (adjusted HR 2.2, 95% CI 1.4 to 3.9, figure 2E). Bacterial infections exhibited a higher severity grade in HThigh patients compared with their HTlow counterparts (27% vs 0.9% grade ≥3 infections, p<0.0001, figure 2F). Importantly, the finding that HThigh patients developed more grade ≥3 and severe bacterial infections was conserved across both cohorts (online supplemental figure S4) and when comparing patients treated in Europe vs the USA (online supplemental figure S5). The cumulative incidence of viral and fungal infections did not significantly differ by HT score (online supplemental figure S6A–C). Still, all life-threatening or fatal fungal infections occurred in HThigh patients (online supplemental figure S6D).
A high HT score, prolonged neutropenia and corticosteroid administration represent independent risk factors of severe infection
Next, we performed multivariate analyses to characterize risk factors of infection prior to lymphodepletion and risk determinants after CAR-T transfusion. When studying host factors and accounting for the other baseline features in a multivariate analysis, only a high HT score significantly increased the overall probability of severe infection (figure 3A, adjusted OR 7.7, 95% CI 3.4 to 17.3). Of note, this association was mainly driven by the HT factors hemoglobin and CRP—indicating that both hematopoietic reserve and baseline inflammation contribute to HT-mediated infection risk (online supplemental table S8).

The CAR-HEMATOTOX, prolonged corticosteroid use and prolonged neutropenia represent independent risk factors for severe post-CAR-T infections. (A, B) Forest plots of the multivariate analysis performed as binary logistic regression analysis for the outcome of grade ≥3 infection. (A) Multivariate analysis of host factors determined prior to lymphodepletion (eg, age, disease entity, prior autologous stem cell transplantation, ECOG performance status, LDH >upper limit of normal, absolute lymphocyte count <200 /µL, immunoglobulin G levels <4 g/L, CAR-HEMATOTOX score ≥2). (B) Multivariate analysis of post-CAR-T factors (eg, CAR product—Tisa-cel, ICU admission, CRS/ICANS ASTCT grade ≥2°, tocilizumab administration, corticosteroid use ≥9 days, severe neutropenia ≥14 days, antibacterial prophylaxis use, G-CSF use). Adjusted p values accounting for the respective covariates are displayed on the graph inset. Variables reaching statistical significance (p<0.05) are highlighted in red (increased odds) or blue (decreased odds). (C, D) Binary logistic regression analysis for grade ≥3 infections for the time-dependent variables steroid use (C) and neutropenia (D). The cumulative duration of steroid use was calculated between days 0–21 (at least ≥10 mg dexamethasone equivalent per day). The duration of severe neutropenia (ANC<500 /µL) was determined between days 0–60. The p value is depicted for the Likelihood ratio test (G-squared) with light shading indicating the 95% asymptotic confidence bands. CAR-T, chimeric antigen receptor T-cells; CRS, cytokine release syndrome; ICANS, immune effector cell-associated neurotoxicity syndrome; LDH, lactate dehydrogenase; ANC, Absolute Neutrophil Count; ICU, Intensive Care Unit; ECOG, Eastern Cooperative Oncology Group; ASTCT, American Society for Transplantation and Cellular Therapy; G-CSF, Granulocyte-colony stimulating factor; PPX, prophylaxis.
On binary logistic regression analysis, both extended corticosteroid administration and prolonged duration of severe neutropenia increased the probability of grade ≥3 infections (figure 3C,D). Using ROC curves, the critical discriminatory threshold was determined as ≥9 days for steroid-mediated and ≥14 days for neutropenia-mediated infection risk (online supplemental figure S7). Consistent with the association between the HT score and infection, severe neutropenia ≥14 days increased the probability of grade ≥3 infection (figure 3B, adjusted OR 4.4, 95% CI 2.1 to 9.4). Prolonged corticosteroid administration represented a further independent adverse risk factor (figure 3B, adjusted OR 3.0, 95% CI 1.1 to 7.9). These findings could be confirmed in a multivariate Cox proportional-hazards model incorporating time to grade ≥3 infection (table 2). When studying these adverse risk factors by country, we found that patients treated in Europe had higher HT scores and more pronounced hematological toxicity (online supplemental table S9), which may in part have contributed to the increased rate of grade ≥3 infections.
Multivariable Cox proportional hazards model for severe (grade ≥3) infection
Antibacterial prophylaxis reduces the risk of severe infections in HT high, but not HT low patients
Antibacterial prophylaxis with a fluoroquinolone was associated with a decreased risk of severe infections in the multivariate model (figure 3B, adjusted OR 0.4, 95% CI 0.2 to 0.75). Prophylaxis use reduced both the overall infection rate (online supplemental figure S8A, 37% vs 54%, p=0.004) and particularly the rate of bacterial infections (online supplemental figure S8B, 17% vs 40%, p<0.0001)—regardless of country (online supplemental figure S8C). The incidence of severe bacterial infections was significantly lower in patients receiving prophylaxis (9% vs 24%, online supplemental figure S8D). We did not observe a significant difference in baseline HT scores between patients receiving prophylaxis vs not (online supplemental figure S8E).
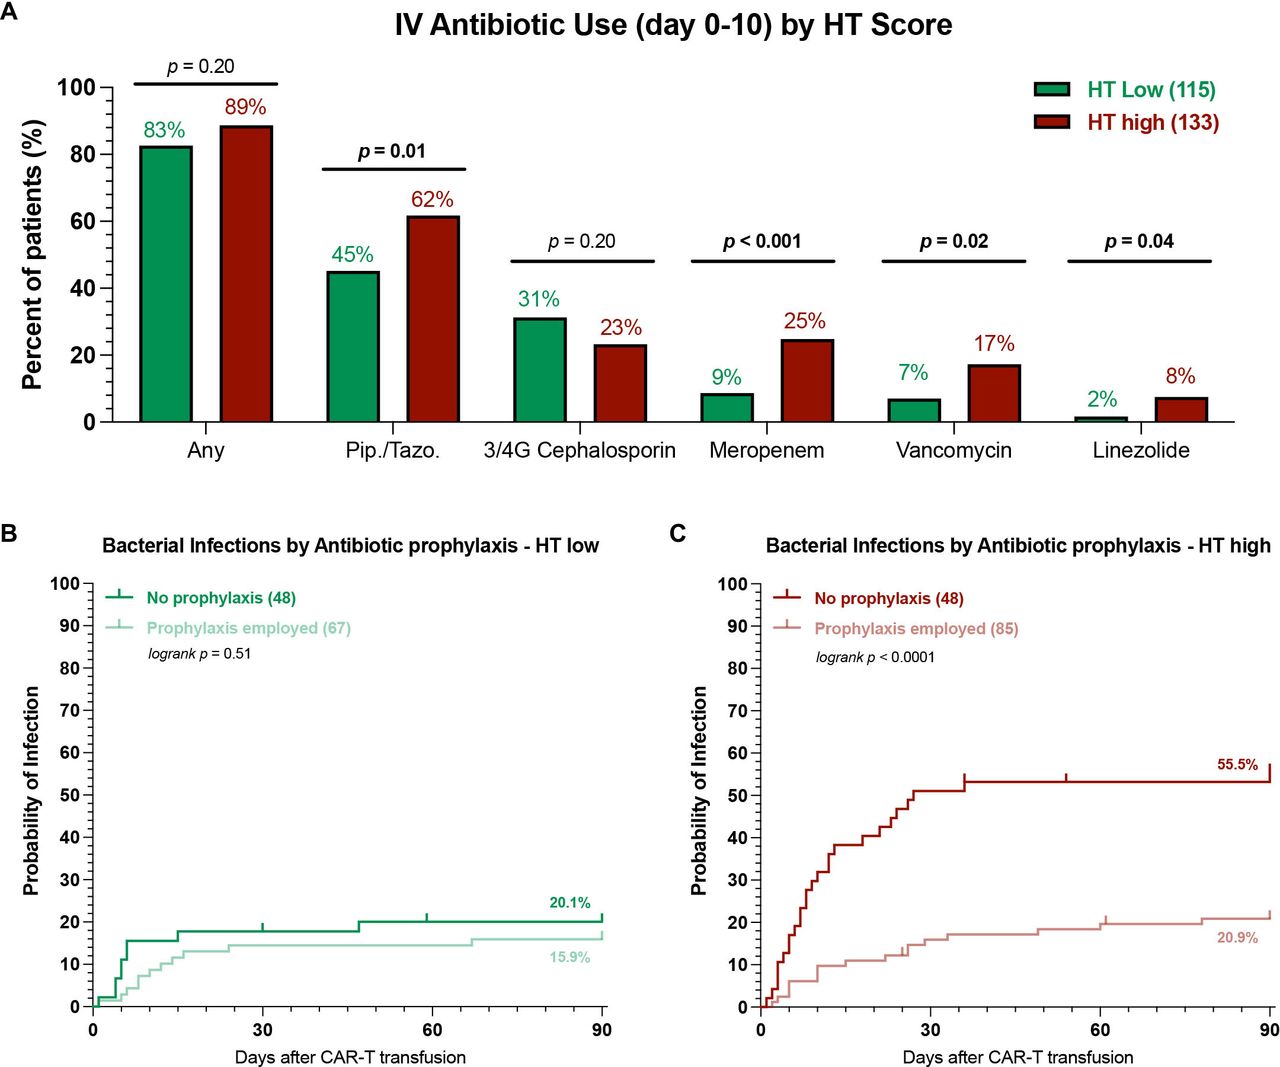
Next, we studied patterns of antibiotic use by HT score and their impact on infection rates. Overall, we found that both HTlow and HThigh patients exhibited a high rate of early intravenous antibiotic use (figure 4A, 83% vs 89%, p=n.s.). Still, the broad-spectrum antibiotics piperacillin/tazobactam and meropenem were more frequently employed in HThigh patients (62% vs 45% and 25% vs 9%, respectively). Furthermore, a higher proportion of HThigh patients received the gram-positive-targeting antibiotics vancomycin and linezolide. A similar percentage of HTlow and HThigh patients received fluoroquinolone prophylaxis (58% vs 64%, p=n.s.). Interestingly, the use of antibacterial prophylaxis differentially influenced infection rates in HTlow vs HThigh patients. While its use did not significantly reduce the cumulative incidence rate of bacterial infections in HTlow patients (figure 4B), a marked reduction was noted for HThigh patients (21% vs 56%, p<0.001). When examining the distribution of infection grades, prophylaxis use was associated with both lower all-grade and grade ≥3 infections in HThigh patients (online supplemental figure S9B). In contrast, HTlow patients very rarely developed severe bacterial infections, regardless of the prophylaxis strategy (online supplemental figure S9A). Overall, these data highlight that prophylaxis strategies with fluoroquinolones may be especially useful in HThigh patients.

HT high patients receiving antibacterial prophylaxis exhibit lower rates of bacterial infections. (A) Comparison of intravenous antibiotic use during the first 10 days after CAR-T transfusion in HT low (green) vs HT high (red) patients. Pip./Tazo=piperacillin/tazobactam, 3/4G = 3rd or fourth generation cephalosporin. Only antibiotics that were employed at least 10 times were included, for detailed list see online supplemental table 5; p values determined by Fisher’s exact test. (B, C) Cumulative incidence curves (day 0–90) for bacterial infections by antibacterial prophylaxis use (PPX) in HT low (B) and HT high (C) patients. Light shading indicates patients receiving antibacterial prophylaxis, while dark shading denotes no antibacterial prophylaxis use; p values were determined by Mantel-Cox log-rank test comparing PPX vs no PPX. CAR-T, chimeric antigen receptor T-cells; HT, CAR-HEMATOTOX.
Patients with a high HT score and with severe infectious complications display poor survival outcomes
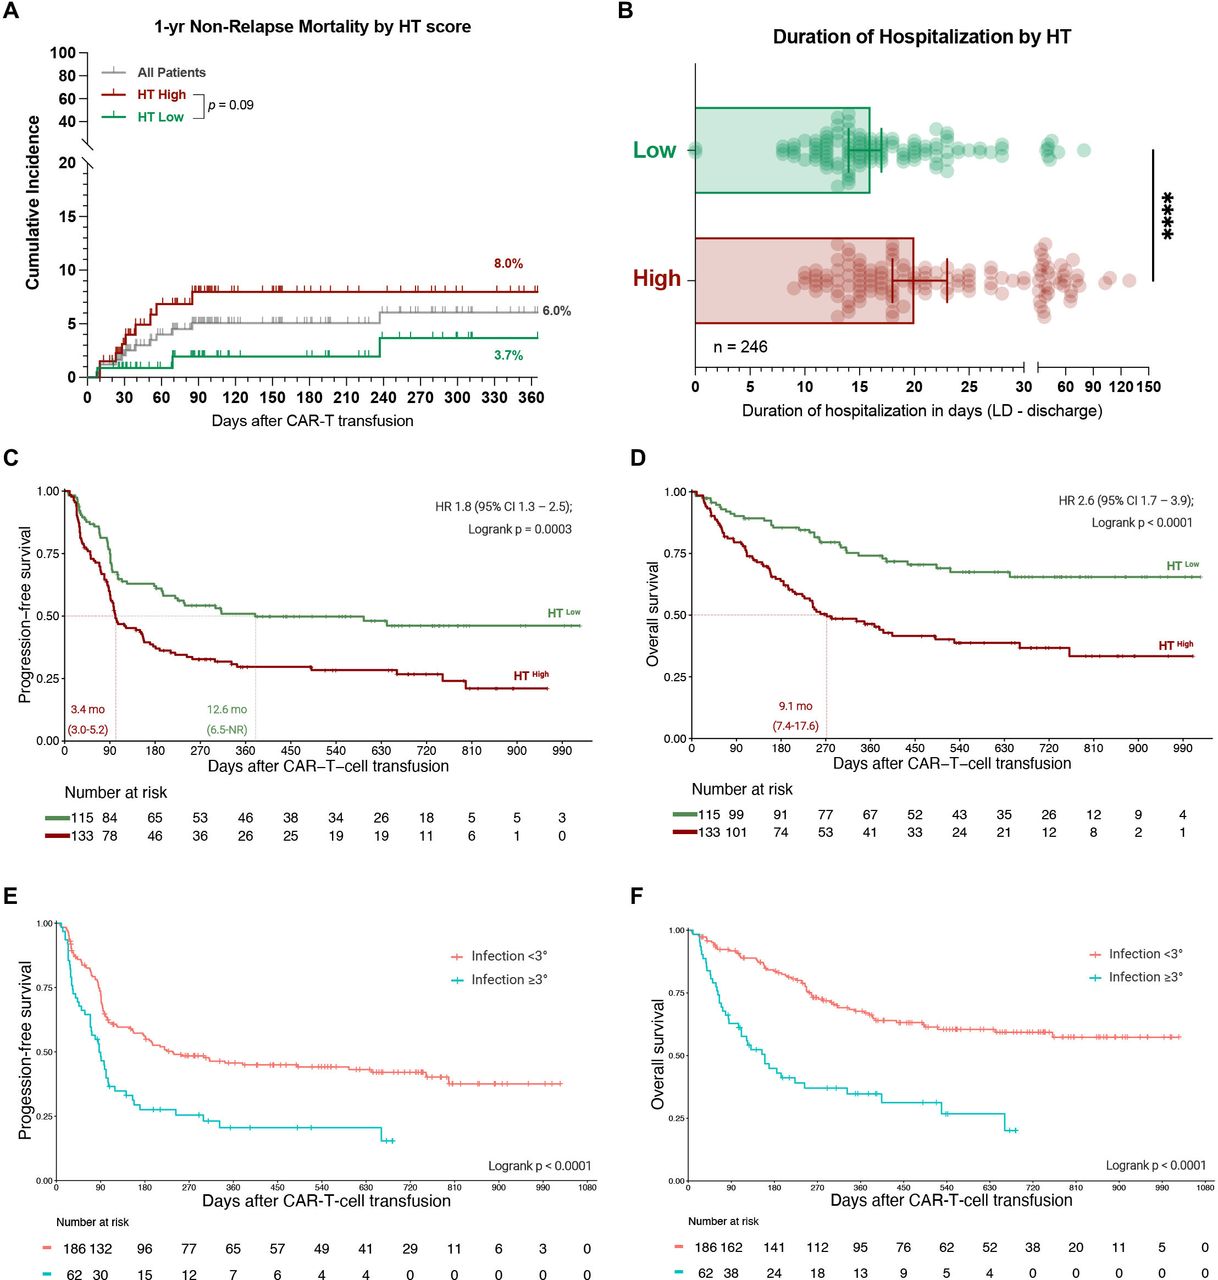
The 1-year non-relapse mortality in our patient cohort was 6.0% (figure 5A) and was largely attributed to an infectious cause (10/15 deaths, online supplemental file 1). An overview of all infection-related deaths is provided as a case series in online supplemental table S6. Notably, the seven patients that died of early (day 0–90) infectious complications predominantly presented with an elevated HT score (median: 3) and an aplastic phenotype of neutrophil recovery (5/7 patients). They also observed a high toxicity burden (median CRS and ICANS grade: 2 and 4) and developed prolonged neutropenia (median 26 days). Overall, this resulted in a trend towards increased non-relapse mortality in HThigh patients (8.0% vs 3.7%, p=0.09, figure 5A).

Patients with a high HT score and with severe infectious complications display poor survival outcomes. (A) 1-year non-relapse mortality (NRM) across all patients (gray) and in HThigh (red) vs HTlow (green) patients. The p value of the Mantel-Cox log-rank test comparing HThigh vs HTlow patients is depicted. (B) Median duration of hospitalization from the time point of lymphodepletion until the day of first discharge or death by HT score (data available for 246 patients). Statistical significance was determined by Mann-Whitney test. (C, D) Kaplan-Meier estimates of progression-free (C) and overall survival (D) by HT score. The median PFS and OS in months for HThigh (red) vs HTlow (green) patients is depicted on the lower left graph inset with the respective 95% CI. The HR with the 95% CI comparing HThigh (test) vs HThigh (comparator) in a univariate Cox regression model is depicted together with the p value of the log-rank test on the upper right graph inset. (E, F) Kaplan-Meier estimates of PFS (E) and OS (F) comparing patients with grade ≥3 infections (blue) to patients with grade <3 infections (orange). The p value of the log-rank test is depicted on the graph inset. OS, overall survival; PFS, progression-free survival; HT, CAR-HEMATOTOX.
Importantly, the median duration of hospitalization was longer in HThigh patients (20 vs 16 days, p<0.0001, figure 5B), highlighting the clinical relevance and potential health economic impact of the score. In terms of clinical outcomes, a high HT score was associated with both inferior PFS (figure 5C) and OS (figure 5D). The median PFS was 3.4 vs 12.6 months (p=0.0003), while the median OS was 9.1 months vs not-reached (p<0.0001) for HThigh vs HTlow patients. This translated into a significantly increased HR of 1.8 (95% CI 1.3 to 2.5) and 2.6 (95% CI 1.7 to 3.9) for PFS and OS, respectively, in HThigh patients. The adverse prognostic impact of the HT score on survival outcomes was confirmed in both the derivation cohort and the independent validation cohort (online supplemental figure S10B–E). Interestingly, patients who developed grade ≥3 infections displayed significantly worse clinical outcomes when compared to patients without or with mild infections (figure 5E,F). Together these findings underline broad applications of the HT score beyond risk-stratification of toxicities alone and highlight the adverse prognostic role of infectious complications in the context of CAR-T.
Discussion
In this multicenter real-world cohort of 248 patients treated with CD19 CAR-T for R/R LBCL, we demonstrated that a high HT score, prolonged steroid use and an increased duration of severe neutropenia represent independent risk factors for grade ≥3 infections after CAR-T, while antibacterial prophylaxis reduced the risk of severe infections in high-risk patients. HThigh patients more frequently developed infectious complications—especially severe infections (40% vs 8%) and severe bacterial infections (27% vs 0.9%). We confirm that infections substantially contribute to non-relapse mortality after CAR-T, and describe inferior PFS and OS in HThigh patients.
The incidence, distribution and clinical severity of infections was comparable to other published reports.7 8 13 14 24 With a cumulative incidence rate of 44% and 24% for all-grade and severe infections respectively, infectious complications represent a frequent CAR-T-associated toxicity. Infections most commonly occur in a vulnerable early phase between days 0 and 21 in which patients observe coincident immunotoxicity (eg, CRS, ICANS, hematological toxicity).24 There is considerable overlap between the diffuse capillary leakage and organ damage observed during CRS, and the dysregulated systemic inflammatory and immune response to microbial invasion found in sepsis and septic shock.25 Our data suggest that post-CAR-T infection risk is particularly driven by an extended administration of high-dose steroids as a result of high-grade CRS and/or ICANS. Corticosteroids impair both innate and adaptive immunity and modulate the inflammatory response to pathogens.26 Prior analyses examined steroid use as a binary as opposed to time-dependent variable,8 which may have obfuscated the negative impact of extended corticosteroid use for post-CAR-T infections. The second force driving severe infections after CAR-T lies in dysfunctional hematopoietic recovery, which is characterized by persistent or biphasic cytopenia.10 This likely results in the depletion of multiple functionally relevant immune cell subtypes including B- and T-lymphocytes, monocytes/macrophages and neutrophils. Prolonged neutropenia may also potentiate mucosal barrier injury,27 thereby contributing to bloodstream infections which were the most common infection type in our cohort. Importantly, tocilizumab did not increase infection risk in our cohort. Apprehension about single-dose tocilizumab as an immunocompromising agent therefore appears unfounded, as its use may indeed prevent high-grade CRS and the need for high-dose corticosteroids.28
The fact that the HT score represented an independent risk factor for severe infections underlines the critical role of the host in facilitating post-CAR-T infections.24 The score implicates both baseline hematopoietic reserve and inflammation as key risk determinants. More than half of all treated patients were HThigh (54%), highlighting that patients receiving CAR-T in the real-world setting often present to lymphodepletion in a state of progressive disease with high levels of inflammation. CAR-HEMATOTOX scores were significantly higher in Tisa-cel compared with Axi-cel patients (online supplemental table S9), providing a potential explanation for the modest increase of infection risk with Tisa-cel in the multivariate model. We also found that a higher proportion of HThigh patients was treated with the Tisa-cel product, which may reflect center-specific differences in product-choice or reflect clinician preference due to the expected toxicity profile in high-risk patients. Furthermore, more European patients were HThigh, which may reflect country-wide differences in the implementation of CAR T-cell therapy and warrants further systematic study. The increased incidence of grade ≥3 infections in the European cohort is likely multifactorial. Collectively, the EU cohort was characterized by a higher percentage of HThigh patients, more pronounced hematotoxicity, and less frequent use of antibacterial prophylaxis (online supplemental table S9)—all independent risk factors of severe infections in this study.
Notably, we find that antibacterial prophylaxis impacts the rate of severe bacterial infections in HThigh but not HTlow patients. Considering the high utilization of intravenous antibiotics in HTlow patients (83%) despite a markedly low rate of severe bacterial infections (<1%), a more nuanced approach to antibiotic use for HTlow patients appears sensible. Antibacterial prophylaxis did not confer an added benefit in terms of controlling bacterial infections and thus should be avoided due to fluorquinolone-specific side effects, the potential emergence of resistant strains, and selection for Clostridium difficile and enterococci.29–33 It is important to note that the large majority of CAR-T patients develop (transient) lymphodepletion-associated neutropenia during the phase of clinical CRS.10 34 The underlying etiology of febrile neutropenia in the CAR-T patient therefore commonly is CRS as opposed to infection—especially in the absence of clinical signs of infection or patient-specific risk factors. For this reason, reducing antibiotic exposure in CAR-T patients may be feasible and HTlow patients appear to be a low-risk group that could be targeted in prospective studies. This would help prevent the negative impact of antibiotic exposure on the intestinal micromilieu with recent evidence pointing toward the multifunctional and immunomodulatory role of the microbiome in the context of CAR-T specifically.35–37 Clearly, clinical tools that adequately distinguish fever secondary to infection from CRS are urgently needed. In contrast, our data suggest a potential benefit of antibacterial prophylaxis in HThigh patients. With a median duration of severe neutropenia of 13 days, HThigh patients fall within IDSA recommendations for evidence-based antimicrobial prophylaxis.29 Early G-CSF administration represents a further strategy to ameliorate the risk of severe infections in this high-risk patient collective.38 39 Ultimately, these interventions will need to be studied prospectively. Overall, the outlined HT-adapted approach to anti-infective therapy may thread the needle between sparing the microbiome in select low-risk patients, while still preventing severe infections in patients at high risk for infectious complications.
Interestingly, the pronounced baseline inflammation, tumor burden, and cytopenia observed in HThigh patients (online supplemental table S4) translated into significantly worse clinical outcomes (mPFS 3.4 onths, median OS 9.1 months). Previous reports have established the adverse prognostic impact of an inflamed tumor microenvironment and systemic immune dysregulation in LBCL.40 Tumor expression of interferon signaling and high blood levels of monocytic myeloid-derived suppressor cells were associated with poor CAR-T expansion, treatment resistance, and a lack of durable reponse.17 Predictive models incorporating CRP and ferritin such as the modified EASIX score have also provided a link between inflammation and the toxicity burden after CAR-T.18 41 Next to the adverse effect conferred by inflammation prior to lymphodepletion, there are several potential explanations for the negative prognostic influence of the HT score. First, prolonged myelosuppression likely prevents the replenishing of pools of regulatory immune cells such as regulatory T-cells and myeloid-derived suppressor cells that may be required for long-term CAR-T persistence and anti-lymphoma activity.42 Second, infectious complications substantially contribute to non-relapse mortality, and life-threatening and fatal events were more common in HThigh patients. Finally, prolonged cytopenia may prevent patients from receiving potentially efficacious post-relapse therapy due to low blood counts (eg, chemotherapy, antibody-drug conjugates, immunomodulatory drugs, bispecific antibodies). Pancytopenic patients are also often not eligible for clinical trials.
The strength of this study lies in the multicenter design and the incorporation of a large number of both Axi-cel and Tisa-cel patients. However, the different CAR T-cell centers varied in their institutional protocols concerning diagnostic standard operating procedures, antimicrobial prophylaxis use, and trigger points for G-CSF application (online supplemental tables S1 and 2). These confounding variables may have influenced infection rates. Because only one US center was included in our study, we cannot ascertain if the lower number of documented severe infections reflects consistent antibiotic prophylaxis at US sites per se. Previous reports illustrate that not all US centers employ prophylaxis.8 13 43 A comparison of studies on infectious complications from various US sites support our findings, with fewer severe bacterial infections at sites applying stringent antibacterial prophylaxis (online supplemental table S10). Moreover, the rate of bacterial infections was similarly low in the European patients that received prophylaxis, further arguing against our US cohort being an outlier (online supplemental figure S8C). Other limitations include the retrospective nature of the analysis and the limited follow-up time of 90 days. Future studies will have to prospectively evaluate if HT-adapted anti-infective prophylaxis and/or early G-CSF use truly mitigate infection risk. The survival disadvantage found in HThigh patients suggests that the score is of prognostic value and useful for distinguishing patients at highest risk for disease progression and resistance to CD19 CAR-T in lymphoma. These findings will also have to be validated independently and in a prospective manner. If confirmed, the score may guide patient selection and resource allocation, and help identify patients that require novel and/or escalated therapeutic strategies.
In conclusion, the CAR-HEMATOTOX represents a useful and easy-to-apply clinical score to risk-stratify patients for hematological toxicity, infectious complications, and clinical outcomes prior to lymphodepletion.
Data availability statement
Data are available on reasonable request. For original data and material, please contact marion.subklewe@med.uni-muenchen.de.
Ethics statements
Patient consent for publication
Ethics approval
All procedures performed in this study involving human participants were in accordance with the ethical standards of the institutional research committee and with the 1964 Declaration of Helsinki and its later amendments or comparable ethical standards. All patients provided informed written consent.
Acknowledgments
The authors thank the patients and their families for their participation in this study. We thank Matthias Hoster for his generous help in programming the CAR-HEMATOTOX online calculator.
References
Supplementary materials
Supplementary Data
This web only file has been produced by the BMJ Publishing Group from an electronic file supplied by the author(s) and has not been edited for content.
Footnotes
Twitter @KRejeski, @michaeldjain, @MSubklewe
Contributors Conceptualization: KR and MS. Investigation: KR, AP, GI, OP, VeB, LJ, DM, GJ, BA, ViB and CC. Formal analysis and visualization: KR and VeB. Methodology: KR, VeB and MS. Statistical advice: EH. Writing original draft: KR and MS. Writing review and editing: KR, AP, GI, OP, VeB, DM, EH, LB, FLL, MvB-B, AM, WAB, PB, MJ and MS. Guarantor: MS. All authors read and approved the final manuscript.
Funding This work was supported by a Deutsche Forschungsgemeinschaft (DFG, German Research Foundation) research grant provided within the Sonderforschungbereich SFB-TRR 388/1 2021-452881907, and DFG research grant 451580403 (to MS). The work was further supported by the Bavarian Elite Graduate Training Network (to MS), the Wilhelm-Sander Stiftung (to MS, project no. 20180871), the Else-Kröner-Fresenius Stiftung (to MS), and the Bavarian Center for Cancer Research (BZKF).
Competing interests KR: Kite/Gilead: Research Funding and travel support. Novartis: Honoraria. GI: Consultancy and Honoraria: Novartis, Roche, Kite/Gilead, Bristol-Myers Squibb, Abbvie, Janssen, Sandoz, Miltenyi. OP: has received honoraria or travel support from Astellas, Gilead, Jazz, MSD, Neovii Biotech, Novartis, Pfizer and Therakos. He has received research support from Gilead, Incyte, Jazz, Neovii Biotech and Takeda. He is member of advisory boards to Jazz, Gilead, MSD, Omeros, Priothera, Shionogi and SOBI. VeB: AMGEN: Honoraria; Celgene: Research Funding; Pfizer: Honoraria; Kite/Gilead: Research Funding, Honoraria; Novaritis: Honoraria. DM: Abbvie: Consultancy, Honoraria, Novartis: Consultancy; Janssen: Consultancy; AMGEN: Consultancy, Research Funding; Celgene: Consultancy, Honoraria; Kite/Gilead: Consultancy, Honoraria, Research Funding; Roche AG: Consultancy; Takeda: Consultancy. CC: Takeda: Honoraria, Consultancy/Advisory; Novartis: Honoraria, Consultancy/Advisory. ViB: Novartis: Honoraria, Research Funding; Gilead: Consultancy, Honoraria, Research Funding; Celgene: Research Funding; Janssen: Research Funding. LB: Advisory role or expert testimony-Abbvie, Bristol-Myers Squibb, Celgene, Daiichi Sankyo, Gilead, Hexal, Janssen, Jazz Pharmaceuticals, Menarini, Novartis, Pfizer; Honoraria-Abbvie, Amgen, Astellas, Bristol-Myers Squibb, Celgene, Daiichi Sankyo, Janssen, Jazz Pharmaceuticals, Novartis, Pfizer, Sanofi, Seattle Genetics; Financing of scientific research-Bayer, Jazz Pharmaceuticals. FLL: has a scientific advisory role with Kite, a Gilead Company, Novartis, Celgene/Bristol-Myers Squibb, GammaDelta Therapeutics, Wugen, Amgen, Calibr, and Allogene; is a consultant with grant options for Cellular Biomedicine Group, Inc.; and receives research support from Kite, a Gilead Company, Novartis, and Allogene; and reports that his institution holds unlicensed patents in his name in the field of cellular immunotherapy. MvB-B: Consultancy, Research Funding and Honoraria: MSD Sharp & Dohme, Novartis, Roche, Kite/Gilead, Bristol-Myers Squibb, Astellas, Mologen, and Miltenyi. AM: Advisory, Speaking Engagement: Gilead, Novartis. WAB: Novartis: Consultancy, Honoraria Gilead: Consultancy, Honoraria, Miltenyi: Consultancy, Research Funding. PB: declares having received honoraria from Amgen, BMS, Gilead, Incyte, Miltenyi Biotec, Novartis and Pfizer not related with the present article. MJ: Kite/Gilead: Consultancy/Advisory, Novartis: Consultancy/Advisory, BMS: Consultancy/Advisory, Takeda: Consultancy/Advisory. MS: Morphosys: Research Funding; Novartis: Consultancy, Research Funding; Janssen: Consultancy; Seattle Genetics: Research Funding; AMGEN: Consultancy, Honoraria, Research Funding; Celgene: Consultancy, Honoraria; Kite/Gilead: Consultancy, Honoraria, Research Funding; Roche AG: Consultancy, Research Funding. The remaining authors have nothing to declare. None of the mentioned conflicts of interest were related to financing of the content of this manuscript.
Provenance and peer review Not commissioned; externally peer reviewed.
Supplemental material This content has been supplied by the author(s). It has not been vetted by BMJ Publishing Group Limited (BMJ) and may not have been peer-reviewed. Any opinions or recommendations discussed are solely those of the author(s) and are not endorsed by BMJ. BMJ disclaims all liability and responsibility arising from any reliance placed on the content. Where the content includes any translated material, BMJ does not warrant the accuracy and reliability of the translations (including but not limited to local regulations, clinical guidelines, terminology, drug names and drug dosages), and is not responsible for any error and/or omissions arising from translation and adaptation or otherwise.