Article Text

Abstract
Background Immune checkpoint inhibitors (ICIs) have revolutionized the cancer therapy landscape due to long-term benefits in patients with advanced metastatic disease. However, robust predictive biomarkers for response are still lacking and treatment resistance is not fully understood.
Methods We profiled approximately 800 pre-treatment and on-treatment plasma proteins from 143 ICI-treated patients with non-small cell lung cancer (NSCLC) using ELISA-based arrays. Different clinical parameters were collected from the patients including specific mutations, smoking habits, and body mass index, among others. Machine learning algorithms were used to identify a predictive signature for response. Bioinformatics tools were used for the identification of patient subtypes and analysis of differentially expressed proteins and pathways in each response group.
Results We identified a predictive signature for response to treatment comprizing two proteins (CXCL8 and CXCL10) and two clinical parameters (age and sex). Bioinformatic analysis of the proteomic profiles identified three distinct patient clusters that correlated with multiple parameters such as response, sex and TNM (tumors, nodes, and metastasis) staging. Patients who did not benefit from ICI therapy exhibited significantly higher plasma levels of several proteins on-treatment, and enrichment in neutrophil-related proteins.
Conclusions Our study reveals potential biomarkers in blood plasma for predicting response to ICI therapy in patients with NSCLC and sheds light on mechanisms underlying therapy resistance.
- tumor biomarkers
- translational medical research
- lung neoplasms
Data availability statement
All data relevant to the study are included in the article or uploaded as supplementary information.
This is an open access article distributed in accordance with the Creative Commons Attribution Non Commercial (CC BY-NC 4.0) license, which permits others to distribute, remix, adapt, build upon this work non-commercially, and license their derivative works on different terms, provided the original work is properly cited, appropriate credit is given, any changes made indicated, and the use is non-commercial. See http://creativecommons.org/licenses/by-nc/4.0/.
Statistics from Altmetric.com
WHAT IS ALREADY KNOWN ON THIS TOPIC
Current biomarkers for immunotherapy outcome have low predictive power, and are usually based on biopsies taken from solid tumors.
WHAT THIS STUDY ADDS
Our study employs a machine-learning and bioinformatics-based approach on ~800 plasma proteins to identify novel blood-based biomarkers that predict response to immune checkpoint inhibitor (ICI) therapy in patients with non-small cell lung cancer.
HOW THIS STUDY MIGHT AFFECT RESEARCH, PRACTICE AND/OR POLICY
We have identified a predictive signature that stratifies between responders and non-responders with a validated receiver operating characteristics area under the curve of ~0.8, and we show that neutrophils play a role in ICI therapy resistance. Our approach enables the identification of clinically relevant biomarkers and provides a framework for advancing the field of immuno-oncology.
Introduction
Over the last decade, immune checkpoint inhibitors (ICIs) targeting the programmed cell death protein-1 (PD-1)/programmed death ligand-1 (PD-L1) axis have emerged as standard-of-care treatments for non-small cell lung cancer (NSCLC).1 2 These agents disrupt the interaction between PD-1 on T cells and PD-L1 on tumor cells, thereby enhancing an antitumor immune response.3 ICIs represent breakthrough treatments for NSCLC due to unprecedented durable responses. For example, the 5-year survival rate for first-line pembrolizumab was found to be 31.9% compared with 16.3% for chemotherapy in stage IV NSCLC patients with tumors expressing high PD-L1 levels.4 Although ICI therapy achieves impressive long-term survival in some patients, the overall response rate is modest, ranging from 20% to 50% in patients with NSCLC.2 A significant proportion of patients display innate resistance to ICIs, and many of those who derive initial clinical benefit experience disease progression at a later stage.5 The mechanisms underlying innate and acquired resistance to ICIs are not fully understood. However, multiple tumor-intrinsic and tumor-extrinsic mechanisms have been proposed. These include aberrations in cell signaling, T-cell exclusion, immunosuppressive cells, presence of inhibitory checkpoints, loss of interferon-γ signaling, and loss of tumor-related antigenic proteins.3 6 7 Despite intensive research in this direction, robust predictive and prognostic biomarkers for ICIs remain elusive. In current clinical practice, PD-L1 expression, tumor mutational burden (TMB) and mismatch repair deficiency in tumors are being used as predictive biomarkers for benefit from ICI therapy in a variety of cancer types.8 9 These biomarkers, all of which are based on tumor-intrinsic factors, have modest predictive power.10 11 For example, clinical evidence shows that only 45% of patients with NSCLC with tumors highly positive for PD-L1 have confirmed response to PD-1/PD-L1 blockade.12 Notably, several reports demonstrate that integrating PD-L1 and TMB biomarkers improves predictive power.13 14 Nevertheless, there is still a substantial need for better predictive markers to guide treatment decisions. Given the complex and dynamic interplay between the tumor and its microenvironment, it is likely that a combination of biomarkers covering both tumor and host factors will perform better than single biomarkers originating solely from the tumor. Indeed, other explored biomarkers are related to tumor-infiltrating immune T cells (in their different phenotypic states),15 immunosuppressive macrophages and myeloid derived suppressor cells,16 peripheral T-cell dynamics,17 18 and ratios between checkpoints and other key proteins in the immune synapse.19
Our previous studies have highlighted how host-mediated responses to various cancer treatment modalities contribute to disease progression and therapy resistance.20 21 Most recently, in preclinical mouse models, we demonstrated that ICI agents induce systemic changes in host-derived factors which subsequently enhance tumor aggressiveness, with interleukin (IL)-6 playing a key role in this process.22 Thus, analyzing therapy-induced changes in the levels of circulating factors provides valuable insights into the biological mechanisms driving response and resistance to therapy.
Here we studied pre-treatment and on-treatment plasma proteomic profiles of patients with advanced stage NSCLC undergoing ICI-based therapy. Using a machine-learning approach, we identified a predictive signature for response that is comprised of two proteins and two clinical parameters. The study included signature development on training and development sets, and validation on an independent test set. A further exploration of the proteomic profiles revealed three patient clusters with distinct clinical and biological features. In addition, patients who did not benefit from ICI therapy displayed significantly higher plasma levels of several proteins on-treatment, as well as heightened neutrophil activity that was amplified on treatment. Collectively, our findings pave the way towards predictive biomarker discovery and provide insights into mechanisms of resistance to ICI therapy.
Materials and methods
Plasma collection from patients with NSCLC
Cohort 1 plasma samples were purchased from a biobank (Indivumed, Germany). Sample collection started in May 2016 and ended in May 2019. Cohort 2 plasma samples were collected from Sheba Medical Center, Israel. Sample collection started in March 2017 and ended in September 2019. Inclusion criteria: provision of informed consent; age above 18; stage IIIB–IV patients with NSCLC. Exclusion criteria are any concurrent and/or other active malignancy that has required systemic treatment within 2 years of first dose of treatment. Patients signed an informed consent. Cohort size was set by availability of samples at the collected time point. Plasma samples were collected at baseline (before treatment) and 2–6 weeks after commencement of treatment. The patients received either monotherapy (nivolumab; pembrolizumab; atezolizumab) or combination therapy with pembrolizumab with chemotherapy). Patients’ clinical data are provided in online supplemental table S1. Altogether, 156 plasma samples were collected retrospectively.
Supplemental material
Supplemental material
Proteomic profiling
Plasma protein levels were measured using Quantibody multiplex ELISA antibody arrays (RayBiotech, Peachtree Corners, Georgia, USA). Samples were acquired in three running batches. Cohort 1 included a total of 93 patients, 40 in running batch 1 (Cohort 1A) and 53 in running batch 2 (Cohort 1B). Overall, 840 and 760 proteins were measured in Cohort 1A and Cohort 1B, respectively. Cohort 2 contained 63 samples and 1000 plasma proteins were measured. The difference in the protein numbers derives from the available plasma volume. In the case of limited plasma volume, we measured 760 or 840 selected proteins rather than the entire repertoire of 1000 proteins. Proteins were selected based on technical parameters such as measurability and relevance, as was defined in an independent cohort of patients with NSCLC (not included in this cohort). Normalized proteomic data are provided in online supplemental table S2.
Supplemental material
Proteomic data quality check
Patient samples were defined as outliers and were excluded based on the assumption that the range of protein levels spanned by all measured proteins should be similar across all samples. An outlier sample was defined as a sample for which the median expression level across all measured proteins was either smaller than Q1 or greater than Q3 of the level distribution of all proteins in all samples. In total, 13 outlier patients were discovered and excluded from the analysis (five outliers in Cohort 1, eight outliers in Cohort 2; online supplemental figures S1 and S2).
Limit of detection (LOD) was defined according to RayBiotech definitions. Protein measurement below LOD is defined as non-measurable; proteins having an overall measurability above 50% of the samples were used for the classifier generation and the rest were excluded. Measurement below LOD were rounded to the LOD level. For the machine learning-based analysis of the entire data set, 508 protein targets were used following the filtration. For the bioinformatic analysis of Cohort 2 subset, 810 proteins were kept for analysis following filtration of measurable proteins in at least 50% of Cohort 2 patients.
Identification of a predictive signature for therapy response
Patients from both cohorts were randomly assigned to three sets: training (n=72), development (n=36) and test (n=35). The latter was examined blinded by keeping the response label separately. The percentage of patients responding to treatment was held constant in all three sets. For each protein target, three features were generated: T0 measurement, T1 measurement and fold-change between T1 and T0 (FC). The training set was used to generate a classifier for each feature in conjunction with age and sex using the XGBoost algorithm. In order to prevent an area under the curve (AUC) estimate that is over fitted on the training set, 300 models were generated for each feature based on randomly selected subsets of 60% of the patients in the training set and evaluated on the remaining 40%. False discovery rate (FDR) was calculated using the Benjamini-Hochberg procedure. Overall, 53 features with FDR <0.15 were used to generate a predictor on the development set. A multiprotein signature was generated based on the development set by using forward selection on the top six features (AUC >0.7 on the development set). The resulting model (based on CXCL10 at T1, CXCL8 at T1, IGFBP3 at T0, sex and age) was validated on the test set. IGFBP3 at T0 did not contribute to the test result and thus was excluded from the final signature. The performance of the signature was assessed using AUC of the receiver operating characteristics (ROC) plot. To determine the effect of excluding 12 chemo-immunotherapy-treated patients from the data set, 1000 iterations were performed where in each iteration, 12 random patients were excluded, while the AUC was determined.
Statistical and bioinformatic analysis
The entire analysis was performed following log2 transformation, using R packages, Perseus,23 Python or GraphPad software (San Diego, California, USA, http://www.graphpad.com).
Association between response and clinical parameters: To identify association of categorical clinical data (line of treatment; treatment type; Tumor Proportion Score (TPS); histological type; sex; body mass index (BMI) status; mutations; smoking history; metastatic sites) with response, a χ2 test was performed. To examine the correlation between age and response, an unpaired student’s t-test was performed.
Protein or gene expression in healthy tissue, tumor tissue and blood cells: Data were acquired from the Human Protein Atlas from http://www.proteinatlas.org.24
Clustering analysis: ConsensusClusterPlus package25 was used following Z-score normalization with the following parameters: maximal number of k was set to 6; number of iterations was set to 1000; fraction of subsetting was set to 0.8; clustering algorithm was set to hierarchical; distance matrix was Pearson correlation. Patients from each consensus cluster were subjected to enrichment analysis of clinical features using Fisher’s exact test (Benjamini-Hochberg FDR <0.1). Analysis of variance (ANOVA) test was conducted to identify differentially expressed proteins between the different patient clusters (Permutation-based FDR <0.01). Each group of proteins that was higher in each patient cluster was subjected to biological pathway enrichment analysis (Fisher’s exact test, Benjamini-Hochberg FDR <0.1) against the background of 810 proteins examined in the bioinformatic analysis. Functional groups were derived from Gene Ontology resource,26 27 Kyoto Encyclopedia of Genes and Genomes resource,28 and Cancer Hallmarks Analytics Tool resource.29 Voronoi plots for the proteins in each consensus cluster were plotted using Proteomaps.30
Differentially expressed protein (DEP) analysis: Comparison between T0 and T1 was performed using paired t-test (Benjamini-Hochberg FDR <0.05). To identify DEPs between responders and non-responders, Student’s t-test was performed either using permutation-based FDR <0.1 or p value<0.05 thresholds. Enrichment analysis was performed on the lists of DEPs using Fisher’s exact test (Benjamini-Hochberg FDR <0.1) against the background of 810 proteins examined in the bioinformatic analysis. Network analysis was based on STRING database.31
Results
Cohort description
To gain insights into proteins associated with response and resistance to ICI-based therapy in patients with NSCLC, we analyzed proteomic and clinical data from a retrospective cohort comprised of 156 ICI-treated patients with NSCLC. Proteomic data were acquired using ELISA-based multiplex arrays. Specifically, the levels of 760–1000 proteins (depending on the cohort; additional details are provided in Materials and Methods) were quantified in patient plasma samples collected at baseline (T0) and 2–6 weeks after commencement of treatment (T1). Following a quality assessment of the proteomic data, 13 patients were identified as outliers and were excluded from the analysis (for further details see methods; online supplemental figure S1 and S2). Out of the 143 remaining patients with NSCLC in the analysis, 70 displayed no clinical benefit (48.95%) and 73 benefited from therapy (51.05%). In this study, therapy response evaluation was based on response evaluation criteria in solid tumors (RECIST) criteria at 3 months, where patients who benefited from therapy were identified as patients with stable disease, partial response and complete response (termed ‘responders’), while those who did not, were defined as patients with progressive disease (termed ‘non-responders’). Notably, in this study, we did not investigate response at 6 months or best overall response rate.
Patient characteristics are presented in figure 1A–C. The responder and non-responder groups displayed a significant difference in overall survival (OS). Most patients had adenocarcinoma (73.4%), while 18.9% had squamous cell carcinoma. The majority of the patients were men (65.7%) and 50 patients (34.9%) received ICI as a first line therapy. Most of the patients (88.1%) received anti-PD1-based treatment (either pembrolizumab or nivolumab), and 8.4% received anti-PD1-based treatment combined with chemotherapy. The rest received anti-PD-L1-based treatment (atezolizumab).

Overview of cohort and methodology. (A) Heatmap representing patient demographics and clinical characteristics. (B–H) Patient characteristics, categorized by responders (light blue) and non-responders (dark blue), are presented as follows: Number of responders and non-responders in the cohort (B); survival curve (C); age distribution (D); PD-L1 status (E); treatment type (F); KRAS mutation (available only in Cohort 2) (G); and P53 mutation (available only in Cohort 2) (H). (I) Methodology outline. Plasma samples were obtained from patients at T0 (pre-treatment) and T1 (early on-treatment). Proteomic profiling was performed with multiplex ELISA-based arrays. Proteomic and clinical data served as input for machine learning based analysis to extract a predictive signature for response to treatment. Proteomes were characterized by bioinformatic analyses to gain insights into treatment response and resistance mechanisms. ADC, adenocarcinoma; BMI, body mass index; ICI, immune checkpoint inhibitors; NR, non-responder; PD-1, programmed cell death protein-1; PD-L1, programmed death ligand-1; R, responder; SCC, squamous cell carcinoma; SD, stable disease.
Examination of the correlation between clinical data and response identified five clinical features that display a significant difference between responders and non-responders (two of which were available only in Cohort 2). First, older age was associated with response (figure 1D), in agreement with a meta-analysis study indicating that patients older than 65 benefit more from ICI therapy.32 Second, PD-L1 TPS was associated with response (figure 1E). Indeed, TPS is used clinically as a predictive biomarker for response.33 Third, patients receiving combined treatment (immunotherapy and chemotherapy) benefited more than anti-PD-1-based or anti-PD-L1-based monotherapy, as was previously shown, in some cases probably due to the chemotherapy34 (figure 1F). Two mutations, KRAS and TP53 (measured in Cohort 2 only), correlated with response (figure 1G,H), though sample size was quite small. No correlations were found between response and other examined clinical features, namely histology, sex, line of treatment, smoking (in Cohort 2), BMI and different metastatic sites (online supplemental figure S3). Lastly, the proteomic and clinical data were used as an input for machine learning and bioinformatic analyses to gain further clinical insights (figure 1I), as outlined below.
A plasma-based predictive signature for response to ICI therapy
To identify a predictive signature for response to ICI therapy, we randomly divided the cohort into three sets, while maintaining a similar distribution for key clinical features in each set (online supplemental figure S4). The first and second sets served as the training (n=72) and development (n=36) sets, respectively. The third set served as the test set (n=35) on which the performance of the selected model was examined (figure 2A). Additional details are provided in the Materials and Methods section.
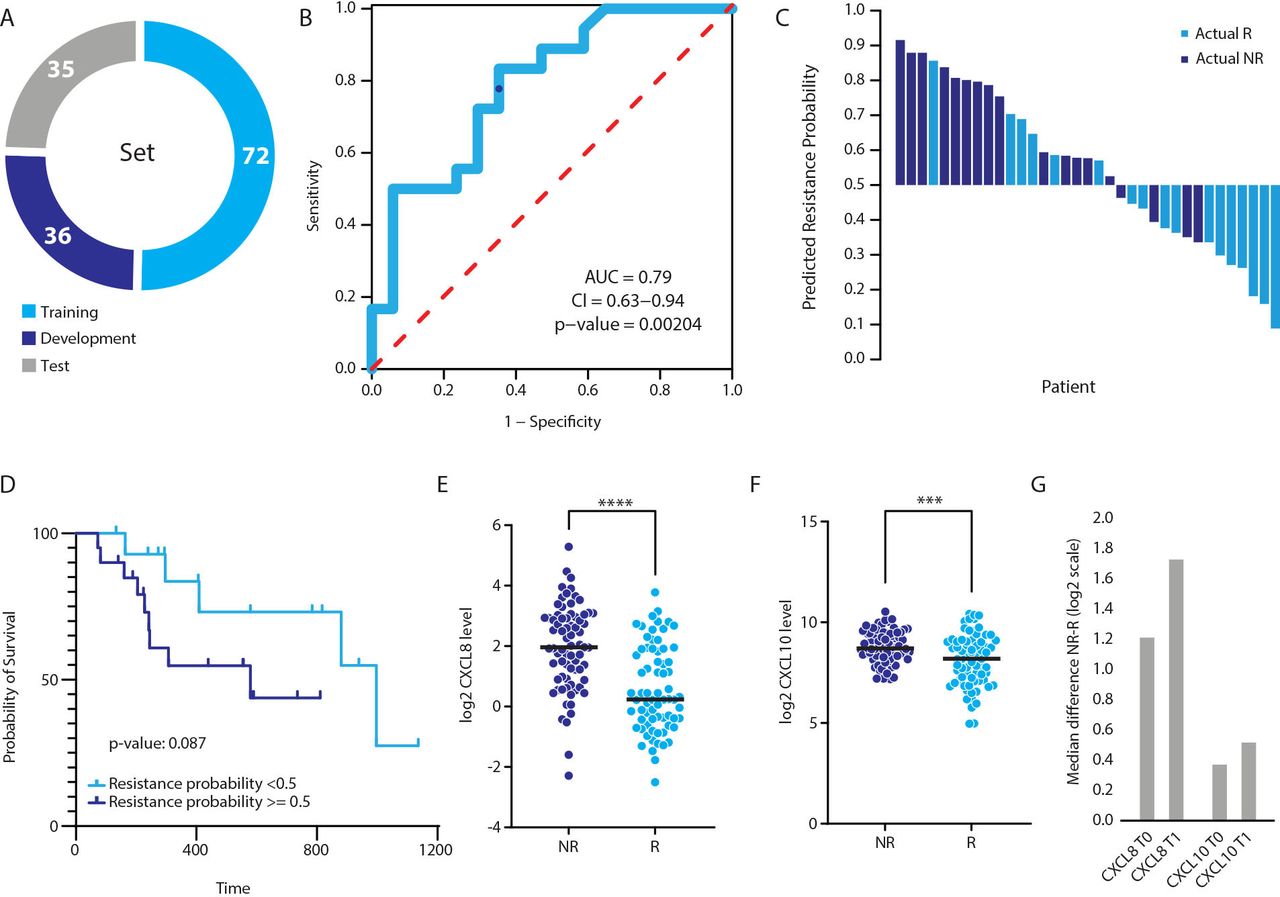
A predictive signature for response to immune-checkpoint inhibitor therapy in patients with non-small cell lung cancer. (A) The cohort was divided into training (n=72), development (n=36) and test (n=35) sets. (B) A predictive signature for response to treatment was identified using a machine-learning approach. The signature is comprised of two proteins (CXCL8 and CXCL10 at T1) and two clinical parameters (age and sex). The receiver operating characteristics plot of the test set. The area under the curve (AUC) is 0.79 (p value of 0.00204), indicating high predictive power. The blue dot indicates resistance probability cut-off of 0.5. (C) Waterfall plot displaying predictions against actual response. Predicted responders and non-responders are indicated by response probability below and equal or above 0.5, respectively. Light blue designates actual responders. Dark blue designates actual non-responders. (D) Survival analysis based on the predictive signature. Predicted responders (resistance probability <0.5) and non-responders (resistance probability ≥0.5) are depicted in light and dark blue, respectively. (E–F) The distribution of the T1 plasma levels of CXCL8 (E) and CXCL10 (F) in responders (R) and non-responders (NR). (G) The median difference between non-responders and non-responders for each protein at T0 and T1.
In order to identify features that predict response to ICI-based therapy, we applied the XGBoost machine-learning algorithm on the proteomic and clinical data. Using this algorithm, we identified a predictive signature at the T1 time point comprizing two proteins, CXCL10 (IP-10) and CXCL8 (IL-8), and two clinical features, sex and age. This signature yielded an AUC of the ROC plot of 0.79 on the test set (figure 2B; sensitivity=0.78, specificity=0.65, positive-predictive value=0.70 and negative-predictive value=0.73). Overall, 4 (of 18) non-responders were wrongly predicted as responders, defined by resistance probability threshold ≥0.5 (figure 2C). Indeed, according to this model, the group of patients with a high resistance probability displayed a trend for shorter OS compared with patients with low resistance probability (figure 2D). A deeper examination of the two predictive proteins showed that both were present at significantly higher levels in non-responders compared with responders at both T0 and T1 time points. (figure 2E–G). Notably, the difference was greater at the T1 time point, suggesting that pre-existing resistance mechanisms in non-responders are amplified during treatment.
Next, we sought to examine the potential effect of different factors on the prediction capabilities of the model. (1) Our cohort is heterogeneous and comprised of patients receiving either monotherapy or a combination of chemotherapy and immunotherapy (ie, chemo-immunotherapy). To determine whether the predictive capability of the model is affected by the treatment modality, we examined predictive performance for monotherapy patients alone (n=131), excluding the 12 patients treated with the chemo-immunotherapy combination. In this case, the AUC was reduced from 0.79 for the entire cohort to 0.7 for the monotherapy cohort. Of note, the exclusion of 12 random patients did not affect the AUC generated on all patients (1000 random iterations, average AUC=0.79; online supplemental figure S5B), indicating that the 12 chemo-immunotherapy patients do indeed affect the predictive model. This suggests that follow-up studies comprizing a sufficiently large sample size should be performed in which separate models are generated for each treatment modality. (2) To explore the effect of sex and age on the predictive performance of the model when controlling for smoking history, we ran a two-way ANOVA test with smoking as a dependent variable, and sex and age as explaining variables. The results showed that age and sex do not correlate with smoking in our data set (notably, smoking history was available for only a subset of the samples; n=58; online supplemental figure S5C,D). In addition, when running the model while excluding these two variables, the AUC was lower (0.76 in all patients; 0.65 in monotherapy patients; online supplemental figure S5A), suggesting that age and sex do indeed contribute to the prediction model, though to a small extent. (3) TMB was previously shown to predict response to immunotherapy.35 We could not examine the effect of this parameter, as it was unavailable in our data set. Smoking history and KRAS mutation are two parameters that were previously shown to correlate with response to treatment, in part due to their association with high mutational burden36; however, since these two parameters were available for only 40% of the patients (n=58), we could not use them to estimate the TMB in the entire cohort. In addition, these two variables displayed different correlations with response (KRAS mutation correlated with response, while smoking did not).
Plasma proteomic profiles of ICI-treated patients with NSCLC display three biologically and clinically distinct clusters
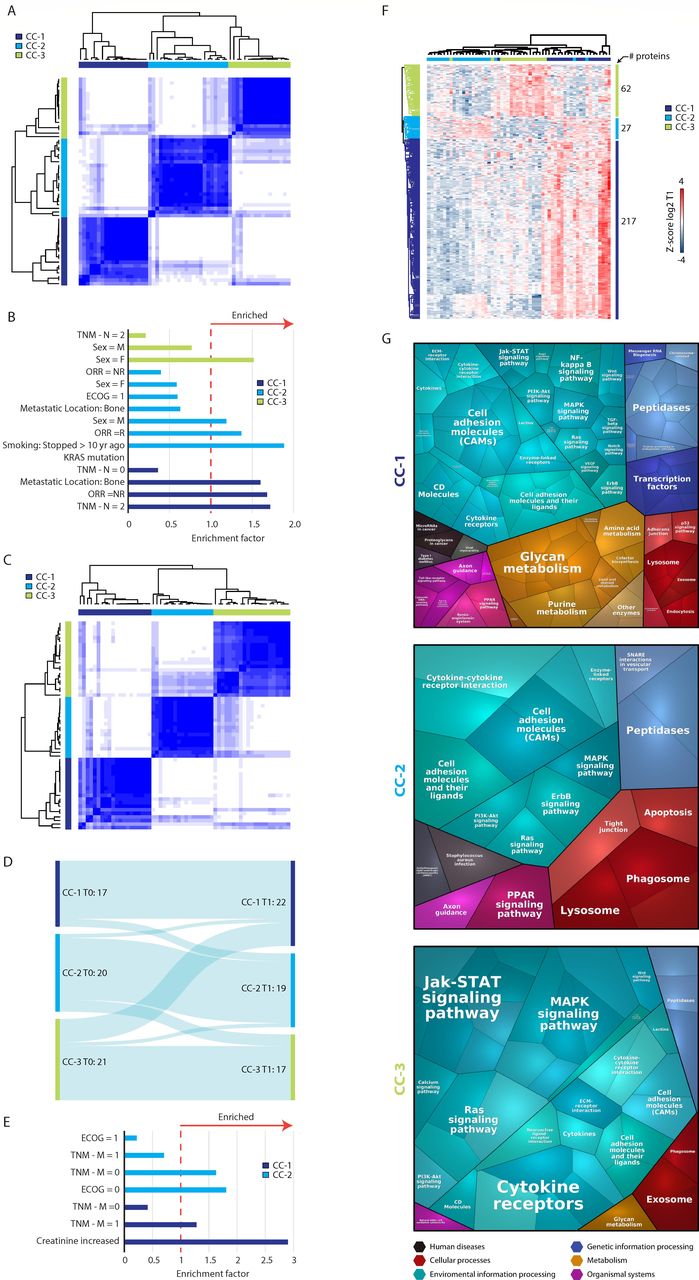
We next aimed to better characterize the proteomic profiles of ICI-treated patients with NSCLC. Our analysis was focused on Cohort 2 (see methods) for the following reasons: (a) This cohort contained comprehensive clinical data and updated treatment protocols (ie, combination chemo-immunotherapy in some patients); (b) The samples were less likely to suffer from batch effects as they were acquired at the same medical center and profiled in a single running batch. Using T1 proteomic data as input, a consensus clustering algorithm yielded three patient clusters (figure 3A; online supplemental figure S6A,B). Each cluster was characterized by different clinical features. Consensus cluster (CC)−1 was significantly enriched with non-responders, patients with advanced N (node) staging and patients with bone metastasis; this cluster was also significantly de-enriched with patients with KRAS mutations (Fisher’s exact test FDR <0.1; figure 3B; online supplemental figure S3A). CC-2, on the other hand, was significantly enriched with responders, with patients who stopped smoking over 10 years ago and with male patients. CC-3 was significantly enriched with female patients (figure 3B). Similar to T1, T0 proteome expression profiles yielded three patient clusters (figure 3C; online supplemental figure S6C–F). Many patients from T1 CC-1 were also present in T0 CC-1 (68% of the patients), while CC-2 and CC-3 maintained mostly the same patients at the T1 and T0 time points (figure 3D). Patients from T0 CC-1 displayed non-responder-like features, namely increased creatinine levels and metastasis, while T0 CC-2 was enriched with patients with non-metastatic disease and a good performance status (figure 3E; online supplemental table S3B). Together, these results suggest that the plasma proteome display three subtypes correlating with multiple clinical parameters both before and during treatment.

Three biologically and clinically distinct patient clusters. (A) Unsupervised analysis using consensus clustering algorithm identified three consensus clusters based on T1 proteomic data. CC, consensus cluster. (B) Significantly enriched clinical features in each cluster. Enrichment analysis was performed using Fisher’s exact test (FDR <0.1) based on T1 data. The clinical features displayed are either significantly enriched (enrichment factor >1) or de-enriched (enrichment factor <1). (C) Unsupervised analysis using consensus clustering algorithm identified three consensus clusters based on T0 data. CC, consensus cluster. (D) A Sankey plot showing the agreement level between the different consensus clustering in T0 and T1. (E) Significantly enriched clinical features in each cluster based on T0 data. Enrichment analysis was performed using Fisher’s exact test (FDR <0.1). (F) Hierarchical clustering of the differentially expressed proteins between the three consensus clusters based on T1 data. (G) Voronoi plots displaying the functional groups of proteins present at higher levels in each consensus cluster based on T1 data. Each polygon represents a protein. Polygon size correlates with the difference between responders and non-responders. Proteins with similar functions are grouped together. ECOG, Eastern cooperative oncology group performance; FDR, false discovery rate; ORR, objective response rate, TNM, tumors, nodes, and metastasis.
To gain further insights into the differences between the plasma proteomes of the various patient clusters, we ran an ANOVA test between the T1 patient clusters and identified 306 DEPs (DEP, permutation-based FDR <0.01; figure 3F; online supplemental table S4). Interestingly, while both CC-1 and CC-3 displayed highly expressed proteins unique to each cluster, CC-2 showed some overlap with CC-1. A bioinformatic analysis revealed that the different T1 consensus clusters display different biological functions (figure 3G). In CC-1, we observed higher levels of multiple metabolism-related proteins. Specifically, pyrimidine metabolism was significantly enriched (Fisher’s exact test, Benjamini-Hochberg FDR <0.1; online supplemental table S5), and multiple purine and glycan metabolism related proteins were found at elevated levels. Some of the proteins involved in these pathways are associated with immune suppression (eg, NT5E which hydrolyzes extracellular AMP into adenosine and inorganic phosphate, or ENTPD3 (CD39L3), an NTPDase in the adenosine metabolism pathway37). In addition to metabolism-related proteins, many proteins found at higher levels in CC-1 are involved in signaling pathways, some of which represent targets for intervention. Indeed, various drugs that inhibit these proteins are being tested in combination with ICI in different clinical trials, suggesting a role for these proteins in resistance to immune checkpoint blockade.
Proteins found at higher levels in CC-2 did not display enrichment of cancer-associated processes. One interesting protein in this responder-enriched cluster is ICOSLG (B7-H2), a stimulatory immune checkpoint mainly expressed in B cells and monocytes. In addition, three out of four members of the desmoglein family were present at higher levels in CC-2, namely DSG1, DSG2 and DSG3, as well as two integrins (ITHA1 and ITGA2), all of which are associated with cell–cell contact. Furthermore, we found that two proteins involved in T cell co-stimulation (B7RP1 and EFNB3) were high in this group of patients.
The group of proteins found at higher levels in CC-3 were significantly enriched with mitogen-activated protein kinase (MAPK) signaling-related proteins, including the proto-oncogene MYC, as well as growth factors. Some of these proteins are also involved in gap junction activity, a process which is significantly enriched in this cluster. In addition, several CC-3 related proteins were associated with JAK-STAT signaling and Ras signaling. Furthermore, CC-3 exhibited high levels of the immune checkpoint OX40 (CD134) and the immune modulator SLAMF6.
Characterization of on-treatment proteomic changes
Aiming to explore the changes that occur in the plasma proteome on treatment, we first ran a paired t-test to compare between T0 and T1 protein levels in either responder or non-responder groups (paired Student’s t-test, Benjamini-Hochberg FDR <0.05; online supplemental table S6). The levels of CXCL9 and PD-1 were found to be elevated on treatment in both responder and non-responder groups (figure 4A,B). However, the increase in CXCL9 levels was greater in non-responders, whereas PD-1 levels increased more in responders (figure 4C). In addition, mild but significant increases in the levels of PLAUR and CCL17 were detected in non-responder and responder groups, respectively, on treatment (figure 4A–C).

Characterization of on-treatment proteomic changes. (A–B) The levels of three proteins were significantly increased on treatment in responders (A) and non-responders (B). (C) The difference between T1 and T0 plasma levels of each protein in responders and non-responders. (D–E) Differentially expressed proteins with significantly higher levels in non-responders at T1 in all patients, n=143 (D) and in patients receiving monotherapy, n=131 (E). Protein interaction map of the 10 differentially expressed proteins at T1 (n=143). The map was generated using STRING database. DC, dendritic cell; IL, interleukin; NR, non-responders; PD-1, programmed cell death protein-1; R, responders.
Next, we compared the proteomic profiles of responders and non-responders at each time point. Unpaired t-tests identified CXCL8 as a significant DEP at both T0 and T1 time points (Student’s t-test, permutation-based FDR <0.1; online supplemental table S7). Nine additional DEPs, namely, IL-6, PILRA, TNFRSF21, PLAUR, CDH3, GOLM1, GRO (CXCL1/CXCL2/CXCL3), SDC1 and CXCL10, were identified as DEPs at the T1 timepoint, all of which were higher in non-responders (figure 4D; online supplemental figure S7A). Indeed, a high expression level of any one of these proteins was found to be associated with poor survival, except for SDC1 (online supplemental figure S7B). Six of the 10 proteins were DEPs in monotherapy patients as well (Student’s t-test, permutation-based FDR <0.1; figure 4E).
To better characterize the DEPs and their potential cellular origin, we searched the Human Protein Atlas database24 for expression profiles in healthy tissue (online supplemental figure S7C), cancer samples (online supplemental figure S7D) and blood cells (online supplemental figure S7E). Four proteins (SDC1, CDH3, TNFRSF21 and GOLM1) are expressed in many normal tissues, as well as many tumor types, including lung cancer. CDH3, specifically, is considered as a tumor associated antigen, while both GOLM1 and CDH3 display low immune cell specificity, indicating that these proteins may originate either from the tumor or host non-immune cells. In addition, GOLM1 was identified as a biomarker for adenocarcinoma lung cancer in a recent study of the CPTAC consortium.38 PLAUR is expressed in lung cancer cells (at low levels) and in the bone marrow. It could be secreted by myeloid cells, specifically by neutrophils, suggesting it is more likely of host-cell origin. PILRA, IL-6 and CXCL8 are likely to be host-related proteins, as suggested by their high expression level in healthy tissues including lung, bone marrow and spleen but not in lung tumors. Six proteins (CXCL8, GRO, PLAUR, PILRA, GOLM1 and CDH3) are expressed by neutrophils, while PILRA, PLAUR and GOLM1 and CXCL10 are also expressed in monocytes. Furthermore, 7 of these 10 DEPs are functionally associated (figure 4F); five proteins are involved in inflammation, while PLAUR and TNFRSF21 are associated with resistance to cell death. Overall, our findings demonstrate an association between poor response and on-treatment levels of several proteins that likely originate from tumor and host cells.
Neutrophil-related proteins are enriched in non-responders
To further explore the trends in responder and non-responder proteomic patterns at each time point, we performed a more permissive Student’s t-test when comparing the two groups (Student’s t-test, p value<0.05; online supplemental table S7) followed by an enrichment test with multiple hypothesis correction (Fisher’s exact test, Benjamini-Hochberg FDR <0.1; online supplemental table S8). Overall, 49 and 95 proteins were differentially expressed between responders and non-responders at T0 and T1, respectively. The enrichment test identified numerous significantly enriched pathways in non-responders at each time point. A high neutrophil signal was observed in non-responders at both T0 and T1 time points (figure 5A,B), as well as in the monotherapy patient data set (figure 5C). Specifically, the levels of 12 neutrophil-related proteins were higher in non-responders at both T0 and T1 time points (online supplemental figure S8A,B). Four of these proteins, CXCL8, PLAUR, GRO (CXCL1/CXCL2/CXCL3) and PILRA, were also identified as significant DEPs when comparing between responders and non-responders (figure 4D), further strengthening the link between immune cell function and response to ICI therapy. Only a single protein, leptin, was present at a higher level in responders, while the rest were higher in non-responders (online supplemental figure S8A). Interestingly, when comparing between T0 and T1 time points in non-responders, a greater number of neutrophil-related proteins were present at higher levels at the T1 time point (online supplemental figure S8B), suggesting an amplification of the neutrophil signal following treatment. However, the absolute neutrophil count remained unchanged on treatment, both in the entire cohort (online supplemental figure S8C) and in each response group (online supplemental figure S8D,E). In addition, there was no significant difference in the number of neutrophils when comparing between responders and non-responders at T0 (online supplemental figure S8F) or T1 (online supplemental figure S8G) time points. Taken together, our findings suggest that poor response to ICI therapy is associated with on-treatment changes in neutrophil function or enrichment in neutrophil subsets, while such effects do not affect the total number of neutrophils.

Non-responder proteomes exhibit an increased neutrophil signal. (A–B) Significantly enriched biological pathways in non-responders at T0 (all patients) (A), T1 (all patients) (B) and T1 (monotherapy patients) (C). NR, non-responder; NF-kappaB, nuclear factor kappa-light-chain-enhancer of activated B cells.
Discussion
Current biomarkers for predicting response to ICI therapy are mostly related to the tumor and immune cells within the tumor microenvironment. Such biomarkers include PD-L1 status of both tumor cells and tumor-associated immune cells, TMB, microsatellite instability and tumor immune cell infiltration.35 As such, these biomarkers require tumor biopsies, posing significant challenges. First, biopsies are not always available especially in different lesions of a metastatic disease. Second, due to intratumoral heterogeneity and the dynamic nature of the tumor microenvironment, biopsies provide an incomplete representation of the tumor. Third, they cannot reflect changes that might occur during treatment.8 To overcome these limitations, efforts are focused on the development of liquid biopsies for analyzing cell-free DNA, protein levels and immune cell composition in peripheral blood as potential biomarkers.7 39 In this study, we aimed to identify blood-based proteomic biomarkers for response to ICI therapy in patients with NSCLC, investigating both pre-treatment and on-treatment time points. Using advanced technology, we managed to screen 760–1000 proteins in each sample. To the best of our knowledge, this is the largest and most comprehensive plasma proteomic data set for ICI-treated patients with NSCLC available to date, at baseline and on treatment, as all other plasma biomarker studies in this field focused on a limited number of proteins. This large screening has enabled us to employ an unbiased approach, whereby a machine-learning algorithm was trained with proteomic data from high-throughput proteomic screens together with clinical data. Using this method, we identified a signature comprizing two pro-inflammatory chemokines, CXCL8 and CXCL10 (measured at the on-treatment time point), along with sex and age, that predicts clinical outcome with an AUC of 0.79.
CXCL8 is secreted predominantly by neutrophils, and it attracts neutrophils, basophils and T cells.40 CXCL8 has been proposed as a resistance biomarker in multiple studies either pre-treatment or on-treatment.41 42 Notably, Schalper et al found that elevated CXCL8 in the blood is associated with an indication-agnostic mechanism of resistance to ICI therapy.42 CXCL10 is involved in multiple processes such as chemotaxis, differentiation and activation of peripheral immune cells, regulation of cell growth, apoptosis and angiogenesis, and is expressed by T helper cells, cytotoxic T cells (CTLs), dendritic cells, natural killer cells, macrophages and some epithelial and cancer cells.43 CXCL10 was identified as a biomarker for response as well.44 In addition, previous studies have demonstrated an association between these two chemokines and resistance to therapy in patients with NSCLC. Oyanagi et al reported significantly lower baseline levels of CXCL8, CXCL10 and tumor necrosis factor-α and higher levels of follistatin in patients with durable response.41 In another study, the ratio between CXCL10 and CXCL8 was predictive for response in patients with NSCLC receiving ICI combined with chemotherapy.45 Our study demonstrates that CXCL8 and CXCL10 are present at higher levels in non-responders both at baseline and on treatment, and that on-treatment levels of these proteins, together with clinical parameters—sex and age—have predictive value.
Our proteomic screening provides insights into the clinical features and biological processes associated with resistance and response to ICI therapy. Based on plasma proteomes, patients were grouped into three distinct clusters, or subtypes, characterized by different clinical features. These clusters showed correlations between multiple parameters including sex, tumor staging and response. Importantly, the three clusters were identified at both time points (baseline and on-treatment), where the non-responder cluster (CC- 1) displayed 68% identity in patients between the two time points. This finding suggests that the majority of patients in the non-responder cluster exhibit innate resistance to ICI therapy. An analysis of the different proteins within each cluster revealed that non-responders exhibit high levels of proteins associated with pyrimidine metabolism as well as MAPK, NF-kB, WNT and JAK-STAT signaling pathways. Notably, some proteins in these pathways are known to promote resistance to immune checkpoint blockade, and their therapeutic blockade in combination with ICIs is being evaluated in several clinical trials (NCT04148937, NCT02860546, NCT02848443, NCT03475953, NCT04591431, NCT02646748, NCT03334617, NCT02983578, NCT03819465). In this regard, studies combining ICI therapy with targeted drugs such as tyrosine kinase inhibitors (TKIs) in patients with NSCLC did not demonstrate clinical benefit.10 It will be of interest to evaluate drug combinations designed to block biological pathways associated with resistance to ICI, such as those identified in this study.
A growing body of evidence demonstrates that cancer therapies induce changes in tumor and host cell activity, ultimately affecting tumor fate.20 21 In our study, a comparison of the proteomes of responders and non-responders at pre-treatment and on-treatment time points sheds light on therapy-induced changes and their association with treatment response or resistance. We show that on treatment, PD-1 levels increase to a greater extent in responders, in agreement with a previous report indicating a correlation between post-therapy increase of soluble PD-1 and improved OS or progression-free survival (PFS) in patients with NSCLC treated with anti-PD-1-based therapy.46 We also show that CXCL9 levels increase more in non-responders during treatment, suggesting a role in resistance to ICI therapy. However, it should be noted that CXCL9 has been shown to have a dual role in cancer; some evidence indicates that it suppresses tumor growth, metastasis and tumor-derived angiogenesis, while other studies demonstrate its role in tumor progression.47 Interestingly, 10 proteins, likely originating from tumor and/or host cells, were found to be present at significantly higher levels in non-responders during treatment in comparison to only 1 protein at the pre-treatment time point, further supporting the notion that therapy-induced changes contribute to resistance. Changes in the levels of plasma proteins following ICI therapy have been reported previously. For example, we and others demonstrated that the plasma level of host-derived IL-6 is elevated following anti-PD1/PD-L1 therapy in both mice and patients. Furthermore, IL-6 blockade in combination with ICI agents improves outcomes in mouse tumor models.22 48 Collectively, our approaches have identified plasma proteins associated with resistance to ICI therapy, representing potential biomarkers for outcome. In addition, proteins found at high levels in non-responders represent candidate targets for intervention that can be therapeutically inhibited in combination with ICI therapy to potentially improve outcomes.
Lastly, we demonstrate that non-responders display an enrichment in neutrophil-related proteins both at baseline and on-treatment, with a greater number of neutrophil-related proteins at the on-treatment time point. Previous studies have demonstrated an association between neutrophils and poor prognosis following ICI therapy. Specifically, increased neutrophil to lymphocyte ratio in ICI-treated patients with lung cancer was associated with poor OS and PFS, as reported in a meta-analysis study.49 In addition, neutrophil expansion in patients with NSCLC has been implicated in pro-tumorigenic and immunosuppressive activity, thereby explaining resistance to ICI therapy.50 Interestingly, although we demonstrate an elevation in the levels of neutrophil-related proteins in non-responders, the absolute neutrophil count was similar in responders and non-responders. Thus, it is plausible that specific neutrophil subsets contribute to ICI therapy resistance. Identification and characterization of such subsets could reveal novel predictive biomarkers for ICI therapy outcome. In addition, using proteomics we identified a neutrophil signal that could not be retrieved from blood count, further demonstrating the strength of proteomic-based analyses.
Our study has several limitations. (i) The cohort is small for biomarker discovery and requires validation in another independent cohort, especially when using artificial intelligence (AI) technology. (ii) Clinical benefit was defined as response rather than OS or PFS. Since some patients benefit without confirmed response, they could have been mislabeled. (iii) The cohort includes patients treated with immunotherapy alone and chemo-immunotherapy combinations. In some of our analyses we differentiated between the two different groups, in which the chemo-immunotherapy combination subcohort consisted only 12 patients. Based on preclinical studies, we assume that the different treatment modalities differentially affect proteomic signals.21 While our analysis revealed a stronger correlation between the protein signature and response when the 12 chemo-immunotherapy patients were included in the analysis, a larger patient cohort is necessary to further analyze each treatment modality separately. (iv) The cohort includes patients with different histological types. (v) While Cohort 1 was obtained from a biobank, Cohort 2 was assembled from a single medical center. Thus, our study does not account for possible technical heterogeneity during sample handling. Taken together, while our study has some limitations, we were able to identify specific proteins and clinical features in the mixed patient cohort.
In summary, our study describes an unbiased approach for biomarker discovery in immuno-oncology. In contrast to most studies focusing on tumor molecular markers and immune cell infiltration, here we identify blood-based proteomic biomarkers that are predictive of ICI therapy response. In addition to stratifying between responders and non-responders, the biomarkers provide insights into the underlying mechanisms of resistance and provide a rationale for combination therapies with potentially greater clinical benefit.
Data availability statement
All data relevant to the study are included in the article or uploaded as supplementary information.
Ethics statements
Patient consent for publication
Ethics approval
This study involves human participants and was approved by The Tel Hasomer ethics committee, approval number: 0226-13-SMC. Participants gave informed consent to participate in the study before taking part.
References
Supplementary materials
Supplementary Data
This web only file has been produced by the BMJ Publishing Group from an electronic file supplied by the author(s) and has not been edited for content.
Footnotes
Contributors Conception and design: MH, CL, IS, YE, OS, YS. Resource for data generation: SRS, GY, IK, JB. Acquisition of data: MH, CL. Analysis and interpretation of data: MH, CL, EJ, IS, YE, AZ, OS, DC, AD, JB, YS. Writing, review and/or revision of the manuscript: MH, ND, YS. Study supervision: MH, OS, YS. Guarantor: YS.
Funding This study was supported by OncoHost LTD.
Competing interests MH, CL, EJ, IS, YE, SRS, GY, and OS are employees of OncoHost. ND, AZ, DC, AD, and YS are advisors to OncoHost. IK declares no potential conflicts of interest. OncoHost holds patents on predicting therapeutic outcome based on plasma proteins. DPC reports personal fees from the following: AbbVie, Adaptimmune, Agenus, Amgen, Ariad, AstraZeneca, Biocept, Boehringer Ingelheim, Celgene, Clovis, Daiichi Sankyo (DSI), EMD Serono, Flame Biosciences, Foundation Medicine, G1Therapeutics/Intellisphere, GenePlus, Genentech/Roche, GlaxoSmithKline, Gloria Biosciences, Gritstone, Guardant Health, Humana, Incyte, Inivata, Inovio, Janssen, Kyowa Kirin, Loxo Oncology, Merck, MSD, Nexus Oncology, Novartis, Oncocyte, Palobiofarma, Pfizer, prIME Oncology, Stemcentrx, Takeda Oncology and Teva. AD reports personal fees from the following: Roche, Janssen, Self Care Catalysts, Albert Einstein Medical College, Alcimed, Oranomed, IBA, Deallus, Genentech, CVS. JB reports grants and personal fees from Merck Sharp and Dohme (MSD), AbbVie, AstraZeneca, Pfizer, Takeda, and Roche, grants from Bristol Myers Squibb (BMS), personal fees from Boehringer Ingelheim (BI), VBL, Novartis, Bayer, and Lilly.
Provenance and peer review Not commissioned; externally peer reviewed.
Supplemental material This content has been supplied by the author(s). It has not been vetted by BMJ Publishing Group Limited (BMJ) and may not have been peer-reviewed. Any opinions or recommendations discussed are solely those of the author(s) and are not endorsed by BMJ. BMJ disclaims all liability and responsibility arising from any reliance placed on the content. Where the content includes any translated material, BMJ does not warrant the accuracy and reliability of the translations (including but not limited to local regulations, clinical guidelines, terminology, drug names and drug dosages), and is not responsible for any error and/or omissions arising from translation and adaptation or otherwise.