Article Text

Abstract
Background For effective tumor elimination, cytotoxic CD8+ T cells must recognize tumor-derived antigens presented on class I major histocompatibility complex (MHC-I). Despite a general association between the expression of immunogenic antigens, typically neoantigens, and response to immunotherapy, the majority of patients lack strong endogenous responses to most putative neoantigens due to mechanisms that are not well understood. Cytotoxic CD8+ T-cell responses are induced by dendritic cells (DCs) cross-presenting tumor-derived peptides on MHC-I. We hypothesized that cross presentation may form an unappreciated source of bias in the induction of cytotoxic T-cell responses.
Methods We used stable isotope labeling of amino acids combined with immunopeptidomics to distinguish cross-presented from endogenous MHC-I peptides on DCs. To test impacts on T-cell activation, we targeted the model antigen SIINFEKL to specific subcellular compartments in tumor cells, which were used as sources for cross presentation to T cells. In vitro observations were validated using DNA and RNA sequencing data from two cohorts of patients with melanoma undergoing checkpoint blockade therapy. We used a novel quantitative mass spectrometry approach to measure the levels of model antigen on cross-presenting DCs following various means of tumor cell death.
Results DCs exhibited a strong bias for cross-presenting peptides derived from cytoplasmic proteins and against those from plasma membrane proteins, which was confirmed using the model antigen SIINFEKL. In patients with melanoma, the proportion of membrane-derived neoantigens was correlated with reduced survival and failure to respond to therapy. Quantification of cross-presented SIINFEKL revealed that the mode of cell death could overcome DCs’ bias against plasma membrane proteins.
Conclusions Cross presentation of cellular antigens by DCs may impose constraints on the range of peptides available to activate CD8+ T cells that have previously gone unappreciated. The share of neoantigens arising from membrane-derived sources may render some tumors less immunogenic due to inefficient cross presentation. These observations carry important implications for the encounter and intracellular processing of cellular antigens by DCs and merit further clinical studies for their therapeutic potential in stratifying patient populations and design of vaccine-based therapies.
- dendritic cells
- antigen presentation
- antigens
- CD8-positive T-lymphocytes
- radioimmunotherapy
Data availability statement
All data relevant to the study are included in the article or uploaded as supplementary information.
This is an open access article distributed in accordance with the Creative Commons Attribution Non Commercial (CC BY-NC 4.0) license, which permits others to distribute, remix, adapt, build upon this work non-commercially, and license their derivative works on different terms, provided the original work is properly cited, appropriate credit is given, any changes made indicated, and the use is non-commercial. See http://creativecommons.org/licenses/by-nc/4.0/.
Statistics from Altmetric.com
WHAT IS ALREADY KNOWN ON THIS TOPIC
Tumor-specific neoantigens are typically evaluated by their ability to bind to class I major histocompatibility complex on tumor cells, yet the rate at which dendritic cells (DCs) can effectively cross-present those peptides and how this might impact antitumor immunity is unknown.
WHAT THIS STUDY ADDS
We elucidate here that cross presentation by DCs is biased towards peptides derived from cytoplasmatic proteins, while peptides originating from proteins located in the plasma membrane are under-represented. The bias was most amplified when effective cross presentation was rate limiting, yet we observed that this bias might be an obstacle for immunotherapy success in a fraction of patients.
HOW THIS STUDY MIGHT AFFECT RESEARCH, PRACTICE AND/OR POLICY
While validation in patients would be needed, the observed bias might inform the design and prioritization of neoantigen vaccines for the treatment of patients with cancer.
Background
Cytotoxic CD8+ T cells are instrumental for efficient tumor cell elimination, and the presence of functional and tumor-reactive cytotoxic T cells within the tumor has been correlated with patient responses to checkpoint blockade therapy.1 2 For efficient tumor cell lysis, CD8+ T cells must recognize their cognate antigen in two contexts: (1) during T-cell priming in the tumor-draining lymph node, presented on specialized antigen-presenting cells, called cross-presenting dendritic cells (DCs), and (2) directly on tumor cells.3 4 Antitumor CD8+ T-cell responses can be mounted against a series of tumor-associated or tumor-specific antigens; however, the most clinically tractable are so-called neoantigens, derived from protein-coding mutations.5 6 These neoantigens are often highly immunogenic as neoantigen-reactive T cells are not eliminated during negative selection in the thymus.5 6 Thus, it is not surprising that tumors with a high mutational burden and T-cell infiltration are the most responsive to immunotherapeutic interventions.5 7–9 However, studies assessing the abundance and clonal structure of tumor-reactive CD8+ T cells suggest that only a limited number of T-cell clones are induced compared with the number of putative neoantigen targets expressed by tumor cells.10 11 Several parameters outside of neoantigen presence might prevent the expansion and maintenance of tumor-reactive CD8+ T cells, including tumor-intrinsic mechanisms preventing T-cell priming.12–14 Nonetheless, there is concerted and continuous effort on improving the accuracy of peptide:major histocompatibility complex (MHC) binding prediction algorithms to allow for improved prediction of high-affinity neoantigens. However, the true immunogenicity of any antigen is impacted by factors beyond its affinity to MHC. An improved understanding of endogenous neoantigen responses is critical especially for mRNA-based vaccination strategies to raise de novo antitumor T-cell responses.5 15
While this effort is focused on the existence of high-affinity neoantigens in tumor cells, thus far, less attention has been paid to priming tumor-reactive CD8+ T cells, mediated by cross-presenting DC.4 16 For efficient cross presentation, tumor cell fragments must be engulfed and processed, and peptides loaded onto class I major histocompatibility complex (MHC-I).17 These processes could together impose limits on the pool of peptides cross-presented on DC, thereby limiting the pool of tumor-reactive T cells. Conventional type-I DC (cDC1) are most proficient at cross presentation of cell-associated antigens, while conventional type-II DC (cDC2) and monocyte-derived DC (moDC) are less proficient in presenting cell-associated antigens but are equally proficient at cross-presenting small soluble antigen sources.18 During cross presentation, tumor cell-derived material is internalized by DC via phagocytosis or micropinocytosis and retained in neutral-pH phagosomal compartments that forestall complete proteolysis to preserve antigens.19 From there, exogenous antigens are loaded onto MHC-Is and subsequently presented on the cell surface through incompletely understood means, with two primary pathways proposed. The cytoplasmic pathway permits entry of exogenous antigens into the cytosol from which point protein degradation follows the endogenous antigen presentation pathway.18–20 The vesicular pathway proposes that exogenous antigens in endocytic vesicles fuse with endosomes containing empty MHC-Is targeted for recycling.21 Cross presentation through the vesicular pathway might result in different peptides presented on MHC-Is due to differences in antigen processing. Further, it is unclear whether different DC subsets use different pathways for cross presentation, but both pathways have been reported to facilitate cross presentation of tumor cell-derived neoantigens on MHC-Is on the surface of DC.22
Thus far, investigations on the immunogenicity of a tumor cell-derived antigen have focused on the expression levels of the antigen, the peptide binding affinity for MHC-I, and peptide agretopicity, defined as the degree of difference between the self-peptide and the tumor-specific peptide.5 15 23 24 However, the efficiency of peptide processing during cross presentation on DC, required for T-cell priming, has not been broadly considered. This gap in knowledge stems in part from the lack of an unbiased survey of cross presentation of cellular antigens, with the result that fundamental constraints on cross presentation have gone undefined. Mass spectrometry of peptides bound by MHCs, termed immunopeptidomics, provides this unbiased and systematic approach and has already revealed the principles underlying presentation of endogenous peptides in patients25 and experimental models.26 27 However, typical mass spectrometry workflows cannot distinguish cross-presented peptides from endogenous peptides isolated from DC. Stable isotope labeling in cell culture (SILAC) provides a solution to disentangle peptide origin in proteomics and immunopeptidomics.28 Thus far, one study used SILAC for analyzing cross-presented peptides, but the amino acid labeling strategy used was not optimized for MHC peptides and yielded low recovery of cross-presented peptides.29
In this work, we asked whether the subcellular compartment of cell-associated debris that DCs may encounter in the tumor microenvironment could impact the efficacy of neoantigen cross presentation. It is conceivable that cross presentation of neoantigens depends in part on their availability to DC for engulfment and processing. We employed an MHC-tailored SILAC approach to discover the range of subcellular compartments efficiently cross-presented by DC. This approach revealed a significant bias against plasma membrane protein sources and favored cytoplasmic protein sources. We validated this observation using model antigens in combination with in vitro cross-priming assays to induce antigen-specific CD8+ T-cell responses. The observed bias was sufficient to skew responses to immunotherapy in two cohorts of patients with melanoma, demonstrating the impact of neoantigen subcellular location on tumor immunogenicity. Employing a novel mass spectrometry method to quantify cross-presented antigens, we showed that the mode of cell death of tumor cells directly impacts the efficiency of cross presentation. These observations may contribute to improved prioritization of neoantigens for vaccination approaches.
Methods
Cell culture
B16F10 cells were cultured at 37°C and 5% CO2 in Dulbecco's Modified Eagle Medium (DMEM) (Gibco) supplemented with 10% Fetal Bovine Serum (FBS) (Atlanta Biologicals), 1% penicillin/streptomycin (Gibco), and 1 mM 4-(2-hydroxyethyl)-1-piperazineethanesulfonic acid (HEPES) (Gibco). To generate β-2 microglobulin (B2M)−/− lines, B16F10 cells were transiently transfected with the pooled guides and selected with puromycin for 48 hours. Cells surviving puromycin treatment were expanded, and the ablation of B2M was confirmed by sequencing and flow staining for surface H-2Kb expression. B16F10 parental or B2M−/− lines stably expressing cytoplasmic or membrane-targeted ZsGreen-SIINFEKL were generated by lentiviral transduction with the respective plasmid and selected using 8 µg/mL blasticidin. The expression of ZsGreen-SIINFEKL was normalized across both cell lines by cell sorting.
Mice
Wild-type C57BL/6 (female) were obtained from Taconic Biosciences or Jackson Laboratory and Rag2−/− mice were maintained in house. TCR-transgenic OT-I, Rag2−/−, CD45.1 mice were a gift from Tyler Jacks. All mice were housed under specific pathogen-free conditions at the Koch Institute animal facility. Mice were 6–12 weeks old at the time of experimentation, the mice were randomized at initiation of the experiment; no animals were excluded from the analysis. All animal studies were conducted in a non-blinded fashion. All experimental animal procedures were approved by the Committee on Animal Care (CAC) (CAC/institutional animal care and use committee) at MIT.
Plasmids
To generate lentiviral vectors expressing ZsGreen-SIINFEKL, a pLV backbone encoding EF1α-IRES-Blast (gift from Tobias Meyer, Addgene #85133) was modified by replacing the IRES with a self-cleaving P2A sequence and inserting ZsGreen-SIINFEKL, using linearization and the In-Fusion kit (Takara Bio). A palmitoylation domain was cloned from pPalmitoyl-mTurquise2, which was a gift from Dorus Gadella (Addgene #36209), and inserted at the 5′ end of ZsGreen-SIINFEKL via InFusion following linearization with MscI (New England Biolabs). pLV-ZsGreen-SIINFEKL-P2A-Blast with and without the palmitoylation domain was sequenced for accuracy. To knock out the B2M gene encoding B2M, the px459-Cas9-puro vector (Addgene #62988) was digested with the BbsI restriction enzyme (NEB) to linearize the vector. CRISPR guides targeting exon 2 of murine B2M were designed using Benchling. Forward and reverse oligos (Integrated DNA Technologies) for each guide were annealed together with a standard annealing protocol, cloned into the px459-Cas9-puro vector by T4 ligation (NEB), amplified, and sequenced for accuracy.
Cell death
106 B16F10 cells were placed in 10 mL growth media in suspension and subjected to 20 or 120 Gy radiation in a Gammacell 40 Exactor (Theratronics) before plating in 15 cm culture dishes for 72 hours. For assays using water, 106 B16F10 cells were pelleted and resuspended in 3 mL sterile water and incubated for 3 min at 37 C. Doxocycline (Selleckchem) and vincristine (Sigma Aldrich) were added to freshly plated cultures of 106 B2M−/− B16F10 at 2 and 10 µM, respectively. Twenty-four hours later, media was exchanged with drug-free media and 48 hours later dead cells were harvested. Palbociclib (Selleckchem) was added to freshly plated cultures of 106 B2M−/− B16F10 at 20 µM. Forty-eight hours later, dead cells were harvested.
Vaccination and tumor rechallenge
Dead B16F10 cells were harvested from suspensions of cell cultures 72 hours after radiation, washed in Phosphate-buffered saline (PBS), and 106 cells were injected into the flank of mice. 7 days later 106 B16F10 were inoculated on the opposite flank. For tumor inoculation, cells were harvested by trypsinization (Gibco) and washed with PBS (Gibco). After resuspension in PBS, 106 cells were injected subcutaneously into the flanks of mice. Tumor area measurements (calculated as length×width) were collected two to three times a week until the endpoint of the study.
Bone marrow-derived dendritic cell (BM-DC) isolation and culture
BM-DC were generated from femurs and tibias of female naïve C57BL/6 mice 6–8 weeks old. Bone marrow was isolated by removing the end of each bone and placing it in a 0.5 mL Eppendorf tube with a small hole punched in the bottom. Each bone and tube were then placed inside a 1.5 mL Eppendorf tube and centrifuged at 5000×g for 10 s to pellet bone marrow in the larger tube. Red blood cells were lysed in ACK buffer (Gibco), and remaining cells were washed and cultured in BM-DC media containing RPMI (Gibco) supplemented with 10% FBS, 1 mM HEPES, 50 µM β-mercaptoethanol (Gibco) non-essential amino acids (Gibco), 2 ng/mL murine GM-CSF (BioLegend), and 100 ng/mL human Flt-3L-Ig (bioXcell). Cells were seeded at 107 cells/mL in non-adherent 10 cm dishes. Cell growth was monitored and 2 mL media was added every 4 days. BM-DC were used for experiments at or after day 10. On addition of T cells to BM-DC cultures, GM-CSF and Flt-3L-Ig were omitted from Roswell Park Memorial Institute (RPMI) media.
Stable isotope labeling
Stable isotope labeling of amino acids in cell culture (SILAC)28 was performed using a custom culture medium (table 1). DMEM without amino acids (US Biological) with 3.5 mg/L glutamine (total=4.5 mg/L) was supplemented with arginine, cystine, histidine, isoleucine, lysine, methionine, serine, threonine, tryptophan, valine, and glycine light amino acids, and tyrosine (13C9), asparagine (13C4, 15N2), phenylalanine (13C9, 15N), and leucine (13C6,15N) heavy isotope-labeled amino acids (Sigma Aldrich) at concentrations based on Corning standard DMEM amino acid composition (online supplemental table 1). Media was also supplemented with 10% FBS (Atlanta Biologicals), 1% penicillin/streptomycin (Gibco), and 1 mM HEPES (Gibco) and used to culture B16F10 cells for at least 15 population doublings. Heavy isotope labeled-amino acid incorporation was assessed by performing a tryptic digestion with 50 ug of protein lysates diluted eightfold in 8M urea and processed using single-pot, solid phase-enhanced sample preparation (SP3) on-bead digestion, as previously described.30
Supplemental material
Custom stable isotope labeling in cell culture media components
Peptides were analyzed by data-dependent acquisition (DDA) Liquid chromatography–mass spectrometry (LC-MS/MS) using a Q-Exactive Plus mass spectrometer (Thermo Fisher Scientific), where approximately 30 ng of digested peptides was loaded onto a trapping column (constructed in house, 100 µm ID×10 cm, 10 µm C18 beads (YMC gel, ODS-A, AA12S11)) connected in series to an analytical column (constructed in house, 50 µm ID×10 cm, 5 µm C18 beads (YMC gel, ODS-AQ, AQ12S05)). Peptides were separated using a 70 min Liquid chromatography (LC) gradient and acquired using instrument parameters previously described.30
Mass spectra were searched using Proteome Discoverer 2.5 (Thermo Fisher Scientific, PD 2.5) against the murine SwissProt proteome using Mascot V.2.4 (Matrix Science) with variable F/Y/L/N SILAC modifications, variable oxidated methionine modification (OxM) and fixed cystine carbamidomethylation. Peptide spectrum matches were filtered according to search engine rank=1, ion score of ≥20, and isolation interference of ≤30. Rates of SILAC amino acid incorporation among tryptic peptides were analyzed using Matlab V.2019b.
Peptide synthesis
The heavy isotope-labeled SIINFEKL peptide standard was synthesized at the MIT-Koch Institute Swanson Biotechnology Center in Biopolymers and Proteomics Facility using standard Fmoc chemistry, as previously detailed.31 Standard Fmoc amino acids were procured from NovaBiochem and Fmoc-Glutamic acid (13C5, 15N) was obtained from Cambridge Isotope Laboratories.
MHC-I peptide mass spectrometry
A total of 1.4×10⁷ BM-DC were plated in a 96-well plate at 5×10⁵ per well. Heavy labeled B16F10 or B16 B2M−/− (2×10⁷) were irradiated and added to BM-DC at 7×10⁵ per well. After 18 hours, BM-DCs were washed, pelleted, and frozen at −80°C until use. For peptide: major histocompartibility complex (pMHC) isolation, cell pellets were resuspended in MHC lysis buffer (20 nM Tris–HCl, pH 8.0, 150 mM NaCl, 0.2 mM phenylmethylsulfonyl fluoride (PMSF), 1% CHAPS (3-[(3-Cholamidopropyl)dimethylammonio]-1-propanesulfonate hydrate), and 1× HALT Protease/Phosphatase Inhibitor Cocktail (Thermo Scientific)), briefly sonicated for membrane disruption, and cleared by centrifugation. pMHCs were enriched by immunoprecipitation, where for each condition 100 µg of H2-Kb-specific antibody (clone Y-3, Bio X Cell) and 100 µg H2-Db-specific antibody (clone B22-249.R1, Thermo Fisher) were bound to 20 µL FastFlow Protein A Sepharose bead slurry (GE Healthcare) and incubated with cell lysate rotating overnight at 4°C. Beads were washed, pMHCs eluted, and peptides filtered using molecular weight cut-off filters (10K, PALL Life Science) as previously described.31 Isolated peptides were lyophilized and stored at −80°C until analysis.
Peptide–MHC samples were analyzed using an Exploris 480 Hybrid Quadrupole-Orbitrap mass spectrometer (Thermo Fisher Scientific) coupled with an UltiMate 3000 RSLC Nano LC system (Dionex), Nanospray Flex ion source (Thermo Scientific), and column oven heater (Sonation). Samples were resuspended in 0.1% formic acid and directly loaded onto a 15 cm analytical capillary chromatography column with an integrated electrospray tip (~1 µm orifice), prepared and packed in-house (50 µm ID×10–12 cm and 1.9 µm C18 beads, ReproSil-Pur, Dr Maisch). pMHC elutions were injected in up to four 15% fractions for improved coverage of the immunopeptidome apart from the SIYRYYGL (SIY) analysis, where one fraction containing 30% of the pMHC elution was used.
Peptides were eluted using a gradient with 6%–25% buffer B (70% acetonitrile, 0.1% formic acid) for 75 min, 25%–45% for 5 min, 45%–100% for 2 min, hold for 1 min, and 100% to 2% for 2 min. Standard mass spectrometry parameters were as follows: spray voltage, 2.0 kV; no sheath or auxiliary gas flow; and heated capillary temperature, 275°C. The Exploris was operated in DDA mode. Full scan mass spectra (350–1200 m/z, 60 000 resolution) were detected in the orbitrap analyzer after accumulation of 3e6 ions (normalized Automatic Gain Control (AGC) target of 300%) or 25 ms. For every full scan, MS2 were collected during a 3 s cycle time. Ions were isolated (0.4 m/z isolation width) for a maximum of 250 ms or 75% AGC target and fragmented by Higher-energy C-trap dissociation (HCD) with 30% collision energy at a resolution of 60 000. Charge states <2 and >4 were excluded, and precursors were excluded from selection for 30 s if fragmented n=2 times within 20 s window.
All mass spectra were analyzed with PD 2.5 and searched using Mascot against the murine SwissProt database. SIY-expressing B16F10 cells were searched with variable OxM and B16F10 cells (no cross presentation) were searched with variable (OxM) and fixed F/Y/L/N modifications. Cross presentation experiments were searched two ways to best identify SILAC-labeled, cross presented peptides (Fixed F/Y/L/N modifications plus variable OxM) and non-SILAC-labeled, endogenous DC peptides (variable OxM). Only peptides with 100% heavy amino acid incorporation were considered cross presented peptides. For spectra assigned to a sequence in both searches, the highest scoring assignment was selected. Peptides were further filtered according to the following criteria: length=8–12 amino acids, ion score of ≥15, isolation interference of ≤30%, search engine rank=1. For the SIY cross presentation analysis, peptide abundance was measured by precursor ion area integration using the minora feature detector within PD 2.5, where peptides were searched against a custom database containing the SwissProt mouse proteome and the SIY peptide.
Quantitative mass spectrometry
105 differentiated BM-DC were incubated with 105 washed, dead B16 cells per well in a 96-well plate. After 18 hours, a total of 4.3–5.0×10⁶ BM-DC were washed, pelleted, and frozen at −80°C prior to use. Cells were lysed as previously described. Prior to enrichment, 200 fmol of heavy-isotope labeled SIINFEKL peptide was refolded with recombinant, disulfide stabilized Kb monomer (peptide:monomer ratio of 2:1)32 and added into cell lysates. Heavy isotope-labeled SIINFE[+6]KL pMHCs and endogenous pMHCs were isolated using 100 ug of the H2-Kb antibody. Thirty percent of the peptide elution was analyzed using the Exploris 480 MS with the same chromatography setup, as previously described. Peptides were eluted using a shortened gradient with 8%–25% B for 38 min, 25%–45% B for 10 min, 45%–97% B for 3 min, hold for 1 min, and 97%–3% in 1 min.
Data were collected using a targeted inclusion list (parallel reaction monitoring) of the precursor ion (+2 charge state) of heavy and light SIINFEKL peptide (online supplemental table 2) with a spray voltage of 2.5 kV. Full scan mass spectra (350–1500 m/z, 120 000 resolution) were detected in the orbitrap analyzer after accumulation of 3e6 ions (normalized AGC target of 300%) or 150 ms. If target precursor ions were detected within a±5 ppm mass tolerance, an MS2 scan was performed after accumulation of 1e6 ions (normalized AGC target of 1000%) or 300 ms (isolation window 1 m/z) and fragmented with 27% nCE at a resolution of 60 000. Spectra were analyzed using Skyline software V.21.1.1.16033 and quantified by integrating the area of six preselected characteristic product ions (online supplemental table 2). Product ions shared between both the heavy and light peptides were summed, and the ratio of light to heavy signal was used a quantitative metric of comparison across analyses (see table 2).
Supplemental material
Mass spectrometry parameters for SIINFEKL targeted analysis
Coculture assays
Tumor cells were killed and dead cells were harvested from suspension and counted, centrifuged for 10 min at 1000×g, and 3×10⁵ or 1×10⁵ cells were added to 105 differentiated BM-DC per well in a 96-well round bottom plate. After 18 hours BM-DC were centrifuged for 3 min at 500×g, rinsed with PBS, centrifuged again and resuspended in complete RPMI medium. 2C or OT-I T cells were harvested from spleens of transgenic Rag2-/- mice and isolated by magnetic separation using CD8+ isolation kit (Miltenyi) before counting and staining with proliferation dye CellTrace Violet (Invitrogen). OT-I T cells (5×10⁵) were added to each well and cultured for 72 hours before staining and analysis by flow cytometry. BM-DC without dead B16F10 or media supplemented with 1 µg/mL ionomycin (Sigma Aldrich) and 100 ng/mL phorbol 12-myristate 13-acetate (Sigma Aldrich) served as negative and positive controls for T-cell activation, respectively. For assays using B2M−/− B16F10 cell lines, total cells (both adherent and suspended) were isolated by trypsinization, centrifuged for 10 min at 1000×g, and added to BM-DC. For assays using doxocycline, vincristine, and palbociclib, B16F10 cells were washed twice with PBS, each time pelleting by centrifugation for 10 min at 1000×g prior to addition to BM-DC cultures.
Ex vivo coculture assays
Axillary, inguinal, mesenteric, and lumbar lymph nodes, and spleens were dissected out of female naïve C57BL/6 mice 6–9 weeks old. Lymph nodes were minced with dissecting scissors, incubated in RPMI containing DNase (Sigma-Aldrich) and liberase (Sigma-Aldrich) at 37°C for 30 min and then mashed through 70 µm strainers into RPMI. Spleens were mashed through 70 µm strainers into RPMI. Splenic cell suspensions were then resuspended in ACK lysis buffer at 4°C for 2 min to lyse red blood cells and then washed with RPMI. Lymph node and splenic single-cell suspensions were stained at 4°C in the dark for 15 min with anti-CD16/CD32 (clone 93, BioLegend) to prevent non-specific antibody binding. Cells were then washed with flow cytometry buffer (chilled PBS containing 2% FBS and 2 mM EDTA (Thermo Fisher Scientific)) and stained at 4°C in the dark for 30 min with anti-CD3 (clone 17A2) and anti-CD19 (clone 1D3) antibodies conjugated to the R-phycoerythrin (PE) fluorophore. B and T cells were subsequently depleted from lymph node and splenic cell suspensions by magnetic separation using anti-PE microbeads (Miltenyi). Cells were stained at 4°C in the dark for 30 min with Fixable Viability Dye eFluor 780 (eBioscience) to distinguish live and dead cells and with fluorophore-conjugated antibodies to stain cell surface proteins. Lymph node and splenic cDC1 and cDC2/moDC were then sorted into complete RPMI medium using a BD FACSAria sorter (cDC1 from lymph nodes and spleens were combined together and cDC2/moDC from lymph nodes and spleens were combined together). Sorted cDC1 and cDC2/moDC were then cultured with tumor cell debris. Tumor cell debris was generated by irradiating B16-B2M−/− cells as described in cell death methods, harvesting dead cells from suspension, centrifuging for 10 min at 1000×g, counting, and plating either 3×10⁵ or 1×10⁵ cell particles to 105 cDC1 or cDC2/moDC. After 18 hours, sorted DC were centrifuged for 3 min at 500×g, rinsed with PBS, centrifuged again, and resuspended in complete RPMI medium. OT-I T cells were harvested, stained, and added to cDC1 or cDC2/moDC as described in coculture assays. Sorted DC cultured with OT-I T cells but without dead B16-B2M−/− cells and sorted DC cultured with OT-I T cells and SIIN peptide (InvivoGen) served as negative controls and positive controls, respectively. After 72 hours, OT-I T cells were stained and analyzed by flow cytometry.
Flow cytometry and cell sorting
Antibodies against mouse CD45 (30-F11), TCRB (H57-597), H-2Kb (AF6-88.5), CD3 (17A2), CD19 (6D5 or 1D3), NK1.1 (PD136), Ly6C (HK1.4), F4/80 (BM8), CD11c (N418), CD8a (53–6.7), and CD11b (M1/70) were from BioLegend. Antibodies against mouse MHCII (M5/114.15.12) were from BD Biosciences and antibodies against CD103 (M290) were from BD Horizon. Prior to staining, cells were washed with FACS staining buffer (chilled PBS containing 2% FBS). For cell sorting, 2 mM EDTA (Thermo Fisher Scientific) was added to FACS staining buffer. Cells were stained for 15 min on ice with eBioscience Fixable Viability Dye eFluor 780 to distinguish live and dead cells and with anti-CD16/CD32 (clone 93, BioLegend) to prevent non-specific antibody binding. Cells were then washed once and cell surface proteins were stained for 30 min on ice with fluorophore-conjugated antibodies. Annexin-V and propidium iodide (PI) staining was performed using the APC Annexin-V Apoptosis Kit (BioLegend). Flow cytometry sample acquisition was performed on a BD FACS Symphony A3 cytometer, and the collected data were analyzed using FlowJo V.10.5.3 software (TreeStar). For tumor cell sorting, cells were harvested from cultures and sorted into DMEM growth medium using a BD FACSAria III sorter.
Cell compartment analysis
A custom R script used text search to identify the primary subcellular location assignment for each manually reviewed Swiss-Prot entry in the human and mouse proteomes downloaded from UniProt. Assignment to plasma membrane was further filtered by excluding any protein that did not contain a transmembrane domain. The resulting annotated mouse proteome was intersected with peptide assignments from filtered mass spectrometry data, excluding from analysis any peptides assigned to unannotated proteins. Protein sampling rate was calculated by summing the appearances of each unique protein assignment in each peptide pool.
Analysis of domains in membrane proteins covered by endogenous or cross-presented peptides was performed by manual queries in UniProt. Residual analysis for proportions of each cell compartment was performed following linear regression in Prism software (GraphPad). The annotated human proteome was intersected with mutated genes from each patient after filtering to include only mutations classified as single-nucleotide variants (SNVs) in coding regions. Mutation analysis for the OpACIN-Neo cohort was performed with the Maftools package in R.34
Gene expression analysis
For this analysis, we used sequencing data from the OpACIN-Neo cohort (NCT02977052). A multicenter randomized phase two study testing the efficacy and toxicity of three different dosing schedules of neo-adjuvant immune checkpoint blockade (ipilimumab plus nivolumab) in patients with stage III melanoma.35 36 Transcriptome analysis for T-cell signature in the OpACIN-Neo cohort was performed using DESeq2 package in R from bulk RNA sequencing.37 Briefly, reads were mapped to the human transcriptome using the Salmon package38 and quantified using the tximeta package39 before quality control assessment and log fold change shrinkage using DESeq2. One patient was excluded due to poor sequencing quality. Log-normalized expression of the 160 genes contained in the T-cell infiltration gene set was used to report mean Z-scores for each patient.
Microscopy
B16 cells were plated onto 25 mm round glass #2 coverslips (Electron Microscopy Sciences) and cultured overnight before inverting the coverslip onto a glass slide over two strips of double-sided tape. Media was added between the coverslip and the slide, and the coverslip was sealed with vacuum grease. Live cells were imaged on a Nikon Ti Eclipse using a 10× objective (Nikon) and illuminated with a Spectra epifluorescence lamp.
Statistical analysis
All statistical analyses were performed in Prism (GraphPad) or R, and sample sizes were calculated using published datasets. All data are shown as mean±SEM or SD, as indicated in the figure legend. Comparisons were performed using Mann-Whitney U test (two groups) or analysis of vat (three or more groups). Residual deviation (RD) was calculated as square root of (Yendogenous-Ycross-presented)2 with Y being derived from y=mx+ t. Linear RD was assessed using Prism.
Results
Mass spectrometry detects tumor antigens cross-presented following tumor cell irradiation
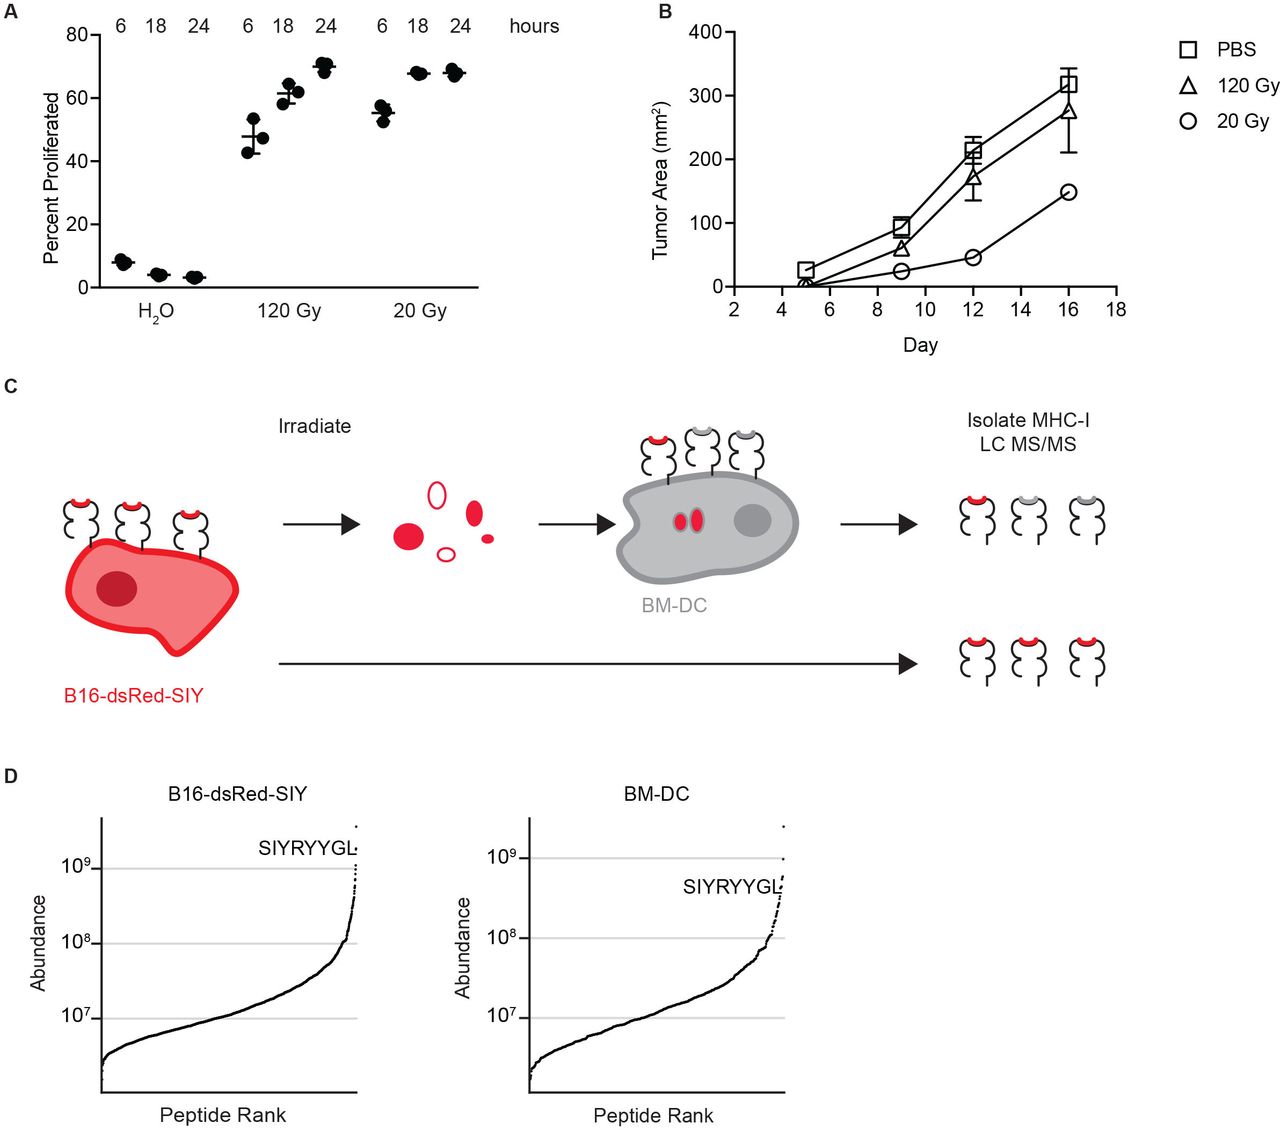
We established an in vitro system capable of recapitulating features of cross presentation that drive protective antitumor immunity in vivo. To accomplish this, we irradiated B16F10 melanoma cells engineered to express the model antigen SIYRYYGL (SIY) fused to dsRed (B16-dsRed-SIY) at a low dose of irradiation (20 Gy) and a non-immunogenic high dose (120 Gy). The resulting dead cells were cultured with 2×10⁵ immature BM-DCs for 6, 18, or 24 hours without the addition of maturation stimuli. We established this assay using BM-DC as this approach provided the requisite number of cells for immunopeptidomic studies; however, we would like to note that BM-DC might not fully recapitulate all nuances of cross presentation observed in vivo. Following engulfment of tumor cell debris, the SIY peptide is presented on H-2Kb via cross presentation.40 Productive presentation of SIY was assayed by measuring the proliferation of naïve, SIY-specific, TCR-transgenic T cells (2°C T cells) 72 hours following stimulation with washed BM-DC. We will refer to this assay as in vitro cross-presentation assay. These coculture assays demonstrated similar cross-priming efficacy following both radiation doses (figure 1A) but not following water-induced cell lysis. To confirm prior reports on immunogenic cell death, we immunized mice with parental B16F10 exposed to radiation at a low or high doses. Consistent with previous reports, tumor cells killed with low-dose but not high-dose radiation induced partial protection against outgrowth of a subsequent challenge with B16F10 tumor cells inoculated 14 days later on the contralateral flank (figure 1B).41

Mass spectrometry detects tumor antigens cross-presented following tumor cell irradiation. (A) Proliferation of 2C T cells following coculture with BM-DC cross-presenting SIYRYYGL expressed on B16-dsRed-SIY tumor cell debris. Indicated methods were used to induce tumor cell death. Hours indicate the duration of BM-DC culture with cell debris prior to washing coculture with T cells. Shown are means with SEM of technical replicates. (B) Subcutaneous tumor outgrowth in mice vaccinated with irradiated B16F10 cells or PBS 14 days prior to recall. Shown are mean with SD, n=3 mice per condition. (C) Schematic of mass spectrometry assay to compare endogenous and cross presentation of the model antigen SIYRYYGL. (D) Comparison of high-confidence peptides ranked by relative abundance isolated from B16-dsRed-SIY and BM-DC after incubation with irradiated B16-dsRed-SIY, with ranking of SIY shown. BM-DC, bone marrow-derived dendritic cell; MHC-I, class I major histocompatibility complex.
We next measured the abundance of cross-presented SIY peptide present on BM-DC in the in vitro cross-presentation assay. Following incubation with 20 Gy irradiated B16-SIY, we measured SIY abundance on BM-DC and on untreated B16-dsRed-SIY cells by H-2Kb immunoprecipitation and size exclusion filtration prior to targeted mass spectrometry analysis (figure 1C and online supplemental table 1). Interestingly, SIY was the seventh most abundant peptide on BM-DC following cross presentation, suggesting that effective cross presentation is a hallmark of the immunogenicity of a given peptide (figure 1D). On B16-dsRed-SIY cells, SIY was determined to be the second most abundant peptide. Of note, in both conditions, over 1000 unique peptides were identified, suggesting that both cell types present an equally diverse immunopeptidome (online supplemental figure 1). Together these results demonstrate that the in vitro cross-presentation assay recapitulates cross presentation required for protective immunity generated by cross priming in vivo, and that mass spectrometry can detect high-affinity antigens cross-presented on BM-DC.
Supplemental material
Supplemental material
Cytoplasmic proteins are over-represented among cross-presented peptides, while membrane-resident proteins are under-represented
Next, we leveraged our in vitro cross-presentation assay paired with mass spectrometry to determine whether sources for cross-presented peptides are biased towards specific cellular compartments. To determine the source of cross-presented peptides in an unbiased manner, we used SILAC coupled with immunopeptidomics.
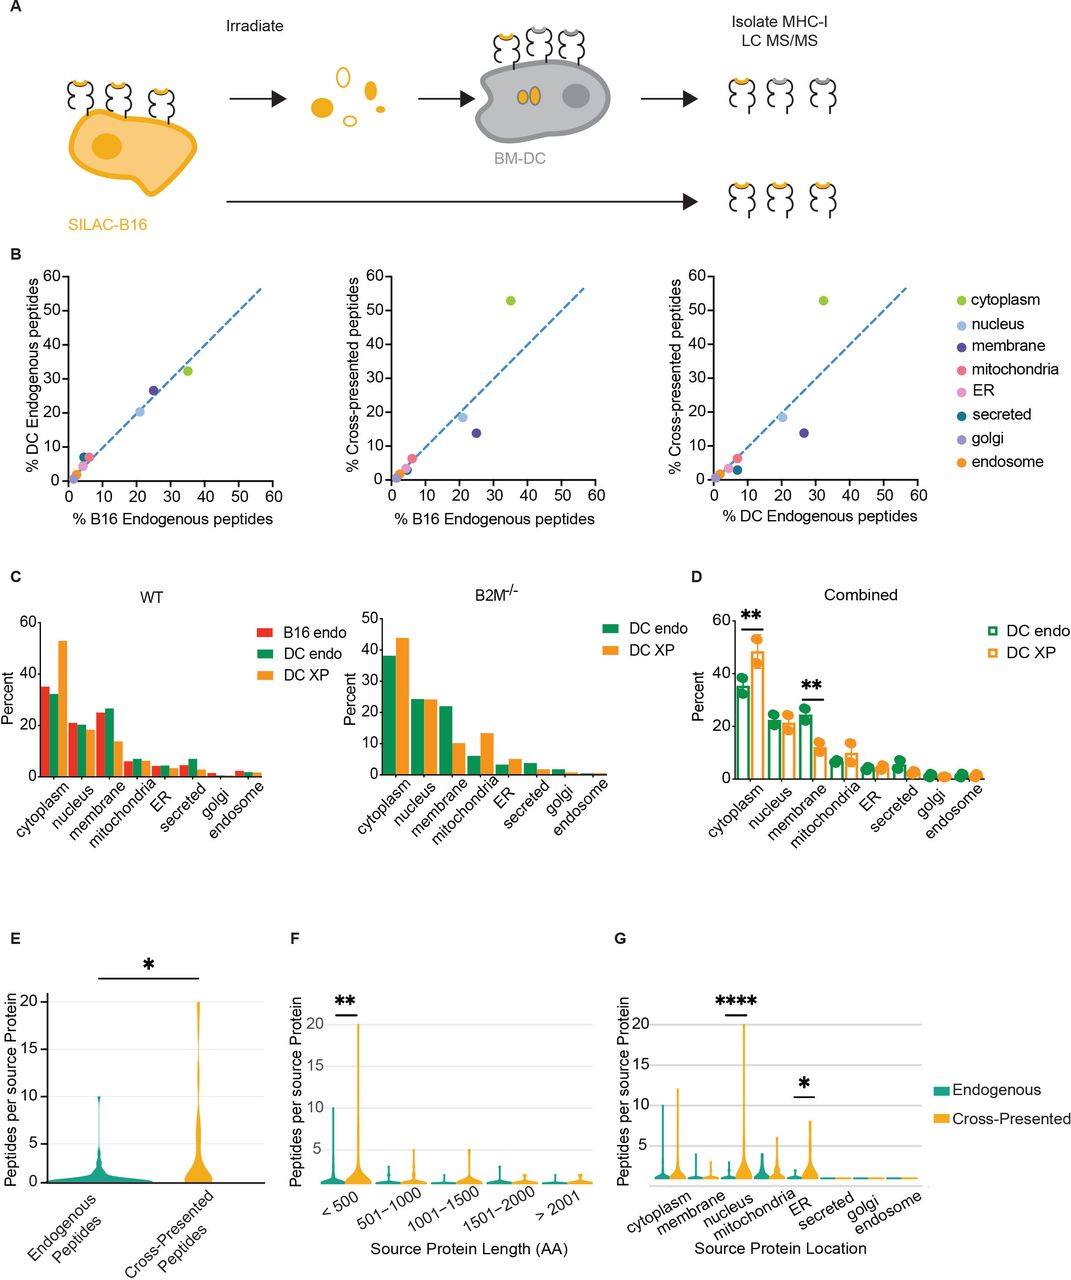
We first developed a labeling scheme that would improve detection of cross-presented peptides bound to MHC-I H-2Kb and H-2Db. Analysis of previously published immunopeptidomics data of B16F10 cells revealed four amino acids with high frequency in H-2Kb and H-2Db peptides26: leucine, phenylalanine, asparagine, and tyrosine (online supplemental figure 2A,B). In this dataset, 98% of all MHC-I peptides contained at least one of these residues, making them ideal for amino acid labeling (online supplemental figure 2C). Cell media was formulated to contain isotope labeled amino acids comprising these four amino acids, and their full incorporation was confirmed using mass spectrometry of B16F10 cell lysates (online supplemental figure 2D). Heavy-labeled B16F10 cells were irradiated and incubated for 18 hours with immature BM-DC. MHC-I peptides were isolated from BM-DC and control, non-irradiated, heavy-labeled B16F10 by MHC-I immunoprecipitation and size exclusion filtration for mass spectrometry analysis (figure 2A). As expected, MHC-I peptides isolated from B16F10 exhibited full incorporation of heavy labeled amino acids (online supplemental figure 2D).

Cross-presented peptides are biased by subcellular source sampling. (A) Schematic of SILAC to profile peptides cross-presented by BM-DC. (B) Pairwise comparisons of B16F10 endogenous, BM-DC endogenous, and cross-presented peptides according to the subcellular compartment of the peptide source. Dashed lines show linear regression with a slope of 1. ER: endoplasmatic reticulum (C) Mass-spectrometry analysis of unique peptides, showing number of unique peptides by cell compartment. Left: bar plots of B16F10 WT endogenous, BM-DC endogenous, and BM-DC cross-presented. Right: BM-DC endogenous and BM-DC cross-presented using B16F10 B2M−/− as source. (D) Combined analysis of BM-DC endogenous and cross-presented unique peptides using both B16F10 WT and B2M−/− sources combined. Shown are mean with SD. Significance was assessed using two-way ANOVA; **p<0.002. (E) Violin plot showing the number of unique peptides identified for each protein in the combined BM-DC dataset; significance was assessed using Student’s t-test, *p<0.01. (F) Protein length as a function of protein resampling in BM-DC endogenous and cross-presented peptide pools. Significance was assessed using two-way ANOVA, **p<0.01. (G) Protein subcellular compartment as a function of protein resampling in BM-DC endogenous and cross-presented peptide pools. Significance was assessed using two-way ANOVA; *p<0.05, ****p<0.0001. ANOVA, analysis of variance; BM-DC, bone marrow-derived dendritic cell; DC, dendritic cell; MHC-I, class I major histocompatibility complex.
Following quality control filtering, peptides and source proteins were identified using the mouse proteome as reference. One hundred ninety-two light endogenous BM-DC peptides, 396 heavy endogenous B16F10 peptides, and 194 heavy cross-presented peptides on BM-DC were identified as unique peptides and mapped onto known proteins within the mouse proteome (online supplemental table 2). Light and heavy peptides were differentiated based on the prediction of isotype-labeled amino acids incorporation into the native peptide sequence. Interestingly, 10 peptides were shared between the endogenously B16F10 presented peptides and cross-presented heavy peptides identified on BM-DC (online supplemental table 2). To identify the subcellular compartments that served as efficient sources for cross-presented peptides, we assigned each peptide to the cell compartment of its source protein. We then assessed the fraction of each cell compartment as a percent of the total for each of the three pools of peptides. Comparing the immunopeptidome of B16F10 and the endogenously presented BM-DC peptides to one another revealed a strong correlation, suggesting that endogenous MHC-I presentation draws from similar source proteins in both cell types (figure 2B). However, comparing the cross-presented peptides to either B16F10 or BM-DC endogenous peptides revealed a reduction in membrane-derived peptides, while peptides derived from cytoplasmic proteins were enriched (figure 2B,C, left). To obtain a quantitative measure of over- or under-representation of cellular compartments in the cross-presented peptide pool, we performed linear regressions and calculated RD. Strikingly, the RD values for cytoplasmic (18.9 and 21.6) as well as membrane peptides (10.5 and 12.0) were drastically larger than the RD observed for nucleus-derived peptides, 2.2 and 1.4 (online supplemental figure 2E). This observation suggests that peptides from cytoplasmic proteins are over-represented following cross presentation, while membrane-derived peptides are under-represented.
To exclude the possibility that intact peptide-loaded MHC-Is from irradiated B16F10 tumor cells were introduced into the BM-DC cultures, we repeated the assay using SILAC-labeled B16F10 deficient in MHC-I surface expression. The MHC-I knock-out cell line was generated by CRISPR/Cas9-mediated deletion of the beta-2-microglobulin gene, resulting in loss of stable MHC-Is (online supplemental figure 2F). Analysis of 459 endogenous (light) and 563 cross-presented (heavy) unique peptides, isolated from BM-DC validated our observation that cross-presented peptides are enriched in cytoplasmic source proteins and depleted of membrane-localized source proteins (figure 2C, right, and online supplemental table 3). Using the combined dataset of 651 endogenous (light) and 757 cross-presented (heavy) peptides isolated from BM-DC allowed us to confirm that only the cytoplasm and membrane compartments yielded a statistically different representation in cross-presented peptides versus endogenous peptides (p values 0.000076 and 0.045133, respectively) (figure 2D).
Supplemental material
We also assessed other features unique to cross-presented peptides. Assigning peptides to their source proteins revealed that unique peptides repeatedly mapped to the same protein source, a phenomenon we term the protein sampling rate. Comparing protein sampling rates for the two peptide pools revealed a significant increase in this rate for cross-presented peptides relative to endogenous peptides (figure 2E). Additional analysis suggests that the increased protein sampling rate during cross presentation was not a consequence of increased protein length (figure 2F). However, proteins from the nucleus and the endoplasmic reticulum showed a higher resampling rate, likely driven by a high abundance of few proteins in these compartments (figure 2G).
Given the stark difference between endogenous and cross-presented peptides derived from plasma membrane source proteins, we analyzed these peptide sequences in greater detail to understand whether biochemical features of the peptides might impact the efficiency in cross presentation. Membrane-resident proteins contain hydrophobic transmembrane domains, which have been proposed to confer improved binding by MHC-I.42 We mapped membrane protein-derived peptides from BM-DC endogenous, BM-DC cross-presented, and B16 endogenous pools to the transmembrane, extracellular, and cytoplasmic domains from which they derived. The representation of protein domains presented on BM-DC was indistinguishable between the endogenous and cross-presented pools but differed from MHC-I presentation on B16, suggesting that selection of these three domains was influenced by cell type but not by the cross-presentation pathway (online supplemental figure 2G).
Collectively, these data demonstrate that cytoplasm-derived peptides are enriched among cross-presented peptides, while membrane-derived peptides are decreased compared with the endogenous peptides on BM-DC and, more importantly, on tumor cells. Cross-presented peptides also resample the same source protein at significantly higher rates than endogenous MHC-I presentation.
Subcellular location of source proteins determines the capacity of DCs to activate antigen-specific T cells
Based on these observations, we speculated that the observed bias in cross presentation at a proteomic scale may directly influence the ability of DC to prime CD8+ T cells against tumor-derived antigens. To test this hypothesis, we generated B16F10 tumor cells expressing the fluorescent protein ZsGreen fused to the ovalbumin CD8+ antigen SIINFEKL (SIIN), presented on H-2Kb. This fusion protein was expressed with or without a palmitoylation domain at its N-terminus to target the protein to the cell membrane or to the cytoplasm, respectively (figure 3A). The stable cell lines, termed B16-cyto and B16-mem, were established and the expression of SIIN was normalized to comparable levels using fluorescence activated cell sorting (figure 3B and online supplemental figure 3A). We then used B16-cyto or B16-mem as the source of antigen in the in vitro cross-presentation assay. Given the antigenicity of SIIN, we first titrated the amount of irradiated tumor cell debris needed for optimal stimulation of T cell receptor-transgenic OT-I T cells, which are specific for the SIIN:H-2Kb complex (figure 3C). We selected two concentrations of irradiated B16-cyto cells, 3×10⁵ and 1×10⁵, as conditions with high or medium potential for T-cell activation. A direct comparison between B16-cyto and B16-mem at these two concentrations revealed that localization of SIIN expression to the membrane resulted in significantly less activation of OT-I T cells compared with localization of SIIN to the cytoplasm of tumor cells (figure 3D). This difference in stimulatory capacity was observed despite no difference in the proportion of ZsGreen positive BM-DC (figure 3E), nor their mean fluorescence intensity (figure 3F) following incubation with tumor debris derived from B16-mem compared with B16-cyto. However, it is worth pointing out that the 1×10⁵ condition resulted in a more profound separation, while the 3×10⁵ condition increased cross presentation and T-cell proliferation from either source of antigen. This observation suggested to us that a high antigen abundance could likely overcome the observed bias. These results suggest that DC engulf tumor-derived material associated with cell membranes at equivalent rates compared with cytoplasmic material, but that subsequent intracellular processing steps required for protein degradation and cross presentation are biased toward cytoplasmic proteins and against plasma membrane proteins, particularly when the source antigen is limited in abundance.

Subcellular location of source proteins determines the capacity of dendritic cells to activate antigen-specific T cells. (A) Schematic of cross-priming assay using the model antigen SIINFEKL targeted to the cytoplasm or the cell membrane. (B) Differential interference contrast and epifluorescence images of B16-ZsGreen-SIINFEKL (B16-cyto) and B16-palm-ZsGreen-SIINFEKL (B16-mem) cell lines. Scale bars, 100 µm. (C) Proliferation of OT-I T cells following coculture with BM-DC pulsed for 18 hours with the indicated number of irradiated B16-cyto cells. Shown is one representative experiment of three independent repeats. (D) Proliferation of OT-I T cells following coculture with BM-DC pulsed for 18 hours with the indicated number of irradiated B16-cyto or B16-mem cells. Shown are pooled results from three independent experiments; box and whiskers indicate 95th percentile. Significance was assessed using Mann-Whitney U, *p<0.05. (E) Percent BM-DC positive for ZsGreen following 18 hours’ incubation with irradiated B16-cyto or B16-mem cells relative to a negative control. (F) gMFI of irradiated B16 cells alone and of BM-DC following 18 hours’ incubation with apoptotic B16 cells. (E,F) Shown are pooled results of three independent experiments as mean and SEM significance was assessed using MWU. (G) Proliferation of OT-I T cells following coculture with cDC2/moDC or cDC1 pulsed for 18 hours with irradiated B16-cyto or B16-mem cells at rate limiting conditions (circle 1×10⁵ and square 3×10⁵ tumor cell debris). Shown are pooled results from two independent experiments. Box and whiskers indicate min and max values. significance was assessed using MWU, **p<0.01. BM-DC, bone marrow-derived dendritic cell; gMFI, geometric mean fluorescence intensity; ns, not significant.
We next aimed to determine whether this bias against plasma membrane-associated antigens is preserved in ex vivo isolated DC subsets. This step is necessary as BM-DC cultures might not faithfully recapitulate the biology of cross presentation by DC and because BM-DC cultures should generally be considered a mixture of cDC1 and cDC2/moDC. However, to abolish any potential of tumor cell-derived MHC-I stimulating T cells, we first generated B16-cyto and B16-mem cell lines lacking B2M. B2M−/− cell lines exhibited the same trend as wildtype counterparts, resulting in reduced OT-I T cell proliferation following cross presentation of SIIN from B16-B2M−/−-mem compared with B16-B2M−/−-cyto (online supplemental figure 3A,B).
Using the B16-B2M−/−-mem and B16-B2M−/−-cyto cell lines as sources for tumor cell debris, we repeated the coculture assay with cDC1 and cDC2/moDC isolated from lymphoid organs of naïve mice (online supplemental figure 3C). Both isolated DC populations showed equal stimulatory capacity when loaded with exogenous peptide (online supplemental figure 3D). Strikingly, we observed that cross presentation by cDC2/moDC was biased towards cytoplasmic source proteins, while an antigen originating from the plasma membrane was disfavored (figure 3G). The bias was not observed in ex vivo cDC1, which is highly proficient for cross presentation (figure 3G). Further it is important to note that the bias was only observed when antigen abundance was rate limiting, reinforcing our initial observation that this observation might be restricted to low-abundance antigens. Based on these observations we conclude that the bias against plasma membrane proteins as sources of cross-presented peptides can be observed in ex vivo isolated cDC2/moDC, while cDC1 is capable of cross-presenting peptides from both antigen sources equally well. It is highly conceivable that this observation is driven by the fact that cDC2/moDC are less efficient in the cross-presentation process and/or might preferentially use the vesicular pathway for cross presentation, while cDC1 relies on the cytosolic pathway.
Neoantigens in plasma membrane proteins correlate with reduced overall survival and failed responses to checkpoint blockade therapy
Since we observed that cross presentation of membrane-associated cellular antigens was reduced in BM-DC and cDC2/moDC, we reasoned that the subcellular location of mutated proteins impacts the immunogenicity of the resulting neoantigens. To study the impact of neoantigen subcellular location on patients’ responses to immunotherapy, we first analyzed a previously published dataset of 64 patients with malignant metastatic melanoma treated with ipilimumab.43 We further focused our analysis on neoantigens resulting from SNVs, as these mutations are the least likely to affect subcellular location of the protein.
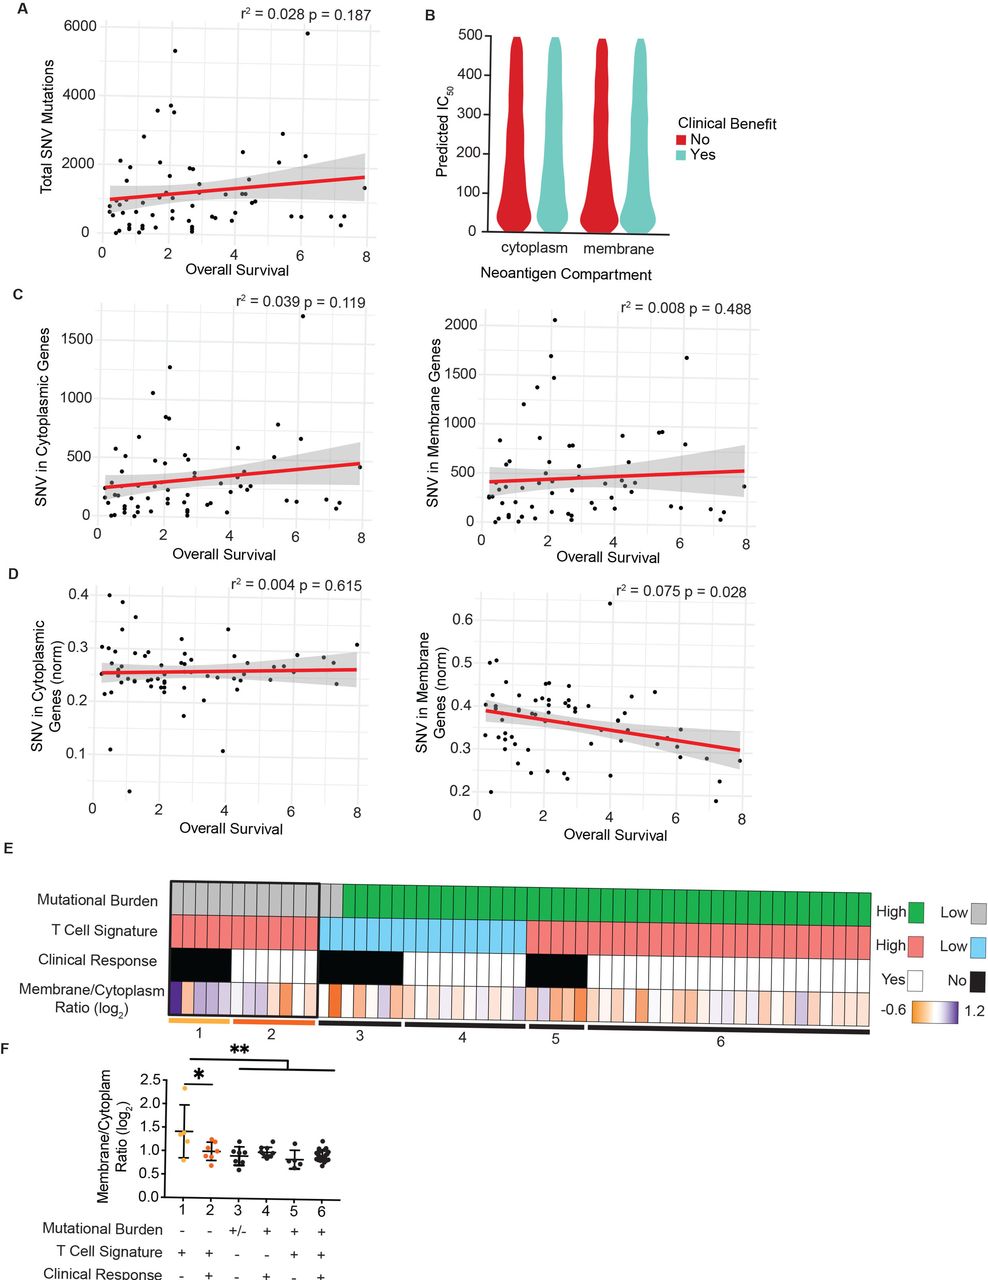
We first confirmed a moderate correlation between total SNV and overall survival as reported previously for this patient cohort (figure 4A).43 Subsequently, we mapped SNV to the subcellular compartment of the encoded protein for each patient using UniProt as described previously, focusing on mutated cytoplasmic and plasma membrane proteins. Given that the binding affinity of predicted neoantigens for MHC-I is frequently correlated with increased immunogenicity, we first assessed predicted binding affinity for cytoplasm-derived and membrane-derived neoantigens. However, we did not observe any significant differences in affinity nor an impact on clinical benefit (figure 4B). We next assessed whether SNV burden of cytoplasmic or plasma membrane proteins for each patient were correlated with overall survival or clinical benefit. However, due to the wide range of overall SNV burden per patient, we failed to observe a statistically meaningful correlation to either metric (figure 4C and online supplemental figure 4A). We therefore normalized the number of SNV in cytoplasmic or plasma membrane proteins to each patient’s overall SNV burden and assessed whether the proportion of either cytoplasmic or membrane-derived neoantigens impacted clinical outcome. Strikingly, the proportion of membrane-derived neoantigens to overall mutational burden carried a statistically significant negative correlation with overall survival and trended in the same direction with progression-free survival (figure 4D and online supplemental figure 4B). In contrast, the proportion of cytoplasm-derived neoantigens did not correlate with overall survival or clinical benefit.

Neoantigens in plasma membrane proteins correlate with reduced overall survival and failed responses to checkpoint blockade therapy. (A) Overall survival for each patient from Nathanson et al plotted against total burden of SNVs. (B) Predicted binding affinity of peptides for human leukocyte antigens (HLA) for cytoplasmic and plasma membrane source proteins, stratified by clinical benefit. (C) SNV in cytoplasmic proteins (left) and plasma membrane proteins (right) plotted per patient with respect to overall survival. (D) SNV in cytoplasmic proteins (left) or plasma membrane proteins (right) normalized to each patient’s total SNV plotted with respect to overall survival. P values for regression lines indicate significance of the slope’s deviation from 0. (E) Patients form the OpACIN-Neo trial, stratified by total burden of SNV less than or greater than 100, mean z-score of the T-cell inflammation gene expression panel less than or greater than 2, and clinical response. Bottom row shows the log2-transformed ratio of plasma membrane to cytoplasmic proteins harboring SNV for each patient. (F) The log2-transformed ratio of plasma membrane to cytoplasmic genes harboring SNV plotted for each patient group resulting from stratification in E (numbered 1–6). *P<0.05, **P<0.01 by one-sided analysis of variance. SNV, single-nucleotide variant.
We next extended these findings to a second cohort of 86 patients with stage III malignant metastatic melanoma (OpACIN-Neo trial, NCT02977052)35 36 treated with combination therapy of ipilimumab and nivolumab therapy in the neoadjuvant setting. For this dataset, both mRNA and exome sequencing data were available, which enabled us to integrate our analysis of neoantigen subcellular location with the presence or absence of a tumor-reactive T-cell infiltrate. Previous reports have shown that the absence of a tumor-reactive CD8+ T-cell infiltrate in the tumor microenvironment is correlated with failure to respond to checkpoint blockade therapy.1 2 12 We used a previously reported gene signature consisting of 160 genes, capable of predicting the T cell-infiltrated phenotype across all solid cancers44 . Consistent with previous reports, the predicted presence of a T cell infiltrate was correlated with clinical benefit (online supplemental figure 4C).
To determine whether the proportion of cytoplasmic or membrane-derived neoantigens impacted clinical response in this patient cohort, we specifically focused on patients with low mutational burden (less than 100 SNV), as we expected the effects to be most profound in this patient cohort (figure 4E). We next examined tumors with a predicted T-cell infiltrate as non-T cell-infiltrated tumors are unlikely to achieve clinical benefit due to a blunted antitumor immune response for reasons other than antigen availability12 (figure 4E). The remaining 12 patients were stratified into those with a clinical benefit and those without (figure 4E, boxed). Those patients who did not achieve a clinical benefit despite T cell-infiltrated tumors carried a high ratio of membrane-derived to cytoplasm-derived neoantigens (figure 4F). Strikingly, these patients were the only subgroup showing a significant shift in this ratio, suggesting that the subcellular location of neoantigens impact antitumor immunity in the setting of low mutational burden and T cell-infiltrated tumors.
Lastly, we reanalyzed sequencing data from a single patient with melanoma in which multiple lesions were biopsied over the course of treatment.10 Comparing SNV in the initial lesion with those in a metastatic lesion following treatment revealed that more cytoplasmic SNVs were lost than membrane SNV, driving an increased ratio of membrane:cytoplasmic SNV in metastatic lesions (online supplemental figure 4D). This observation suggests that a bias in cross presentation may also impact tumor evolution in individual patients undergoing therapy.
In sum, these observations demonstrate a previously unreported impact of subcellular location of neoantigens on the antitumor immune response and consequentially the response to checkpoint blockade therapy, which is particularly profound in patients with low mutational burden.
Measuring the abundance of cross-presented antigens reveals discordance between cross presentation and T-cell activation
Finally, we returned to in vitro cross-presentation assays using a quantitative mass spectrometry assay to directly measure cross-presented SIIN on BM-DC. This measurement permitted us to draw correlations between OT-I T cell activation and the quantity of SIIN present on BM-DC. To avoid any cross contamination from tumor cells, we used the previously described B16-B2M−/−-mem and B16-B2M−/−-cyto cell lines as source for the tumor cell debris (online supplemental figure 3A,B).
We used a targeted mass spectrometry approach to detect the abundance of the endogenous (light, L) SIIN peptide cross-presented on BM-DC. To account for variations in sample handling across analyses, a heavy (H)-labeled synthetic SIINKFE+6L peptide was loaded into a recombinant, disulfide-stabilized Kb monomer to generate an embedded reference standard.45 This standard permitted quantitative comparisons across conditions. The heavy isotope-labeled peptide–MHC was added to cell lysates at a high concentration, from which H-2Kb endogenous and heavy peptide-MHCs were enriched by immunoprecipitation, purified, and analyzed by targeted mass spectrometry. The abundance of cross-presented SIIN was then measured as a ratio of the light, endogenous signal normalized to the heavy SIIN signal (L/H). Applying this method to BM-DC following coculture with irradiated B16-B2M−/−-cyto and B16-B2M−/−-mem cells confirmed a twofold reduction in levels of cross-presented SIIN from plasma membrane sources relative to cytoplasmic sources (figure 5A). This observation suggests that reduced OT-I T cell proliferation stems directly from reduced levels of membrane-derived SIIN relative to cytoplasmic SIIN on the surface of BM-DC.

Measuring the absolute abundance of cross-presented antigens reveals discordance between cross presentation and T-cell activation. (A) T-cell proliferation following cross presentation of irradiated B16-mem and B16-B2M−/−-mem, normalized to T-cell proliferation following cross presentation of irradiated B16-cyto and B16-B2M−/−-cyto, respectively. Shown are mean with SD of pooled data from three independent experiments. (B) B16-B2M−/−-cyto and B16-B2M−/−-mem were irradiated or exposed to the indicated agents for either 24 or 48 hours before staining for annexin-V and PI. DMSO (Dimethyl sulfoxide) was used as control vehicle. (C) Levels of SIIN isolated from BM-DC following 18 hours’ incubation with the killed B16-B2M−/−-cyto or B16-B2M−/−-mem cells, expressed as the ratio of light SIIN to the internal reference SIIN. (D) OT-I T cell proliferation following coculture with BM-DC pulsed for 18 hours with B16-B2M−/−-cyto or B16-B2M−/−-mem killed with the indicated agents. *P<0.05 by MWU. L/H, ratio of the light, endogenous signal normalized to the heavy SIIN signal. BM-DC, bone marrow-derived dendritic cell; PI, propidium iodide; SIIN, SIINFEKL.
We extended this assay to other agents to determine whether the correlation between abundance of cross-presented SIIN and OT-I T cell activation is preserved using methods of cell death besides radiation. B16-B2M−/−-cyto and B16-B2M−/−-mem cell lines were exposed to two chemotherapeutic agents (doxocycline and vincristine), as well as palbociclib, a small molecule inhibitor of CDK4/6.46 Relative to irradiation, these agents induced varying degrees of annexin V exposure and PI staining, indicative of differences in cell death dependent on the mechanisms of action of the drug (figure 5B). Irradiation and doxocycline-treatment induced similar modes of cell death, while vincristine treatment resulted in a shift towards early preapoptotic cells (annexin V−/PI−) and treatment with palbociclib induced primarily cells already in the late phase of apoptosis (annexinV+/PI+).
Cell material generated using this panel of agents was incubated with BM-DCs, which were analyzed by quantitative targeted mass spectrometry to evaluate cross presentation of SIIN (figure 5C). Doxocycline conferred low to undetectable SIIN on BM-DC, despite inducing a similar mode of cell death compared with irradiation. Cell death by vincristine exposure, inducing early apoptotic cell debris, yielded the highest SIIN cross-presented from B16-B2M−/−-cyto, which was reduced twofold in B16-B2M−/−-mem. Palbociclib, inducing tumor cell debris derived from late apoptotic cells, yielded roughly equivalent SIIN levels between B16-B2M−/−-cyto and B16-B2M−/−-mem, suggesting that late apoptosomes might be best suited for cross presentation of plasma membrane-associated peptides.
A coculture assay using these conditions showed that the ability of BM-DC to stimulate T-cell proliferation was somewhat coupled to measured levels of cross-presented SIIN (figure 5D). Doxocycline-treated B16 cells served as poor reservoirs for SIIN cross presentation and accordingly did not stimulate T-cell proliferation. Meanwhile, SIIN cross-presented from vincristine-treated B16 yielded an overall appreciable T-cell proliferation. This observation might be explained by the fact that vincristine-induced cell death increased the abundance of cross-presented SIIN peptide by 1.5-fold compared with irradiation-induced cell death (figure 5A,C). Thus, it would be consistent with our previous observations that an increase in antigen abundance might alleviate the bias against plasma membrane-associated peptides. Finally, despite appreciable SIIN cross-presented on BM-DC from palbociclib-treated B16, T cells were poorly stimulated regardless of the subcellular location of SIIN. These observed discrepancies between antigen presentation and ability to activate T cells could be explained by the stimulatory potential of differentially matured DC. We therefore assessed the maturation status of BM-DC following exposure to tumor cell debris by measuring CD80 and CD86, and identified that only irradiation-induced cell death resulted in appreciable upregulation of costimulation (online supplemental figure 5). In sum, our data show that the abundance of cross-presented antigen is correlated with T-cell cross priming for irradiation-treated, doxocycline-treated, and vincristine-treated cellular sources, but cell death following palbociclib can evade efficient cross presentation to reduce T-cell activation. Further, our data indicate that the abundance level of cross-presented antigen can overcome the bias against plasma membrane-associated peptides but that only irradiation results in adequate activation of DC and the upregulation of costimulation. Efficient cross presentation is therefore required but not sufficient to effectively induce effector T-cell activation, which is further impacted by the maturation state of DC.
Discussion
This study is the first to leverage MHC-tailored SILAC mass spectrometry to characterize cross-presented peptides in an unbiased manner. We show a previously undescribed bias in the source proteins of peptides cross-presented by DC. When deconvolved according to the cell compartment of the source proteins’ origin, peptides cross-presented by BM-DC were enriched in cytoplasmic sources and reduced in plasma membrane sources. A targeted approach using a model antigen confirmed that this bias in cross presentation is functionally relevant. We were further able to show that this bias was independent of phagocytic ability of BM-DC to internalize cytoplasm or membrane from tumor cells. Using ex vivo isolated cDC1 and cDC2/moDC as sources of APC, we determined that the bias was most profound in cDC2/moDC, suggesting that the bias towards cytoplasmatic proteins is most profound when the process of cross presentation is rate limiting. Further, the translational relevance of our observations was validated in two cohorts of patients with melanoma, using SNV and neoantigen prediction as a surrogate for tumor-specific peptides. Both cohorts confirmed a previously unappreciated effect of the cell compartment of neoantigen sources on clinical outcomes. We conclude that cross presentation by DC shows an inherent bias to specific subcellular compartments when compared with endogenous MHC-I peptide presentation. This difference between the immunopeptidome on DC and tumor cells may explain why T-cell responses towards some predicted neoantigens are not detected in patients with cancer.
Mechanistically, one could speculate that cytoplasmatic proteins often associated with other components of the cytosol are preferentially processed during cross presentation. In contrast, proteins with transmembrane domains gain access to certain cross-presentation pathways at lower rates than other proteins. The observed bias against plasma membrane proteins was affected by the mode of cell death, as the induction of predominantly necrotic or late apoptotic cell debris by palbociclib increased cross presentation of plasma membrane source proteins. Yet, the poor immunogenicity of the tumor cell debris prevented the induction of effector T cells due to failed DC maturation. Preclinical data suggest that small soluble cell debris can be cross-presented in the absence of the Tap complex by cDC2.18 This observation suggests that in cDC2 the vesicular pathway of cross presentation might be important. Combined with our observation that the bias against plasma membrane-associated proteins is most profoundly observed in cDC2/moDC, one could speculate that plasma membrane-associated proteins are poorly degraded when subjected to the vesicular pathway of cross presentation. A recent report proposed a mechanism for cross presentation consistent with our observations of its limits. Canton and colleagues found that DC permeabilize the phagosome following phagocytosis, allowing some of its contents to enter the cytosol for downstream degradation.19 Our observations are in line with this model, as membrane-associated proteins would have a disadvantage over other phagosomal content. Only sufficient proteolysis to remove their helical transmembrane domains would enable plasma membrane proteins to be released to the cytosol in a soluble form. If confirmed, this mechanism for cross presentation puts plasma membrane proteins at risk of either complete proteolysis and destruction of antigens or for insufficient proteolysis and retention in membranes of the endocytic system, in particular in the cDC2/moDC compartment. Besides a bias in subcellular compartment, cross presentation also tended to resample the same protein at significantly higher levels than endogenously presented peptides. This suggests that certain proteins are efficiently targeted to the cross-presentation pathway, either due to intrinsic properties that permit them increased access to cross presentation or to spatial selection that transports protein aggregates together to the MHC-I presentation pathway.
Evidence for a similar bias can be found in other experimental systems and in a recent report on cross-presented viral antigens. Wu and colleagues quantified direct presentation and cross presentation of 21 influenza A virus CD8+ T cell peptides.47 The greatest disparity in abundance of endogenous versus cross-presented peptides was from four peptides mapped to the membrane-resident receptor hemagglutinin. While viral infections elicit specialized responses both in host cells and in immune cells encountering them, the notable consistency with our results suggests that membrane residence may broadly impact cross presentation beyond the setting of tumor immunology.
Our analysis of patients with cancer further supported our observations made using preclinical models. We assessed overall survival or response following checkpoint blockade immunotherapy as a surrogate for the strength of the antitumor response. This showed that overall survival following anti-CTLA4 treatment was anticorrelated with the fraction of predicted neoantigens in plasma membrane proteins. Using data from the neoadjuvant trial OpACIN-neo, we found that this observation is particularly relevant in patients with low mutational burden and a T cell-infiltrated phenotype. In this particular group, in which the abundance of immunogenic peptides is limited, we observed that a high proportion of mutations in proteins with transmembrane domains is detrimental for the response towards neoadjuvant checkpoint blockade therapy. It might be particularly apparent in the neoadjuvant setting as DC-mediated T-cell priming might still be ongoing. Given that both clinical datasets suggest a particular importance of the neoantigens source protein in patients with lower mutational burden, our findings may have important implications for the design of therapies bypassing cross presentation, most prominently neoantigen-based vaccination.5 48
Recent clinical trials using mRNA-based vaccines encoding for patient specific neoantigens have shown that robust immune responses can be induced following vaccination, in particular if no pre-existing T-cell response towards the given neoantigen could be observed.49–51 We observed that neoantigens derived from plasma membrane source proteins are disadvantaged during cross presentation, yet can be detected in the immunopeptidome of tumor cells following endogenous peptide processing and presentation. Neoantigen vaccines are most likely to be used in patients not responding to immune checkpoint blockade and thus comprising low CD8+ T-cell infiltration associated with low cDC1 infiltration.2 13 52 This shift from cDC1 to cDC2 as the natural APC might amplify the bias towards cytoplasmic neoantigens as our ex vivo cross presentation coculture suggests. Thus, high-affinity neoantigens from plasma membrane proteins containing might be ideal candidates for inclusion in neoantigen-based vaccines to circumvent the potentially inefficient priming. This notion is further supported by the observation that mutated proteins with transmembrane domains can also serve as potent CD4 T-cell epitopes,11 29 53 amplifying the effect of such a vaccine. Such a notion could be validated using clinical samples from patients receiving neoantigen vaccines, and such clinical validation would be needed prior to prioritization of neoantigens based on cell compartment for the development of vaccines.
In sum, our preclinical and clinical data suggest that the subcellular source of neoantigens, and potentially all tumor-associated antigens, impacts the efficiency of peptide cross presentation. While our data suggest that this difference might not be the dominant factor impacting the overall antitumor T-cell response, it can be an important factor in tumors with low mutational tumor burden. Probing whether vaccine strategies targeting neoantigens derived from plasma membrane proteins would result in the induction of de novo antitumor T-cell responses might be one way of testing this hypothesis.
Data availability statement
All data relevant to the study are included in the article or uploaded as supplementary information.
Ethics statements
Patient consent for publication
Ethics approval
All studies involving vertebrates were reviewed and approved by MIT’s Committee for Animal Care (CAC, IACUC).
Acknowledgments
We thank Melissa Duquette for mouse colony maintenance and Paul Thompson for administrative support. We thank Alex Jaeger (Koch Institute at MIT) for generously assisting with reagents for quantitative mass spectrometry assays. We thank the Koch Institute's Robert A Swanson (1969) Biotechnology Center. We thank Richard Cook at the Biopolymers & Proteomics core facility for peptide synthesis support. This work was supported by the Cancer Core Grant P30 CA014051-49 and Cancer Research Institute Irvington Postdoctoral Fellowship, the Howard S. (1953) and Linda B. Stern Career Development Professorship, and the Pew-Stewart Scholarship.
References
Supplementary materials
Supplementary Data
This web only file has been produced by the BMJ Publishing Group from an electronic file supplied by the author(s) and has not been edited for content.
Supplementary Data
This web only file has been produced by the BMJ Publishing Group from an electronic file supplied by the author(s) and has not been edited for content.
Footnotes
Twitter @timisstuck, @theresemariec
Contributors TBF and SS conceptualized the study. TBF designed and performed experiments contributing to: Figs. 1A, 1B, 2E, 2F, 2G, 3B, 3C, 3D, 3E, 3F, 4A, 4B, 4C, 4D, 5B, 5D, S2F, S2G, S3A, S3B, S4, S4B, S4C, S4D, S5A, S5B. FC designed and performed experiment resulting in Figs. 3G, S3C, S3D. LES designed and preformed experiments (SILAC labeling scheme, all custom MS acquisition workflows) resulting in Figs. 1D. 2B, 2C, 2D, 5A, 5C, S1, S2A, S2B, S2C, S2D, S2E, S2F. SS analyzed data shown in Figs. 4E and 4F. JMM assisted with computation analyses (wrote scripts to automate determination of SILAC incorporation). TBF and JZ performed computational analyses of cell compartments and clinical data. TBF, LES, JMM, FC and TCD generated reagents and assisted with data interpretation throughout the study. CB, IR, and EH generated and provided access to clinical data set shown in Figs. 4E and 4F. FW and SS supervised data interpretation. TBF and SS wrote the manuscript. FC and SS revised the manuscript and finalized the figures. SS and FW acquired funding and supervised the study. SS is the senior author of this study.
Funding This work was supported by the Koch Institute Frontier Research Program, the Melanoma Research Alliance Young Investigator Award (SS; DOI: http://doi.org/10.48050/pc.gr.86377), Melanoma Research Alliance MRA Team Science Award 565436 (DOI: https://doi.org/10.48050/pc.gr.80583) (FMW), and the Cancer Research Institute Irvington Postdoctoral Fellowship (TBF). LS was supported in part by NIH T32-ES007020.
Competing interests The authors declare no competing interests. SS is a co-founder of Danger Bio and a consultant or SAB member of Arcus Biosciences, Dragonfly Therapeutics, TAKEDA, Merck, Ribon Therapeutics, and Tango Therapeutics. These activities are not in conflict with the presented data.
Provenance and peer review Not commissioned; externally peer reviewed.
Supplemental material This content has been supplied by the author(s). It has not been vetted by BMJ Publishing Group Limited (BMJ) and may not have been peer-reviewed. Any opinions or recommendations discussed are solely those of the author(s) and are not endorsed by BMJ. BMJ disclaims all liability and responsibility arising from any reliance placed on the content. Where the content includes any translated material, BMJ does not warrant the accuracy and reliability of the translations (including but not limited to local regulations, clinical guidelines, terminology, drug names and drug dosages), and is not responsible for any error and/or omissions arising from translation and adaptation or otherwise.