Article Text

Abstract
Background Many solid tumors do not respond to immunotherapy due to their immunologically cold tumor microenvironment (TME). We and others found that oncolytic viruses (OVs), including reovirus type 3 Dearing, can enhance the efficacy of immunotherapy by recruiting CD8+ T cells to the TME. A significant part of the incoming CD8+ T cells is directed toward reovirus itself, which may be detrimental to the efficacy of OVs. However, here we aim to exploit these incoming virus-specific T cells as anticancer effector cells.
Methods We performed an in-depth characterization of the reovirus-induced T-cell response in immune-competent mice bearing pancreatic KPC3 tumors. The immunodominant CD8+ T-cell epitope of reovirus was identified using epitope prediction algorithms and peptide arrays, and the quantity and quality of reovirus-specific T cells after reovirus administration were assessed using high-dimensional flow cytometry. A synthetic long peptide (SLP)-based vaccination strategy was designed to enhance the intratumoral frequency of reovirus-specific CD8+ T cells.
Results Reovirus administration did not induce tumor-specific T cells but rather induced high frequencies of reovirus-specific CD8+ T cells directed to the immunodominant epitope. Priming of reovirus-specific T cells required a low-frequent population of cross-presenting dendritic cells which was absent in Batf3-/- mice. While intratumoral and intravenous reovirus administration induced equal systemic frequencies of reovirus-specific T cells, reovirus-specific T cells were highly enriched in the TME exclusively after intratumoral administration. Here, they displayed characteristics of potent effector cells with high expression of KLRG1, suggesting they may be responsive against local reovirus-infected cells. To exploit these reovirus-specific T cells as anticancer effector cells, we designed an SLP-based vaccination strategy to induce a strong T-cell response before virotherapy. These high frequencies of circulating reovirus-specific T cells were reactivated on intratumoral reovirus administration and significantly delayed tumor growth.
Conclusions These findings provide proof of concept that OV-specific T cells, despite not being tumor-specific, can be exploited as potent effector cells for anticancer treatment when primed before virotherapy. This is an attractive strategy for low-immunogenic tumors lacking tumor-specific T cells.
- Oncolytic Viruses
- Epitope Mapping
- Vaccination
- Immunotherapy
- Lymphocytes, Tumor-Infiltrating
Data availability statement
Data are available on reasonable request. All data relevant to the study are included in the article or uploaded as online supplemental information.
This is an open access article distributed in accordance with the Creative Commons Attribution Non Commercial (CC BY-NC 4.0) license, which permits others to distribute, remix, adapt, build upon this work non-commercially, and license their derivative works on different terms, provided the original work is properly cited, appropriate credit is given, any changes made indicated, and the use is non-commercial. See http://creativecommons.org/licenses/by-nc/4.0/.
Statistics from Altmetric.com
WHAT IS ALREADY KNOWN ON THIS TOPIC
Reovirus is one of the leading oncolytic viruses (OVs) under clinical evaluation. As monotherapy it has demonstrated moderate antitumor efficacy.
Reovirus has demonstrated great immunostimulatory potential by enhancing CD8+ T-cell influx in solid tumors.
A large majority of these tumor-infiltrating T cells is reovirus-specific and does not recognize the tumor.
WHAT THIS STUDY ADDS
Despite being reovirus-specific, these tumor-infiltrating T cells can still be exploited as anti-cancer effector cells.
This requires expanding of a preinstalled pool of reovirus-specific CD8+ T cells by a synthetic peptide vaccine prior to therapeutic reovirus administration.
HOW THIS STUDY MIGHT AFFECT RESEARCH, PRACTICE OR POLICY
These data advocate for the use of peptide vaccines aimed at expanding the OV-specific T-cell pool to enhance the efficacy of OVs.
Background
Oncolytic viruses (OVs) are increasingly recognized as potent anticancer agents due to their preferential replication in cancerous cells and stimulation of host antitumor immunity.1 The mammalian reovirus type 3 Dearing strain (T3D) is one of the leading OVs under clinical evaluation and displays an excellent safety record in clinical trials.2 3 Reoviruses show an inherent preference for replication in and lysis of transformed, but not healthy cells.4–6 As a monotherapy, reovirus has demonstrated moderate antitumor efficacy, for example in prostate xenograft models and prostate cancer patients.7 8 Recent advances in the field have shown that beyond their oncolytic capacity, OVs are useful as potent immunostimulatory agents. For example, they can enhance the efficacy of immune checkpoint blockade in immunogenic tumors by further enhancing the intratumoral density of tumor-specific CD8+ T cells that can be reinvigorated by checkpoint blockade.1 9 10
We questioned whether the immunostimulatory properties of OVs can also be beneficial for non-immunogenic tumors that lack tumor-specific T cells and thus are completely non-responsive to immune checkpoint therapy. We recently demonstrated that intratumoral reovirus administration strongly enhances the infiltration of CD8+ T cells in a non-immunogenic murine pancreatic cancer model.11 A large proportion of these tumor-infiltrating lymphocytes (TILs) did not recognize the tumor but was directed toward reovirus itself. Despite being reovirus-specific, these T cells could be exploited by CD3-bispecific antibodies (CD3-bsAbs) to induce tumor regressions of established tumors. Here, we aim to exploit the incoming T cells as anticancer effector cells because they are virus-specific.
For this aim, we first investigated the requirements for an effective reovirus-specific T-cell response. We mapped the reovirus T-cell epitope, which allowed us to specifically study the kinetics, distribution, and phenotype of reovirus-specific T cells. We demonstrated that Batf3-driven cross-presenting dendritic cells (cDC1s) are involved in the priming of reovirus-specific T cells and that intratumoral reovirus administration is not required for priming but is strongly preferred for an efficient intratumoral influx of reovirus-specific T cells. In the tumor, reovirus-specific T cells have a profound effector phenotype. Priming of these T cells using a vaccination strategy before intratumoral reovirus therapy strongly improved its antitumor effect.
Our findings provide proof of concept that the presence of a pre-installed pool of OV-specific T cells, despite not being tumor-specific, can effectively delay tumor growth after OV therapy. Exploiting these virus-specific T cells during OV administration is an attractive strategy for low-immunogenic tumors that lack tumor-specific T cells.
Material and methods
Reovirus
The wild-type reovirus strain R124 (here referred to as Reo) was previously isolated from a heterogeneous reovirus T3D stock (VR-824) obtained from the American Type Culture Collection by two rounds of plaque purification using HER911 cells.12 Reovirus mutant Jin-3 was isolated from JAM-A-deficient U118MG cells after passaging of the wild-type T3D strain R124.12 All experiments were performed using cesium chloride-purified stocks as described earlier.11 The total amount of particles was calculated based on OD260 values where 1 OD260 equals 2.10×10¹² reovirus particles/mL,13 and the infectious titer was quantified by plaque assay on HER911 cells.14
Cell lines and culture
The murine pancreatic cancer cell line KPC3 is a low-passage derivate of a primary KPC tumor with mutant p53 and K-ras from a female C57BL/6 mouse.11 15 All cells were cultured at 37°C in a humidified atmosphere containing 5% CO2 in Iscove’s Modified Dulbecco’s Medium (Invitrogen) supplemented with 8% fetal calf serum (Bodinco, Alkmaar, The Netherlands), 2 mM L-glutamine (Gibco), 100 µg/mL penicillin and 100 µg/mL streptomycin (Gibco). The tumor cell line TC1 expresses the HPV16-derived oncogenes E6 and E7 and activated Ras oncogene and was additionally cultured in the presence of 400 µg/mL Geneticin (G418; Life Technologies), 1% nonessential amino acids (Life Technologies), and 1 mM sodium pyruvate (Life Technologies).16 The cell line TC1.B7 was retrovirally transduced to express high levels of costimulatory molecule CD86. The DC line D1 was originally obtained from P. Ricciardi-Castagnoli (University of Milano-Bicocca, Milan, Italy).17 Fre.Db and Fre.Kb cell lines are stable transfectants of the Fisher rat embryo (FRE) cell line.18 Cell lines were assured to be free of Mycoplasma by regular PCR analysis. Authentication of the cell lines was done by Short Tandem Repeat (STR) profiling (IDEXX BioAnalytics, Ludwigsburg, Germany) and cells of low passage number were used for all experiments.
Animal experiments
Male C57BL/6 J mice (H-2b) were purchased from Charles River Laboratories (France). Male and female Batf3-deficient mice (The Jackson Laboratory, USA) were bred at the animal facility of Amsterdam University Medical Center. Mice were housed in individually ventilated cages with no more than 5 mice/cage. After 1 week of acclimatization after transport, mice (6–8 weeks old) were inoculated with subcutaneous KPC3 or TC1 tumors as described before.11 Intratumoral reovirus administration was performed under isoflurane anesthesia by injection of 1×10⁷ plaque-forming units (pfu) of reovirus or phosphate-buffered saline (PBS) as a control in a volume of 30 µL PBS on three consecutive days unless otherwise indicated. Intravenous administration of reovirus after tumor challenge was performed by injection of 3×10⁷ pfu of reovirus in a total volume of 100 µL PBS in the tail vein. Intratumoral peptide injection was performed under isoflurane anesthesia by injection of 50 µg peptide in 30 µL PBS.
For vaccination experiments, naïve male C57BL/6 J mice received the reovirus-derived synthetic long peptide (SLP) (DKMRVLSVSPKYSDLLTYVDAYVGV) or the human papillomavirus 16 (HPV16) E7-derived SLP (GQAEPDRAHYNIVTFCCKCDS) (GenScript, Leiden, The Netherlands) to induce reovirus- or HPV-specific T-cell immunity. 50 nmol SLP was mixed with 20 µg CpG (ODN1826; InvivoGen) and subcutaneously injected in the tailbase region in 50 µL PBS. This injection was repeated after 2 weeks to boost the efficacy of vaccination. For immunization experiments, mice were immunized by intravenously injecting 1×10⁷ pfu of reovirus in a volume of 100 µL PBS in the tail vein. This injection was repeated after 2 weeks. After vaccination or immunization, mice were engrafted with a subcutaneous KPC3 tumor (1×10⁵ cells in 100 µL PBS/0.1% bovine serum albumin (BSA)) and received reovirus intratumorally as described.
When checkpoint blockade was applied, mice were treated on indicated days with intraperitoneal injections of 200 µg PD-L1-blocking antibody (clone 10F.9G2; GoInVivo Purified anti-mouse CD274 Antibody; BioLegend). To deplete CD8+ T cells after vaccination, mice were injected with 50 µg anti-CD8 antibody (Clone 2.43; produced in-house). Depletion of CD8+ T cells was verified by flow cytometry before mice received intratumoral reovirus injections.
To reduce the number of experimental animals, some research questions were addressed in one experiment, thereby sharing the control group. This is indicated in the respective figure legends. Cages were randomly allocated to a certain treatment group by an independent researcher and treatments were given in a different order each time. During all experiments, tumors were measured three times a week in three dimensions using a caliper, in a blinded manner concerning the experimental group. For intratumoral analysis experiments, mice were sacrificed at indicated days after treatment before organs and blood were collected. For experiments where tumor growth was the experimental outcome, mice were sacrificed when the tumor volume exceeded 1000 mm3 or when ulceration occurred. Tumors were divided into representative parts, which were either snap-frozen in liquid N2 and stored at −80°C until further analysis, or immediately processed to single cells suspensions for flow cytometry analysis.
Cell preparation and flow cytometry
Tumors, liver, lungs, spleens, and (TD)LNs were dissociated into a single-cell suspension as described before.11 Liver, blood, and splenocytes were incubated with red blood cell lysis buffer for 3 min at room temperature (RT) before use. All cells were incubated with Zombie AquaTM Fixable Viability Dye (BioLegend) in PBS for 20 min at RT followed by incubation with 2.4G2 FcR blocking antibodies (clone 2.4G2; BD Biosciences) in FACS buffer (PBS, 0.5% BSA and 1% sodium azide) for 20 min on ice. If applicable, cells were incubated with Reo μ1133-140 tetramer conjugated to APC or the HPV E749-57 tetramer (both generated in-house) for 1 hour at RT in FACS buffer, after which surface markers (online supplemental table S1) were added directly to the tetramer mixture for 30 min of incubation at RT. After completion of staining protocols, samples were fixed in 1% paraformaldehyde and acquired using a BD LSRFortessa X20 4 L cell analyzer (BD Biosciences, San Jose, CA, USA) at the Flow cytometry Core Facility of Leiden University Medical Center in Leiden, Netherlands (https://www.lumc.nl/research/facilities/fcf). Data were analyzed using FlowJo Software V.10 (Becton, Dickinson, and Company). Opt-SNE plots19 were generated using standard settings in OMIQ data analysis software (www.omiq.ai).
Supplemental material
Generation of reovirus-specific T-cell bulk
To generate a reovirus-specific T-cell bulk, a KPC3-bearing C57BL/6 J mouse was intratumorally injected with 107 pfu of reovirus on three consecutive days. 6 days after the last reovirus injection, the mouse was sacrificed by cervical dislocation and the spleen was harvested and processed into a single-cell suspension. After red blood cell lysis, 30×106 splenocytes were co-cultured in culture medium supplemented with 50 mM β-mercaptoethanol for 4 hours with 1.5×10⁸ infectious reovirus particles, equaling a multiplicity of infection of 5. Hereafter, splenocytes were washed and plated at 300.000 cells/well in a round-bottom 96-wells plate. Bulk cultures were restimulated weekly with irradiated reovirus-infected TC1.B7 cells (6000 RAD) and irradiated naïve splenocytes (3000 RAD) as feeders. Initially, bulk cultures were sustained with recombinant IL-2 (10 CU/mL) and later supplemented with 5% (v/v) conditioned medium from Con A- and phorbol 12-myristate 13-acetate (PMA)-stimulated rat splenocytes.18 When necessary, cellular debris was removed by Ficoll-Paque density-gradient centrifugation following the manufacturer’s instruction. The specificity of the T-cell bulk was initially assessed using intracellular cytokine staining.
Peptide prediction
Peptide prediction was performed using the NetMHC 4.0 Server (Technical University of Denmark). Sequences of all segments (S1-4, M1-3, and L1-3, (online supplemental table S2) of reovirus T3D strain isolate R124 were obtained from the Nucleotide database of the National Center for Biotechnology Information (Bethesda MD, USA) and individually loaded into the NetMHC 4.0 Server. Peptide length was set at 8–11 amino acids and thresholds for predicted affinity were set at <0.5% (strong binders) and >2.0% (weak binders) for murine MHC-I molecule H-2Kb. Predicted peptides of all segments were combined and sorted on binding affinity (nM) and rank. Peptides (online supplemental table S3) with rank <0.200 were ordered as a micro-scale crude peptide library (GenScript, Leiden, The Netherlands) and their recognition by the reovirus-specific T-cell bulk was assessed using intracellular cytokine staining.
Intracellular cytokine staining
T cells from the reovirus-specific T-cell bulk or ex vivo tissues were co-cultured with reovirus-infected target cells (E/T=1:1) or peptides (1 µg/mL). Unless otherwise indicated, the irrelevant cell line TC1 was used as target. Alternatively, serial dilutions of peptides ranging from 10 µM to 10 pM were added to T cells from the reovirus-specific T-cell bulk. When peptides were presented in the context of D1 cells, peptides were incubated with D1 cells for 1 hour before overnight incubation with lipopolysaccharides (LPS, 10 μg/mL). For SLP processing experiments, D1 cells were preincubated for 1 hour with SLPs in concentrations between 10 µM and 1 pM after which LPS (10 µg/mL) was added to each well for an additional 23 hours. Effector cells and target cells, peptides, or peptide-loaded D1 cells were co-cultured for 6 hours in the presence of BD GolgiPlug (BD Biosciences). PMA (20 ng/mL) and ionomycin (1 µg/mL) were used as positive control. After incubation, cells were washed and stained for CD8α (53–6.7; BioLegend). Thereafter, cells were fixed with Fixation Buffer (BioLegend) according to the manufacturer’s instructions, followed by staining for intracellular IFNγ (XMG1.2; BioLegend). After completion of the staining protocol, samples were fixed in 1% paraformaldehyde and acquired using a BD LSRFortessa X20 cell analyzer (BD Biosciences).
RNA isolation and RT-qPCR
A representative snap-frozen proportion (10–30 mg) of each tumor or organ was disrupted using a stainless bead and the TissueLyser LT (Qiagen). Total RNA of in vivo samples was using the ReliaPrep RNA Tissue Miniprep System (Promega) according to the manufacturer’s protocol. Reovirus genomic copies and expression levels of host genes (online supplemental table S4) in tumors were measured by RT-qPCR as previously described.11 Reovirus S4 copy numbers were determined based on a standard curve, generated with serial dilutions of plasmid pcDNA_S4. Log10 S4 copy numbers were calculated using a previously described formula.20 The expression of host genes was normalized to reference genes Mzt2 and Ptp4a2 using the Bio-Rad CFX Manager 3.1 Software (Bio-Rad).
Western blotting
Expression of reovirus μ1 protein in KPC3 tumors was analyzed by Western blotting. Briefly, snap-frozen KPC3 tumor pieces were lysed in radioimmunoprecipitation assay (RIPA) buffer containing protease and phosphatase inhibitors using a stainless bead and the TissueLyser LT (Qiagen). Proteins (40 µg) were separated on a 4%–15% mini-protean TGX gel (Bio-Rad) and then transferred to a 0.2 µM nitrocellulose membrane (Bio-Rad). After blocking for 1 hour at RT with Pierce Protein-Free (TBS) Blocking Buffer (ThermoFisher Scientific), the membrane was incubated overnight at 4°C with anti-μ1 (clone 10F6; Developmental Studies Hybridoma Bank, 1:200) or anti-β-actin (Cell Signaling Technology; 1:1000), followed by horseradish peroxidase (HRP)-conjugated goat anti-mouse IgG+IgM+IgA (Abcam, 1:1000) or HRP-conjugated goat anti-rabbit IgG (Cell Signaling Technology, 1:2000) at RT for 1 hour. Proteins were detected on the Chemidoc XRS+ Imaging system (Bio-Rad) using the Clarity Western ECL Substrate kit (Bio-Rad).
Statistics
Group size was calculated using the PS: Power and Sample Size Calculation program (Vanderbilt University, V.3.1.6).21 For experiments where tumor growth was the experimental read-out, mice were excluded when tumor engraftment was not successful (1% of all tumor engraftments). For RT-qPCR analysis, samples were excluded when RNA concentration and purity were too low. For flow cytometry data, tumor samples were excluded when evidence for draining lymph node contamination was present.
All graphs were prepared and statistical analyses were performed using the GraphPad Prism software (V.8.0.2). Statistical tests used for each figure are described in the figure legends. Experimental data were assumed to be normally distributed in all cases, except in the case of RT-qPCR data where SD in Reo groups were significantly different compared with PBS groups. Significance levels are labeled with asterisks, with *p<0.05, **p<0.01, ***p<0.001 and ****p<0.0001. Non-significant differences are indicated by ns.
Results
Identification of immunodominant reovirus CD8+ T-cell epitope
The use of OVs is an attractive approach to increase CD8+ T-cell influx in solid tumors with an immune-silent phenotype. Indeed, intratumoral injections with oncolytic reovirus in mice bearing murine pancreatic KPC3 tumors or epithelial lung TC1 tumors significantly enhance the frequency of CD8+ T cells in these tumors (figure 1A–B, online supplemental figure S1A,B).11 When these tumor-infiltrating lymphocytes (TILs) were examined for their specificity, we observed that TILs from reovirus-injected tumors only responded when the irrelevant, reovirus-infected TC1 cell line was used as target (figure 1C, online supplemental figure S1C). This suggests that TILs of reovirus-treated mice were mainly reovirus-specific but not tumor-specific. To enable more detailed studies on the role of T cells during reovirus therapy, we set forth to identify the reovirus-derived epitopes recognized by the T cells. Since reovirus-specific T cells were also found in the spleen (figure 1C, online supplemental figure S1C), we used this splenic population of reovirus-specific CD8+ T cells to generate a reovirus-specific T-cell bulk culture that could be used for epitope identification (figure 1D). After a few rounds of in vitro restimulation with reovirus-infected target cells, a large proportion of the bulk recognized reovirus-infected target cells (figure 1E). The response of the reovirus-specific T-cell bulk was restricted by murine H-2Kb, as IFNγ was only produced in response to reovirus-infected FRE.Kb cells and not to infected FRE.Db cells, even though infection efficiency was similar in both cell lines (figure 1F, online supplemental figure S2A, B).
Supplemental material
Supplemental material
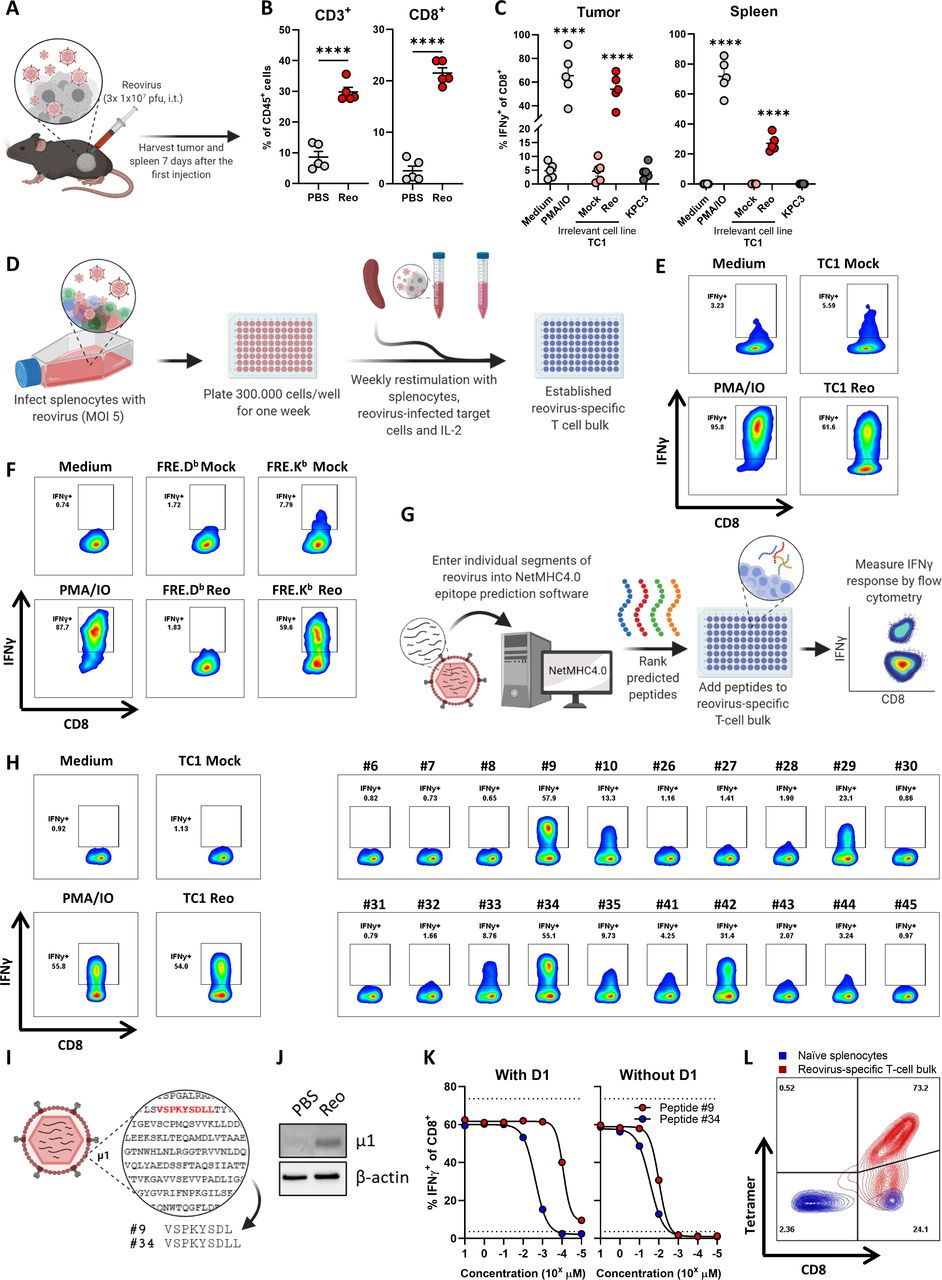
Identification of immunodominant reovirus CD8+ T-cell epitope. (A) Design of experiment described in B, C. Mice (n=5/group) with established KPC3 tumors were intratumorally (i.t.) injected with reovirus (Reo; 107 plaque-forming units (pfu)) on three consecutive days. Tumors and spleen were analyzed ex vivo 7 days after the first reovirus injection. (B) Frequency of CD3+ and CD8+ T cells within the total CD45+ immune cell population in KPC3 tumors after reovirus administration. (C) Frequency of interferon gamma (IFNγ)+ cells within the intratumoral and splenic CD8+ T-cell population as measured with intracellular cytokine staining. Single-cell suspensions (n=5/group) were co-cultured with indicated targets. PMA/ionomycin (IO) was used as a positive control, and the irrelevant cell line TC1 was used as target cell line for reovirus infection. (D) Schematic overview of generation of reovirus-specific T-cell bulk. (E, F) Frequency of IFNγ+ cells within reovirus-specific T-cell bulk after co-culture with indicated targets. (G) Schematic overview of peptide prediction and testing. (H) Frequency of IFNγ+ cells within reovirus-specific T-cell bulk after co-culture with individual peptides from positive pools (online supplemental figure S3). (I) Schematic overview of sequence and location of two dominant peptides. (J) Expression of reovirus μ1 protein in reovirus-treated KPC3 tumor. (K) Frequency of IFNγ+ cells within reovirus-specific T-cell bulk after co-culture with titrated amounts of peptide #9 or #34. Peptides were added directly or pre-loaded for 1 hour on LPS-matured D1 dendritic cells. (L) Binding of generated H-2Kb-VSPKYSDL (Reo μ1133-140)-tetramer to naïve splenocytes or reovirus-specific T-cell bulk, as measured with flow cytometry. Data are presented as mean±SEM. Statistical tests used: (B): unpaired t-test between PBS and Reo groups. (C) Ordinary one-way analysis of variance with Dunnett’s post hoc test. Statistical difference was compared with medium control group. Significance level: ****p<0.0001. LPS, lipopolysaccharides; MOI, multiplicity of infection; PBS, phosphate-buffered saline; PMA, phorbol 12-myristate 13-acetate.
Supplemental material
Next, we determined the H-2Kb-specific reovirus-derived peptides that are recognized by reovirus-specific T cells. Predicted epitopes with a length between 8 and 11 amino acids from the sequences of all reovirus T3D segments were divided into 10 pools and tested for their recognition by the reovirus-specific T-cell bulk using intracellular IFNγ staining (figure 1G and online supplemental figure 3). Peptide pools #2, #6, #7, and #9 were predominantly recognized. Therefore, peptides from these four pools were individually tested. Although some peptides such as peptides #29 and #42 induced IFNγ production, especially two length variant peptides #9 (VSPKYSDL) and #34 (VSPKYSDLL) activated a high percentage of T cells, comparable to the response against reovirus-infected target cells (figure 1H). This indicated that these peptides might be recognized by the majority of T cells from the reovirus-specific T-cell bulk. Peptides #9 and #34 are derived from the reovirus outer-capsid protein µ1, a protein that is expressed in reovirus-treated tumors (figure 1I,J). Peptide #9 was found in H-2Kb on the surface of reovirus-infected cells in another study, indicating that this peptide can be processed and presented.22 Subsequently, peptides #9 and #34 were titrated and co-cultured with reovirus-specific T cells, either added directly or in the presence of professional antigen-presenting cells (figure 1K). This showed that the T cells responded to lower concentrations of peptide #9 when compared with peptide #34 and, therefore, peptide #9 (named Reo μ1133-140) was used to generate a reovirus-specific H-2Kb-tetramer. This tetramer did specifically bind to T cells from the reovirus-specific T-cell bulk and not to naïve splenocytes (figure 1L), indicating that this tetramer allows selective staining of reovirus-specific T cells.
Intratumoral delivery of reovirus induces a systemic reovirus-specific T-cell response that is enriched in the tumor
We used this Reo μ1133-140 tetramer (Tm) to interrogate reovirus-specific T-cell immunity in the blood of KPC3 tumor-bearing mice after intratumoral administration of reovirus (figure 2A). We observed a reovirus-specific, Tm+ CD8+ T-cell population 5 days after the first intratumoral injection (figure 2B), the frequency of which peaked at day 7 with percentages ranging from 1.7% to 12.8% Tm+ cells out of all CD8+ T cells. Next, we examined the location and frequency of reovirus-specific T cells in the spleen, tumor-draining lymph node (TDLN), and tumor 7 days after intratumoral reovirus administration. Reovirus-specific T cells were found in small frequencies in the TDLN, in the spleen, and at high frequencies in the tumor (figure 2C,D). A similar distribution of Tm+ CD8+ T cells between the lymphoid organs and tumors was observed in TC1 tumor-bearing mice after intratumoral injection with reovirus (online supplemental figure S4). Tm+ CD8+ T cells were also present in tumors of mice that were injected with Jin-3,12 23 a variant of the reovirus T3D strain with enhanced tropism (online supplemental figure S5). These data suggest that the reovirus epitope is conserved among virus isolates and in different tumor models. Interestingly, the frequencies of Tm+ CD8+ T cells in blood, spleen, and TDLN were dropped drastically on day 12 after intratumoral reovirus administration but were retained at relatively high levels in the tumor (figure 2E).
Supplemental material
Supplemental material
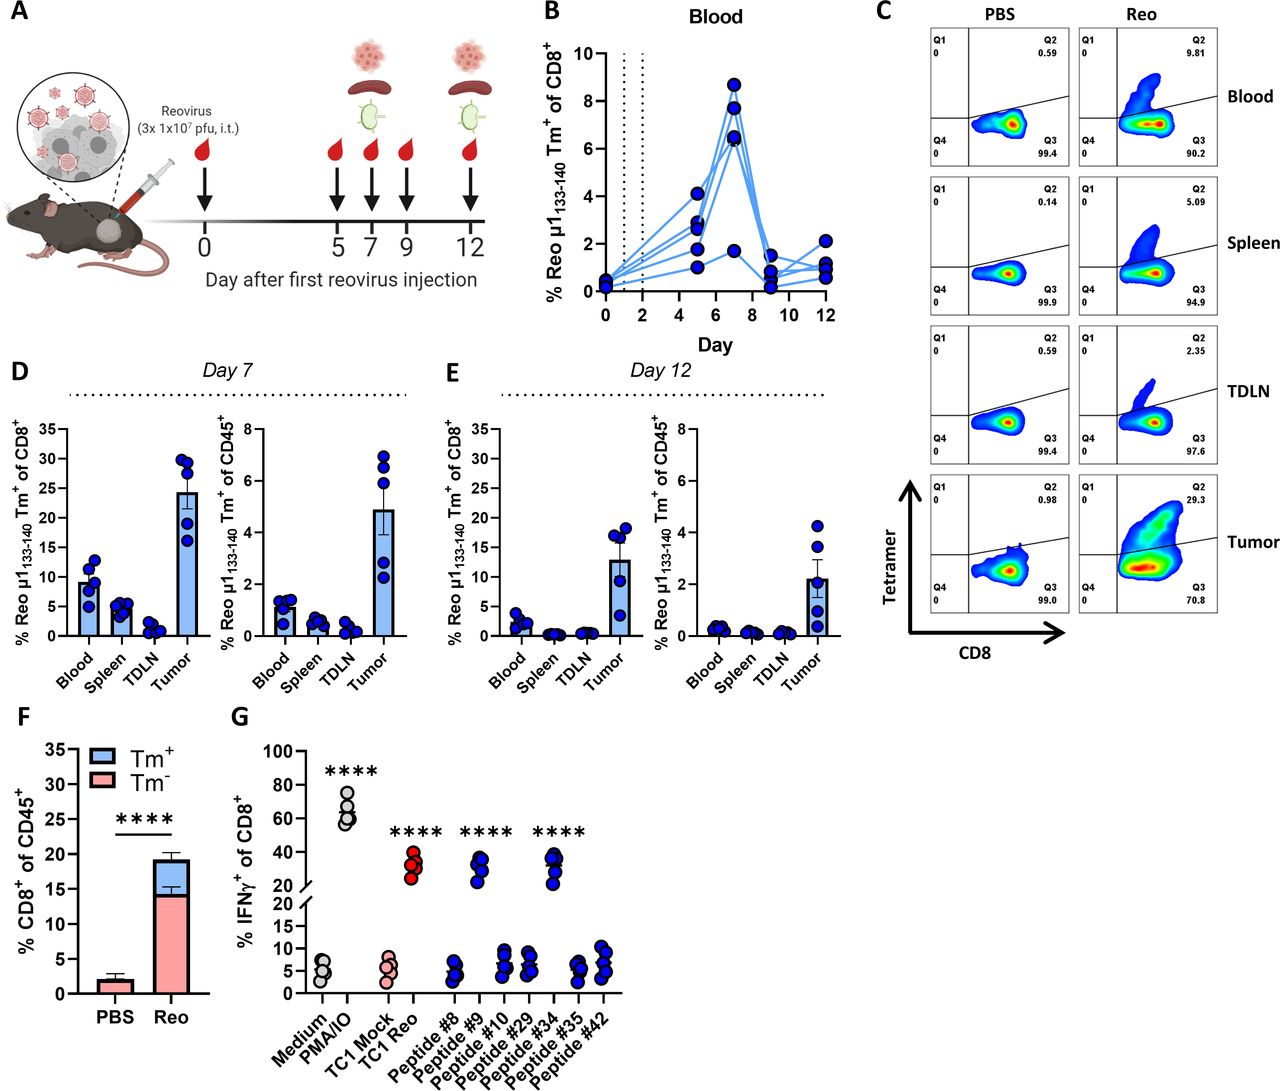
Intratumoral delivery of reovirus induces a systemic reovirus-specific T-cell response that is enriched in the tumor. (A) Design of experiment described in B–D. Mice (n=5/group) with established KPC3 tumors were intratumorally (i.t.) injected with reovirus (Reo; 107 plaque-forming units (pfu)) on three consecutive days. Blood, tumors, spleens, and tumor-draining lymph nodes (TDLN) were analyzed using flow cytometry on indicated days. (B) Frequency of Reo μ1133-140 tetramer (Tm)+ CD8+ T cells in the blood on indicated days after intratumoral reovirus administration. (C) Representative flow cytometry plots of Tm+ CD8+ T cells in indicated organs on day 7 after the first reovirus injection. (D, E) Quantification of Tm+ cells out of CD8+ T cells and total CD45+ immune cell population in indicated organs. (F) Separation of Tm+ cells from Tm- cells within total CD8+ T-cell population of reovirus-treated KPC3 tumors. (G) Frequency of interferon gamma (IFNγ)+ cells within the intratumoral CD8+ T-cell population after co-culture with indicated targets as measured with intracellular cytokine staining. PMA/ionomycin (IO) was used as a positive control. All data are presented as mean±SEM. Statistical tests used: (F): Unpaired t-test between PBS and Reo group. (G) Ordinary one-way analysis of variance with Dunnett’s post hoc test. Statistical difference was compared with medium control group. Significance level: ****p<0.0001. PBS, phosphate-buffered saline; PMA, phorbol 12-myristate 13-acetate.
While a substantial population within CD8+ TILs was Tm+, there was also a Tm- CD8+ T-cell fraction (figure 2F). We already demonstrated that this Tm- fraction was not tumor-specific (figure 1, online supplemental figure S1), suggesting that reovirus administration either led to the influx of bystander T cells or reovirus-specific T cells directed to another reovirus-derived epitope. To test this, TILs from reovirus-treated mice were co-cultured with the other peptides that were also recognized by the splenocyte-derived reovirus-specific T-cell bulk (figure 1H). However, none of these peptides elicited a detectable response in the TILs (figure 2G). This suggests that a large majority of the reovirus-specific T-cell response is directed against an immunodominant CD8+ T-cell epitope, similar to what is observed for lymphocytic choriomeningitis virus (LCMV),24 influenza,25 and oncolytic vesicular stomatitis virus.26
cDC1s are involved in the priming of reovirus-specific T cells
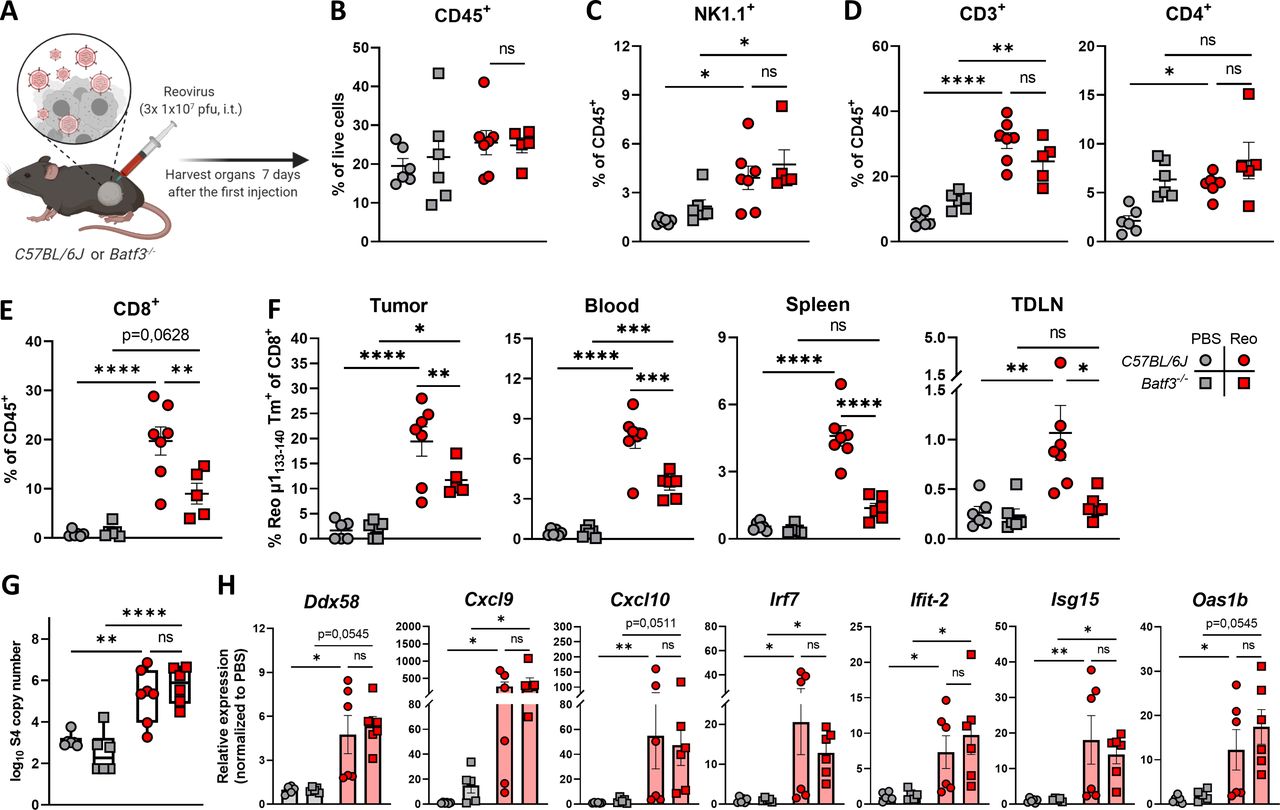
Because intratumoral administration of reovirus also resulted in high numbers of systemic reovirus-specific T cells, we were interested which cell types are involved in the priming of these reovirus-specific T cells. Within the family of antigen-presenting cells, the low-frequent population of basic leucine zipper transcriptional factor ATF-like 3 (Batf3)-driven cDC1s are highly specialized in shaping CD8+ T-cell responses through uptake and processing of exogenous antigens for their presentation in the context of MHC-I molecules, including viral antigens.27–31 Therefore, we studied reovirus-specific immunity in Batf3-/- mice, which contained significantly decreased numbers of cDC1 cells in the spleen and peripheral organs (online supplemental figure S6A, B).31 32 Both wild-type C57BL/6J and Batf3-/- mice were engrafted with a KPC3 tumor, and received intratumoral reovirus injections (figure 3A). In-depth analysis of the tumor immune cell infiltrate revealed that the total CD45+ immune cell population (figure 3B) or the reovirus-induced influx of NK (figure 3C) and CD4+ T cells (figure 3D) were not affected by Batf3-deficiency. However, the influx of total CD8+ T cells was significantly decreased in reovirus-treated Batf3-/- mice (figure 3E). This lower CD8+ T-cell influx probably reflects the impaired systemic priming of reovirus-specific CD8+ T cells, since Batf3-/- mice displayed significantly lower frequencies of reovirus-specific CD8+ T cells in the tumor, as well as in the blood, spleen, and TDLN (figure 3F). The attraction of CD8+ T cells to the tumor by reovirus-induced chemokines was most likely not the limiting factor in Batf3-/- mice, since reovirus replication and the expression of ISGs including the T-cell attracting chemokines Cxcl9 and Cxcl10 were not affected (figure 3G,H). Combined, these data indicate that cDC1s play an important role in the priming of reovirus-specific T cells.
Supplemental material

cDC1s are involved in priming of reovirus-specific T cells. (A) Design of experiment described in (B–H). C57BL/6J or Batf3-/- mice (n=5–7/group) with established KPC3 tumors were intratumorally (i.t.) injected with reovirus (Reo; 107 plaque-forming units (pfu)) on three consecutive days. Blood, tumors, spleens, and tumor-draining lymph nodes (TDLN) were analyzed 7 days after the first reovirus injection using flow cytometry. (B) Total CD45+ immune cell population in KPC3 tumors of C57BL/6J or Batf3-/- mice after reovirus administration. (C) Intratumoral frequency of NK1.1+ cells within CD45+ immune cells. (D) Intratumoral frequency of CD3+ and CD4+ T cells within CD45+ immune cells. (E) Intratumoral frequency of CD8+ T cells within CD45+ immune cells. (F) Frequency of Reo μ1133-140 tetramer (Tm)+ CD8+ T cells in indicated organs after intratumoral reovirus administration. (G) Intratumoral presence of reovirus genomic segment 4 (S4) copy numbers as measured by quantitative reverse transcription PCR (RT-qPCR). (H) Relative expression of various interferon response genes as determined by RT-qPCR. All data are presented as mean±SEM. One tumor of the Batf3-/- Reo group in figures B–E was excluded due to lymph node contamination. Statistical tests used: (B–G) Ordinary one-way analysis of variance with Tukey’s post hoc test. (H) Non-parametric Kruskal-Wallis test with Dunn’s multiple comparisons test. Significance levels: *p<0.05, **p<0.01, ***p<0.001 and ****p<0.0001. cDC1, cross-presenting dendritic cell; ns, not significant; PBS, phosphate-buffered saline.
Tumor-infiltrated reovirus-specific T cells have a pronounced effector phenotype
Next, we assessed the phenotype of Reo μ1133-140-specific CD8+ T cells (Tm+) and investigated whether their phenotype is influenced by their location. Tm+ CD8+ T-cell populations from blood, spleen, TDLN, and tumor were analyzed with OMIQ analysis software that clustered cells based on their expression of CD44, CD62L, KLRG1, CD69, PD1, and Tim3. The tumor-residing Tm+ CD8+ T cells clustered separately from Tm+ CD8+ T cells found in other organs (figure 4A). Tumor-residing Tm+ CD8+ T cells had a higher expression of activation markers CD69, PD1, and Tim3 compared with Tm+ CD8+ T cells in other organs (figure 4B). This suggests that reovirus-specific TILs obtain a unique and distinct phenotype on reaching the tumor, most likely because this is where reovirus is replicating and the reovirus epitope is presented (figure 1J). When the same analysis was applied to tetramer-negative (Tm-) CD8+ T cells (figure 4C), we observed a cluster within this population with a similar phenotype as Tm+ CD8+ T cells, with high expression of CD69, PD1, and Tim3 (figure 4D). These Tm- CD8+ T cells may also be reovirus-specific, but recognize other, yet unidentified reovirus-derived epitopes. The other intratumoral Tm- CD8+ T cell cluster, with low expression of CD69, PD1, and Tim3 overlaps with CD8+ T cells that are found in the blood and the spleen, suggesting that this population encompasses mainly ‘bystander’ CD8+ T cells.
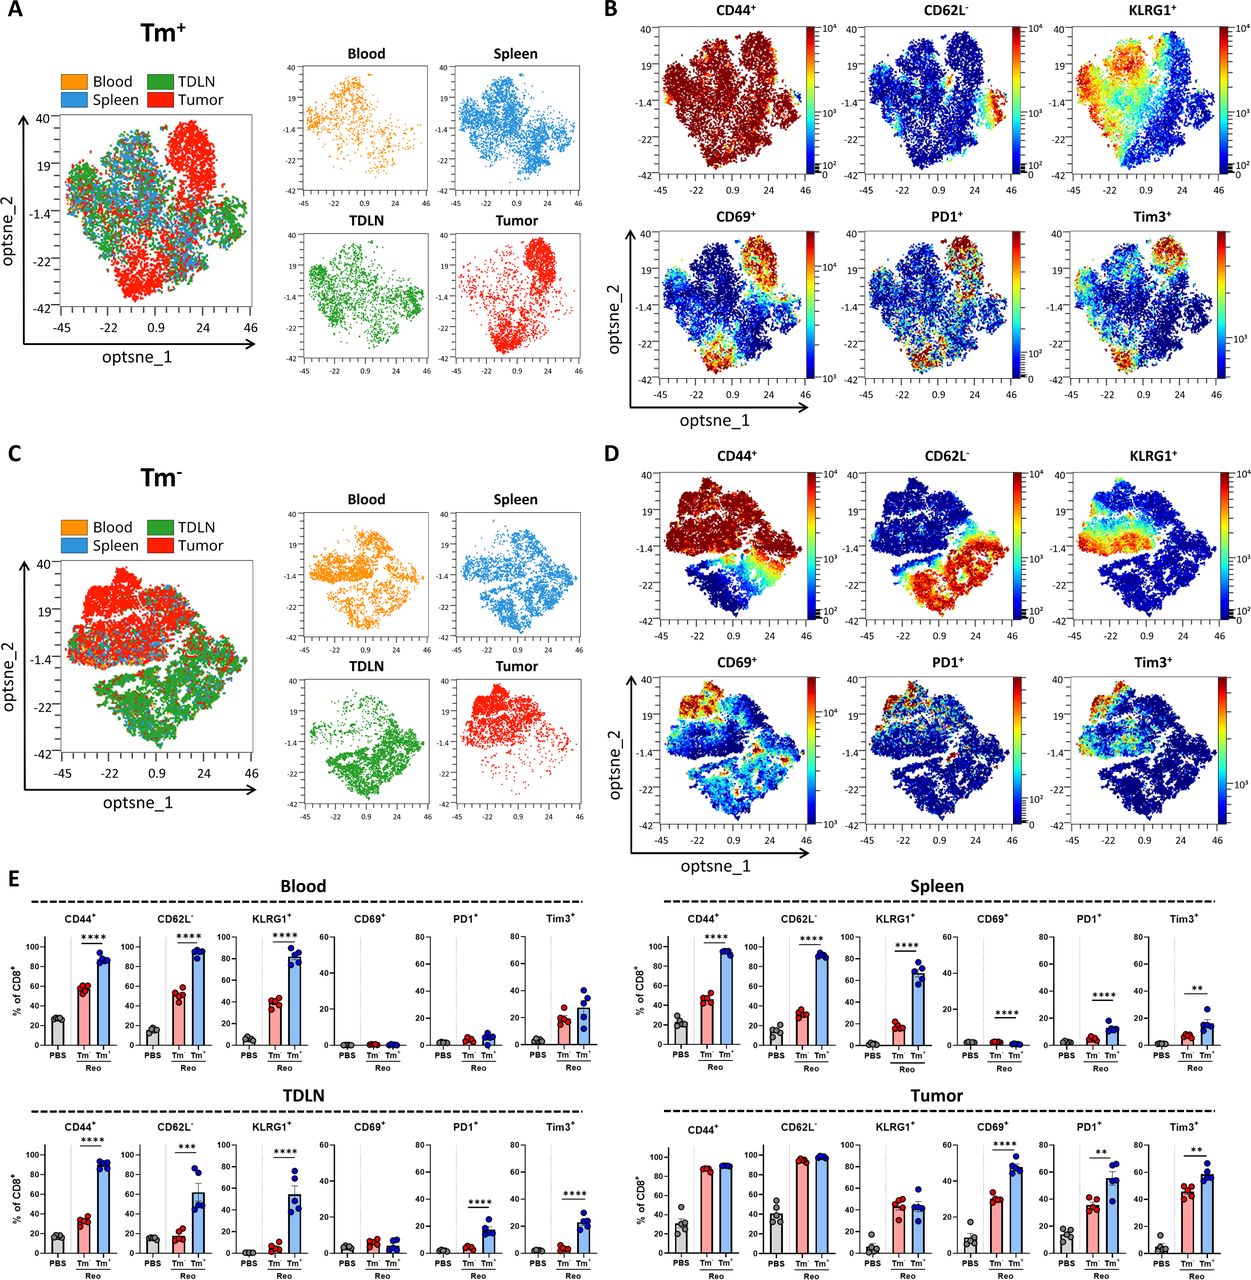
Tumor-infiltrated reovirus-specific T cells have a potent effector phenotype. (A, C) Opt-SNE cluster plots of Reo μ1133-140 tetramer (Tm)+ (A) or Tm- (C) CD8+ T cells from indicated organs. 1000 Tm+ or Tm- CD8+ T cells or the maximum possible number of cells if Tm+ or Tm- CD8+ T cells <1000 were subsampled from individual organs of each mouse. (B, D) Expression intensity profile of activation markers on Tm+ (B) or Tm- (D) CD8+ T cells. (E) Quantification of expression of activation markers on Tm- or Tm+ CD8+ T cells in blood, spleen, tumor-draining lymph node (TDLN), or tumor (n=5/group) of mice treated with Reo, compared with CD8+ T cells from control organs (PBS). Samples were harvested 7 days after the first intratumoral reovirus injection and expression of indicated markers was measured using flow cytometry. All data are presented as mean±SEM. Statistical tests used: (E) Ordinary one-way analysis of variance with Tukey’s post hoc test. Significance levels: **p<0.01, ***p<0.001, ****p<0.0001. PBS, phosphate-buffered saline; Opt-SNE, optimized t-Distributed Stochastic Neighbor Embedding.
Direct comparison and quantification of expression profiles of Tm+ and Tm- CD8+ T cells revealed that in all indicated organs, Tm+ CD8+ T cells have a significantly more activated phenotype compared with Tm- CD8+ T cells (figure 4E). This effector phenotype of Tm+ CD8+ T cells remained stable until 12 days after intratumoral reovirus administration (online supplemental figure S7). Collectively, these data show that reovirus-specific T cells are highly activated and demonstrate a pronounced effector phenotype when present in the tumor, which distinguishes them from ‘bystander’ CD8+ T cells. Targeting these reovirus-specific T cells might therefore be an attractive solution for low-immunogenic tumors where tumor-specific T cells are absent.
Supplemental material
Route of reovirus administration impacts intratumoral influx, but not priming of reovirus-specific T cells
We next investigated whether intravenous administration of reovirus, which is the route applied in the clinic, also recruits antigen-specific T cells to the tumor. Therefore, the frequency and location of reovirus-specific CD8+ T cells were compared between intravenous and intratumoral administration of reovirus (figure 5A). Interestingly, both intravenous, as well as intratumoral reovirus administration in tumor-bearing mice resulted in similar systemic frequencies of reovirus-specific T cells, suggesting that effective systemic priming occurs independently of the reovirus administration route (figure 5B). Surprisingly, equal levels of reovirus-specific T cells were also found in mice without a tumor, demonstrating that active reovirus replication in the tumor is not essential for the priming of a potent systemic reovirus-specific T-cell response (figure 5B).
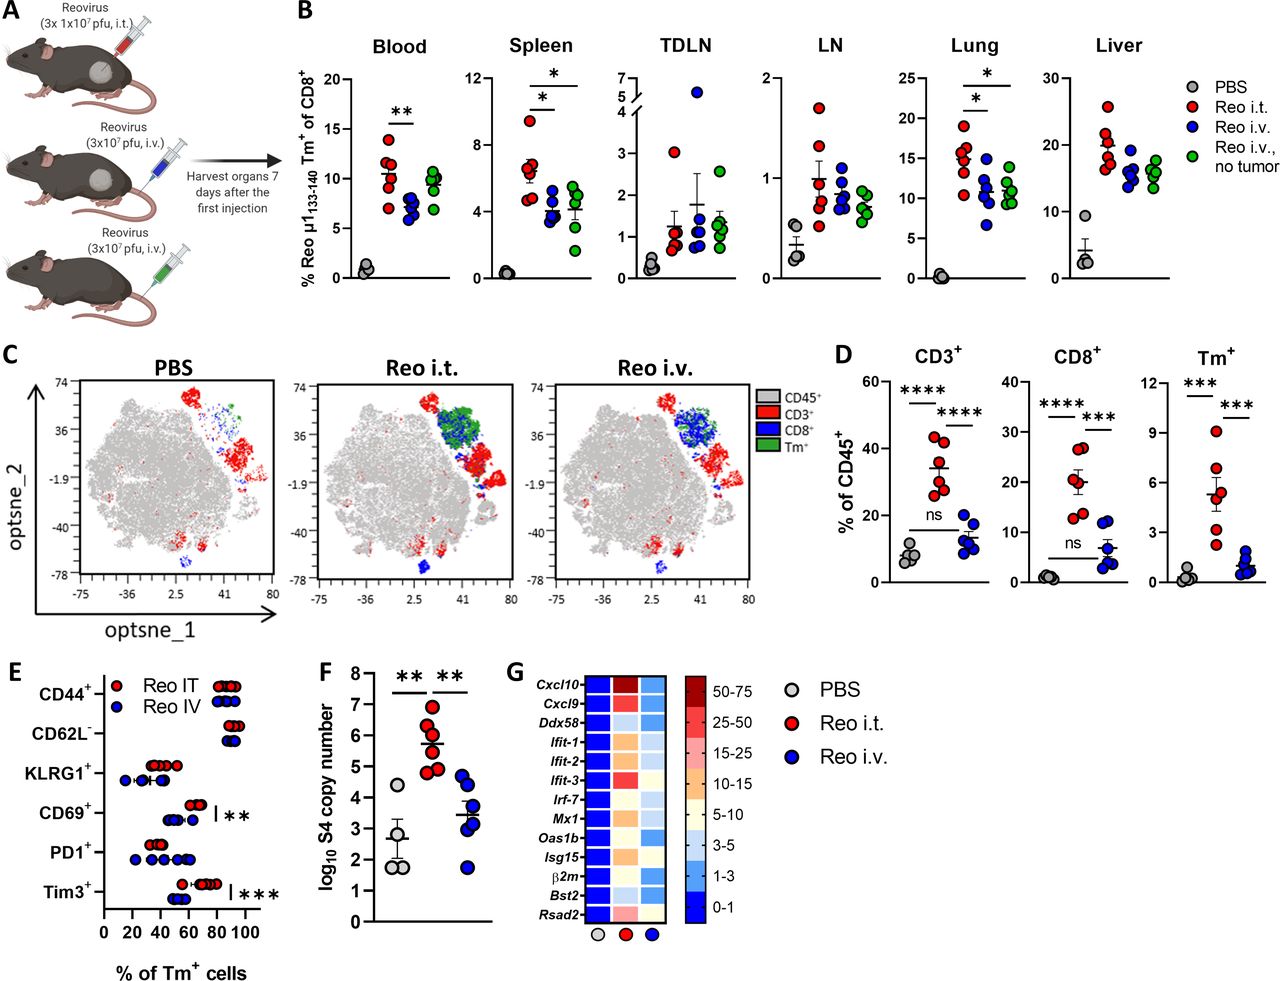
Route of reovirus administration impacts intratumoral influx, but not priming of reovirus-specific T cells. (A) Schematic overview of reovirus (Reo) administration routes, in mice with or without a tumor. (B) Frequency of Reo μ1133-140 Tm+ CD8+ T cells in indicated organs 7 days after reovirus administration. (C) Opt-SNE plots highlighting the intratumoral presence of CD3+, CD8+ and Tm+ T cells after indicated treatments. 10.000 CD45+ cells were subsampled from each sample or the maximum possible number of cells if CD45+ cells <10 000. (D) Intratumoral frequency of CD3+, CD8+ and Tm+ T cells within CD45+ immune cells after indicated treatments. (E) Expression of activation markers on Tm+ CD8+ T cells in the tumor after intratumoral (i.t.) or intravenous (i.v.) reovirus administration. (F) Intratumoral presence of reovirus genomic segment 4 (S4) copy numbers as measured by quantitative reverse transcription PCR (RT-qPCR). (G) Heatmap depicting relative expression of various interferon response genes as determined by RT-qPCR. Data are presented as mean±SEM. Statistical tests used: (B, D, F) Ordinary one-way analysis of variance (ANOVA) with Tukey’s post hoc test. (E) Ordinary two-way ANOVA with Sidak’s post hoc test. Significance levels: *p<0.05, **p<0.01, ***p<0.001 and ****p<0.0001. LN, lymph node; ns, not significant; Opt-SNE, optimized t-Distributed Stochastic Neighbor Embedding; PBS, phosphate-buffered saline; TDLN, tumor-draining LN.
Although systemic priming of reovirus-specific CD8+ T cells was equally effective, we observed that the reovirus-induced influx of (reovirus-specific) CD8+ T cells was severely impaired in tumors of mice that received reovirus intravenously, although a small population of T cells could still be observed (figure 5C,D). Additionally, while the expression levels of CD44, CD62L, KLRG1, and PD1 on the few intratumoral Tm+ CD8+ T cells after intravenous reovirus administration were relatively similar to the Tm+ CD8+ T cells that were present after intratumoral reovirus administration, their expression of CD69 and Tim3 was significantly lower (figure 5E). The number of reovirus genomic copies (figure 5F) and the reovirus-induced expression of ISGs (figure 5G) in the tumor was also significantly lower in mice that received intravenous administration of reovirus, suggesting that T-cell influx is connected with either reovirus replication or reovirus-induced expression of ISGs or a combination of both. In conclusion, these data indicate that systemic frequency and location of reovirus-specific CD8+ T cells are not influenced by the route of reovirus administration, but that intratumoral reovirus administration is preferred to induce higher densities of these reovirus-specific CD8+ T cells in the tumor.
Reovirus-specific T cells are amenable to peptide-mediated reactivation
We next asked if the limited influx of reovirus-specific T cells in the tumor on intravenous reovirus administration could be enhanced by local repeated T-cell receptor (TCR)-triggering. To uncouple reactivation and expansion of reovirus-specific T cells from other reovirus-mediated effects, we intratumorally injected the reovirus-derived Reo μ1133-140 peptide (VSPKYSDL) instead of replicating reovirus (figure 6A). Injection of Reo μ1133-140 peptide in the tumor after intravenous reovirus administration significantly enhanced the percentage of intratumoral (reovirus-specific) T cells similar to that observed when reovirus was intratumorally administered (figure 6B). Within the intratumoral and splenic CD8+ T-cell populations, the frequency of reovirus-specific T cells was significantly increased when Reo μ1133-140 peptide was injected, suggesting that reactivation of reovirus-specific T cells led to specific expansion of this population (figure 6C). The additional administration of peptide Reo μ1133-140 also specifically enhanced the effector phenotype of reovirus-specific T cells, as demonstrated by high CD44, PD1, and Tim3 expression in the tumor and the spleen (figure 6D), implying that T cells induced by intravenously applied reovirus can be turned into fully activated effector cells with a phenotype comparable to those generated via intratumoral application.
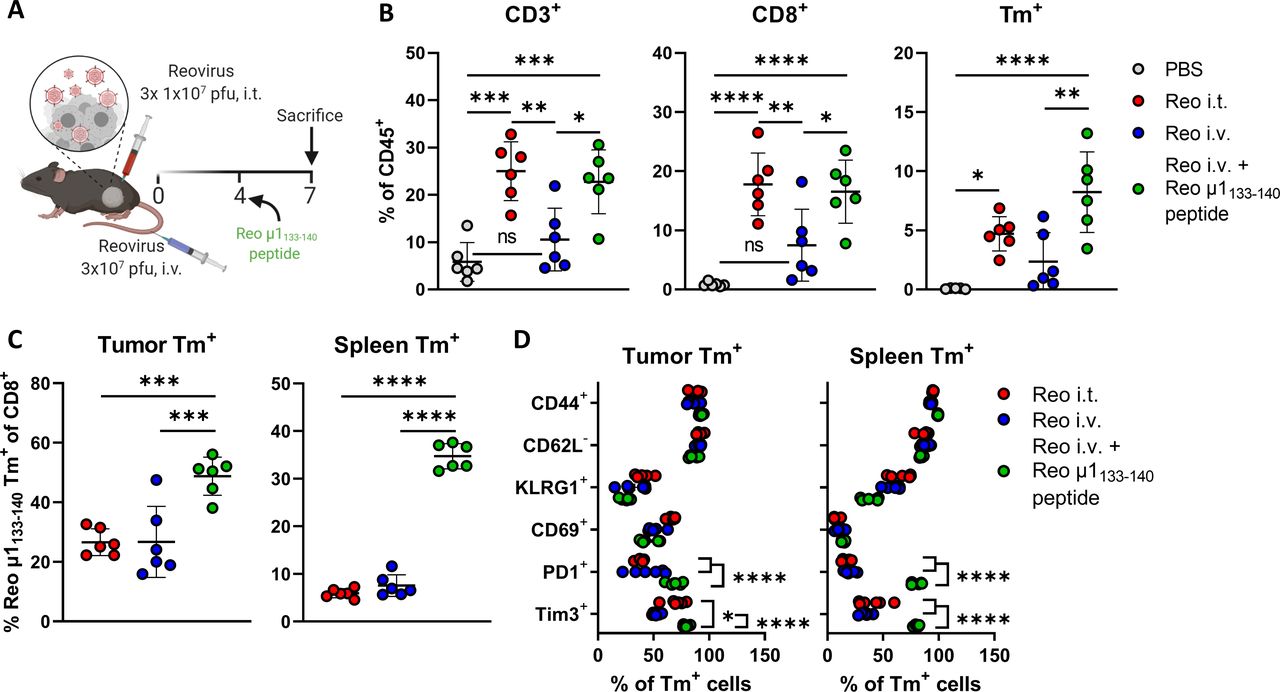
Reovirus-specific T cells are amenable to peptide-mediated reactivation. (A) Design of experiment described in (B–E). Mice (n=6/group) with established KPC3 tumors were intratumorally (i.t.) injected with reovirus (Reo; 107 plaque-forming units (pfu)) on days 0, 1, and 2, or intravenously (i.v.) injected on day 0 with 3×10⁷ pfu of reovirus. One group of mice that received reovirus i.v. additionally received an i.t. injection with the Reo μ1133-140 peptide (50 µg) on day 4, after which mice were sacrificed on day 7 for ex vivo analysis. (B) Intratumoral frequency of CD3+, CD8+ and Tm+ T cells within CD45+ population. (C) Frequency of Reo μ1133-140 Tm+ CD8+ T cells out of CD8+ T-cell population in tumor and spleen. (D) Expression of activation markers on Tm+ CD8+ T cells in the tumor and spleen after indicated treatments. All data are presented as mean±SEM. Statistical tests used: (B–C): Ordinary one-way analysis of variance (ANOVA) with Tukey’s post hoc test. (D) Ordinary two-way ANOVA with Tukey’s post hoc test. Significance levels: *p<0.05, **p<0.01, ***p<0.001 and ****p<0.0001. PBS, phosphate-buffered saline.
Exploiting vaccine-induced reovirus-specific T-cell immunity enhances the anticancer efficacy of reovirus therapy
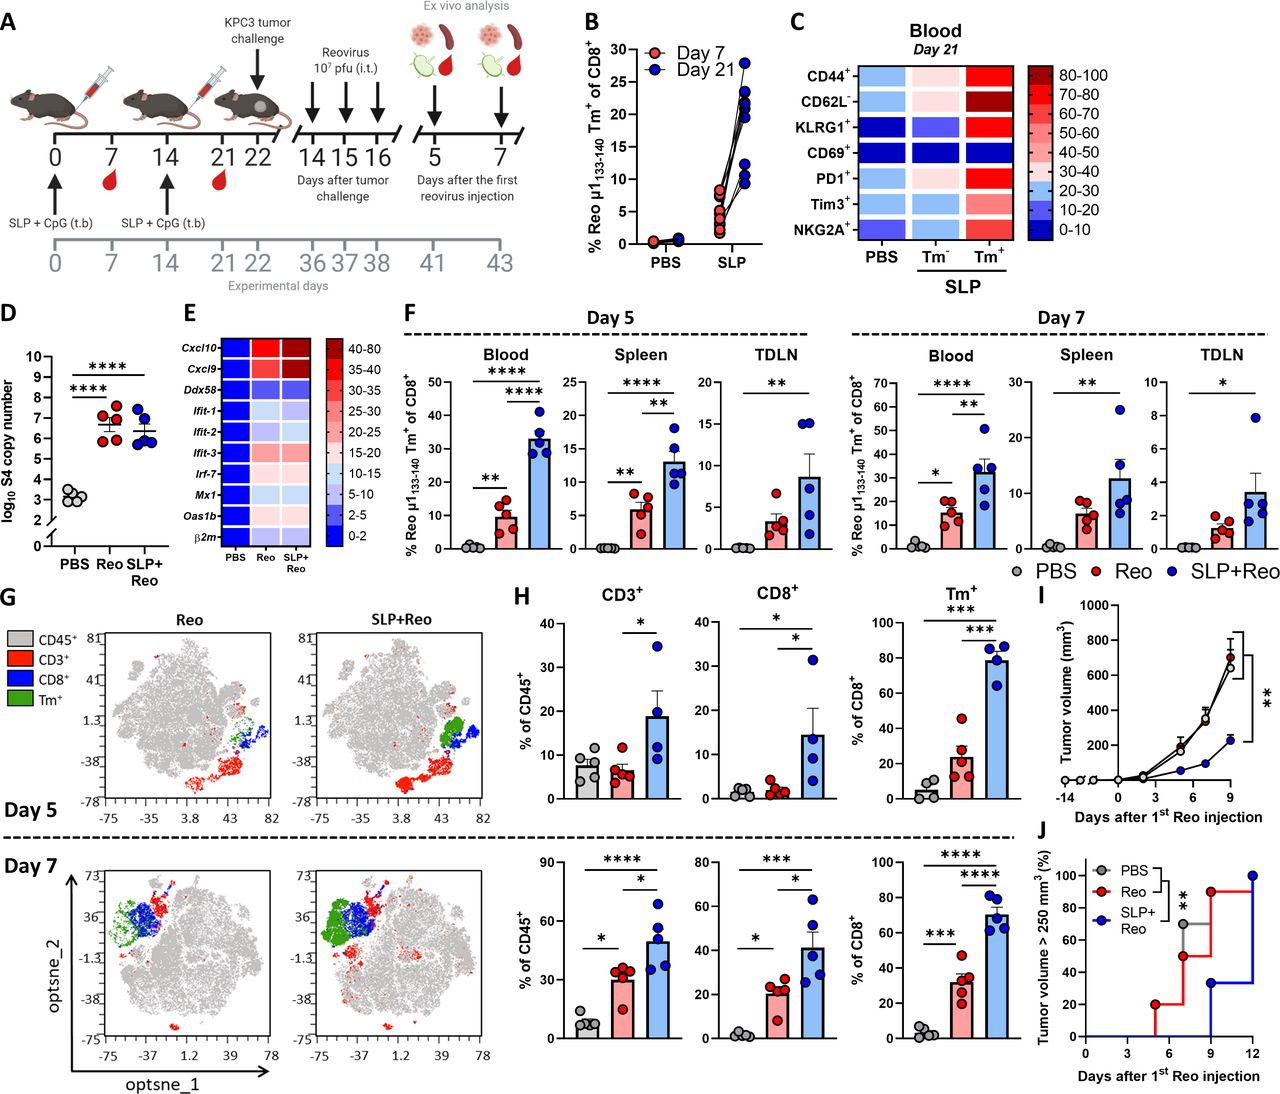
We showed that reovirus-specific T cells are potent effector cells that are enriched in the tumor, which makes them very attractive to use as anticancer effector cells, especially when tumor-specific T cells are unavailable. We hypothesized that these reovirus-specific T cells, when available in sufficiently high numbers, would be able to kill virus-infected cells in the tumor microenvironment that display viral epitopes on their cell surface. To optimally stimulate the frequency of this reovirus-specific T-cell population, we developed a vaccination strategy to install a pre-existing pool of circulating reovirus-specific T cells before tumor inoculation. We designed a synthetic long peptide (SLP) that was derived from the natural sequence of the reovirus µ1 protein and contains the immunodominant Reo μ1133-140 epitope of reovirus. In vitro, the SLP was processed and presented efficiently by murine dendritic D1 cells and was able to induce activation of T cells from the reovirus-specific T-cell bulk (online supplemental figure S8). Next, we vaccinated naïve mice with the SLP, using a prime-boost schedule (figure 7A) that induced high frequencies of Tm+ CD8+ T cells in the circulation (figure 7B). These circulating Tm+ CD8+ T cells displayed a potent effector phenotype as evidenced by their expression of activation markers CD44, KLRG1, PD1, and Tim3 (figure 7C).
Supplemental material

Exploiting vaccine-induced reovirus-specific T-cell immunity enhances the anticancer efficacy of reovirus therapy. (A) Design of experiment described in (B–H). Naïve mice (n=10/group) were vaccinated on days 0 and 14 by injecting 100 µg SLP together with 20 µg CpG in the tailbase region. On day 22, KPC3 tumor challenge was performed. Mice with established KPC3 tumors were intratumorally (i.t.) injected with reovirus (Reo; 107 plaque-forming units (pfu)) on days 14, 15, and 16 after tumor challenge. Mice were sacrificed on days 5 (n=5/group) or 7 (n=5/group) after the first i.t. reovirus injection for ex vivo analysis. (B) Frequency of Reo μ1133-140 Tm+ cells within CD8+ T cells 7 days after priming vaccination and 7 days after boosting vaccination. (C) Heatmap showing activation profile of Tm+ CD8+ T cells in blood on day 21. (D) Intratumoral presence of reovirus genomic segment 4 (S4) copy numbers on day 5 after the first Reo injection, as measured by quantitative reverse transcription PCR (RT-qPCR). (E) Heatmap depicting relative expression of various interferon response genes on day 5, as determined by RT-qPCR. (F) Frequency of Tm+ cells within CD8+ T cells in blood, spleen, and tumor-draining lymph node (TDLN), 5 and 7 days after reovirus treatment. (G) Opt-SNE plots highlighting the intratumoral presence of CD3+, CD8+ and Tm+ T cells after indicated treatments, on days 5 and 7. 10 000 CD45+ cells were subsampled from each sample or the maximum possible number of cells if CD45+ cells <10 000. (H) Intratumoral frequency of CD3+, CD8+ and Tm+ T cells within CD45+ immune cells on days 5 and 7. (I) Average growth curves of mice (n=9–10/group) receiving indicated treatments. (J) Kaplan-Meier graph showing accumulation of animals reaching tumor size >250 mm3. All data are presented as mean±SEM. One tumor of SLP+Reo day 5 group in figures G and H was excluded due to lymph node contamination. One mouse of SLP+Reo group in figures I and J was excluded due to unsuccessful tumor engraftment. Statistical tests used: (D, F, H): Ordinary one-way analysis of variance (ANOVA) with Tukey’s post hoc test. (I) Ordinary two-way ANOVA with Tukey’s post hoc test. (J) Mantel-Cox Log-rank test. Significance levels: *p<0.05, **p<0.01, ***p<0.001 and ****p<0.0001. Opt-SNE, optimized t-Distributed Stochastic Neighbor Embedding; PBS, phosphate-buffered saline; SLP, synthetic long peptide.
Vaccinated mice were subsequently implanted with a KPC3 tumor and palpable tumors were injected intratumorally on three consecutive days with reovirus. Notably, the pre-existing presence of reovirus-specific T cells did not affect reovirus replication (figure 7D) or reovirus-induced expression of ISGs in the tumor (figure 7E). We next assessed frequencies of reovirus-specific CD8+ T cells on days 5 and 7 after the first intratumoral reovirus injection. The presence of a vaccine-induced, reovirus-specific T-cell response significantly increased the frequency of reovirus-specific T cells in the blood, spleen, and TDLN upon intratumoral reovirus administration (figure 7F). As expected, boosting of the pre-existing reovirus-specific T-cell response by intratumoral reovirus administration (SLP+Reo) mediated an earlier and higher intratumoral influx of CD8+ T cells than when this response had to be kick-started by intratumoral reovirus (Reo) administration only (figure 7G,H). In particular, the specificity of the intratumoral CD8+ T-cell population was highly enriched for reovirus when mice were first primed by SLP vaccination. Around 75% of intratumoral CD8+ T cells were reovirus-specific in the SLP+Reo group compared to an average of 25% in the Reo only group (figure 7G,H).
This also resulted in a stronger antitumor effect. While intratumoral reovirus administration monotherapy does not affect tumor growth at the used dosage, a significant delay in tumor growth was observed when mice were vaccinated before intratumoral reovirus treatment, resulting in smaller tumors at later time points (figure 7I,J). The enhanced antitumor effect was mediated by CD8+ T cells since the SLP+Reo-induced antitumor effect was significantly decreased when CD8+ T cells were depleted after vaccination (online supplemental figure S9A-D). Within the CD8+ T-cell population, the reovirus-specific T cells were specifically responsible, since vaccination with an irrelevant SLP vaccine targeting the HPV16 E749-57 epitope did not enhance the antitumor effect of Reo monotherapy (online supplemental figure S10A-C).
Supplemental material
Supplemental material
Although SLP+Reo delayed tumor outgrowth, tumors eventually reached the experimental endpoint. When we assessed these end-stage tumors for the presence of T cells, we observed that there was still a large population of reovirus-specific T cells present (online supplemental figure S11A, B). We investigated whether these T cells could be reinvigorated by combining SLP+Reo therapy with checkpoint blockade (αPD-L1), to possibly prolong the delay in tumor growth. However, the addition of αPD-L1 did not enhance the efficacy of SLP+Reo therapy (online supplemental figure S12A-C). We next investigated whether we could enhance the antitumor effect of SLP+Reo therapy by additional reovirus administrations. Surprisingly, the continued intratumoral administration of reovirus also did not improve the antitumor effect of SLP+Reo therapy (online supplemental figure S13A-C). These observations suggest that there is a maximum level of control that reovirus-specific T cells can exert on the growth of the tumor.
Supplemental material
Supplemental material
Supplemental material
Therapeutic boosting of a reovirus-induced, pre-existing T-cell pool delays tumor growth
Lastly, we investigated whether SLP+Reo therapy can also be applied in a more therapeutically relevant setting. Since a large majority of the human population has encountered reovirus before, most patients with cancer will have circulating reovirus-specific memory T cells. We investigated whether this pre-existing reovirus-induced T-cell pool might also be exploited to improve the efficacy of reovirus therapy. Additionally, we investigated whether the SLP vaccine is still effective when applied in mice that already have a tumor. We immunized mice with live reovirus to induce pre-existing immunity, and subsequently boosted the immunization-induced reovirus-specific T-cell response with the SLP, either before (BT—before tumor) or after (AT—after tumor) tumor inoculation (figure 8A). In both immunized groups, reovirus-specific T-cell responses in the blood could be boosted to similar levels compared with naïve mice that were vaccinated according to the prime-boost schedule, even when mice received the SLP after tumor inoculation, thus in a therapeutic setting (figure 8B). No toxicity by means of changes in body weight could be observed (online supplemental figure S14), but tumor growth was significantly delayed in both immunized groups. This suggests that boosting the reovirus-specific T-cell response with an SLP in humans with pre-existing immunity might also be safe and effective to enhance the efficacy of reovirus monotherapy (figure 8C,D).
Supplemental material

Therapeutic boosting of a reovirus-induced, pre-existing T-cell pool delays tumor growth. (A) Design of experiment described in (B–D). Naïve mice (n=10/group) were immunized on day −14 by injecting reovirus (Reo; 107 plaque-forming units (pfu)) intravenously (i.v.). Vaccination occurred on days 0 and/or 14 by injecting 100 µg SLP together with 20 µg CpG in the tailbase region. On day 22, KPC3 tumor challenge was performed. One group was vaccinated with the SLP on day seven after the tumor challenge. Mice with established KPC3 tumors were intratumorally (i.t.) injected with reovirus (107 plaque-forming units (pfu)) on days 12, 13, and 14 after tumor challenge. (B) Frequency of Reo μ1133-140 Tm+ cells within CD8+ T cells after immunization or vaccination. (C) Average growth curves of mice (n=10/group) receiving indicated treatments. (D) Kaplan-Meier graph showing accumulation of animals reaching tumor size >250 mm3. All data are presented as mean±SEM. Statistical tests used: (C): Ordinary two-way analysis of variance with Tukey’s post hoc test. (D): Mantel-Cox log-rank test. Significance levels: *p<0.05, **p<0.01, ***p<0.001. ns, not significant; PBS, phosphate-buffered saline; SLP, synthetic long peptide.
Taken together, we showed proof-of-concept data that high intratumoral frequencies of pre-induced reovirus-specific T cells can be exploited to effectively impact tumor growth upon reovirus treatment, thereby circumventing the need for tumor-specific T cells. These data advocate for the use of vaccines aimed at inducing strong OV-specific T-cell responses to enhance the efficacy of OV monotherapy in tumors with low immunogenicity.
Discussion
The mammalian reovirus T3D, clinically known as Pelareorep, is one of the leading OVs under clinical evaluation.33 As monotherapy, reovirus has undergone clinical evaluation in trials across a range of indications, most of which have employed intravenous administration of reovirus. As recently reviewed by Müller et al, the clinical efficacy of reovirus as monotherapy has been modest.33 Current clinical attempts are therefore focused on combinational approaches, involving, for example, chemotherapeutic or immunotherapeutic strategies.2 34 Indeed, we and others recently demonstrated that reovirus has high potential as a strategy to enhance the efficacy of immunotherapy by recruiting CD8+ T cells to the tumor.11 35 36 Whereas stimulation of intratumoral T-cell influx represents an important pillar in the immunotherapeutic efficacy of reovirus, the dynamics of T-cell responses during reovirus therapy are not completely understood. The identification of the immunodominant CD8+ T-cell epitope of reovirus enabled us to track reovirus-specific T cells and study the dynamics of this response during OV therapy. Induction of pre-existing T-cell immunity by means of vaccination did, surprisingly, not hamper viral replication, but on the contrary, empowered reovirus therapy against immunologically cold tumors.
One important consideration in the clinical use of OVs is the choice of the administration route, which is mostly focused on the efficient delivery of the OV itself to the tumor site and less on the OV-induced immune response.37 38 Interestingly, we observed that priming of reovirus-specific T cells does not depend on a specific route of administration. In fact, replication at a tumor site is not even required to mount an efficient systemic reovirus-specific T-cell response. However, intratumoral administration is required to induce an efficient influx of (reovirus-specific) CD8+ T cells into the tumor. Interestingly, we found that injection of cognate peptide in the tumor was able to reactivate reovirus-specific T cells, as was previously shown for intratumoral OT-I cells recognizing the SIINFEKL peptide,39 thereby increasing the density and activation of virus-specific T-cell density in the TME.
Reovirus-specific T cells can be found throughout the body after both systemic and local reovirus administration, but only express high levels of CD69, PD1, and Tim3 after intratumorally applied reovirus or peptide. Increased cell-surface CD69 can be driven by either TCR stimulation or cytokines such as IFNα and IFNβ,40 which are both provided by the presence of replicating reovirus in the tumor. PD1 is rapidly induced on T cells following TCR-mediated activation and this expression decreases with antigen clearance.41 Tim3 is identified as being selectively expressed on IFNγ–secreting CD4 and CD8 T cells, and expression is induced after repeated TCR-stimulation.42 43 Given that all three surface markers are associated with previous antigen exposure, co-expression of these markers suggests tumor-residing reovirus-specific T cells have encountered their cognate antigen in the TME during active reovirus infection and thus recognize reovirus-infected tumor cells.
Although reovirus-specific T cells were enriched in the tumor, they did not make up the total TIL population. Since other TILs displayed similar phenotypic characteristics as reovirus-specific T cells, we hypothesize that those TILs might also be reovirus-specific but simply recognize other, yet unidentified epitopes. Identifying these epitopes and their inclusion in the vaccination strategy might further enhance SLP+Reo therapy efficacy. Tetramer-negative TILs with a much less pronounced effector phenotype might be ‘bystander’ T cells that are attracted to the tumor by the reovirus-induced release of chemokines and cytokines. It is not likely that tetramer-negative TILs are tumor-specific since the administration of reovirus in both KPC3 and TC1 tumors did not induce any reactivity toward autologous tumor cells ex vivo. Whereas a body of literature has shown that several OVs, including reovirus, can induce tumor-specific T-cell responses,44–48 this seems to be restricted to immunogenic models with high mutational load or expression of tumor-associated or artificial antigens. Therefore, the exploitation of virus-specific T cells may represent a solution for targeting low-immunogenic tumors to which tumor-specific responses are out of the question.
Recent evidence from murine and human studies has shown that previously established antiviral T cells can also be found in tumors.39 49–52 Taking advantage of this pre-existing, pathogen-specific immune cell population is an exciting new approach in the cancer immunotherapy field. This is particularly attractive in the setting of an OV that selectively replicates in tumor cells, thereby specifically directing the virus-specific T cells to the infected tumor cells.
An important consideration when employing virus-specific T cells as anticancer effectors is that tumor cell-killing relies on the expression of the virus-derived epitopes on tumor cells. The continuous expression of viral epitopes is likely restricted by antiviral immunity (possibly by the emergence of neutralizing antibodies or innate immune responses), thereby installing a maximum level of tumor cell-killing that can be achieved by the virus-specific T cells before the virus is cleared. The emergence of antiviral immunity might also explain why continued intratumoral reovirus administration or the addition of checkpoint blockade does not improve the antitumor effect of SLP+Reo therapy. More insight into the various layers of antiviral immunity that might limit viral replication and epitope presentation in the tumor is necessary to enhance the therapeutic window of this strategy. Furthermore, it would also be interesting to study whether an initial wave of tumor cell-killing by virus-specific T cells can induce a second wave of tumor-specific T cells, so called epitope spreading.
However, exploiting antiviral CD8+ T cells also has multiple advantages over utilizing tumor-specific T cells. Antiviral T cells often display strong effector and memory responses and lack exhaustion markers including expression of CD39, which is associated with chronic antigen exposure in the tumor.50 Since antiviral T cells are generated against ‘non-self’ epitopes, there is no central tolerance and minimal auto-reactivity is expected. Various approaches have already demonstrated that pathogen-specific T cells can be repurposed to attack tumors.39 For instance, antibody-peptide epitope conjugates were used to redirect cytomegalovirus (CMV)-specific CD8+ T cells to kill tumor cells in vitro and in NOD/SCID mice that were injected with expanded CMV-specific CD8+ T cells and were engrafted with orthotopic human breast cancer tumors or hepatocellular carcinomas.53 Also, repurposing of SARS-CoV-2-specific CD8+ T-cell responses, present in a large population of COVID-19 resolvers, has been suggested as an anticancer immunotherapy approach.54
Our approach uniquely involves the use of a non-pathogenic virus that has previously been tested in patients as an oncolytic agent with excellent safety records.33 Moreover, using an OV adds tumor-specificity to the system due to specific replication in malignant cells, thereby converting the tumor cells into target cells for the previously established virus-specific T cells. Therefore, inducing and subsequently exploiting an OV-specific CD8+ T-cell response might be considered a more generalized immunotherapy approach to combat cancer that does not require the presence of tumor-specific CD8+ T cells.
Data availability statement
Data are available on reasonable request. All data relevant to the study are included in the article or uploaded as online supplemental information.
Ethics statements
Patient consent for publication
Ethics approval
All mouse studies were individually prepared, reviewed, approved, and registered by the institutional Animal Welfare Body of Leiden University Medical Center and carried out under project license AVD1160020187004, issued by the competent authority on animal experiments in the Netherland (named CCD). Experiments were performed following the Dutch Act on Animal Experimentation and EU Directive 2010/63/EU (“On the protection of animals used for scientific purposes”) at the animal facility of the Leiden University Medical Center (LUMC), The Netherlands.
Acknowledgments
The authors thank Kees Franken en Robert Cordfunke from the proteinfacility of LUMC for the generation of the Reo μ1133-140 tetramer to detect reovirus-specific T cells. The authors thank Vera Kemp (Department of Cell and Chemical Biology) for providing reovirus variant Jin-3 and Marit van Elsas for providing the HPV E7-derived SLP and HPV E749-57 tetramer. The authors gratefully acknowledge the operators of the Flow cytometry Core Facility (FCF) of the LUMC and the Animal Facility of the LUMC for their excellent support and care of the animals, respectively. The hybridoma 10F6 (reovirus μ1), developed by T. S. Dermody from the University of Pittsburgh School of Medicine, was obtained from the Developmental Studies Hybridoma Bank, created by the NICHD of the NIH and maintained at The University of Iowa, Department of Biology, Iowa City, IA 52242. Figures depicting experimental designs were created with BioRender.com.
References
Footnotes
Contributors Conceptualization, CG and NvM; methodology, CG, PK, JJCvST, DJMvdW, RCH, TvH, NvM; formal analysis, CG; investigation, CG, PK, JJCvST, CL, LG, MS; resources, DJMvdW, RCH, JMMdH; writing-original draft, CG, NvM; writing-review and editing, all authors; visualization, CG; supervision, SHvdB, TvH, NvM; funding acquisition, SHvdB, TvH, NvM; guarantor, NvM. All authors approved the final version of the manuscript.
Funding This work was financially supported by the Dutch Cancer Society Bas Mulder Award 11056 (to NvM), a PhD fellowship from Leiden University Medical Center (to CG), and the Support Casper campaign by the Dutch foundation ‘Stichting Overleven met Alvleesklierkanker’ (supportcasper.nl) project number SOAK 17.04 (to SHvdB, TvH, and NvM).
Competing interests CG, NvM, and TvH filed a patent (P335646NL) regarding the research described in this manuscript. All other authors declare no competing interests.
Provenance and peer review Not commissioned; externally peer reviewed.
Supplemental material This content has been supplied by the author(s). It has not been vetted by BMJ Publishing Group Limited (BMJ) and may not have been peer-reviewed. Any opinions or recommendations discussed are solely those of the author(s) and are not endorsed by BMJ. BMJ disclaims all liability and responsibility arising from any reliance placed on the content. Where the content includes any translated material, BMJ does not warrant the accuracy and reliability of the translations (including but not limited to local regulations, clinical guidelines, terminology, drug names and drug dosages), and is not responsible for any error and/or omissions arising from translation and adaptation or otherwise.