Article Text

Abstract
Background Inhibiting programmed cell death protein 1 (PD-1) or PD-ligand 1 (PD-L1) has shown exciting clinical outcomes in diverse human cancers. So far, only monoclonal antibodies are approved as PD-1/PD-L1 inhibitors. While significant clinical outcomes are observed on patients who respond to these therapeutics, a large proportion of the patients do not benefit from the currently available immune checkpoint inhibitors, which strongly emphasize the importance of developing new immunotherapeutic agents.
Methods In this study, we followed a transdisciplinary approach to discover novel small molecules that can modulate PD-1/PD-L1 interaction. To that end, we employed in silico analyses combined with in vitro, ex vivo, and in vivo experimental studies to assess the ability of novel compounds to modulate PD-1/PD-L1 interaction and enhance T-cell function.
Results Accordingly, in this study we report the identification of novel small molecules, which like anti-PD-L1/PD-1 antibodies, can stimulate human adaptive immune responses. Unlike these biological compounds, our newly-identified small molecules enabled an extensive infiltration of T lymphocytes into three-dimensional solid tumor models, and the recruitment of cytotoxic T lymphocytes to the tumor microenvironment in vivo, unveiling a unique potential to transform cancer immunotherapy.
Conclusions We identified a new promising family of small-molecule candidates that regulate the PD-L1/PD-1 signaling pathway, promoting an extensive infiltration of effector CD8 T cells to the tumor microenvironment.
- IMMUNOLOGY
- Tumor Escape
- Lymphocytes, Tumor-Infiltrating
- Lymphocyte Activation
- Programmed Cell Death 1 Receptor
Data availability statement
All data relevant to the study are included in the article or uploaded as supplementary information.
This is an open access article distributed in accordance with the Creative Commons Attribution Non Commercial (CC BY-NC 4.0) license, which permits others to distribute, remix, adapt, build upon this work non-commercially, and license their derivative works on different terms, provided the original work is properly cited, appropriate credit is given, any changes made indicated, and the use is non-commercial. See http://creativecommons.org/licenses/by-nc/4.0/.
Statistics from Altmetric.com
- IMMUNOLOGY
- Tumor Escape
- Lymphocytes, Tumor-Infiltrating
- Lymphocyte Activation
- Programmed Cell Death 1 Receptor
WHAT IS ALREADY KNOWN ON THIS TOPIC
The immune checkpoint therapy revolutionized cancer treatment. However, additional efforts should be made to improve the response rates to these therapies.
WHAT THIS STUDY ADDS
Programmed cell death protein 1/PD-ligand 1 (PD-1/PD-L1) small-molecule inhibitors increase and activate tumor-infiltrating lymphocytes, controlling the growth of solid tumors.
HOW THIS STUDY MIGHT AFFECT RESEARCH, PRACTICE OR POLICY
Our findings unveil the promising application of small molecules as a new class of PD-L1/PD-1 signaling pathway regulators.
Introduction
Cancer immunotherapy, defined as the targeting or use of immune system components to kill tumor cells, has revolutionized the treatment of advanced-stage malignancies. Among several immunotherapeutic approaches that have been tested in the last decade, immune checkpoint blockade is now a clinical reality with remarkable results.1 2
Specifically, the inhibition of programmed cell death ligand 1 (PD-L1) or programmed cell death protein 1 (PD-1) has prevented or reversed exhausted T cells, thus enhancing antitumor T-cell responses.3–5 In fact, immune checkpoint blockade targeting the PD-1 axis has become one of the most effective therapies for diverse cancers.6 7 Thus far, only antibody-based PD-L1 or PD-1 inhibitors were approved.8 While tremendous clinical benefits are observed on patients who respond to monoclonal antibodies (mAb), the lack of understanding of the mechanistic basis regulating this immune checkpoint pathway results in low response rates (~25%), absence of long-term remission, and severe immune-related adverse events (IRAEs).9–14 Besides, mAb are very expensive to produce, which in addition to their required intravenous administration, results in high-cost treatment regimens, which are financially inaccessible to many. These limitations and others preclude that the full potential of the immune checkpoint blockade has yet to be fulfilled.
Recently, new efforts have focused on the development of small-molecule inhibitors as an alternative approach to therapeutically target PD-L1 or PD-1.15 16 The use of small molecules offers several unique advantages over mAb drugs. Small molecules can provide increased oral bioavailability, bio-efficiency, and short half-life activity, particularly relevant for IRAEs.17 18 In addition, small molecules can offer a greater diffusion rate within the tumor microenvironment (TME), target PD-L1 within other cellular sources, and the possibility of avoiding the macrophage-mediated resistance observed in anti-PD-1 therapy.19 However, to date, effective small-molecule inhibitors targeting PD-1/PD-L1, or any other immune checkpoint receptor, are limited and have not yet reached the clinic.
Here, we report the identification and validation of new PD-1/PD-L1 small-molecule inhibitors with enhanced therapeutic properties that offer the possibility to circumvent the inherent challenges associated with mAb. We followed a translational strategy initiated by developing a computationally-driven approach to identify small-molecule inhibitor candidates (hit compounds), where nearly 900 000 compounds from synthetic compound libraries were screened through a structure-based virtual screening campaign. Biochemical experiments have confirmed and validated in silico candidates as true inhibitors of PD-1/PD-L1 interaction. These results were subsequently corroborated in vitro. Their impact on T-cell function was assessed by exploiting two-dimensional (2D) and three-dimensional (3D) multicellular cancer models using patient-derived peripheral blood mononuclear cells (PBMC) and autologous tumor cells. Furthermore, a humanized PD-1/PD-L1 mouse model was used to demonstrate the ability of small-molecule inhibitors in reducing tumor volumes and mediating antitumor immune responses. Our study led to the identification of a new small molecule that restores T-cell function and enables the extensive infiltration of these effector immune cells into the TME in vivo by targeting the PD-1/PD-L1 co-inhibitory interaction, proving to be a powerful strategy for drug discovery in the cancer immunotherapy field.
Methods
Animal studies
The animal procedures were performed in compliance with the Portuguese competent authority for animal protection, Direcção Geral de Alimentação e Veterinária guidelines. The protocols were approved by the Institutional Animal Care and Use Committee. Male C57BL/6N-Pdcd1tm1(huPDCD1-ICP11)Geno humanized for PD-1 (6 weeks old) were purchased from genOway and housed in the animal facility of the Faculty of Pharmacy, University of Lisbon.
Male C57BL/6N humanized PD-1 mice were implanted with 1×10⁶ MC38 cells expressing humanized PD-L1 (MC38-hPD-L1) subcutaneously in the right flank. Twelve days later, when tumor volumes reached ~60 mm3 (40–110 mm3) as measured by digital caliper, animals were randomized into the three treatment groups (N=6 per group). Small-molecule 69 was administered via intraperitoneal (i.p.) at 10 mg/kg for 10 daily doses between study days 12 and 22. Atezolizumab was administered via i.p. injection at 10 mg/kg three times per week between study days 12 and 22. The tumor size and body weight were measured every 3 days. The tumor volume was determined by X2Y0.5 (X, small diameter; Y, large diameter).
At day 30, MC38 tumors and spleens were collected from the animals directly after euthanasia. Tumor and spleen single-cell suspensions were obtained by mechanical disruption of the tissues. Tumors were further digested in RPMI medium with 0.5% BSA, 0.1% collagenase type II (LS004177, Worthington), 0.1% dispase (LS02109, Worthington), and DNase (LS002007, Worthington) for 1 hour at 37°C. After digestion, the suspension was filtered through a 70 µm filter (BD Biosciences) to remove the debris. Finally, ACK (Ammonium-Chloride-Potassium) lysing buffer was added to tumor and spleen single-cell suspensions for red blood cell lysis. The obtained single-cell suspensions were then stained with fluorochrome-labeled antibodies and analyzed using an Cytek Aurora (Cytek) and FlowJo software (TreeStar).
In silico studies
A structure-based virtual screening campaign using molecular docking was performed. First, the virtual screening library was generated using compounds from National Cancer Institute (www.cancer.gov), Enamine (www.enamine.net), Specs (www.specs.net), Mu.Ta.Lig Chemoteca (www.mutalig.eu), MMV (ww.mmv.org) and inhouse databases. Briefly, compound structures were prepared using the Molecular Operating Environment (MOE) 20180101 software package.20 They were protonated (at pH=7.4 and 310 K), and partial charges were assigned using Amber10 EHT force field. Compound structures were further energy-minimized.
The 3D PD-L1 structure (PDBID: 5J89) retrieved from Protein Data Bank (www.rcsb.org) used for the virtual screening campaign was prepared on MOE 20180101. In short, this included water (no crystallographic waters were found to be structurally important) and ligands removal, in addition to hydrogen atoms and optimization of the hydrogen bonding network.
Following molecular docking, Genetic Optimization for Ligand Docking (GOLD) V.5.2.0 suite of programs was used to analyze the binding conformations.21 The virtual screening was achieved using TyrA56 as the center of the binding pocket with 10 Å radius, and 1000 genetic algorithm (GA) runs. Initially, virtual screening was performed with speed-up settings, using ChemPLP fitness scoring function and 50 GA runs. The top 1000 highest ranked compounds in virtual screening were selected for posterior molecular docking studies with a more accurate modality (GoldScore fitness scoring function with 500 GA runs). The pocket was visually inspected, and the selection of compounds was based on (1) score, (2) appropriate pocket fitting and (3) interactions with the surrounding residues. Finally, compounds were subsequently filtered by FAF-Drugs4 tool using the following chemical property ranges that correspond to the Lipinski’s rule of five for enhanced drug-likeness: MW 300–550, hydrogen-bond donors 0–5, hydrogen-bond acceptors 1–10, rotatable bonds 0–10 and LogP 0–5.5.
Chemical compounds
Hit compounds were obtained from National Cancer Institute (NCI). NCI collection of compounds was built and is maintained by the Developmental Therapeutics Program, Division of Cancer Treatment and Diagnosis of the National Cancer Institute, National Institute of Health (Bethesda, Maryland, USA). Compounds were characterized by nuclear magnetic resonance (NMR). 1H-NMR spectra were recorded on a Bruker Avance 300 MHz NMR spectrometer using deuterated solvents. The chemical shift data were obtained as δH in ppm and referenced against the deuterated solvent used (online supplemental figure 1). Coupling constants were determined using MestreNova and the values are quoted in Hz. The NMR correspond to the hits identified on cell-based experiments. To test compounds in cellular assays, these small molecule drugs were dissolved at 10 mM in DMSO (stock solution). All compounds were diluted in DMSO to the required concentration immediately before testing (DMSO content was less than 1% in final media).
Supplemental material
PD1/PD-L1 binding assay
PD1/PD-L1 binding assay kit (Cisbio Assays) was reconstituted according to the supplier protocols. PD1/PD-L1 binding assays were performed in white 96-well low volume plates (Cisbio Assays) with a final volume of 20 µL comprizing 2.0 µl of compound (100 µM), 4.0 µl of Tag1-PD-L1 (5 nM) and 4.0 µl of Tag2-PD-1 (50 nM). After 10 min of incubation at room temperature, detection reagents were added: 10 µL of pre-mixed anti-Tag1-Europium and anti-Tag2-XL665. HTRF signal was measured after 2 hours using a microplate reader (POLARstar Omega, BMG LABTECH) using the following setup: excitation 337 nm, emissions 620 nm and 665 nm. Dilution buffer and BMS-202 were used as negative and positive controls, respectively. Results were analyzed with a two-wavelength signal ratio: (intensity (665 nm)/intensity (620 nm))×104 (HTRF Ratio). The normalized HTRF ratio was calculated as follow: ((compound signal) − (min signal))/((max signal) − (min signal))×100, where ‘max signal’ is the signal ratio with PD-1/PD-L1 and ‘min signal’ the signal ratio without PD-1. For the first screening assay, each chemical was tested in duplicate. True hits were tested in three independent experiments. To access the binding properties towards each compound, the HTRF assay was performed in the presence of increasing compound concentrations (0.0001–100 µM) or 1% (v/v) DMSO (vehicle control). Half-maximum inhibition by inhibitory compounds (IC50 values) were calculated using log (inhibitor) versus normalized response function of GraphPad Prism software (V.7.03).
DSF
Differential scanning fluorimetry (DSF) was performed in a C1000 Touch thermal cycler equipped with a CFX96 optical reaction module (Bio-Rad). For all fluorescence measurements, samples contained recombinant human PD-L1 (Thermo Fisher) at 500 µg·ml−1 in phosphate buffered saline (PBS), pH 7.4, 5% (m/v) Mannitol, 5% (m/v) Trehalose, 0.02% (v/v) Tween 80, 2.5-fold SYPRO Orange (Invitrogen, Thermo Fisher), 1% (v/v) DMSO (Sigma-Aldrich, Merck) and 100 µM of each compound. The PCR plate was sealed with Optical-Quality Sealing Tape (Bio-Rad) and centrifuged at 300 g for 5 min. The DSF assay was carried out by increasing the temperature from 20°C to 90°C, with a 1 s hold time every 0.2°C and fluorescence acquisition using the FRET channel, after an initial incubation step of 10 min at 20°C. Control experiments in the absence of DMSO and/or compounds were routinely performed in each microplate. Data were processed using CFX Manager Software V3.0 (Bio-Rad) and the GraphPad Prism V.7. Temperature scan curves were fitted to a dose-response sigmoid function (Boltzmann equation) and the melting temperature (Tm values) were obtained from the midpoint of the transition. Normalization of the relative fluorescence intensity (RFU) was also performed to prevent distraction due to different maximum and minimum values on compounds treatment. The RFU values from different data sets were converted to a common scale 0–1, where 0 represents the fluorescence of the native protein and 1 represents the fluorescence of the denatured protein. To monitor the binding properties towards each compound, DSF assays were run in the absence and presence of 100 µM compounds using 1% (v/v) DMSO as vehicle control.
WaterLOGSY NMR
NMR experiments were performed using a NMR Bruker AVANCE-TM 600 MHz Spectrometer with a 5 mm BBO probe, the acquisition temperature was set at 25°C. For WaterLOGSY experiments, 0.15 mM of ligand (from a 10 mM stock in DMSO-d6) were added to 5 µM PD-L1 samples in 10 mM sodium phosphate, 25 mM NaCl, ph 7.6 with 10% D2O, in a protein/ligand ratio of 1:30, optimal for the WaterLOGSY experiments. For each compound, samples were prepared with and without protein. For each sample, one-dimensional (1D) 1H and WaterLOGSY experiments were acquired. A total of 16K-points were used for a sweep width of 16 ppm in both experiments. For the 1D 1H experiments, 256 scans were accumulated. A total of 528 scans were accumulated for the WaterLOGSY experiment. Spectra were acquired and processed with TopSpin V.4.1 (Bruker Biospin), and Mnova software (MestReNova, V.14.2.0).
Cell culture
MDA-MB-231, A375, G361, SK-MEL1 and HMEC-1 were all originally obtained from ATCC (American Type Culture Collection). All adherent cell lines (unless otherwise specified) were maintained in DMEM (Thermo Fisher Scientific) supplemented with 10% FBS (Thermo Fisher Scientific), 100 U.mL−1 penicillin and 100 µg.mL−1 streptomycin (Thermo Fisher Scientific). HMEC-1 cell line was cultured in MCDB131 (Thermo Fisher Scientific) supplemented with 10 ng.mL−1 epidermal growth factor, 1 µg.mL−1 hydrocortisone, 10 mM glutamine and 10% (v/v) FBS. MC38-hPD-L1 cell line was purchased from genOway and maintained accordingly to the manufacturer instructions. All cell lines were routinely screened for mycoplasma contamination.
Cell viability
For the MTT assays, cells were seeded in 96-multi-well plate at a concentration of 7000 cells per well. Six hours after seeding, cells were treated with the compounds and DMSO as a negative control. Forty-eight hours after the addition of the compounds, 20 µl of 5 mg.mL−1 MTT (Sigma-Aldrich) dissolved in PBS were added to each well and incubated for 2 hours at 37°C. Solutions were removed, and 100 µl of DMSO were added to each well and gently mixed on a shaker. The absorbance of control and treated wells was read against a DMSO blank at 570 nm using an Epoch microplate reader (Biotek). Each hit compound was tested in three replicates, in three independent experiments.
PD-1/PD-L1 inhibition on human melanoma and breast cancer cell lines
Cells (0.1×10⁶ cells) were tested for PD-1/PD-L1 inhibition by co-incubation of hit compounds, DMSO (background), BMS-202 (Selleckchem) and anti-human PD-L1 (Bio X Cell, Clone 29E.2A3) (positive controls) for 72 hours in 2 mL DMEM media. Non-confluent cell cultures were scraped into single-cell suspension, washed with PBS, and counted. Cells were subsequently stained with PD-1 fluorescent proxy (1 µg/100 µL) for 30 min at 4°C, washed twice and resuspended in fluorescence-activated cell sorting (FACS) buffer. Cells were analyzed using BD LSRFortessa (BD Biosciences) and data analyzed with FlowJo software for Mac (FlowJo, 2013–2016). Mean fluorescence intensity (MFI) was derived from each sample. The PD-1/PD-L1 inhibition in cells was measured by a decrease in MFI relative to background.
Isolation and culture of patient-derived cells
PBMC were isolated from peripheral blood of patients by Ficoll-Paque (Sigma-Aldrich) density gradient separation and cryopreserved until later use. Tumor single-cell suspensions were obtained by mechanical disruption of the tissues and enzymatic digestion in PBS with 0.5% (m/v) BSA, 0.1% (m/v) collagenase type II, and 0.1% (m/v) dispase for 1 hour at 37°C. After digestion, the suspension was filtered through a 70 µm filter to remove the debris. The obtained single-cell suspensions were then stained with fluorochrome-labeled antibodies and analyzed using an LSRFortessa (BD Biosciences) and FlowJo software.
Patient-derived tumor cells were maintained in RMPI-1640 (Thermo Fisher Scientific) supplemented with 10% FBS, 100 U.mL−1 penicillin and 100 µg.mL−1 streptomycin (Tumor media). The PBMCs were maintained in RMPI-1640 (Thermo Fisher Scientific) supplemented with 10% FBS, 100 U.mL−1 penicillin, 100 µg.mL−1 streptomycin, and 150 U.mL−1 IL-2 (Peprotech) (T-cell media).
Tumor–lymphocyte co-culture
One day before co-culture, PBMC were resuspended in T cell media and cultured overnight at 37°C. Prior to co-culture, tumor cells were stimulated overnight with 200 ng.mL−1 human recombinant interferon (IFN)-γ (Peprotech). The next day, tumor cells were scraped to single cells and resuspended in Tumor media. PBMC were seeded at a density of 0.1×10⁶ cells/well and stimulated with single cell-dissociated tumor cells at a 2:1 Effector:Target ratio. Co-culture was performed in the presence of 150 U.mL−1 IL-2, 5 μg.mL−1 of anti-CD28 (Bio X Cell) and αPD-L1 blocking antibody or small-molecule inhibitor for 72 hours. An αIFN-γ antibody (BioLegend) was used to block this signal to infer the role of T-cell activity on the antitumor response induced by the small-molecule inhibitor. The cells were then stained with fluorochrome-labeled antibodies and analyzed using an LSRFortessa (BD Biosciences) and FlowJo software.
3D patient-derived tumor spheroids–lymphocyte co-culture
After isolation of tumor cells, cells were then washed and cultured for up to 3 days. This allowed the isolation of adherent cells that were then scrapped and seeded in Nunclon Sphera 96-well plate (Thermo Fisher Scientific) to create a unique uniform spheroid in each well. Spheroids were ready on day 2. After, spheroids were embedded in reduced growth Matrigel (Corning) with PBMC (1:100) and were left untreated or were treated with the small-molecule inhibitor or αPD-L1, dissolved in the appropriate cell culture medium. During spheroids formation, PBMC were maintained in T cell media and cultured at 37°C.
Immunofluorescence
The 3D co-culture was fixed with 4% paraformaldehyde (Merck) and blocked by PBS with 2% (m/v) BSA (Sigma-Aldrich, Merck). After, the samples were incubated with CD8 (MA5-16345, Invitrogen) (1:50) in PBS with 1% (v/v) Tween 20 for 18 hours at 4°C. After, 4 µg.mL−1 of secondary antibody (A-11008, Invitrogen) were added, 3D spheroids were stained with Hoechst 33 342 (10 µg.mL−1) for 20 min. Finally, 3D spheroid invasion was visualized using a Leica DMi8-CS inverted microscope with Leica LAS X software (Leica Microsystems). The different z-stacks were merged and analyzed by Fiji-ImageJ.
Flow cytometry
All staining was performed in FACS buffer (0.5% (m/v) BSA, 2 mM EDTA in PBS). Samples were acquired on a BD LSRFortessa (BD Biosciences) or Cytek Aurora (Cytek). Analysis was performed using FlowJo (FlowJo). To analyze cell surface marker expression, cells were collected, washed with PBS and stained with the viability dye Live/Dead Yellow (Thermo Fisher Scientific) according to the manufacturer’s protocol. Cells were then washed with FACS buffer and stained for surface markers: CD45 (APC-Vio 770, clone REA747), CD3 (PerCP Cy5.5, clone OKT3), CD4 (FITC, clone REA623), CD8 (VioBlue, clone REA734), CD107a (PE-Cy5, clone eBioH4A3), CD279 (PE, clone REA1165) and CD274 (BV711, clone 29E.2A3) for 20 min at 4°C.
To analyze intracellular cytokines, cells were collected, washed with PBS, and stained with the viability dye Live/Dead Yellow. Cells were then washed with FACS buffer and stained for surface markers. Cells were further fixed and permeabilized using Inside stain kit (Miltenyi Biotec), according to the manufacturer’s protocol, and stained for the intracellular cytokines IFN-γ (PE-Vio 770, clone REA600) and tumour necrosis factorα (APC, clone REA656).
Statistics
Samples sizes and statistical tests are defined in each figure legend. Results for technical replicates are presented as mean±SD. Statistical significance between conditions was calculated using Student’s t-test (two-tailed) when comparing two groups, and one-way analysis of variance followed by Dunnett’s or Tukey’s post-hoc analysis when comparing more than two. All statistical calculations were performed using the software package GraphPad Prism (V.7.03).
Results
In silico identification of PD-1/PD-L1 small-molecule inhibitors
Previous studies have reported the biphenyl-derivatives as the first PD-1/PD-L1 small-molecule inhibitors.22–24 However, their mode of action has not yet been completely elucidated. Currently, several crystal structures of these inhibitors have been resolved, demonstrating their ability to bind to PD-L1 and induce its dimerization (figure 1A). Aiming for the discovery of new PD-1/PD-L1 inhibitors and considering the increasing number of the crystal structures available for this immune checkpoint, we performed a comprehensive structure-based virtual screening campaign. We used a crystal structure of human PD-L1 (PDB 5J89), which was selected among the most suitable ones to be further used in in silico studies25 (figure 1B). Accordingly, we screened a collection of approximately 900 000 commercial compounds from several drug repositories (eg, NCI, Enamine, SPECS, or inhouse). The compound collection was screened using molecular docking into the PD-L1 binding site. The first refinement was performed with speed up settings. The top ranked compounds were then subjected to exhaustive docking analyses that predicted with higher precision the corresponding binding pose and the interactions within the receptor-binding pocket. Finally, the selected compound pool was filtered by applying the Lipinski’s rule of five criteria for enhanced drug-likeness. Only the compounds that presented favorable binding conformations, surface complementarity with the receptor, and exhibited the important interactions with key pocket residues were retained. This approach yielded 95 possible PD-L1 binders with chemically-diverse structures (figure 1C) that were tested afterwards for blocking the PD-1/PD-L1 interaction.
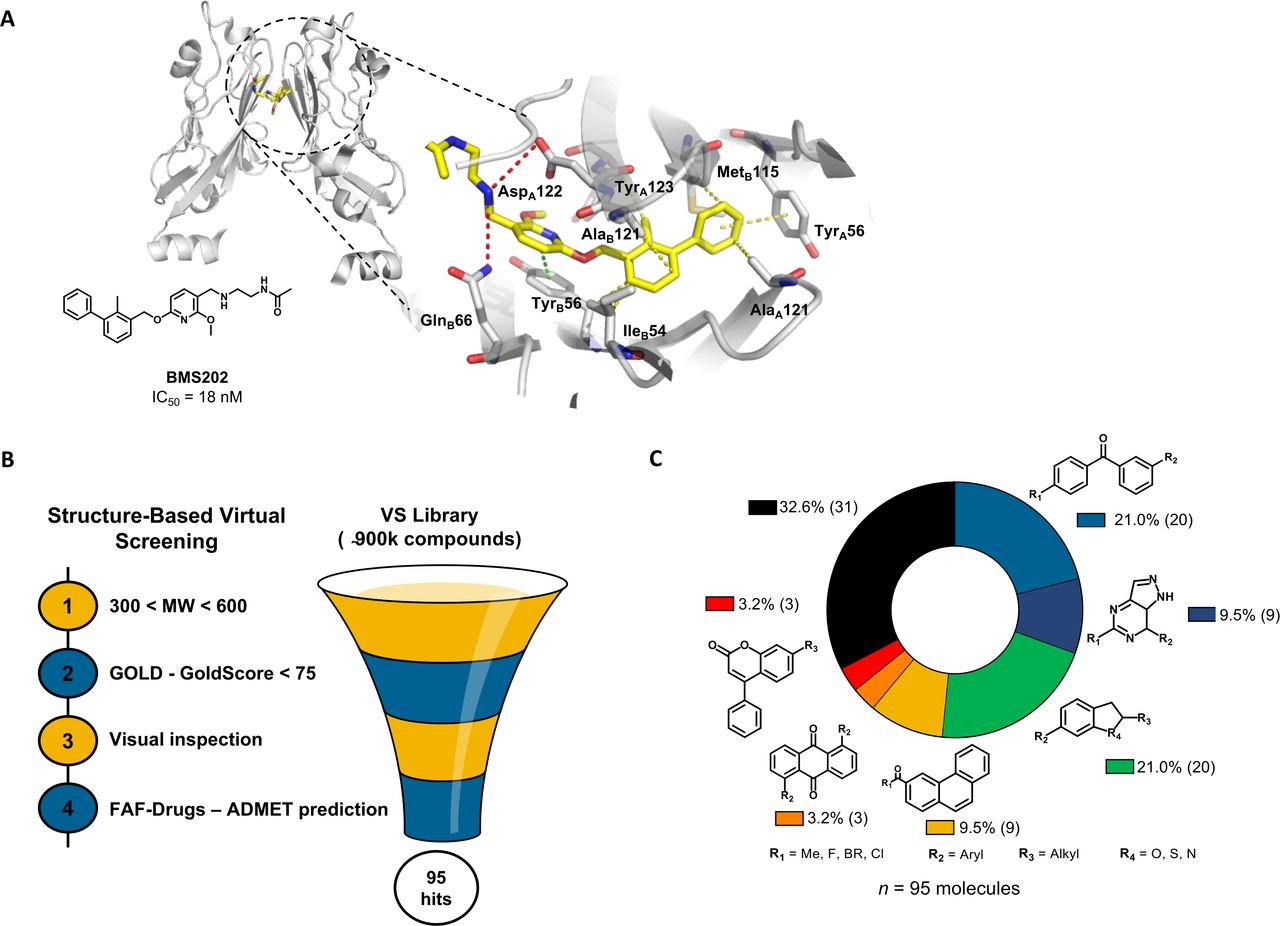
In silico virtual screening for putative PD-1/PD-L1 inhibitors. (A) Ribbon representation of PD-L1 monomers (gray) bridged by small-molecule inhibitor BMS202 (yellow) (PDB 5J89). Close-up view of the binding pocket. Receptor-ligand interactions are displayed in dashes. Hydrophobic contacts (yellow), π-staking (green) and H-bond and salt bridges (red). (B) Structure-based virtual screening for the identification of PD-1/PD-L1 small-molecule inhibitors, beginning with pre-filtering the compounds based on molecular weight (MW), followed by the screening in silico using the scoring function GoldScore of the GOLD software, followed by the visual inspection of the top-ranked compounds within the binding pocket. Finally, the compounds were uploaded into the FAF-Drugs predictor to address the administration, distribution, metabolism, excretion, and toxicity (ADMET) properties. (C) In total, 95 chemically diverse virtual hits were selected to move forward. GOLD, Genetic Optimization for Ligand Docking; PD-1, programmed cell death protein 1; PD-L1, PD-ligand 1; vs, virtual screening
Inhibition of PD-1/PD-L1 interaction by small molecules
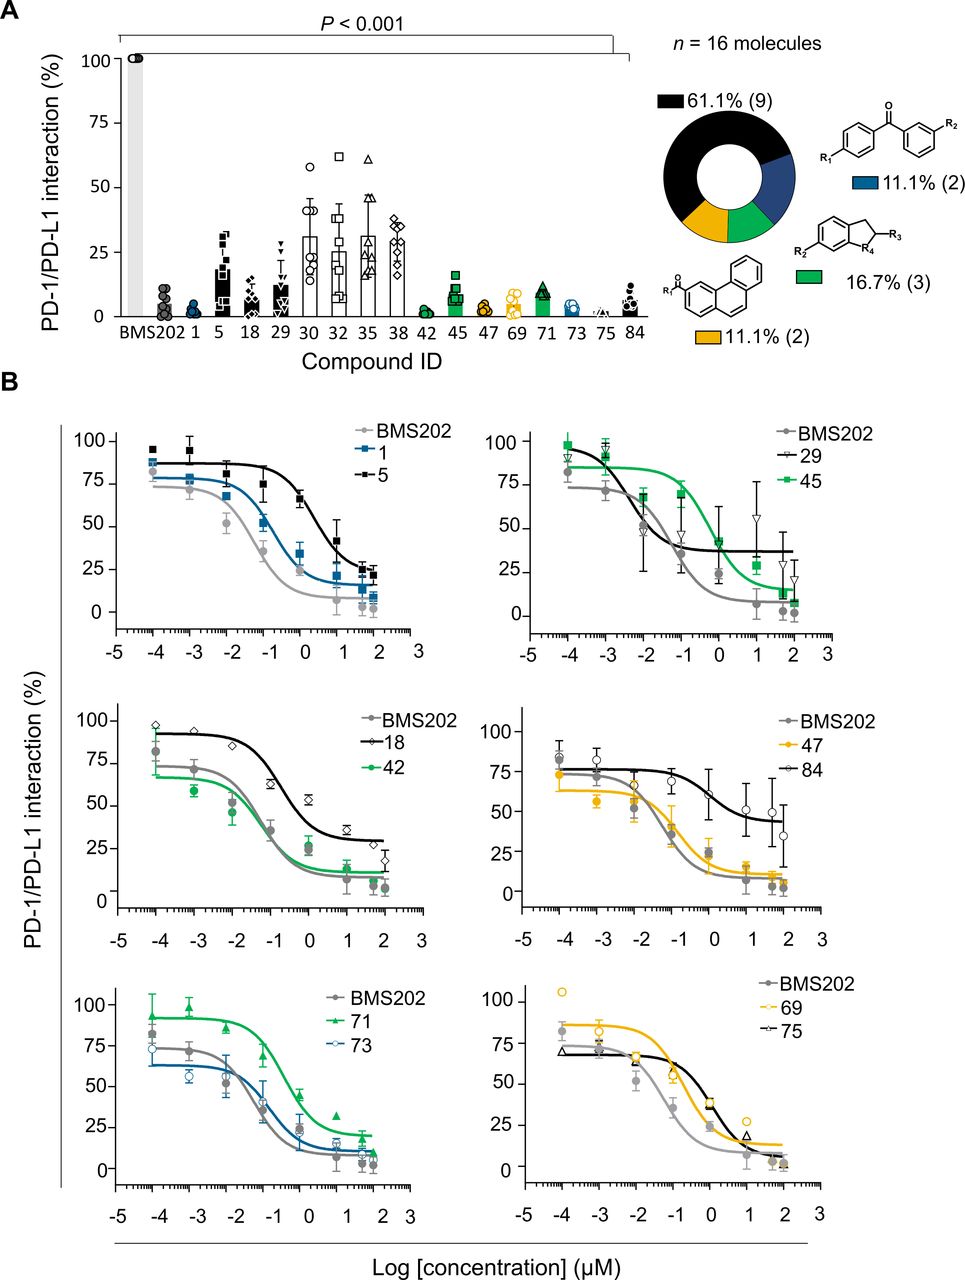
The screened compounds were initially tested for their capacity to inhibit the PD-1/PD-L1 interaction using in vitro functional assays. We used homogeneous time resolved fluorescence (HTRF) to evaluate those 95 hits identified in silico (online supplemental figure 2). The BMS202 inhibitor, known as a small-molecule inhibitor of PD-1/PD-L1 interaction, was used as a reference. Compounds were tested at 100 µM and inhibition levels were determined based on the HTRF signal reduction. Hits were defined as compounds inhibiting at least 50% of the PD-1/PD-L1 interaction. The results show that out of the 95 compounds tested, 16 (17%) chemically diverse compounds were able to lead to a 50% reduction on the HTRF signal, thus indicating a significant effect on the PD-1/PD-L1 inhibition (p<0.001) (figure 2A). Validated hits were tested in three independent assays and further analyzed for dose-response (eight doses in 1:2 and 1:10 serial dilutions) starting from 100 µM (figure 2B). Among the 16 compounds, 12 revealed dose-response effect and were further analyzed for their binding to PD-L1. Since no dose-response was observed for four compounds (30, 32, 35 and 38), we assumed that they were false-positives and were abandoned (online supplemental figure 3). Two compounds (18 and 29) were not further used due to stability issues.
Supplemental material
Supplemental material

Hit compounds inhibit PD-1/PD-L1 interaction. (A) Among the 95 compounds tested for PD-1/PD-L1 inhibition using homogeneous time-resolved fluorescence (HTRF) at 100 µM, 16 compounds were confirmed hits (blue—1 and 73; black—5, 29, 18, 75 and 84; green—45, 41 and 71; yellow—69 and 47, and white—30, 32, 35 and 38). BMS202 (dark gray) was used as positive control for inhibiting the PD-1/PD-L1 interaction. Results were normalized (0%–100%) considering PD-1/PD-L1 interaction (light gray) the 100%. Data are presented as mean±SD, N=3, n=9, from three independent experiments performed in triplicate. (B) Dose-response curves determined by HTRF. Serial dilution of compounds (eight doses 1:2 and 1:10) starting from 100 µM. BMS202 (dark gray) was used as positive control for PD-1/PD-L1 inhibition. Among the 16 compounds, 4 (white—30, 32, 35 and 38) were considered false positives, since no dose-response effect was achieved. IC50 values were determined for each compound: 1 (IC50 186 nM), 5 (IC50 2.44 µM), 18 (IC50 190 nM), 29 (IC50 4 nM), 42 (IC50 57 nM), 45 (IC50 596 nM), 47 (IC50 149 nM), 69(IC50 96 nM), 71(IC50 380 nM), 73(IC50 149 nM), 75(IC50 1.55 µM), 84 (IC50 1.09 µM), and BMS202 (IC50 57 nM). Data are presented as mean±SD, N=3, n=9, from three independent experiments performed in triplicate. PD-1, programmed cell death protein 1; PD-L1, PD-ligand 1.
Binding to PD-L1 induces increased thermal stability
Based on the mode of action described for BMS202, we hypothesized that compounds would stabilize the protein on binding to PD-L1. To test our hypothesis, we determined the Tm of the PD-L1 in thermal denaturation assays by DSF and checked for a shift in the proteins’ Tm in the presence of the PD-L1 inhibitor candidates. The extent of temperature shift is proportional to compounds’ stabilizing effect, being thereby used to infer inhibitors’ affinity. First, we assessed the thermal denaturation profile of the recombinant human PD-L1 in buffer conditions as well as possible interferences of tested compounds with the fluorescence dye. The compounds 1, 71 and 73 revealed to interfere and therefore were not included in the DSF studies. The RFU was plotted as a function of temperature (figure 3A) and the midpoint of the thermal transition (Tm) was calculated. The observed Tm values were highly reproducible, with a SD of <0.1°C using different batches of the protein (Tm=54.5°C). DSF was then used to profile the compounds. Notably, a thermal shift was observed for all molecules (figure 3A). Accordingly, the compounds increased the thermal stability by 4°C–3°C, confirming the higher stability of the protein in the presence of 100 µM of the tested molecules (online supplemental figure 4A). We note that the observed thermal shifts range are consistent with the relatively small stabilizing effect that compounds are expected to have on the dimer stabilization formed by the soluble full-length PD-L1 protein. The compound-binding to PD-L1 was also confirmed by the WaterLOGSY NMR experiment performed for the most promising small-molecule inhibitor 69 (online supplemental figure 5). These results suggest that compounds have a mode of action similar to BMS202, which bind to PD-L1 and thereby can interfere with its interaction with the PD-1.
Supplemental material
Supplemental material
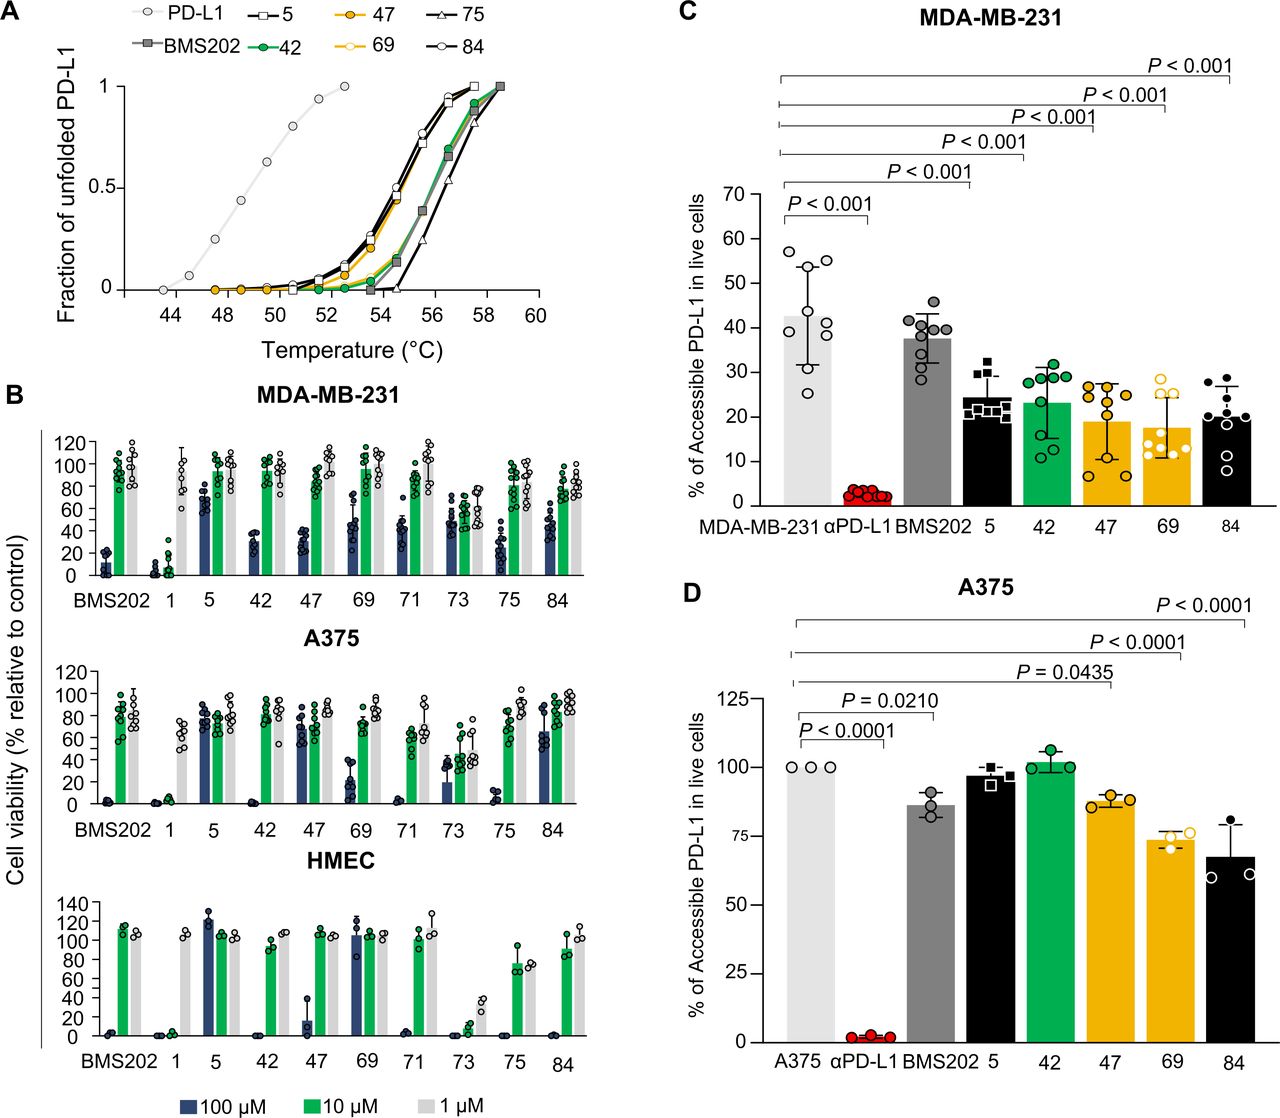
Small-molecule inhibitors bind to PD-L1 with no impact on cell viability. (A) Thermal shifts indicate the stabilization of PD-L1 by compounds 5 (black), 42 (green), 47 (yellow), 69 (yellow), 75 (black) and 84 (black). Curves represent the fraction of unfolded recombinant human PD-L1 protein, where 0 represents the folded PD-L1 and 1 the unfolded, in the presence of 1% DMSO (light gray), indicated compounds (green, yellow and black) and BMS202 (dark gray) at 100 µM. (B) Different cell lines were incubated with increased concentrations of compounds for 48 hours. Cell viability was normalized to untreated cells. All cell lines, MDA-MB-231 (ATCC# HTB-26), A375 (ATCC# CRL. 1619), and HMEC (ATCC# CRL-3243) showed tolerance to the compounds. Three different concentrations 100 µM (blue), 10 µM (green) and 1 µM (gray) were tested. Data are presented as mean±SD, N=3 and N=1, n=9 or n=3 from three or one independent experiment(s) performed in triplicate. (C–D) Compounds inhibit PD-1/PD-L1 interaction on melanoma and breast cancer cell lines. (C) MDA-MB-231 breast cancer cells (gray) or (D) A375 melanoma cells (gray) were treated with 10 µM of compounds (green, yellow and black), BMS202 (dark gray) and anti-PD-L1 (αPD-L1) (red) for 72 hours. A375 cells were stimulated with 200 ng.mL−1 interferon-ɣ (gray) for 18 hours before treatments to enhance PD-L1 levels. The remaining % of accessible PD-L1 was determined in live cells by flow cytometry. Data are presented as mean±SD, N=3, n=9, or N=1, n=3, from three or one independent experiments performed in triplicate. Statistical analysis: one-way analysis of variance and Tukey’s post test. PD-L1, programmed cell death ligand 1. ATCC, American Type Culture Collection.
Hit compounds effect on cell viability
PD-L1-targeted small molecules are not expected to have a direct effect on targeted cell viability. Therefore, to access cell tolerance to hit and BMS compounds that will be further tested in cell-based activity assays, we first evaluated their impact on cell viability using the cell metabolic viability assay (MTT). Thus, human breast cancer MDA-MB-231 and melanoma A375 cells were exposed to increasing concentrations (1, 10, and 100 µM) of the selected compounds for 48 hours. Some of the tested compounds revealed a considerably different toxicity, compared with the BMS202 molecule (figure 3B). The BMS202 molecule presented a higher toxicity at the highest concentration, as previously reported.24 In general, tested compounds showed low toxicity (figure 3B), except for the compounds 1, 73 and 75 that revealed a toxicity higher or similar to that obtained for BMS202, in both cell lines. Finally, endothelial cells (HMEC-1) were used to infer a possible off-target systemic toxic effect. The impact of the small molecule hits on cell viability was similar to the ones obtained in both tumor cell lines, except for compound 69. Considering the in silico results and the impact of these compounds on cell viability, the compounds 5, 42, 47, 69, 71 and 84 were considered the most suitable for their further characterization as potential PD-1/PD-L1 inhibitors in vitro and ex vivo.
In vitro modulation of PD-1/PD-L1 interaction
A cell-based assay was set up to determine the effective compound-activity on PD-1/PD-L1 inhibition in vitro. Four human tumor cell lines were selected to evaluate the levels of PD-L1 by FACS, one breast cancer (MDA-MB-231) cell line and three melanoma (A375, G361, and SK-MEL1) cell lines. Only the MDA-MB-231 presented significant levels of PD-L1 (online supplemental figure 4B). However, it is reported in the literature that tumor cells within TME enhance antigen presentation on IFN-ɣ exposure.26 Accordingly, two non-responsive melanoma cell lines (A375 and SK-MEL1) became PD-L1 positive on IFN-ɣ pretreatment. For following cellular assays, MDA-MB-231 and A375 were selected as these expressed the highest levels of PD-L1, where PD-L1 inhibition could be effectively observed. Based on the limited data on cell-based assays available for BMS202 and considering the current clinical relevance of immune checkpoint mAb, anti-PD-L1 monoclonal antibody (αPD-L1) was used as reference inhibitor for the subsequent studies.
The selected cell lines were incubated with the selected compounds to assess compound-binding affinities, and consequently PD-1/PD-L1 inhibition. The levels of remaining accessible PD-L1 in these cells were evaluated by FACS analysis using a fluorescence PD-1 proxy. To understand compound activity, different incubation times (24, 48 and 72 hours) were evaluated on MDA-MB-231 breast cancer cell line. Cells were pretreated with 10 µM of the selected compounds at different time points (online supplemental figure 6). The highest reduction on PD-L1 accessibility on treatment with the different compounds was observed for the most prolonged incubation time (72 hours) (figure 3C,D), and therefore the subsequent experiments were performed incubating the compounds for 72 hours. Overall, most of the compounds demonstrated an impact on PD-L1 accessibility (p<0.001) and thus inhibited the PD-1/PD-L1 interaction. The compound 69 revealed to be the most effective in both melanoma and breast cancer cell lines (figure 3C,D). Our experiments also showed that BMS202 did not exhibit a significant impact on PD-1/PD-L1 interaction using MDA-MB-231 cells and only moderate impact on A375 cell line (p<0.0210). However, all small molecule candidates presented an inhibitory ability lower than that obtained for the αPD-L1, as expected. Ex vivo and in vivo studies were subsequently performed to further address the impact of selected small molecule candidates on T-cell function and ability to infiltrate solid tumors.
Supplemental material
Ex vivo modulation of PD-1/PD-L1 interaction
To test the impact of the selected compounds on T-cell activation and function on PD-1/PD-L1 inhibition, we established a co-culture experiment using patient-derived PBMC and autologous tumor cells (figure 4A).27 Through this study, the activation of tumor reactive T cells and the induction of T-cell-mediated cytokine secretion following the PD-1/PD-L1 inhibition by our selected small molecules and control αPD-L1 were assessed in seven patient samples of melanoma, breast cancer metastases and lung cancer metastases obtained from surgical excision (figure 4B–E). Due to limitations on the number of fresh-paired blood and tumor cells obtained from all samples, we selected the most promising PD-1/PD-L1 small-molecule inhibitor 69 to perform these studies.

Induction of T-cell activation by PD-1/PD-L1 inhibition using co-culture experiments. (A) Experimental workflow. Tumor cells were obtained from surgical resections of melanoma (Mel), bone metastases of breast (BBM) and lung cancer (LBM). The tumor cells were stimulated with IFN-γ for 18 hours prior to co-culture to enhance the PD-L1 expression. The PBMC and tumor cells were co-cultured and treated with anti-CD28 (blue) or treated with anti-CD28 plus PD-L1 inhibitors (small-molecule inhibitor 69 (yellow) and anti-PD-L1 (red)) for 72 hours. The PD-1/PD-L1 inhibition and T-cell activation were assessed using flow cytometry. (B) Cell-surface PD-L1 levels were determined by flow cytometry. Data indicate mean fluorescence intensity (MFI) of anti-PD-L1-BV711 minus MFI of isotype control. (C) Cell-surface PD-1 levels were determined by flow cytometry. (D) Representative flow cytometry plots for T cell reactivity after 72 hours of co-culture with autologous tumor cells. The plots indicate the percentage of IFN-γ and CD107a on CD8+ T cells. Quantification of tumor cells-induced IFN-γ (E) production and CD107a (F) cell-surface expression of CD45+CD3+CD8+ T cells was obtained after 72 hours of co-culture. Data are presented as mean±SD, N=1, n=3 or 2, from one independent experiment performed in triplicate or duplicate (limited amounts of tumor or blood available). Statistical analysis: one-way analysis of variance and Tukey’s post test. FACS, fluorescence-activated cell sorting; IFN, interferon; IL, interleukin; PBMC, peripheral blood mononuclear cells; PD-1, programmed cell death protein 1; PD-L1, PD-ligand 1.
Prior to co-culture, freshly isolated cells (tumor and PBMC) were characterized by FACS analysis (online supplemental figure 7). Due to the low levels of PD-L1, tumor cells were pre-stimulated with IFN-γ for 18 hours to enhance PD-L1 expression. During this time, PBMC were plated with anti-CD28 and interleukin-2 (IL-2) to provide co-stimulation and to support T-cell proliferation, respectively. Effector:Target cells at 2:1 ratio were simultaneously seeded, where Effector cells are T cells and Target cells correspond to tumor cells. To counteract the inhibitory effect of PD-L1 during T-cell activation, the selected compound 69 was added to the co-culture. The αPD-L1 was also added as the relevant control for PD-L1 inhibition. After 72 hours of incubation, the antitumor T-cell based reactivity was inferred by assessing different functional markers (CD45, CD3, CD4, CD8, PD-1, PD-L1, IFN-γ and CD107a) by FACS analysis (online supplemental figure 8). In all seven (100%) patients, the small-molecule inhibitor 69 induced both PD-1/PD-L1 inhibition, IFN-γ secretion and CD107a upregulation in CD8+ T cells after 72 hours of co-culture (figure 4B–F). The magnitude of the response varied between patients. However, it is fundamental to note that this novel small-molecule inhibitor reached the same level of PD-1/PD-L1 inhibition ex vivo as the αPD-L1 mAb (figure 4B). In contrast to αPD-L1, the small-molecule inhibitor also demonstrated to impact the PD-1 levels. This impact on PD-1 was observed in all patients (online supplemental figure 9), although significant decrease (p<0.001) was only observed using the cells extracted from patients with melanoma (figure 4C). Additionally, the small-molecule inhibitor showed higher secretion of IFN-γ and CD107a upregulation in a subset of patients, pointing out to an enhanced T-cell activation compared with the αPD-L1 (figure 4D–F). The role of T-cell activity on the antitumor response induced by the small-molecule inhibitor was further confirmed following the inhibition of the IFN-γ signal (online supplemental figure 10A–C). Moreover, both αPD-L1 and small-molecule inhibitor 69 were able to inhibit PD-L1 on autologous antigen presenting cells (APC) (online supplemental figure 10D), but only the cells treated with the small-molecule inhibitor presented an increase on the percentage of APC (online supplemental figure 10E). Overall, robust, and reproducible responses were observed among the different samples, despite the type of cancer.
Supplemental material
Supplemental material
Supplemental material
Supplemental material
Small-molecule inhibitor promote T-cell infiltration ex vivo
To evaluate the antitumor effect of PD-1/PD-L1 inhibitors, we established a 3D co-culture system using a 3D tumor spheroid composed of patient-derived melanoma cells (Mel4) and autologous PBMC. The ability of PD-1/PD-L1 inhibitors (small-molecule inhibitor 69 and αPD-L1) to promote CD8+ T-cell infiltration into the tumor site was thus evaluated. Melanoma spheroids, formed by 5000 patient-derived tumor cells, were embedded in matrigel, co-cultured with autologous PBMC and treated with small-molecule inhibitor 69, αPD-L1, or left untreated by 72 hours (figure 5). We found that PD-1/PD-L1 inhibition with the small-molecule inhibitor 69 resulted in higher CD8+ T-cell infiltration within the tumor spheroid compared with the control treatment (αPD-L1) and untreated cells (figure 5). Besides, notably the spheroids treated with the small-molecule 69 strongly inhibited the sprouting of patient-derived melanoma cells compared with the control treatment (αPD-L1) and untreated (online supplemental figure 11).
Supplemental material
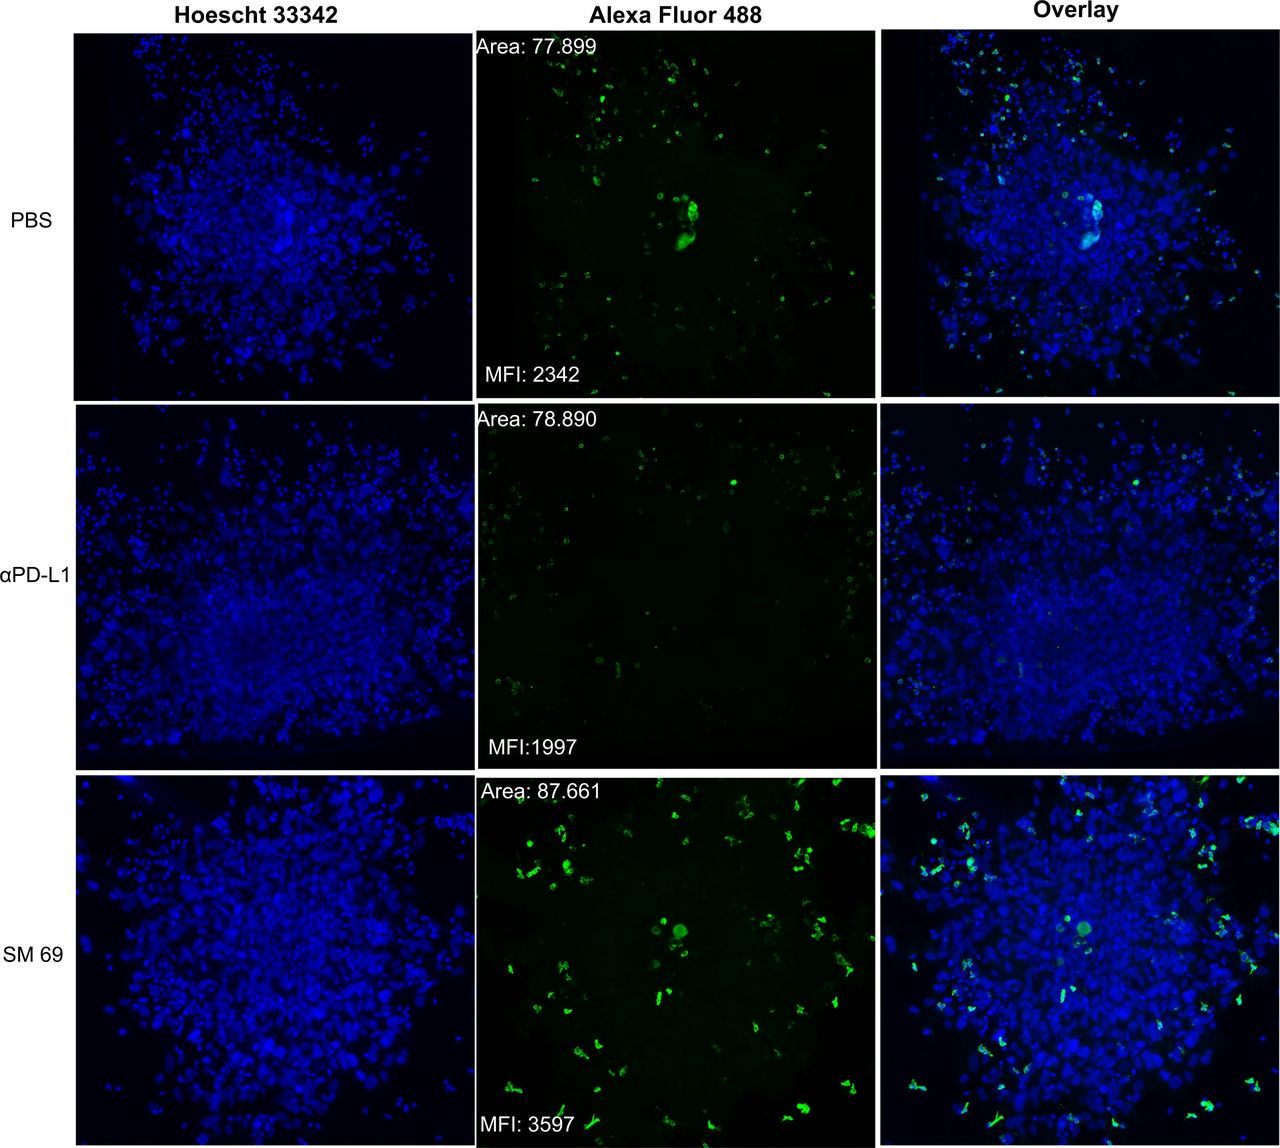
CD8+ T-cell infiltration into 3D melanoma spheroids. Co-culture of 3D tumor spheroids of cells obtained from surgical resection of melanoma and peripheral blood mononuclear cell (PBMC). Cells grew together in reduced growth factor Matrigel. The spheres and PBMC were either not treated or treated with anti-PD-L1 (αPD-L1) or small-molecule inhibitor 69. The CD8+ T-cell infiltration (green) was evaluated 72 hours after co-culture by confocal microscopy. Scale bar=100 µm. MFI, mean fluorescence intensity; PBS, phosphate buffered saline; PD-L1, programmed cell death ligand 1; 3D, three-dimensional.
Small-molecule inhibitor recruits cytotoxic T cells into the tumor microenvironment
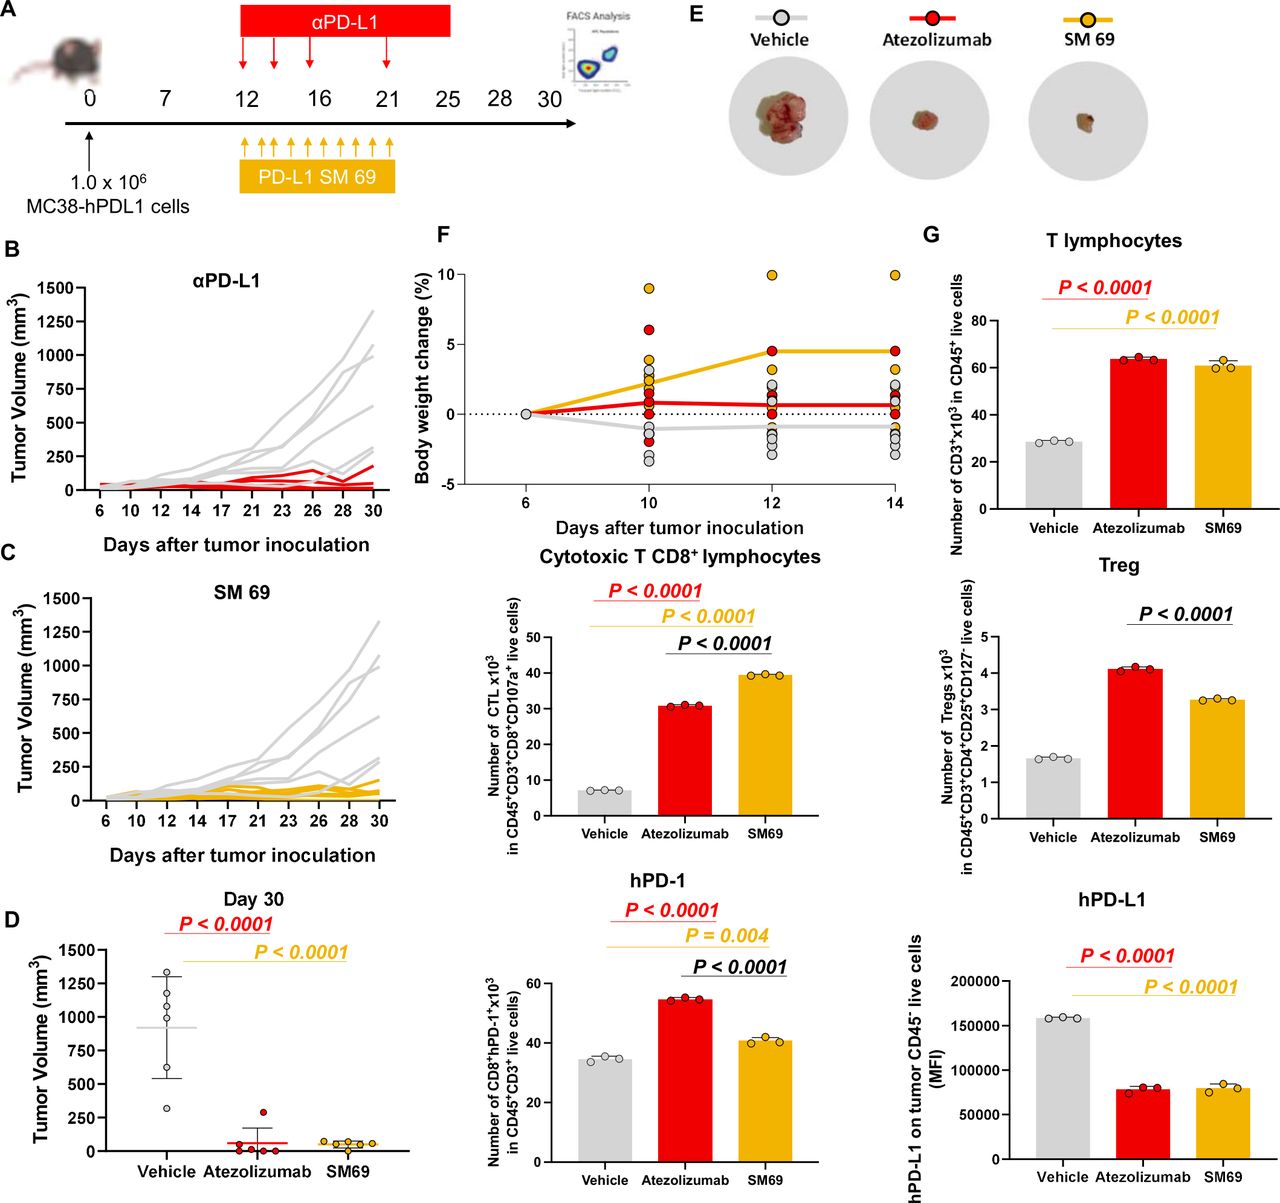
Finally, the antitumor effect of the small-molecule inhibitor was addressed in vivo. For that, humanized PD-1 mice, and the colorectal cancer cell line MC38-hPD-L1 were used (figure 6A). The mice were implanted with the MC38-hPD-L1 and treated once the animals presented palpable tumors, on average 60 mm3. The animals were treated with small-molecule 69 at 10 mg/kg for 10 days and resulted in 93.6% tumor volume reduction, relative to vehicle control. The tumor growth inhibition was significant for animals treated with both PD-L1 targeting molecules (p<0.001) (figure 6B–E). The animals treated with the small-molecule inhibitor 69 exhibited a response similar to atezolizumab that was used as the clinically relevant control (figure 6B–E). Moreover, only slight body weight changes were registered during the study, relative to the mouse initial body weight, which is an important indication for a potential absence of systemic toxicity (figure 6F). At the day 30 the animals were euthanized to characterize the TME by FACS analysis. The tumor growth was directly correlated with PD-L1 levels, as the decrease in PD-L1 was associated with the reduced tumor volumes. These results were accompanied by a higher infiltration of T cells (figure 6G). In addition, a significant increase on cytotoxic CD8+ tumor-infiltrating lymphocytes was induced by the small molecule treatment (p<0.001), while the levels of the regulatory T cells (Treg) were significantly lower than the ones quantified in the tumors of the atezolizumab-treated mice (figure 6G).

PD-1/PD-L1 small-molecule inhibitor recruits cytotoxic CD8 T cells into the tumor microenvironment. (A) Timeline (days) of tumor inoculation and treatments. (B–C) Tumor growth curve of PD-1 humanized mice implanted with MC38 cell line expressing humanized PD-L1. Animals were treated with small-molecule inhibitor 69 and atezolizumab (10 mg/kg intraperitoneal for 10 daily doses days 12–21 or three times per week days 12–21. N=6 mice. (D) Mice individual tumor volumes (mm3) at endpoint day (Day 30). P values correspond to tumor volume at day 30 after the tumor inoculation. (E) Representative tumor images of each treatment group (vehicle, atezolizumab, SM 69). (F) Mice individual body weight change, expressed as per cent change from the day 1 of treatment. N=6 mice per group. (G) Tumor-infiltrating lymphocytes, regulatory T cells (Treg), and PD-1/PD-L1 quantification. Tumors cells were isolated on day 30 after the tumor inoculation. The quantification was performed by flow cytometry. Data are presented as mean±SD, N=3 mice. Statistical analysis: one-way analysis of variance and Tukey’s post test. FACS, fluorescence-activated cell sorting; PD-1, programmed cell death protein 1; PD-L1, PD ligand 1; SM 69, small-molecule inhibitor 69.
Discussion
The discovery of small molecules as immune checkpoint inhibitors has been suggested as a promising approach to overcome the limitations of currently available therapeutics. However, they are technically difficult to identify and assess. Together with a challenging design, the limited structural elucidation of the targets has been compromising the development of PD-1/PD-L1 small-molecule inhibitors. Before 2015, no human PD-1/PD-L1 X-ray structure was resolved and the murine form does not allow the assessment of the extent of plasticity or interactions established with the PD-L1.28 In the last years, several human PD-1 and PD-L1 X-ray structures have been resolved to expose the murine/human structural differences within the binding modes between proteins, as well as the plasticity in the complex formation.28 The advances in PD-1/PD-L1 structural characterization anticipated an astonishing progress on the development of small-molecule inhibitors. However, the design of inhibitors directly targeting the PD-1/PD-L1 interaction interface has been limited by the larger, hydrophobic, and flat interface between proteins without deep binding pockets. Recently, different X-ray structures of PD-L1 with a class of small-molecule inhibitors have been resolved.23 29 BMS compounds were the first non-peptide-based compounds able to inhibit the PD-1/PD-L1 interaction, however, they are reported as compounds with poor drug-like properties.29 In general, these inhibitors bind to PD-L1 leading to a deep cylindrical, hydrophobic pocket created by the interface of two monomers (figure 1A). These structures provided the perfect starting point for a rational structure-based drug design approach.
Here we reported a successful in silico approach that guided us through a rational design of PD-1/PD-L1 small-molecule inhibitors based on the structural information reported. In silico studies (structure-based virtual screening using molecular docking) led to the selection of 95 virtual hits presenting good spatial fitting within the PD-L1 pocket, high score values, key interaction to pocket residues, as well as good ADMET (administration, distribution, metabolism, excretion, and toxicity) properties. The hit validation achieved 16 (17%) compounds using a standard biochemical fluorescence-based PD-1/PD-L1 binding assay. Looking into our rational, we expected that the validated hits would bind to PD-L1 similarly to the BMS inhibitors. The compound-binding to PD-L1 was confirmed by the stabilizing effect observed by DSF (figure 3A) and by WaterLOGSY NMR experiment30 31 for the most promising small-molecule inhibitor 69 (online supplemental figure 5).
As we moved forward in this discovery of new small-molecule inhibitors towards the characterization of their biological effect, we realized that the type of assays already developed and available to validate the effect of PD-1/PD-L1 small-molecule inhibitors are highly limited. These experiments make use of the biochemical assays on hit validation and/or engineered cells to artificially express PD-L1.32 33 Here, we applied those biochemical assays to first validate out small molecule hits, but we decided to further evaluate the compounds’ activity exploiting our 2D and 3D models based on naturally expressing PD-L1 cells. Initially, two different types of human cancer cell lines (breast cancer and melanoma) were thus selected to perform the in vitro studies looking at the impact of our hit compounds on the PD-L1/PD-1 interaction. The basis for cell line selection was the remarkable results obtained in highly immunogenic tumors, as melanoma,34 35 and the exciting outcomes in the treatment of other tumors reported as poorly immunogenic, such as breast cancer.36 The in vitro studies showed that our PD-L1 binding small molecules were able to considerably impact PD-L1 levels in both breast cancer (MDA-MB-231) and melanoma (A375) cell lines. In contrast, a less meaningful effect was observed using the BMS202 small-molecule inhibitor (figure 3E). Therefore, this compound was not used in our subsequent ex vivo and in vivo studies, since it has poor drug-like properties29 and its effect on PD-1/PD-L1 interaction was not pronounced.
To further address the ultimate role of the most promising small-molecule inhibitors in T-cell activation, we developed 2D and 3D co-culture studies of paired matched patient-derived tumor cells and PBMC. The close collaboration with two hospitals (the national oncology hospital Instituto Português de Oncologia Lisboa and Hospital de Santa Maria) allowed us to get freshly isolated samples from patients with cancer (under approved IRB UC/1310 and 1085/13). Only tumor cells and PBMC of the same patient were co-cultured to ensure that an HLA-mismatch reaction did not occur, as well as to overcome the subsequent unspecific T-cell activation. In contrast to tumor cell lines, patient-specific model systems are proving to be a most valuable tool in the field of immuno-oncology due to the inherent diversity of the disease and the multifactorial nature of T cell-mediated tumor destruction.37 In these experiments, it was possible to provide a proof of concept that samples treated with the most promising PD-1/PD-L1 inhibitor could activate T cells by inhibiting this pathway (figure 4B–F). Besides, the co-culture of 3D melanoma spheroids and PBMC demonstrated the capacity of small molecules to promote T-cell infiltration (figure 5). The higher levels of T-cell infiltration may be explained by the possibility offered by small molecules, as opposed to antibodies, to target PD-L1 of distinct sources and locations. Recently, several studies have demonstrated that there are different cellular sources for PD-L1 (eg, dendritic cells, or tumor infiltrating lymphocytes), in addition to intracellular PD-L1 that antibody-based drugs cannot target.38–42 Thus, using a small-molecule approach, ‘any’ PD-L1 can be targeted despite its cellular or cytoplasmic location. This is one of the most significant advantages of small molecules over monoclonal antibodies.
Finally, to extend the clinical relevance of our ex vivo findings, we have tested the small-molecule inhibitor using a human-relevant in vivo model. Accordingly, humanized PD-1 mice developed by inserting a chimeric PD-1 with a human extracellular domain in the mouse PD-1 locus,43 were implanted with the colorectal cancer MC38 cells expressing the human PD-L1 (figure 6A). This study showed that our small molecule-controlled tumor growth at the same level as the clinically relevant control, atezolizumab (figure 6B,C). The immunophenotyping of the tumors also revealed that mice treated with the small-molecule inhibitor 69 presented higher infiltration of CD3+ T cells and recruited a significant number of cytotoxic T lymphocytes (CTL) (figure 6G). In addition, the mice treated with the small-molecule inhibitor recruited fewer Treg when compared with animals treated with atezolizumab contributing to a slighter immunosuppressive TME (figure 6G). Taken together, our results demonstrate that the compound 69, exhibiting the phenanthrene scaffold, inhibits the PD-1/PD-L1 interaction, leads to the activation of T-cell function, and ultimately recruits CTL to the TME, which resulted in a strong control of tumor growth. Although small molecules usually need to be regularly administrated or at higher concentrations when compared with monoclonal antibodies, our small-molecule inhibitor induced an overall effect on tumor growth and related T-cell activation equal to or higher than the clinically-relevant αPD-L1 (atezolizumab), on its administration at the same dose and by the same administration route. Our findings showed that small molecules can be effective as monoclonal antibodies, but additionally allow a considerably higher infiltration of CTL into the tumor, supporting the promising clinical translation of these small-molecule candidates.
Conclusions
There are different immune checkpoint modulators currently in clinical use that have revolutionized cancer therapy. Despite their remarkable clinical outcomes, low response rates, adverse effects, and acquired resistance suggest that the full potential of the immune checkpoint blockade has yet to be fulfilled.
Through this work, we were able to highlight and demonstrate on 2D and 3D ex vivo multicellular melanoma and breast cancer models and in vivo that the of use PD-1/PD-L1 small-molecule inhibitors may present unique advantages over monoclonal antibodies currently used in the clinic. Our results showed that our small molecule drug candidates inhibit the PD-1/PD-L1 interaction, and lead to the activation of T cells. The possibility of immune checkpoint modulation following a small molecule-based approach can revolutionize immunotherapeutic approaches by overcoming some of the monoclonal antibody limitations, such as limited TME diffusion, in addition to targeting other cellular sources of PD-L1 that are critical to achieve better clinical outcomes. Besides, small molecules are generally less expensive to produce, making them accessible to many. Therefore, these small-molecule drug candidates are promising tools and potential off-the-shelf products to enhance immune checkpoint clinical outcomes.
Data availability statement
All data relevant to the study are included in the article or uploaded as supplementary information.
Ethics statements
Patient consent for publication
Ethics approval
We have complied with all relevant ethical regulations regarding the use of human research participants. The studies were approved by the Medical Ethical Committee of the Instituto Português de Oncologia de Lisboa Francisco Gentil E.P.E. (UC/1310) and Hospital de Santa Maria (1085/13). Peripheral blood and tumor tissues were obtained from patients with a confirmed diagnosis of melanoma, breast, and lung cancer. The written informed consent was obtained from all patients. Participants gave informed consent to participate in the study before taking part.
References
Supplementary materials
Supplementary Data
This web only file has been produced by the BMJ Publishing Group from an electronic file supplied by the author(s) and has not been edited for content.
Footnotes
Twitter @ritaacurcio, @RSFlab, @FlorindoLab
Contributors RCA performed the in silico studies, the PD-1/PD-L1 binding assay, as well as all in vitro, ex vivo and in vivo experiments. SP helped with the three-dimensional spheroid experiments. BC helped with the animal experiments. AB and AF performed the confocal microscopy experiments. MP, SC, VF, JB and LC contributed with the patient-derived tissues. NG-C and LP-C performed the WaterLOGSY NMR experiment. APL helped with the DSF assay. LG and JARS critically advised and contributed in interpreting the results. RCA, RS-F, RCG and HFF conceived and designed the experiments, analyzed the data and wrote and revised the manuscript. RS-F, RCG and HFF act as guarantors, being responsible for the overall content of this manuscript. All the authors commented on the manuscript.
Funding BC and RCA are supported by the Fundação para a Ciência e a Tecnologia, Ministério da Ciência, Tecnologia e Ensino Superior (FCT-MCTES) (PhD grants PD/BD/128238/2016 (RCA) and SFRH/BD/131969/2017 (BC)). The authors thank the funding received from the European Structural & Investment Funds through the COMPETE Programme and from National Funds through FCT under the Programme grant LISBOA-01-0145-FEDER016405 - SAICTPAC/0019/2015 (HF and RCG). HFF and RCA received additional support from FCT-MCTES (UIDB/04138/2020, PTDC/BTM-SAL/4350/2021 and UTAPEXPL/NPN/0041/2021; EXPL/MED-QUI/1316/2021, respectively). The MultiNano@MBM project was supported by The Israeli Ministry of Health, and FCTMCTES, under the frame of EuroNanoMed-II (ENMed/0051/2016; HF and RS-F). HF and RS-F thank the generous financial support from ‘La Caixa’ Foundation under the framework of the Healthcare Research call 2019 (NanoPanther; LCF/PR/HR19/52160021), as well as CaixaImpulse (Co-Vax; LCF/TR/CD20/52700005). MP thanks the financial support from Liga Portuguesa Contra o Cancro – Nucleo Regional do Sul and ‘iNOVA4Health – UIDB/04462/2020’, a program financially supported by Fundação para a Ciência e Tecnologia/Ministério da Educação e Ciência. RS-F thanks the following funding agencies for their generous support: the European Research Council (ERC) Advanced Grant Agreement No. (835227)–3DBrainStrom, ERC PoC Grant Agreement no. 862580 – 3DCanPredict, The Israel Science Foundation (Grant No. 1969/18), The Melanoma Research Alliance (MRA Established Investigator Award n°615808), the Israel Cancer Research Fund (ICRF) Professorship award (n° PROF-18-682), and the Morris Kahn Foundation.
Competing interests RS-F is a Board Director at Teva Pharmaceutical Industries. All other authors declare that they have no competing interests.
Provenance and peer review Not commissioned; externally peer reviewed.
Supplemental material This content has been supplied by the author(s). It has not been vetted by BMJ Publishing Group Limited (BMJ) and may not have been peer-reviewed. Any opinions or recommendations discussed are solely those of the author(s) and are not endorsed by BMJ. BMJ disclaims all liability and responsibility arising from any reliance placed on the content. Where the content includes any translated material, BMJ does not warrant the accuracy and reliability of the translations (including but not limited to local regulations, clinical guidelines, terminology, drug names and drug dosages), and is not responsible for any error and/or omissions arising from translation and adaptation or otherwise.