Article Text

Abstract
Background Immunotherapies targeting programmed cell death-1 (PD-1) and its ligands have improved clinical outcomes for advanced melanoma. However, many tumors exhibit primary resistance or acquire secondary resistance after an initial positive response. The mechanisms of resistance are not well understood, and no validated predictive biomarkers are available. This exploratory study aimed to characterize baseline differences and molecular changes arising during treatment in acral and mucosal melanomas that exhibited primary or secondary resistance to anti-PD-1 monotherapy.
Methods This was an observational retrospective study of 124 patients who had been treated for metastatic acral or mucosal melanoma with anti-PD-1 monotherapy. Tumor samples were collected at baseline (all patients) and post-treatment (resistant tumors only) and were assayed by immunohistochemistry, whole-exome sequencing, and RNA sequencing.
Results At baseline, more non-progressor than resistant tumors exhibited expression of PD-L1, immune cell infiltration, and high tumor mutational burden (TMB); baseline PD-L1 expression was also more common in secondary-resistant than in primary-resistant tumors as well as in late versus early secondary-resistant tumors. Non-progressor tumors also had higher median baseline expression of an 18-gene T cell-inflamed gene expression profile (TcellinfGEP). Among resistant tumors, the proportion of PD-L1-positive melanomas and the expression of the TcellinfGEP mRNA signature increased during treatment, while the expression of mRNA signatures related to WNT and INFA1 signaling decreased. There was evidence for greater changes from baseline in secondary-resistant versus primary-resistant tumors for some markers, including expression of RAS-related and WNT-related mRNA signatures and density of CD11c+ and FOXP3+ T cells. Greater changes in CD11c+ cell density were observed in early compared with late secondary-resistant tumors.
Conclusions Our findings suggest that TcellinfGEP and PD-L1 expression, TMB, immune cell infiltration, and RAS and WNT signaling warrant further investigation as potential mechanisms and/or biomarkers of anti-PD-1 therapy resistance in acral and mucosal melanomas. Confirmation of these findings in larger populations is needed.
- Melanoma
- Programmed Cell Death 1 Receptor
- Biomarkers, Tumor
Data availability statement
Data are available upon reasonable request. Merck Sharp & Dohme LLC, a subsidiary of Merck & Co., Rahway, New Jersey, USA (MSD) is committed to providing qualified scientific researchers access to anonymized data and clinical study reports from the company’s clinical trials for the purpose of conducting legitimate scientific research. MSD is also obligated to protect the rights and privacy of trial subjects and, as such, has a procedure in place for evaluating and fulfilling requests for sharing company clinical trial data with qualified external scientific researchers. The MSD data sharing website (available at http://engagezone.msd.com/ds_documentation.php) outlines the process and requirements for submitting a data request. Applications will be promptly assessed for completeness and policy compliance. Feasible requests will be reviewed by a committee of MSD subject matter experts to assess the scientific validity of the request and the qualifications of the requestors. In line with data privacy legislation, submitters of approved requests must enter into a standard data-sharing agreement with MSD before data access is granted. Data will be made available for request after product approval in the USA and European Union or after product development is discontinued. There are circumstances that may prevent MSD from sharing requested data, including country-specific or region-specific regulations. If the request is declined, it will be communicated to the investigator. Access to genetic or exploratory biomarker data requires a detailed, hypothesis-driven statistical analysis plan that is collaboratively developed by the requestor and MSD subject matter experts; after approval of the statistical analysis plan and execution of a data-sharing agreement, MSD will either perform the proposed analyses and share the results with the requestor or will construct biomarker covariates and add them to a file with clinical data that is uploaded to an analysis portal so that the requestor can perform the proposed analyses.
This is an open access article distributed in accordance with the Creative Commons Attribution Non Commercial (CC BY-NC 4.0) license, which permits others to distribute, remix, adapt, build upon this work non-commercially, and license their derivative works on different terms, provided the original work is properly cited, appropriate credit is given, any changes made indicated, and the use is non-commercial. See http://creativecommons.org/licenses/by-nc/4.0/.
Statistics from Altmetric.com
WHAT IS ALREADY KNOWN ON THIS TOPIC
Immunotherapies are a common treatment option for all histological subtypes of advanced melanoma. However, many melanomas fail to respond to antiprogrammed cell death-1 (PD-1) therapy, indicating primary resistance, and a subset of initial responders subsequently acquire secondary resistance, as indicated by disease progression during treatment. The molecular mechanisms of resistance to anti-PD-1 therapy are not yet fully understood.
WHAT THIS STUDY ADDS
This study reports initial evidence for several baseline and treatment-associated characteristics of acral and mucosal melanomas, including markers of T-cell activity and RAS and WNT signaling, that may inform our understanding of resistance to anti-PD-1 monotherapy.
HOW THIS STUDY MIGHT AFFECT RESEARCH, PRACTICE AND/OR POLICY
The correlations reported herein should be considered for hypothesis-testing studies to determine their direct relevance to resistance mechanisms, which may inform rational combination therapies to improve immunotherapy efficacy.
Background
Melanomas are increasingly common cancers.1–3 The most common form of the disease in white populations is cutaneous superficial spreading melanoma, while acral lentiginous and mucosal melanomas predominate in Asian populations.4–6 Cutaneous superficial spreading melanomas generally have a high tumor mutational burden (TMB) and mutational signatures characteristic of ultraviolet (UV) radiation damage.7 8 In contrast, acral and mucosal melanomas typically occur in sun-protected areas of the body and generally have a lower TMB, as well as other molecular differences.7 9–11 Both forms are typically diagnosed at a later stage than cutaneous superficial spreading melanoma, with mucosal melanomas in particular being more likely to be metastatic at the time of diagnosis; there is also evidence for worse overall clinical outcomes, independent of stage.6 12 13
Despite these biological and clinical differences, current systemic treatments are similar for all forms of melanoma. Therapies directed against anticytotoxic T lymphocyte-associated antigen-4 (CTLA-4) or specific B-raf proto-oncogene serine/threonine kinase (BRAF) mutations have improved treatment options for some individuals but eventually fail for most patients.14 More recently, nivolumab and pembrolizumab were approved as first-line therapies for advanced melanoma. These drugs block the checkpoint inhibitor programmed cell death-1 (PD-1) and its ligands (PD-L1 and PD-L2) and have improved clinical outcomes compared with other options, with a better safety profile.15–22 However, many melanomas fail to respond to anti-PD-1 therapy, indicating primary resistance, and a subset of initial responders subsequently acquire secondary resistance, as indicated by disease progression during treatment.15 17 19–21 23–25
The molecular mechanisms of resistance to anti-PD-1 therapy are not yet fully understood but may be related to inhibition of T-cell activity, since greater infiltration of lymphocytes into primary melanomas is associated with better outcomes and the presence of CD8+ T cells at melanoma tumor margins has been suggested to predict response to anti-PD-1 therapy.26–28 Mutations or expression changes in beta-2-microglobulin, BRAF, phosphatase and tensin (PTEN) homolog, and interferon gamma (IFNG) signaling also potentially contribute to resistance via their effects on T-cell infiltration and antigen presentation.25 29 Gene expression signatures suggestive of a T cell-inflamed tumor microenvironment (TME), as well as signatures related to WNT and PTEN signaling, may also play a role.20 30–33 A study of four secondary-resistant melanoma samples suggested an association between resistance and alterations in interferon signaling and antigen presentation pathways25; a similar study of four non-small cell lung cancers identified the emergence of mutations during nivolumab treatment that may affect neoantigen presentation.26 Finally, an analysis of 68 paired advanced melanoma samples identified signatures of T-cell infiltration and IFNG signaling that may be associated with response and resistance to nivolumab therapy.34
The work described earlier was conducted primarily in cutaneous superficial spreading melanomas. Among the few relatively small studies assessing immune checkpoint inhibitor therapy in patients with acral and mucosal melanoma, most reported improved prognosis compared with other therapeutic options, but some reported that the benefits were not as great as for patients with superficial spreading melanoma.35–40 Acral and mucosal melanomas may be less responsive to immunotherapy due to lower TMB compared with UV-driven forms of the disease.7 41 Specific clinical guidelines for the treatment of these tumors are needed, as are predictive biomarkers for primary and secondary resistance to anti-PD-1 therapy, to guide treatment selection and the development of the next generation of therapies and drug combinations.
The objectives of the current exploratory study were to compare the baseline molecular profiles of non-progressor and resistant tumors, as well as pretreatment and post-treatment samples from resistant tumors, to identify changes in the profiles of biomarkers related to T-cell function, TMB and other phenotypes of interest. Further comparisons between primary-resistant and secondary-resistant tumors, and between tumors displaying early and late secondary resistance, were included for both objectives.
Methods
Study design
This retrospective, observational, exploratory study was designed to generate hypotheses for future biomarker discovery and validation research.
Study sample
The study population comprised adults (≥18 years of age at diagnosis) with histologically confirmed metastatic acral or mucosal melanoma, or metastatic tumor of unknown primary origin with the clinical appearance of mucosal melanoma. Patients had initiated treatment with an anti-PD-1 monotherapy (pembrolizumab or nivolumab) under routine care as first-line or second-line therapy at the Samsung Medical Center in Seoul, South Korea, between January 2015 and June 2019, with ≥3 months of follow-up after treatment.
Demographic and clinical data were obtained from electronic medical records. BRAF, KIT proto-oncogene, receptor tyrosine kinase (KIT), and NRAS proto-oncogene, GTPase (NRAS) gene status were determined as part of routine clinical care using the Oncomine assay (Thermo Fisher Scientific, Waltham, Massachusetts, USA). Patients had available archived formalin-fixed, paraffin-embedded tumor tissue (FFPET) specimens at baseline (within 1 year prior to the start of anti-PD-1 treatment if possible, with no other treatment interventions during that time) and no history of previous anti-PD-1 therapy. Most patients with resistant tumors also had available FFPET specimens taken at the time of or after the first observation of resistance (four patients had on-treatment specimens taken prior to onset of resistance). Exclusion criteria were treatment with anti-PD-1 therapy in combination with any other agent; concurrent malignancy, or history of another malignancy, at the time anti-PD-1 therapy began (exceptions were made for patients who had been disease-free for ≥3 years prior to melanoma diagnosis); history of HIV infection or other immunodeficiency; or history of systemic steroid therapy or any other form of immunosuppressive therapy within 7 days prior to the first dose of anti-PD-1 therapy.
Three groups of patients were selected: (1) those with primary resistance to anti-PD-1 monotherapy, (2) those with secondary resistance to anti-PD-1 monotherapy, and (3) those who responded to therapy and did not progress during the course of the study. Resistance status was determined based on best overall response (BOR), as measured by Response Evaluation Criteria in Solid Tumors V.1.1.42 The anti-PD-1 therapy non-progressor group were those who had received anti-PD-1 monotherapy for ≥90 days and achieved partial response (PR) or complete response (CR) without subsequent progression during the study follow-up period. Primary resistance was initially defined as BOR of progressive disease (PD), or of CR, PR, or stable disease (SD) for <90 days before an observation of PD. Secondary resistance was initially defined as BOR of CR, PR, or SD for ≥90 days, but with subsequent evidence of PD, excluding pseudo-progression. This latter group was also stratified into early and late progression, defined as progression <1 year or ≥1 year, respectively, after BOR. During the study period, the resistance taskforce of the Society for Immunotherapy of Cancer (SITC) published new recommendations for defining primary and secondary resistance to anti-PD-1 therapy.43 Briefly, the SITC guidelines recommend a 180-day threshold for secondary resistance in place of the 90-day cut-off defined in the original study protocol, and therefore classify a greater proportion of drug-resistant tumors as exhibiting primary resistance. Detailed definitions are listed in table 1. The original study definitions were used for all analyses that compared non-progressor to overall resistant tumor characteristics. Analyses that compared the characteristics of tumors demonstrating primary and secondary resistance were conducted using both the original and the SITC definitions.
Patient group definitions and sample sizes
Tissue and blood sample collection and biomarker assays
The immunohistochemistry (IHC) assays for PD-L1 were performed at the Samsung Medical Center. Tumor PD-L1 expression was measured on a Dako Autostainer Link 48 system (Agilent Technologies, Santa Clara, California, USA) using the Dako PD-L1 IHC 22C3 pharmDx kit with the EnVision FLEX visualization system (Agilent Technologies). A qualified pathologist performed MEL score categorization; a MEL score of≥2 (ie, ≥1% membrane staining in tumor and tumor-associated immune cells) was considered positive.44 The IHC assays for CD8, CD11c, and FOXP3 status in regulatory T cells were performed at the Research Laboratories of Merck & Co. (South San Francisco, California, USA). Triplex staining was conducted on a Bond RX stainer (Leica Biosystems, Buffalo Grove, Ilinois, USA) using tyramide signal amplification (TSA) amplification-based Opal multiplexing reagents (Akoya Biosciences, Marlborough, Massachusetts, USA). Each primary antibody (anti-FOXP3 clone 236A/E7; Abcam, Boston, Massachusetts, USA; anti-CD8 clone C8/144B, Agilent Technologies; anti-CD11c clone 5D11, Leica Biosystems) was incubated for 60 min, followed by application of Opal polymer horseradish peroxidase (HRP) secondary antibody and TSA-conjugated Opal fluorophore (Akoya Biosciences). Binding of anti-FOXP3 antibody was detected using Opal 520, anti-CD8 using Opal 570, and anti-CD11c using Opal 690. Antibody stripping was performed using ER1 buffer (Leica Biosystems) after each staining cycle. Nuclei were detected using Spectral DAPI (Akoya Biosciences). Stained slides were scanned using the Vectra Polaris Imaging System (Akoya Biosciences) at ×20 magnification. Image tiles were deconvoluted using inForm software (Akoya Biosciences) and stitched into whole slide images using Halo software (Indica Labs, Albuquerque, New Mexico, USA). The numbers of positive cells per square millimetre (density) was calculated for each analyte. All staining, thresholding, and quantitation were reviewed by a qualified pathologist.
Extraction of DNA and RNA for whole-exome sequencing (WES) and RNA sequencing (RNA-Seq) assays was performed by Almac Group (Souderton, Pennsylvania, USA). Samples underwent pathology review and microdissection to identify and enrich tumor content.
DNA was extracted using the QIAamp FFPET DNA extraction kit (QIAGEN, Hilden, Germany). The WES assays were performed by NeoGenomics Laboratories (Fort Myers, Florida, USA). Five randomly selected patient blood samples were used to calibrate the WES assays. Libraries were prepared using the SureSelectXT LibraryPrep Kit and SureSelectXT V.5 target enrichment kit (Agilent Technologies). Sequencing was performed using the HiSeq 4000 platform (2×100 bp; Illumina, San Diego, California, USA). Sequencing reads were aligned to the human genome reference sequence (GRCh37-hg19) using the Burrows-Wheeler Alignment (BWA) maximal exact matches (MEM; BWA-MEM) algorithm (V.1.114) and Genome Analysis Toolkit (V.2) to generate analysis-ready BAM files.45 46 TMB was defined as the count of somatic non-synonymous mutations per exome and was calculated using MuTect V.1, Variant Effect Predictor, and PureCN V.1.6.3.47–50 The threshold of 175 mutations per exome for TMB-high versus TMB-low corresponds to the US Food and Drug Administration-approved clinical cut-off for TMB-high of 10 mutations/Mb using the FoundationOne CDx assay.51
RNA extraction was performed using the FFPET RNA Isolation Kit (Roche, Basel, Switzerland). The RNA-Seq assays were performed by the Almac Group. RNA-Seq libraries were prepared using the Illumina TruSeq RNA Exome protocol. All sequencing was performed on the NovaSeq 6000 (Illumina) with 2×51 bp read length. FASTQ files were generated and sequencing reads aligned to human GRCh37/hg19 using the Omicsoft sequence aligner.52 Gene expression levels were quantified by upper quantile normalized fragments per kilobyte of transcript per million mapped reads (log10).
A T cell-inflamed TME gene expression signature (TcellinfGEP) score has been previously derived across several solid tumors.53 It comprises the following 18 mRNAs related to antigen presentation, chemokine expression, cytolytic activity, and adaptive immune resistance: CCL5, CD27, CD274 (PD-L1), CD276 (B7-H3), CD8A, CMKLR1, CXCL9, CXCR6, HLA-DQA1, HLA-DRB1, HLA-E, IDO1, LAG3, NKG7, PDCD1LG2 (PD-L2), PSMB10, STAT1, and TIGIT. TcellinfGEP scores were calculated as a weighted sum of normalized expression values for the 18 genes, as described previously.53 Twelve additional RNA expression signatures comprising consensus gene sets representative of key tumor biology and microenvironment elements were derived as previously described.54–57
Analysis
Biomarker results were merged with clinical and outcome information for analysis using SAS software and R. Descriptive statistics were used to compare biomarker status between patient groups. Patient-matched paired analyses were used to compare pretreatment and post-treatment samples, adjusting for baseline measurements; mRNA signatures were further adjusted for TcellinfGEP expression levels. The densities of CD8+, CD11c+, and FOXP3+ cells were analyzed on a logarithmic scale. Given the exploratory and hypothesis-generating nature of this study, no formal statistical testing was performed, but effect sizes for change from baseline and area under the receiver operator curve (AUROC) for group comparisons between groups and 95% CIs are presented.
Results
Patients
A total of 124 patients met the original study criteria, with most tumors (n=110) considered to be anti-PD-1 therapy-resistant, while a smaller group of non-progressors (n=14) was also included (table 1). A total of 108 patients also met the criteria for classification of resistance according to the updated SITC-based definitions (table 1).43 Patient demographic, clinical, and treatment characteristics are summarized in table 2, with further details provided in online supplemental tables 1 and 2. The mean age at baseline biopsy was 59.5 (SD 12.4) years. Sixty-one percent of tumors were acral melanomas; 36% were mucosal melanomas; and 3% were unknown primaries but presumed to be mucosal melanomas; online supplemental table 3 provides patient characteristics by acral versus mucosal/unknown histology. Most tumors were wild-type for the BRAF (86%), KIT (95%), and NRAS (86%) genes. Almost all (95%) of the patients included in the study had metastatic disease at the time of baseline biopsy. Eighty-seven percent of patients had no prior systemic therapy; all those who had received prior therapy (primarily dacarbazine) were in the resistant tumor group. Most patients (84%) received pembrolizumab as their anti-PD-1 therapy, with the remainder receiving nivolumab. At the time of data cut-off, the median duration of anti-PD-1 therapy was 6.3 (range 1.3–45.0) months among all patients, 23.2 (range 9.4–38.4) months among non-progressors, and 5.4 (range 1.3–45.0) months among patients with resistant tumors. The median duration of response among patients with resistant tumors was 4.7 months. Among the 14 non-progressors, half had a BOR of CR and half of PR; among patients with secondary resistance according to the original study definition, 6.1% had a BOR of CR, 44.9% of PR, and 49.0% of SD. All non-progressors were alive at the time of the last follow-up, compared with 46% of patients with resistant tumors (36% for primary-resistant tumors and 57% for secondary-resistant tumors).
Supplemental material
Patient demographic, clinical, and treatment characteristics*
When using the original definitions of primary and secondary resistance, the median duration of therapy was 2.8 months and 12.4 months, respectively, and the median duration of response was 1.6 months and 7.9 months. When using the SITC definition, the median duration of therapy for primary and secondary resistance was 3.5 months and 13.9 months, respectively, and the median duration of response was 1.9 months and 11.3 months.
Baseline biomarker differences between groups
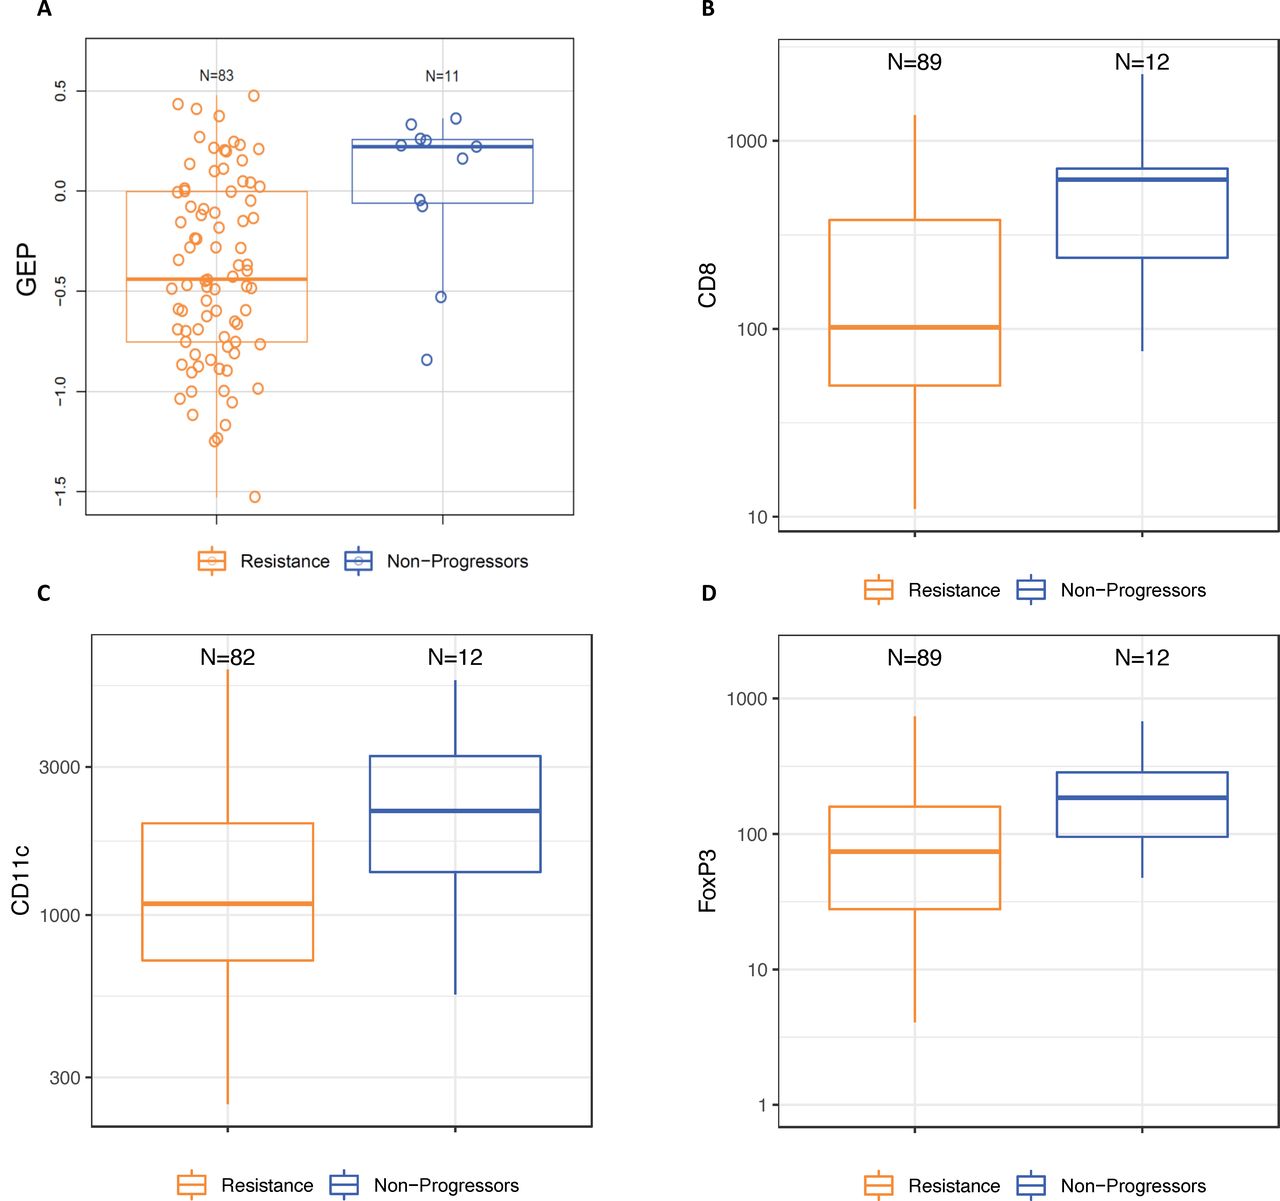
The median baseline TMB for all patients was 130 mutations/exome, and 20% of tumors were classified as TMB-high (≥175 mutations/exome). The proportion of TMB-high tumors was numerically higher among the non-progressor group (40%) compared with the resistant group (17%) and for tumors with late secondary resistance (25%) compared with early secondary resistance (5%), but there was no difference in baseline TMB between primary-resistant and all secondary-resistant tumors (data not shown). The median baseline expression of the TcellinfGEP mRNA signature was numerically higher in non-progressor than in resistant tumors (AUROC) (0.78, 95% CI 0.62 to 0.94; online supplemental table 4 and figure 1). Following adjustment for TcellinfGEP, none of the other mRNA expression signatures differed between these groups (online supplemental table 4). No baseline differences in any mRNA signature were observed between tumors displaying early versus late secondary resistance (data not shown).

Baseline characteristics of non-progressor and resistant tumors (A) Expression of an 18-gene TcellinfGEP; (B) density of infiltrating immune cells expressing CD8; (C) density of infiltrating immune cells expressing CD11c; (D) density of infiltrating immune cells expressing FOXP3. Resistance was classified using the original study definitions. Box and whisker plots represent the distribution of biomarker values: median, first and third quartiles, minimum and maximum values. GEP, gene expression profile; TcellinfGEP, T cell-inflamed gene expression profile.
Thirty-five percent of patients were classified as having PD-L1-positive tumors. The proportion of patients with PD-L1-positive tumors was numerically higher for non-progressors than for the resistant group (54% vs 32%), for the secondary than for the primary resistance group (original definition, 42% vs 24%; SITC definition, 43% vs 27%), and for late versus early secondary-resistant tumors under the original definition (60% vs 33%, online supplemental figure 1). The median baseline densities of infiltrating immune cells expressing CD8, CD11c, and FOXP3 were also numerically higher in non-progressor than in resistant tumors (online supplemental table 5 and figure 1). The densities of CD8+ and FOXP3+ T cells were numerically higher in early versus late secondary-resistant tumors (AUROC=0.66 (95% CI 0.44 to 0.88) and 0.64 (0.44 to 0.85), respectively), but no difference was observed between these groups in the baseline density of CD11c+ T cells (AUROC=0.48 (95% CI 0.27 to 0.69)).
Biomarker changes following treatment in resistant tumors
Pretreatment and post-treatment samples were compared for all resistant tumors with available paired sample assay data. In resistant patients overall, immune cell infiltration markers and TMB did not change significantly between the baseline and post-treatment timepoints (data not shown). The proportion of PD-L1-positive tumors increased from a baseline level of 28% to 51% following treatment. The expression level of the TcellinfGEP mRNA signature increased in resistant tumors following treatment, while expression of the WNT and IFNA signatures decreased (online supplemental table 4 and figure 2).
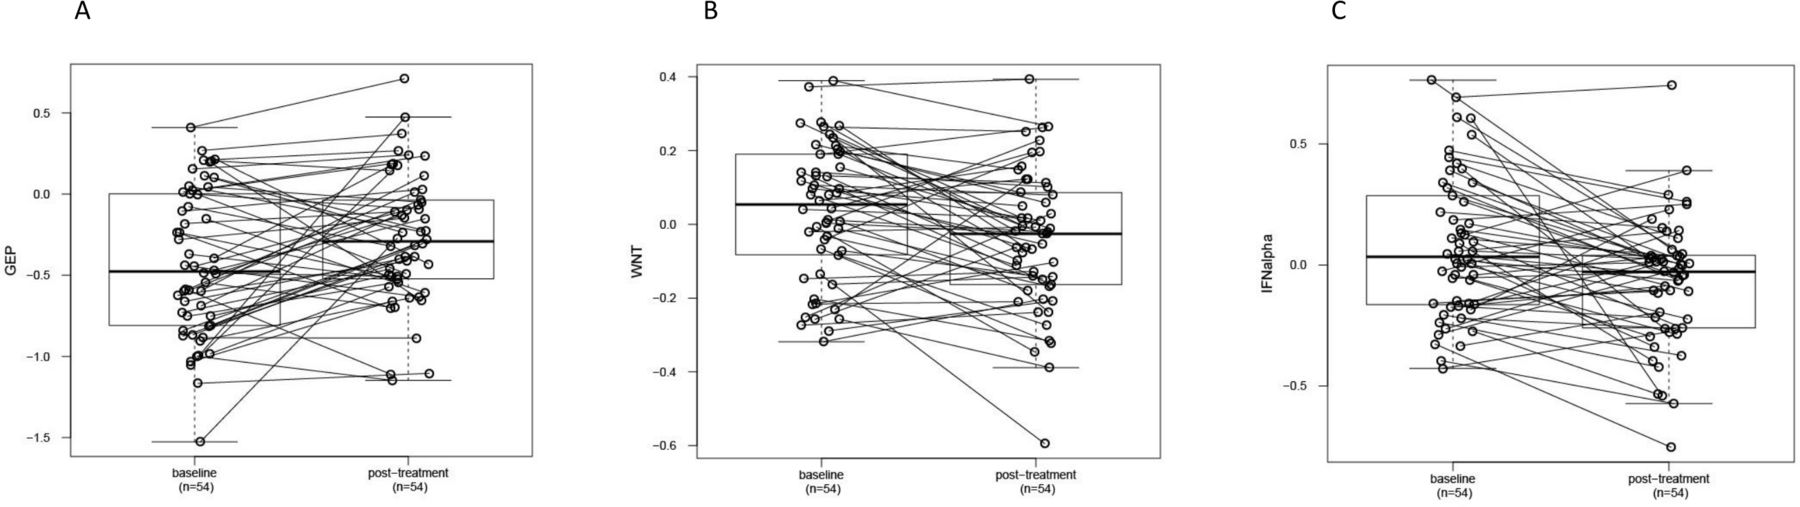
Post-treatment changes in gene expression profiles reflecting (A) T-cell inflammation (TcellinfGEP), (B) WNT signaling, and (C) IFNA1 signaling compared with baseline in resistant tumors. Resistance was classified using the original study definitions. WNT and IFNA1 signaling-related gene expression profile levels were adjusted for GEP values. Circles and connecting lines represent paired samples from pretreatment and post-treatment tumors. Box and whisker plots represent the distribution of biomarker values: median, first and third quartiles, and minimum and maximum values. GEP, gene expression profile; TcellinfGEP, T cell-inflamed gene expression profile.
Biomarker differences between tumors with primary versus secondary resistance
Following treatment, no differences in the magnitude of change from baseline for TMB or PD-L1 were observed between primary-resistant and secondary-resistant tumors, by either definition (data not shown). However, suggestive differences were observed for some mRNA signatures. Specifically, secondary-resistant tumors underwent a more pronounced change in expression of RAS-related and WNT-related signatures than did primary-resistant tumors; the difference was greater when patients were categorized using the SITC-based definitions (online supplemental table 4 and figure 3). In contrast, the change from baseline expression of an mRNA signature reflecting tumor infiltration with granulocytic myeloid-derived suppressor cells was greater in primary-resistant than in secondary-resistant tumors, with the difference being slightly smaller when the SITC-based definitions were used to distinguish the two groups (online supplemental table 4 and figure 3).

Differences in post-treatment changes in primary versus secondary resistant tumors. (A–C) Expression of select RNA signatures, original study definitions of resistance. (A) gMDSCs, (B) WNT signaling, and (C) RAS signaling. (D,E) Expression of select RNA signatures; SITC definitions of resistance. (D) gMDSCs, (E) WNT signaling, and (F) RAS signaling. (G,H) Densities of infiltrating immune cells, original study definitions of resistance. (G) CD11c+ cells and (H) FOXP3+ cells. (I,J) densities of infiltrating immune cells; SITC definitions of resistance. (I) CD11c+ cells; (J) FOXP3+ cells. RNA expression values were adjusted for expression of an 18-gene TcellinfGEP. Box and whisker plots represent the distribution of biomarker values: median, first and third quartiles, and minimum and maximum values. Solid circles denote patients whose tumors were categorized as exhibiting secondary resistance using the original study definition but primary resistance using the SITC definition. gMDSC, granulocytic myeloid-derived suppressor cell; SITC, Society for Immunotherapy of Cancer; TcellinfGEP, T cell-inflamed gene expression profile.
We also observed suggestive differences between primary-resistant and secondary-resistant tumors in terms of treatment-associated changes in markers of immune cell infiltration. The changes in the densities of CD11c+ and FOXP3+ T cells were greater in secondary-resistant than in primary-resistant tumors, with slightly greater differences in FOXP3 expression observed when distinguishing between groups using the SITC-based definitions of resistance (online supplemental table 5 and figure 3). Change from baseline CD11c+ cell density was numerically greater for early versus late secondary-resistant tumors (AUROC=0.69 (95% CI 0.45 to 0.93)), but this was not the case for CD8+ or FOXP3+ T cells (AUROC=0.61 (95% CI 0.39 to 0.85) and 0.49 (95% CI 0.24 to 0.74), respectively), nor were any differences observed between these groups in the change from baseline of any mRNA signature tested (data not shown).
Discussion
In this study, we observed suggestive molecular differences between baseline and post-treatment samples of anti-PD-1-resistant acral and mucosal melanomas, including changes related to TME T-cell inflammation and WNT and IFN signaling. We also found suggestive evidence of distinct differences between primary-resistant and secondary-resistant tumors in the magnitude of treatment-associated changes in RAS and WNT signaling, as well as T-cell infiltration. Further, we identified lower levels of TcellinfGEP, PD-L1, TMB, and immune cell infiltration (particularly by CD8+ T cells) as potential baseline predictors of resistance.
Our findings are consistent with previous reports that resistance to anti-PD-1 immunotherapy may involve suppression of T-cell function.25–29 31–33 58 The observed increase in TcellinfGEP signature expression in resistant tumors during treatment is consistent with a recent report that anti-PD-1 therapy increased T-cell inflammatory signaling in all tumors, with the largest increase observed in tumors that responded.34 Likewise, the WNT and RAS/RAF/MAPK pathways have been previously reported to be involved in resistance to anticancer therapies, including immunotherapies, in several tumor types.59–66 WNT signaling may be related to immune exclusion,34 67–71 while altered RAS signaling has been shown to stabilize PD-L1 mRNA and increase the expression of the ligand, potentially contributing to immune evasion.60 We also observed a decrease in the IFNA signature. IFNA plays an important role in inducing tumor immunity72; however, it may also have direct antiproliferative effects and thus may contribute to tumor resistance via non-immune-related mechanisms.73
In line with previous reports, we found that a lower baseline T-cell density was a strong predictor of resistance, particularly for CD8+ T cells.28 34 74 75 While we did not observe overall changes in immune cell density from baseline to post-treatment in resistant tumors, there was some evidence that tumors with secondary resistance underwent greater changes from baseline in FOXP3+ and CD11c+ cell density compared with primary-resistant tumors. The role of immune cell infiltrates in the TME is complex and there may be subset heterogeneity even within each type of immune cell marker. CD8+ T cells are key cytotoxic cells involved in antitumor activity,76 while CD11c+ T cells may represent a unique population of regulatory T cells with effector potential.77 CD11c expression may also be indicative of antigen-presenting dendritic cells that promote antitumor responses, but that can become defective and contribute to immune suppression.78 Cells with FOXP3 expression often have a T-regulatory function, but CD8+FOXP3+ T cells may also have lytic antitumor ability, depending on the TME.79
Much of the prior work on anti-PD-1 therapy resistance was conducted in cutaneous superficial spreading melanomas. Understanding the distinct characteristics of acral and mucosal melanomas is crucial to the development of improved clinical guidelines for the treatment of these tumors. For example, we observed an association between lower baseline TMB and treatment resistance; we also observed that the median baseline TMB for our sample was lower than that previously reported for cutaneous superficial spreading melanomas, which are often driven by UV radiation-induced DNA damage.7 41 Given that TMB is related to tumor antigenicity and the ability of CD8+ T cells to localize to a tumor, this finding may indicate the need for distinct therapeutic approaches for melanomas with different etiologies, including additional methods to increase antigenicity.
Study limitations are noted. This was an exploratory study with a relatively small sample size, especially for analyses broken down by resistance subcategories, and we were unable to further stratify results by acral and mucosal subtypes due to sample size limitations. The results should be considered descriptive and hypothesis-generating and interpreted with caution. Nevertheless, this was to our knowledge the largest study to date to include comprehensive baseline and post-treatment characterization of acral and mucosal melanomas treated with anti-PD-1 monotherapy. The sample population was drawn from a single large tertiary teaching hospital, and more complex or severe cases of advanced melanoma may therefore be over-represented. For example, no patients with Eastern Cooperative Oncology Group grade 0 were included in the sample. Further, the population was selected based on resistant or long-term non-progressor status. Thus, the generalizability of the findings, especially to non-Asian populations, is unknown. Patient demographic and clinical characteristics were comprehensively described to facilitate comparisons to future study samples. No paired samples of non-progressor tumors were available, as post-treatment biopsies were not included in the standard of care for these individuals. Further, due to variation in the timing of post-treatment biopsies, comparisons of changes in biomarker profiles between tumors exhibiting primary and secondary resistance could be confounded by other potential factors that may change over time during the course of disease. Finally, although anti-PD-1 therapies are increasingly being used in combination with other agents,14 only tumors treated with anti-PD-1 monotherapy were included in the study; resistance mechanisms and biomarkers may be different in tumors treated with a combination of therapies.
In conclusion, this study reports initial evidence for several tumor baseline and treatment-associated characteristics, including markers of T-cell activity and RAS and WNT signaling, that may inform our understanding of resistance to anti-PD-1 monotherapy. The correlations reported herein should be considered for hypothesis-testing studies to determine their direct relevance to resistance mechanisms, which may lead to the development of combination therapies to restore immunotherapy efficacy. These results warrant additional investigation; conducting larger studies in these rarer melanoma types and further integrating these data with similar data from other studies would allow for confirmation of these findings as well as potential stratification between types. The acral and mucosal subtypes of melanoma are rare compared with cutaneous melanoma but present a significant clinical challenge in Asian populations due to their high relative prevalence and poor treatment outcomes with current approved therapies. Several mechanisms of resistance described in this study could be actionable with combination therapies, and future research directions should explore such combinations targeted toward these subtypes.
Supplemental material
Data availability statement
Data are available upon reasonable request. Merck Sharp & Dohme LLC, a subsidiary of Merck & Co., Rahway, New Jersey, USA (MSD) is committed to providing qualified scientific researchers access to anonymized data and clinical study reports from the company’s clinical trials for the purpose of conducting legitimate scientific research. MSD is also obligated to protect the rights and privacy of trial subjects and, as such, has a procedure in place for evaluating and fulfilling requests for sharing company clinical trial data with qualified external scientific researchers. The MSD data sharing website (available at http://engagezone.msd.com/ds_documentation.php) outlines the process and requirements for submitting a data request. Applications will be promptly assessed for completeness and policy compliance. Feasible requests will be reviewed by a committee of MSD subject matter experts to assess the scientific validity of the request and the qualifications of the requestors. In line with data privacy legislation, submitters of approved requests must enter into a standard data-sharing agreement with MSD before data access is granted. Data will be made available for request after product approval in the USA and European Union or after product development is discontinued. There are circumstances that may prevent MSD from sharing requested data, including country-specific or region-specific regulations. If the request is declined, it will be communicated to the investigator. Access to genetic or exploratory biomarker data requires a detailed, hypothesis-driven statistical analysis plan that is collaboratively developed by the requestor and MSD subject matter experts; after approval of the statistical analysis plan and execution of a data-sharing agreement, MSD will either perform the proposed analyses and share the results with the requestor or will construct biomarker covariates and add them to a file with clinical data that is uploaded to an analysis portal so that the requestor can perform the proposed analyses.
Ethics statements
Patient consent for publication
Ethics approval
This study involves human subjects and was approved by the Samsung Medical Center institutional review board (IRB).
Acknowledgments
The authors thank Li Ma, MS, Fansen Kong, MS, Jared Lunceford, PhD, and Steven Mathew Townson, PhD of Merck & Co., Inc., Rahway, NJ, USA for their support.
The authors also thank Cath Ennis, PhD, in collaboration with ScribCo for medical writing assistance.
References
Supplementary materials
Supplementary Data
This web only file has been produced by the BMJ Publishing Group from an electronic file supplied by the author(s) and has not been edited for content.
Footnotes
Contributors IS: guarantor of the finished work; conception, design, or planning of the study; analysis of the data; acquisition of the data; drafting of the manuscript; and critically reviewing or revising the manuscript for important intellectual content. XQL: analysis of the data, interpretation of the results, and drafting of the manuscript. QZ: analysis of the data, drafting of the manuscript, and critically reviewing or revising the manuscript for important intellectual content. STK: acquisition of the data, interpretation of the results, and drafting of the manuscript. YS: analysis of the data, acquisition of the data, and drafting of the manuscript. JHY and RC: analysis of the data, interpretation of the results, and critically reviewing or revising the manuscript for important intellectual content. TC: acquisition of the data and critically reviewing or revising the manuscript for important intellectual content. AW and JL: conception, design, or planning of the study; and critically reviewing or revising the manuscript for important intellectual content. CK: conception, design, or planning of the study; analysis of the data; acquisition of the data; interpretation of the results; critically reviewing or revising the manuscript for important intellectual content.
Funding The study was sponsored by Merck Sharp & Dohme LLC, a subsidiary of Merck & Co., Rahway, New Jersey, USA.
Competing interests IS, XQL, QZ, YS, JHY, TC, AW, CK, and RC are employees of Merck Sharp & Dohme LLC, a subsidiary of Merck & Co., Rahway, New Jersey, USA, and may have stock in Merck & Co., Rahway, New Jersey, USA. All remaining authors have declared no conflicts of interest.
Provenance and peer review Not commissioned; externally peer reviewed.
Supplemental material This content has been supplied by the author(s). It has not been vetted by BMJ Publishing Group Limited (BMJ) and may not have been peer-reviewed. Any opinions or recommendations discussed are solely those of the author(s) and are not endorsed by BMJ. BMJ disclaims all liability and responsibility arising from any reliance placed on the content. Where the content includes any translated material, BMJ does not warrant the accuracy and reliability of the translations (including but not limited to local regulations, clinical guidelines, terminology, drug names and drug dosages), and is not responsible for any error and/or omissions arising from translation and adaptation or otherwise.