Article Text

Abstract
Background Clinical studies have highlighted the efficacy of anti-programmed death 1 (αPD-1) monoclonal antibodies in patients with DNA mismatch repair-deficient (MMRD) tumors. However, the responsiveness of MMRD cancers to αPD-1 therapy is highly heterogeneous, and the origins of this variability remain not fully understood.
Methods 4T1 and CT26 mouse tumor cell lines were inactivated for the MMRD gene Msh2, leading to a massive accumulation of mutations after serial passages of cells. Insertions/deletion events and mutation load were evaluated by whole exome sequencing. Mice bearing highly mutated MMRD tumor or parental tumors were treated with αPD-1 and tumor volume was monitored. Immune cell type abundance was dynamically assessed in the tumor microenvironment and the blood by flow cytometry. Neutrophils were depleted in mice using αLY6G antibody, and regulatory T (Treg) cell population was reduced with αCD25 or anti-cytotoxic T-lymphocytes-associated protein 4 (αCTLA-4) antibodies. Patients with MMRD tumors treated with immune checkpoint blockade-based therapy were retrospectively identified and neutrophil-to-lymphocyte ratio (NLR) was evaluated and examined for correlation with clinical benefit.
Results By recapitulating mismatch repair deficiency in different mouse tumor models, we revealed that elevated circulating tumor-induced neutrophils (TIN) in hypermutated MMRD tumors hampered response to αPD-1 monotherapy. Importantly, depletion of TIN using αLy-6G antibody reduced Treg cells and restored αPD-1 response. Conversely, targeting Treg cells by αCD25 or αCTLA-4 antibodies limited peripheral TIN accumulation and elicited response in αPD-1-resistant MMRD tumors, highlighting a crosstalk between TIN and Treg cells. Thus, αPD-1+αCTLA-4 combination overcomes TIN-induced resistance to αPD-1 in mice bearing MMRD tumors. Finally, in a cohort of human (high microsatellite instability)/MMRD tumors we revealed that early on-treatment change in the NLR ratio may predict resistance to αPD-1 therapy.
Conclusions TIN countered αPD-1 efficacy in MMRD tumors. Since αCTLA-4 could restrict TIN accumulation, αPD-1+αCTLA-4 combination overcomes αPD-1 resistance in hosts with hypermutated MMRD tumors displaying abnormal neutrophil accumulation.
- immunotherapy
- neutrophil infiltration
- genome instability
- CTLA-4 antigen
- tumor biomarkers
Data availability statement
Data are available upon reasonable request. All data needed to evaluate the conclusions in the paper are present in the paper and/or the Supplementary Materials, except for the raw data from exomes that can be requested to patricia.kannouche@gustaveroussy.fr.
This is an open access article distributed in accordance with the Creative Commons Attribution Non Commercial (CC BY-NC 4.0) license, which permits others to distribute, remix, adapt, build upon this work non-commercially, and license their derivative works on different terms, provided the original work is properly cited, appropriate credit is given, any changes made indicated, and the use is non-commercial. See http://creativecommons.org/licenses/by-nc/4.0/.
Statistics from Altmetric.com
WHAT IS ALREADY KNOWN ON THIS TOPIC
Anti-programmed death 1 (αPD-1) antibody is indicated for patients with mismatch repair-deficient (MMRD) tumors regardless of tumor origin, but response rate is highly variable, suggesting that intrinsic and/or extrinsic parameters might modulate immunotherapy treatment.
WHAT THIS STUDY ADDS
Despite high tumor mutational burden, tumor-induced neutrophils hampered αPD-1 response. Targeting regulatory T (Treg) cells can decrease neutrophil levels and restore αPD-1 response.
HOW THIS STUDY MIGHT AFFECT RESEARCH, PRACTICE OR POLICY
This study revealed a possible crosstalk between tumor-induced neutrophils and Treg cells impeding αPD-1 response in MMRD tumors. Anti-cytotoxic T-lymphocytes-associated protein 4 combined with αPD-1 may benefit to patients with MMRD tumors when abnormal neutrophil accumulation is observed. The early on-treatment change of neutrophil-to-lymphocyte ratio may represent a valuable biomarker to predict resistance in patients with MMRD tumors treated with αPD-1 monotherapy.
Background
Mismatch repair (MMR) deficiency is associated with tumor development and high microsatellite instability (MSI-H), and these phenotypes are observed in more than 15 different tumor types and frequently present in colon, endometrial, and gastric cancer.1 Due to their inability to repair replication-associated errors, MSI-H/mismatch repair-deficient (MMRD) tumors harbor large numbers of single-nucleotide substitutions and frameshifts and are characterized by a high tumor mutational burden (TMB).2 3 As a consequence, these tumors often have increased expression of neoantigens, high infiltration with activated CD8+ cytotoxic T lymphocyte as well as activated Th1 cells, which underlie immunogenicity and clinical responsiveness to immune checkpoint blockade (ICB) therapy.4 Indeed, programmed death 1 (PD-1) blockade has emerged as an effective therapy for patients with MSI-H/MMRD metastatic colorectal and non-colorectal cancers that are refractory to standard chemotherapy combinations.5–7 Such clinical responses have contributed to the approval of the anti-PD-1 (αPD-1) monoclonal antibodies (ie, pembrolizumab and nivolumab) for pediatric and adult patients with unresectable or metastatic MSI-H/MMRD solid tumors regardless of the tumor histology.8 However, as recently reported from the phase II KEYNOTE-158 study, which enrolled 233 patients with 27 different tumor types with microsatellite instability (MSI), the responsiveness of MSI cancers to αPD-1 monotherapy is very variable, with a response rate ranging from 0% in brain tumors to 57.1% in endometrial cancers.9 This data suggests that intrinsic and/or extrinsic factors may hamper αPD-1 therapy response. However, the underlying mechanisms remain elusive.
One of the critical factors that can influence the efficacy of immunotherapy is the tumor microenvironment (TME).10 11 While many studies have reported typically high lymphocyte infiltration in primary MSI-H tumors,4 little is known about other immune cell populations that may limit the antitumor immune response. Blood cells, such as neutrophils, monocytes and platelets have been associated with inflammatory responses, and the neutrophil-to-lymphocyte ratio (NLR) and platelet-to-lymphocyte ratio (PLR) have been used as inflammatory markers to predict outcomes in various malignancies.12 13 Several studies have evaluated the role of inflammatory cell ratios (eg, NLR and PLR) as predictive biomarkers in patients with solid tumors treated with ICBs, and higher NLR and PLR ratios at baseline are associated with treatment failure.14 Whether these inflammatory markers are associated with ICB resistance in MSI-H/MMRD tumors remains unclear.
In this study, we addressed this question at the preclinical and clinical levels. We first generated different MMRD mouse tumor models, including one with abnormal neutrophil elevation, and longitudinally explored the impact of this immune cell population on response to αPD-1 treatment in hypermutated tumors. We then monitored the dynamic changes in the NLR ratio in a cohort of 104 patients with 18 different MMRD tumor types treated with anti-programmed death ligand 1 (αPD-L1) to determine whether changes in the NLR during treatment could predict resistance to αPD-1 therapy regardless of the type of MSI tumors.
Materials and methods
Mouse cell lines
Mouse 4T1 and CT26 cell lines were purchased from the American Type Culture Collection (CRL-2539 and CRL-2638, respectively) and were cultured at 37°C under 5% CO2 in RPMI-640 medium supplemented with 10% fetal calf serum, 100 U.mL–1 penicillin (Gibco) and 100 mg.mL–1 streptomycin (Gibco). Cell lines were regularly tested for mycoplasma contamination using the MycoAlert Mycoplasma Detection Kit (LT07-418, Lonza).
Msh2 knock-out clones generated by CRISPR-Cas9
‘All in one’ CRISPR-Cas9 plasmid targeting Msh2 exon 3 was provided by TACGENE (MNHN, Paris) with the guide RNA sequence: 5’-GGTATGTGGATTCCACCCAGAGG-3’. Both CRISPR-Cas9 plasmid and peGFP-C3 plasmid (Clontech) were transfected at a 9:1 ratio in 4T1 cells using Cell Avalanche reagent (EZ Biosystems) according to the manufacturer’s instruction. For CT26 cell line, the same strategy of transfection was carried out with JETPEI reagent (Polyplus) according to the manufacturer’s instruction. After 48 hours, GFP+ cells were fluorescence-activated cell sorting (FACS) sorted at one cell per well in 96-well plates then single cells were expanded.
Cell lysis and western blot
For validation of Msh2 inactivation, CRISPR-edited clones were lysed in sodium dodecyl-sulfate (SDS) lysis buffer (50 mM Tris pH 7.5, 20 mM NaCl, 10 mM MgCl2, 0.1% SDS, anti-proteases cOmplete cocktail from Roche) supplemented with 20 U/mL benzonase (Millipore) for 10 min at room temperature. Proteins were quantified with Bradford assay and denatured in Laemmli buffer. Proteins were separated on 8% acrylamide SDS–polyacrylamide gels and transferred on PVDF membranes (Millipore). Membranes were blotted with antibodies directed to the following proteins: MSH2 (rabbit, #Ab70240, Abcam, 1/5000), β-actin (mouse, #A5441, Sigma Aldrich, 1/10,000).
Genetic validation of Msh2 knock-out clones
Genomic DNA was extracted from CRISPR-edited clones using NucleoSpin Tissue (Machinery Nagel) then PCR was performed using Phusion High-Fidelity DNA polymerase (Thermo Fisher Scientific) with the following primers: for 5’-AGACTGACAGGCATGATTTTGT-3’; rev 5’-GGAAATACAGGGGAAGGGGTAT-3’. Cloning of PCR products was processed with CloneJET PCR Cloning kit (Thermo Fisher Scientific) and verified by Sanger sequencing.
Generation of MMRDint and MMRDhi cells lines
Both 4T1 and CT26 MMRD derivatives were serially passaged in vitro three times a week. The culture conditions were the same as for parental cell lines (37°C under 5% CO2 in RPMI-640 medium supplemented with 10% fetal calf serum, 100 U.mL–1 penicillin (Gibco) and 100 mg.mL–1 streptomycin (Gibco)). The TMB as well as indels were monitored over time. MMRD cells passaged for 6 weeks are hereinafter referred to as MMRD-intermediate cells (MMRDint) and MMRD cells that were passaged for more than 15 weeks are referred to as MMRD-high cells (MMRDhi).
Mouse studies
Female BALB/c mice aged of 6 weeks were purchased at ENVIGO and were maintained in the animal facility of Gustave Roussy. Experiments were performed in accordance with French government and institutional guidelines and regulations. Inoculation of 50,000 4T1 tumor cells were done in the mammary fat pad (left, n°4) of BALB/c mice. Inoculation of 500,000 CT26 tumor cells were done subcutaneously into the right flank of mice. Tumor were measured twice weekly and tumor volume and was calculated as follows: length×width2. Mice were euthanized when the tumor size was ≥1500 mm3 or boundary points were reached according to the French and European laws and regulations for the use of mice for scientific purposes.
Exome analysis
Genomic DNA extraction from mouse tumors was performed using AllPrep DNA/RNA micro Handbook (Qiagen). The exomes were sequenced according to the manufacturer protocols (BGI Tech solutions, Hong Kong) with BGISEQ-500 sequencer. We mapped reads using BWA-MEM software to the mm9 mouse reference genome and then used the standard GATK best practice pipeline15 process the samples and call somatic mutations. PCR duplicates were removed and base quality scores recalibrated using MarkDuplicates and BaseRecalibrator tools (GATK package).16 Somatic SNVs and INDELs were called and filtered using GATK tools Mutect2, FilterMutectCalls and FilterByOrientationBias and functional effects of mutations were annotated with ANNOVAR.17 Quality control of FASTQ and mapping was done with FastQC, samtools,18 GATK HSMetrics and MultiQc.19 The processing steps were combined in a pipeline built with snakemake scripts.20
Somatic mutations with PASS flag from GATK Mutect2 were additionally filtered to be supported by at least one read from each strand and at least three reads in total. The contribution of the COSMIC mutational signatures was assessed using MutationalPatterns package.21 Classification of mutations and insertions/deletions by types was done with SigProfilerMatrixGenerator.22
To calculate TMB, the total number of somatic non-synonymous mutations was normalized to the total number of sequenced megabases.
Mice treatment
Mice received three intraperitoneal (i.p) injections of αPD-1 (clone RMP1-14; 250 µg/mouse) and/or αCTLA (clone 9D9, 100 µg/mouse) or isotype controls when tumor volume reached 70–100 mm3. αLy6G (clone 1A8, 100 µg/mouse) depleting antibody or isotype control was injected i.p when tumor volume reached 50–70 mm3 every 3 days. αCD-25 treatment (PC-61.5.3, dose 200–300 µg/mouse) depleting antibody or isotype control, was injected i.p when tumor volume reached 50–70 mm3 every 3 days. Injections was carried out 1 day before ICB administration. Antibodies are described in Key Resources table 1.
Key resources
Flow cytometry analysis
For mouse tumor dissociation, tumor specimens were cut into small pieces and digested in RPMI medium containing 25 µg/mL Liberase (Roche) and 150 IU/mL DNaseI (Roche), and subsequently subjected to gentle MACS dissociation (Miltenyi Biotech) for 30 min at 37°C. Cells were then filtered through a 100 µm cell strainer, Fc receptors were blocked for 15 min at 4°C using with αCD16/32 functional grade purified antibodies (eBioscience). For FoxP3 and KI67 staining, cells were fixed and permeabilized, after cell surface staining, according to the manufacturer protocol (eBioscience). Antibodies are described in Key Resources (table 1).
For longitudinal blood monitoring, blood was collected twice a week from the submandibular vein of mice using minivette POCT. For whole blood staining, red cells were lysed using a mix of VersaLyse lysing solution +Fixative solution (1000:25, Beckman Coulter) during 15 min at room temperature then immunostaining was performed after Fc receptor blocking. Cells were then washed two times with phosphate buffered saline. Blood and dissociated tumor samples were acquired on a Gallios Cytometer (Beckman Coulter) and analyzed using Kaluza software (Beckman Coulter). The myeloid-to-lymphocyte ratio was calculated by dividing myeloid cells (%) by lymphocytes (%). These populations were identified in live CD45+ cells according to surface structure as described in online supplemental figure S1. The gating strategy for neutrophils is described in online supplemental figure S1.
Supplemental material
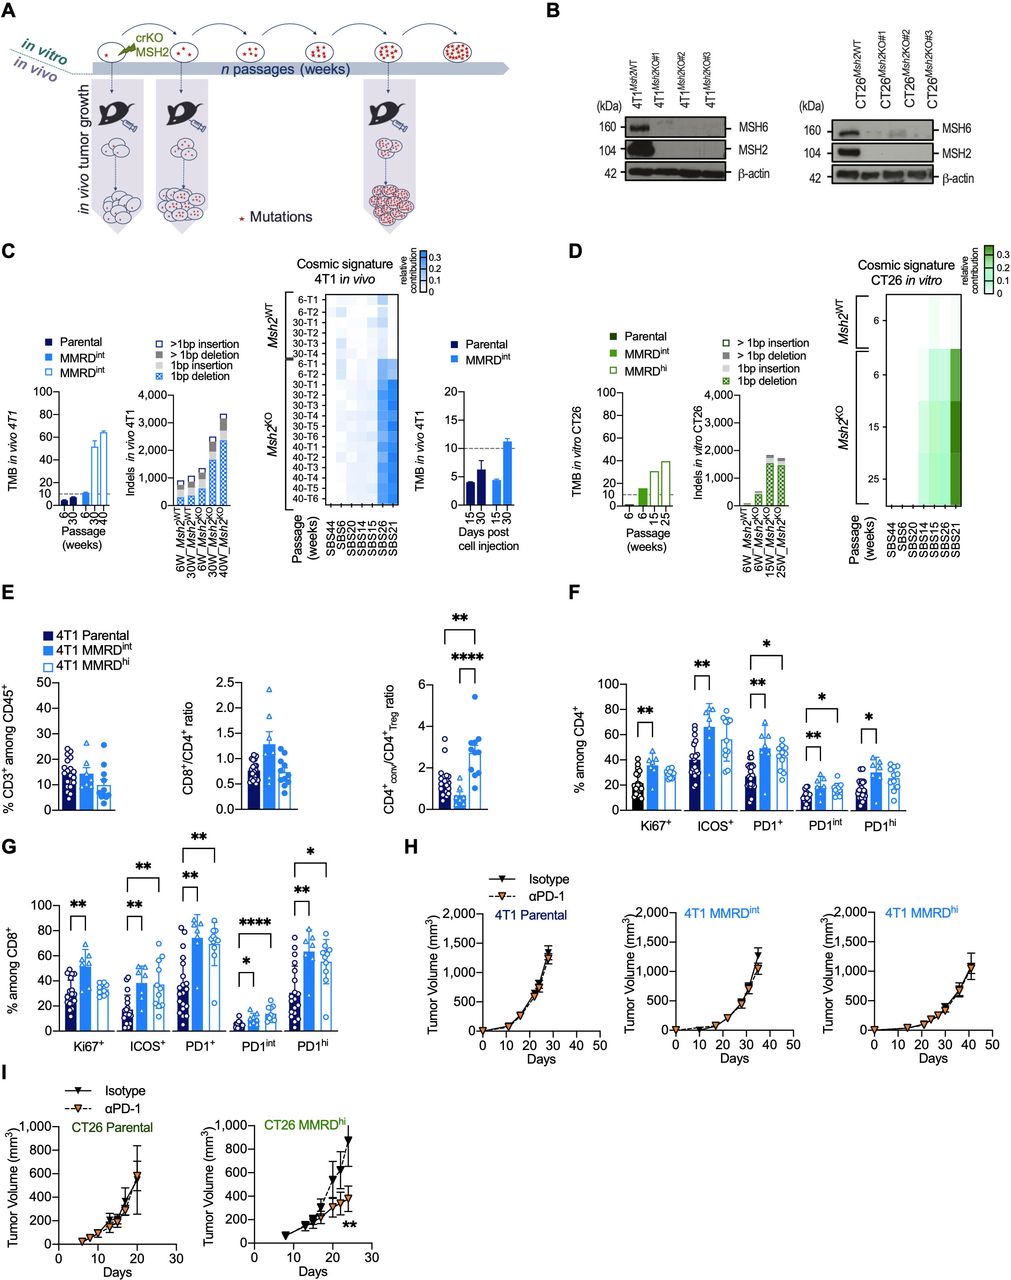
Variable responses to αPD-1 therapy in MMR-deficient mouse models. (A) Experimental model system for generating MMRD tumor cell lines (4T1, CT26) harboring increasing tumor mutation burden due to the inactivation of MSH2 gene. (B) Loss of MSH2 protein detected by western blot in clones inactivated for MSH2 gene by CRISPR/Cas9 in 4T1 (left panel) and CT26 (right panel). MSH6 which forms a heterodimer complex with MSH2 is destabilized in Msh2KO cells. (C–D) Counts of non-synonymous nucleotide substitution per Mb (TMB) and indels from whole-exome analysis in 4T1 and CT26 MSH2ko clones and in parental cells after serial passages (in weeks) in culture or tumor growth (D15, D30). Heatmap of relative contribution of MMR COSMIC signatures (signature 6, 14, 15, 20, 21, 26, 44) in different tumors injected at indicated passages (right panel). The TMB cut-off of 10 non-synonymous/Mb is represented in dotted lines. (E–G) Flow cytometry analyses of tumor-infiltrating leukocytes in 4T1 parental (dark blue), 4T1 MMRDint (p=6 weeks, blue) and 4T1 MMRDhi (p=30 weeks, white and blue) tumors resected 30 days post cell injection (n=7–20 tumors per group). The proportions of T lymphocytes (CD3+) among CD45+ cells, as well as the ratios CD8+/CD4+ and CD4+ conventional/Treg are depicted (E). Note that the Treg cell population was defined as CD4+ Foxp3+ cells and conventional CD4+ population was defined as CD4+ Foxp3– cells. The proportions of Ki67+, ICOS+ and PD1+ among CD4+ (F) and CD8+ cells (G) are shown. (H–I) Tumor growth kinetics of 4T1 (H) and CT26 (I) Parental (4T1 n=2, 12 mice/group; CT26 (n=1, 5–6 mice/group), MMRDint (4T1 n=3, 10–11 mice/group), and MMRDhi (4T1 n=2, 7–8 mice/group; CT26 (n=2, 12 mice/group) clones in mice treated with αPD-1 or its isotype when tumors reached 70–90 mm3. Data are shown as mean±SEM. Statistical analyses were performed using Mann-Whitney test when comparing two groups (H–I) and Dunn’s test (E–G) when comparing more than two groups. Symbol significance: *p≤0.05; **p≤0.01; ***≤0.001, ****≤0.0001. MMR, mismatch repair; MMRD, mismatch repair-deficient; MMRDhi, MMRD high (cells serially passaged for more than 15 weeks in culture); MMRDint, MMRD intermediate (cells serially passaged during 6 weeks in culture); PD-1, programmed death 1; TMB, tumor mutational burden (non-synonymous mutations/Mb); Treg, regulatory T cells.
Adoptive transfer of neutrophils
Adoptive transfer of neutrophils from naïve BALB/c mice or tumor-induced neutrophil (TIN) from 4T1 bearing BALB/c mice, was realized by retro-orbital injection of 106 cells. Untouched neutrophils or TIN were purified from spleens using the neutrophil isolation kit (Miltenyi order no. 130-097-658) according to manufacturer protocol. Cells were stained before and after enrichment with anti-Ly-6G and CD11b to control purity.
Immunohistochemical analysis of mice tumor tissue
All immunohistochemical techniques were performed on an automated stainer (Bond RX, Leica Biosystems, Nanterre, France). For detection of CD8, deparaffinized 3 µm-thick tissue sections were submitted to heat-induced antigen retrieval for 20 min at 100°. Sections were then incubated with the primary antibodies (CD8 clone D4W2Z, Cell Signaling, Danvers, Massachusetts, USA) for 1 hour at room temperature. The signal was revealed with 3, 3'-diaminobenzidine (DAB). For simultaneous detection of CD4 and FoxP3, after antigen retrieval, sections were successively incubated with the primary antibodies (CD4 rabbit monoclonal D7D2Z, Cell Signaling and anti-FoxP3 rabbit monoclonal antibody D608R, Cell Signaling), each for 1 hour at room temperature, detected respectively with Bond Polymer Refine Red Detection (Leica Biosystems) and Bond Polymer Refine Detection kit (Leica Biosystems). Sections were successively revealed by Red chromogen (Leica Biosystems) and HIGHDEF Black HRP chromogen/substrate (Enzo Life Sciences, Villeurbanne, France).
Patients
All patients included in this study had previously received at least one line of therapy. They were enrolled from November 2014 to October 2020 at Gustave Roussy and provided informed consent before enrollment. The study is reported in Health Data Hub. Information regarding Eastern Cooperative Oncology Group status, National Clinical Trial (NCT) number, inclusion/exclusion criteria, line of treatment are indicated in online supplemental table S2. White blood cell (WBC) count, absolute lymphocyte count (ALC), absolute neutrophil count (ANC), serum lactate dehydrogenase, and other clinical data, including metastasis (number and site), immunohistochemistry results (for MSI diagnostic confirmation), and response) were collected before starting αPD-L1 treatment and until last follow-up. Patients were treated with αPD-L1 until disease progression, intolerable toxicity and/or the investigator’s decision. Tumor assessment was performed at baseline, and during treatment with varying frequency. Clinical response was classified according to Response Evaluation Criteria in Solid Tumors (RECIST). The Royal Marsden Hospital Prognostic Score was calculated using the formula described by Garrido-Laguna et al.23
Supplemental material
NLR was calculated as follows: NLR=ANC/ALC from peripheral blood of patients. NLR change (NLRchange) was calculated as follows: ((NLRearly on-treatment – NLRbaseline)/NLRbaseline)×100. Note that NLR change less than 0% means lymphocytes are becoming more abundant relative to neutrophils. Progression-free survival (PFS) was determined from the first cycle of treatment to disease progression documented by imaging, or death (event), or last follow-up (censored). Overall survival (OS) was calculated from the first cycle of treatment to death (event) or last follow-up (censored). The objective response rate (ORR) was defined as the number of patients with either a complete response (CR) or a partial response (PR) divided by the number of patients who were treated in the study.
Immunohistochemical analysis of human tumor tissues
Immunohistochemical techniques were applied to 3 µm-thick deparaffinized sections of Formalin-Fixed, Paraffin-Embedded (FFPE) tissues and performed on automated stainers, after heat-induced antigen retrieval. CD15 was detected with the mouse monoclonal antibody MMA (Roche Diagnostics, Basel, Switzerland) and CD3 with a rabbit polyclonal antibody (DAKO, Glostrup, DK). CD3, CD15, CD15/CD3 change were, respectively, calculated as follow: (CD3/mm²during SD or progression – CD3/mm²before ICB initiation)/CD3/mm²before ICB initiation))×100; : (CD15/mm²during SD or progression – CD15/mm²before ICB initiation)/CD15/mm²before ICB initiation))×100; : (CD15/CD3during SD or progression – CD15/CD3before ICB initiation)/ CD15/CD3before ICB initiation))×100.
Statistical analysis
Data analyses were performed using Prism V.9 (GraphPad, San Diego, California, USA). Data are shown as mean±SEM. At the same time point, statistical analyses were performed using Mann-Whitney test when examining two groups and Dunn’s or regular one-way analysis of variance test when examining more than two groups. At different time points, statistical analyses were performed using Fishers Least Significant Difference (LSD) Fisher’s test. Statistical analysis for fraction survival using Kaplan-Meier estimation curves, were performed by using log-rank (Mantel-Cox) test and HR values were assessed with Mantel-Haenszel test. Symbol significance: *p≤0.05; **p≤0.01; ***p≤0.001, ****p≤0.0001.
Results
Genetic and immune characterization of MMRD murine tumor models
To generate MMRD murine models, we used CRISPR/Cas9-mediated genetic editing to inactivate the Msh2 gene in breast (4T1) and colorectal (CT26) murine cancer cell lines (figure 1A,B). The 4T1 tumor cell line was chosen for its very low background mutation rate.24 Moreover, when injected into the mammary fat pad of BALB/c mice, 4T1 cells are refractory to αPD-1 or αCTLA-4 and are associated with an accumulation of neutrophils and other granulocytic cells.24 25 In contrast, CT26 tumor cells contain a substantial number of somatic mutations. When transplanted subcutaneously into the right flank in BALB/c mice, CT26 have been shown to respond to αCTLA-4 but not to αPD-1, and is not associated with neutrophil accumulation.24 26
Given that mutations accumulate in each round of DNA replication in MMR-deficient cells, parental cells and MMRD derivatives were serially passaged in vitro, and TMB as well as indels were monitored over time in both 4T1 and CT26 MMRD models (figure 1C,D). We observed a gradual increase in TMB in 4T1Msh2KO tumors with passage, reaching up to 64 mutations/Mb at passage 40 weeks. As expected, TMB remained stable in 4T1Msh2WT tumors over time (figure 1C). The mutagenic spectrum caused by Msh2 inactivation was consistent with COSMIC mutational signatures associated with MMR deficiency (ie, signatures 6, 14, 15, 20, 21, 26, and 44) with a relatively high contribution of signatures 21 and 26 in 4T1Msh2KO 2. We also found an important increase in indels in 4T1Msh2KO cells after 40 weeks in cell culture, with prominent single base pair deletions (−1 bp). To monitor the accumulation of mutations during tumor growth, 4T1Msh2KO cells at passage 6 weeks were transplanted into mammary fat pads in BALB/c mice, and tumor exomes at two time points post-injection were analyzed (figure 1C, right panel). We observed an increase in TMB in 4T1Msh2KO cells between Day 15 and Day 30 (4.5 vs 11.25 mut/Mb), while in 4T1 parental cells, TMB remained relatively stable over time (4.2 vs 6.3 mut/Mb). These genetic features were corroborated in the MMRD CT26 syngeneic model (figure 1D). Altogether, these results indicate that our two MMRD murine models recapitulate the mutational landscape found in human tumors with MSI. MMRD cells passaged for 6 weeks are hereafter referred to as MMRDint cells, and MMRD cells that were passaged for more than 15 weeks are referred to as MMRDhi cells.
A high density of activated tumor-infiltrating lymphocytes (TILs) has been widely described in MSI tumors in the clinic.4 27 28 MMR deficiency in CT26 model has been shown to cause a slight increase in immune infiltration compared with parental cells29 while immune features in 4T1 MMRD models are unknown. Therefore, we investigated the TME in 4T1 MMRD tumors. TME was evaluated 30 days post injection for the parental, MMRDint and MMRDhi 4T1 (figure 1E,G). No difference was observed for CD3+ T cell infiltration. Interestingly in MMRDhi tumors, the conventional CD4+ T to Treg cell ratio (CD4+conv/CD4+Treg) was significantly increased compared with that in parental and MMRDint tumors (figure 1E, right panel), suggesting a less immunosuppressive microenvironment only in highly mutated tumors. MMRDint tumors exhibited higher proliferation (ie, Ki67+) of TILs compared with parental tumors, which was more pronounced within the CD8+ T cell population (figure 1F,G), consistent with the higher CD8+/CD4+ ratio in this model (figure 1E, right and middle panels). The inducible T cell co-stimulator (ICOS) activation marker and PD-1 expression were significantly increased within the CD4+ T and CD8+ T cell populations in both MMRDint and MMRDhi tumors compared with parental tumors (figure 1F,G). Altogether, these data indicate a higher activation of TILs in 4T1 MMRD tumors compared with parental tumors.
αPD-1 treatment is not effective in all MMRD models
Considering the immune infiltration in both MMRD CT26 and 4T1 tumors29 and this study, respectively, we anticipated that these murine models would respond to αPD-1 therapy. As expected, the parental tumors did not respond to αPD-1 therapy (figure 1H, left panel and figure 1I, left panel). αPD-1 monotherapy had no effect in MMRDint and MMRDhi 4T1 tumors (figure 1H, middle and right panels), while a significant reduction in tumor growth was observed in the MMRDhi CT26 tumor model (figure 1I, right panel). This result was not anticipated since these three MMRD models have a high TMB (CT26 MMRDhi TMB>30 mut/Mb; 4T1 MMRDint TMB>10 mut/Mb; and 4T1 MMRDhi TMB>50 mut/Mb) and a substantial immune infiltration with a strong PD-1 expression. Thus, despite the presence of clinically validated biomarkers for predicting response to αPD-1, treatment was ineffective in MMRD 4T1 models. This outcome suggests that other mechanisms are involved in primary resistance, even in highly mutated tumors.
Neutrophils are associated with αPD-1 resistance in MMRD tumors
Contrary to the CT26 tumor model, 4T1-bearing mice have a massive increase in the number of circulating WBCs relative to normal control hosts; myeloid cells such as neutrophils largely account for this expansion of the WBC compartment, which might contribute to ICB resistance in parental 4T1 cells.30 However, this phenomenon remains unstudied in MMRD tumor models. We thus monitored the myeloid cell to lymphocyte (myelo/lympho) ratio in the blood of mice after transplantation of parental and MMRD tumor cells. We observed a 10-fold to 20-fold increase in the myelo/lympho ratio in the blood of parental and MMRDhi 4T1 tumor-bearing mice as compared with CT26 model (figure 2A). Similarly, a 5-fold to 15-fold increase in the myelo/lympho ratio was detected in the TME of both parental and 4T1 MMRDhi tumor models. Hence, the increase in indels and single base substitutions in MMRD 4T1 cells did not prevent the accumulation of myeloid cells in these preclinical tumor models.
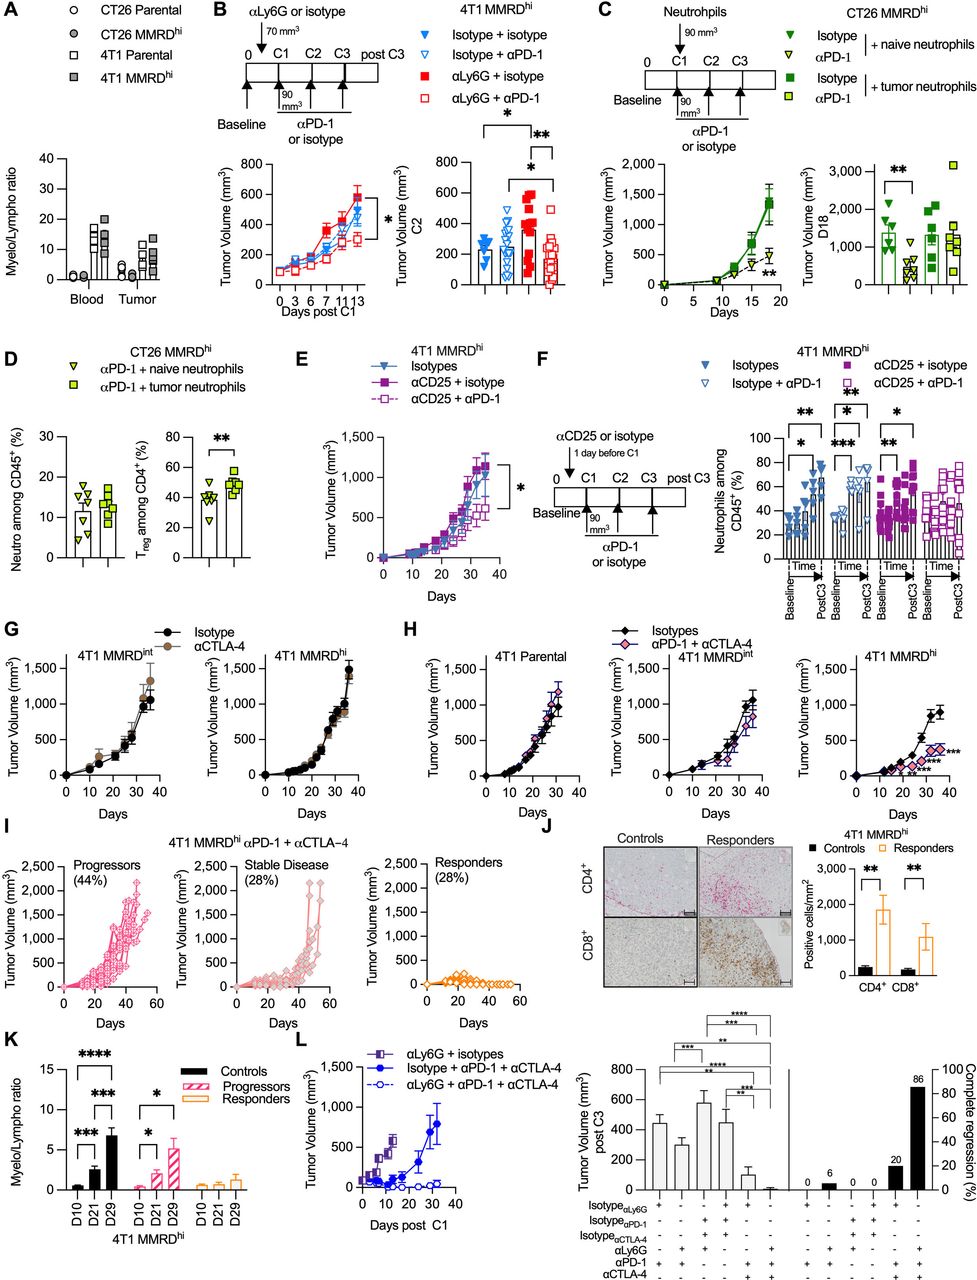
Neutrophil levels negatively correlate with αPD-1 response in MMRD preclinical tumor models. (A) Analysis of blood myeloid ratio (defined as the ratio of myeloid cells/lymphocytes, both gated among CD45+) in mice injected with 4T1 parental (white square), 4T1 MMRDhi (gray square), CT26 parental (white circle), CT26 MMRDhi (gray circle) (n=1, 4–6 mice/group). (B) Tumor growth kinetics of 4T1 MMRDhi mice±depleted for neutrophil cells using αLy6G antibody (clone 1A8) and subsequently treated with αPD-1 or its respective isotype during 13 days post first injection of αPD-1 (n=3, 7–20 mice in each group). Scheme of experimental design is shown (upper panel). Tumor volume just before the second αPD-1 injection is shown (lower right panel). (C) Mice bearing CT26 MMRDhi cells were injected with 250,000 neutrophils originated from either naïve mice or mice bearing 4T1 tumors. Mice were concomitantly treated with αPD-1 or its isotype and tumor growth was monitored for each group (n=1, 6–7 mice/group). Scheme of experimental design is shown (upper panel). Tumor volume at Day 18 post cell injection is shown (lower right panel). (D) Flow cytometry analyses of tumor neutrophils (gated as CD11b+ CD11c– SiglecF– Ly6Ghi Ly6Cint, among CD45+) and Treg cells (gated as CD4+ Foxp3+ among CD4+) in CT26 MMRDhi treated with αPD-1 and injected with 250,000 neutrophils originated from either naïve mice (green triangle) or mice bearing 4T1 tumors (green square) (n=7 mice in each group). (E–F) Tumor growth kinetics (E) and longitudinal flow cytometry analyses of blood neutrophils (F) of 4T1 MMRDhi mice±depleted for Treg cells using αCD25 (PC-61.5) antibody and subsequently treated with αPD-1 or its respective isotype over a 35-day period (n=2, 5–10 mice in each group). (G) Tumor growth kinetics of 4T1 MMRDint (n=1, 5–6 mice/group) and MMRDhi clones (n=1, 7–8 mice/group) in mice treated with αCTLA-4 or their isotypes when tumors reached 70–90 mm3 (6–25 mice/group). (H) Tumor growth kinetics of 4T1 parental (n=1, 6 mice/group), MMRDint (n=1, 6 mice/group), and MMRDhi clones in mice treated with αCTLA-4+αPD-1 or their isotypes when tumors reached 70–90 mm3 (n=4, 22–25 mice/group). (I) Spider plots of individual tumor growth of MMRDhi tumor-bearing mice (passage 40 weeks) treated with αPD-1+αCTLA-4 over a 45-day period. (J) Representative photographs of CD4+ and CD8+ immunohistochemistry staining of 4T1 MMRDhi tumor-bearing mice 2–3 days after the third dose of αPD-1+αCTLA-4 or their respective isotypes. Histogram of the density of CD4+ and CD8+ cells in indicated groups (n=1, 6 mice/group). Scale bars=50 µm. (K) Blood myeloid ratio was evaluated at D10 (before first dose of ICB), D21, D29 post cell injection in mice treated with isotypes (black) or in mice that progressed (pink stripes) or responded (orange) to αPD-1+αCTLA-4 treatment (n=1, 6–10 mice/group) (L) Tumor growth kinetics of 4T1 MMRDhi in mice±depleted for neutrophil cells using ɑLy6G (1A8) antibody and treated with αPD-1+/–αCTLA-4 or their respective isotypes (n=1, 5–12 mice in each group). Tumor volume 3 days after the last administration of immune checkpoint blockade is shown for each group with the percentage of complete tumor regression. Data are shown as mean±SEM. At the same time point, statistical analyses were performed using Mann-Whitney test when examining two groups (D, J) and Kruskal-Wallis or regular one-way analysis of variance test (L) when examining more than two groups. At different time points, statistical analyses were performed using Fisher LSD test (B, E–H, K). Symbol significance: *p≤0.05; **p≤0.01; ***≤0.001, ****≤0.0001. CTLA-4, cytotoxic T-lymphocytes-associated protein 4; MMRD, mismatch repair-deficient; MMRDhi, MMRD high cell; PD-1, programmed death 1; Treg, regulatory T cells; Fishers Least Significant Difference (LSD)
To determine whether neutrophils preclude an αPD-1 response in MMRDhi 4T1 tumors, mice were treated with the neutrophil-depleting antibody αLy-6G31 32 or its isotype control. As expected, αLy6G -treated tumor-bearing mice showed a reduction in circulating neutrophil numbers compared with mice treated with isotype control (online supplemental figures S1 and S2). While αLy6G did not significantly modify the tumor growth of MMRDhi 4T1 tumors, αPD-1 treatment along with αLy6G induced significant reduction of the tumor growth in MMRDhi 4T1 tumors (figure 2B). To demonstrate the direct role of TIN, we adoptively transferred neutrophils from non-tumor-bearing BALB/c mice or neutrophils from 4T1 tumor-bearing mice into the mice bearing MMRDhi CT26 tumors, sensitive to αPD-1 treatment. As shown in figure 2C, adaptive transfer of TIN abrogated the efficacy of αPD-1 in MMRDhi CT26 tumors. No such effect was observed with naïve neutrophils (figure 2C) demonstrating that only TIN hampered αPD-1 efficacy. We next examined the TME of MMRDhi CT26 tumors after adoptive transfer of naïve neutrophils or TIN. Surprisingly, while no difference in neutrophil proportion was observed, Treg cells were significantly increased in the TME when TIN were adoptively transferred (figure 2D), suggesting that TIN favored Treg infiltration and/or amplification.
Neutrophils and Treg cells are related
We next decided to deplete the Treg cell population in 4T1 tumor-bearing mice with a CD25-depleting antibody. Depletion with an αCD25 antibody is not straightforward, as Treg depletion before tumor implantation induces total tumor regression in approximately 50% of mice.33 Thus, the injection of the αCD25 antibody was performed 1 day before αPD-1 treatment, resulting in a decrease in Treg cells in the blood (online supplemental figure S3 upper panel).
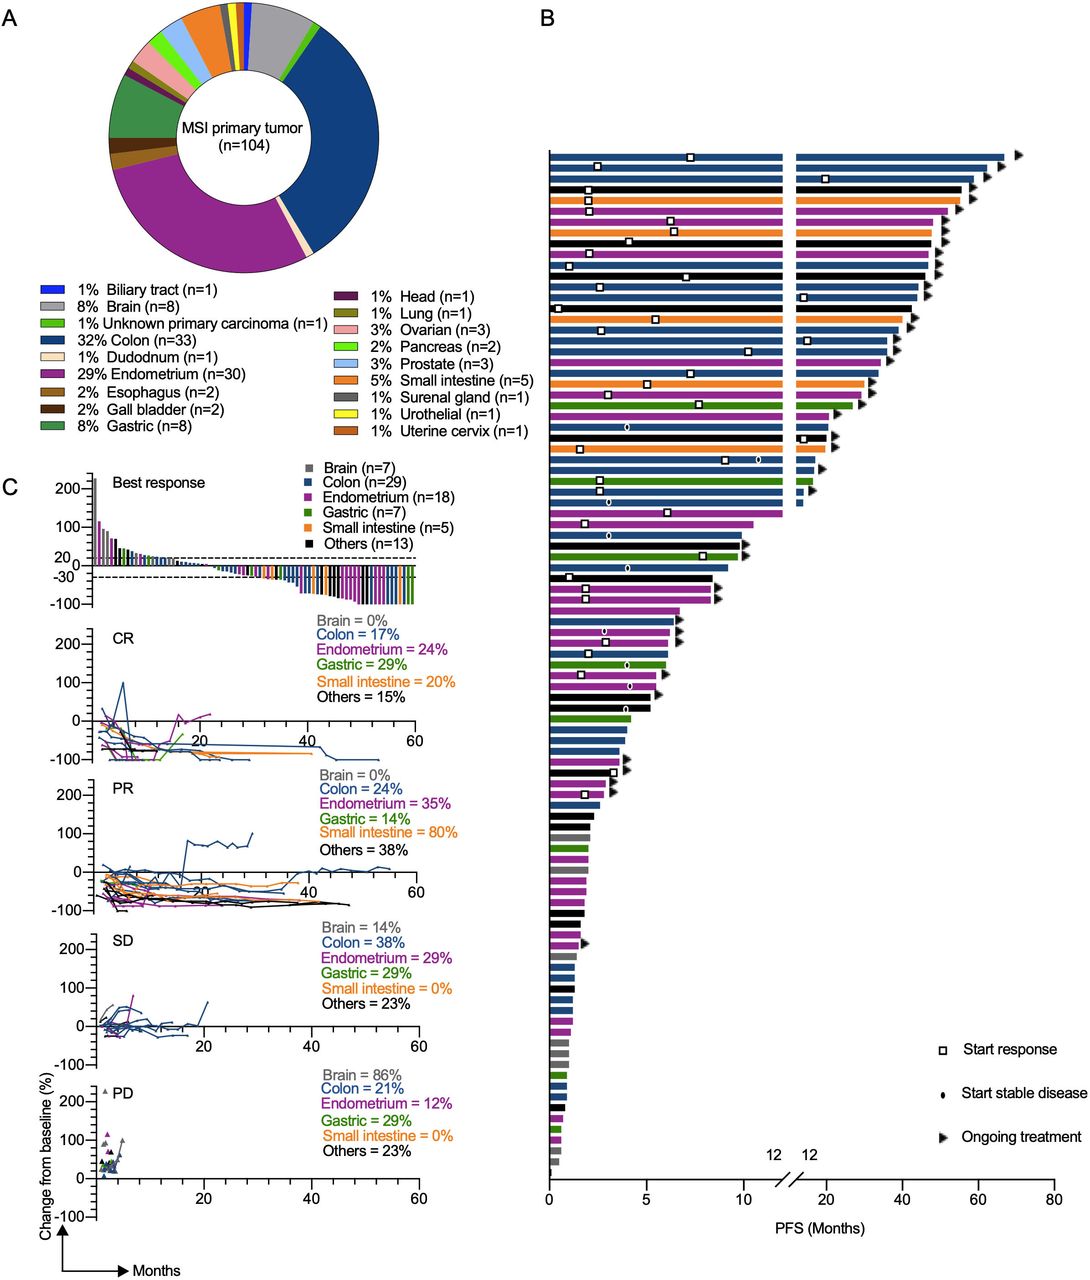
Clinical response to αPD-L1 in patients with different MMRD tumor types. (A) Pie chart representing classification of MSI/ MMR-deficient tumor types analyzed in the GR cohort. (B) the swimmer plots illustrate the PFS of patients treated with αPD-L1 antibody. Ongoing treatment is represented with a triangle and the start of response or stable disease was tagged by a square or a black oval, respectively. Histological tumor types are color coded. (C) Waterfall plot of best response (defined as best percentage change from baseline in tumor size by RECIST V.1.1) to αPD-L1 therapy (upper panel). Spider plots (defined as longitudinal tumor growth or shrinkage compared with baseline accorded to RECIST V.1.1) in the cohort (lower panels). Analysis included all patients who received at least one dose of study treatment and had at least one evaluable post-baseline tumor assessment. CR, complete response; MSI, microsatellite instability; MMR,mismatch repair; MMRD, mismatch repair-deficient; PD, progressive disease; PD-L1, programmed death ligand 1; PFS, progression-free survival; PR, partial response; RECIST, Response Evaluation Criteria in Solid Tumors; SD, stable disease.
Moreover, even if αCD25 therapy is associated with a potential risk of depletion of CD25+ T effector cells and not only Treg cells, we did not observe a clear difference in the CD4+ cell proportion between all groups (online supplemental figure S3 lower panel). As anticipated, αPD-1 treatment along with Treg cell depletion restored antitumor activity in the MMRDhi 4T1 model (figure 2E). Interestingly, no accumulation of neutrophils was observed in mice treated with αCD25+αPD-1 in contrast to mice in the other groups (figure 2F). These data suggest that immunoregulatory effectors such as neutrophils and Treg cells appear to be related and counter αPD-1 efficacy even in highly mutated MMRDhi 4T1 tumors.
Given the widely described role of αCTLA-4 in modulating Treg cell suppressive functions,34 αCTLA-4 +/– αPD-1 was administered. Mice transplanted with MMRDint or MMRDhi 4T1 cells were resistant to αCTLA-4 monotherapy (figure 2G). However, combination treatment with αCTLA-4+αPD1 triggered tumor shrinkage in MMRDhi 4T1-bearing mice, while parental and MMRDint tumors were still unresponsive (figure 2H). Accordingly, survival was increased in MMRDhi 4T1-bearing mice treated with combination treatment (online supplemental figure S4). By performing rechallenge experiments, we demonstrated that mice curing MMRDhi primary tumors with the αCTLA-4 + αPD-1 combination were protected from MMRDhi 4T1 tumors but not from parental 4T1 tumor cells, although we observed a tumor growth delay (online supplemental figure S5). These results suggest that the combination of αPD-1 and αCTLA-4 blockade elicits an effective and long-lasting memory immune response in MMRDhi 4T1 tumors, possibly directed against neoantigens.

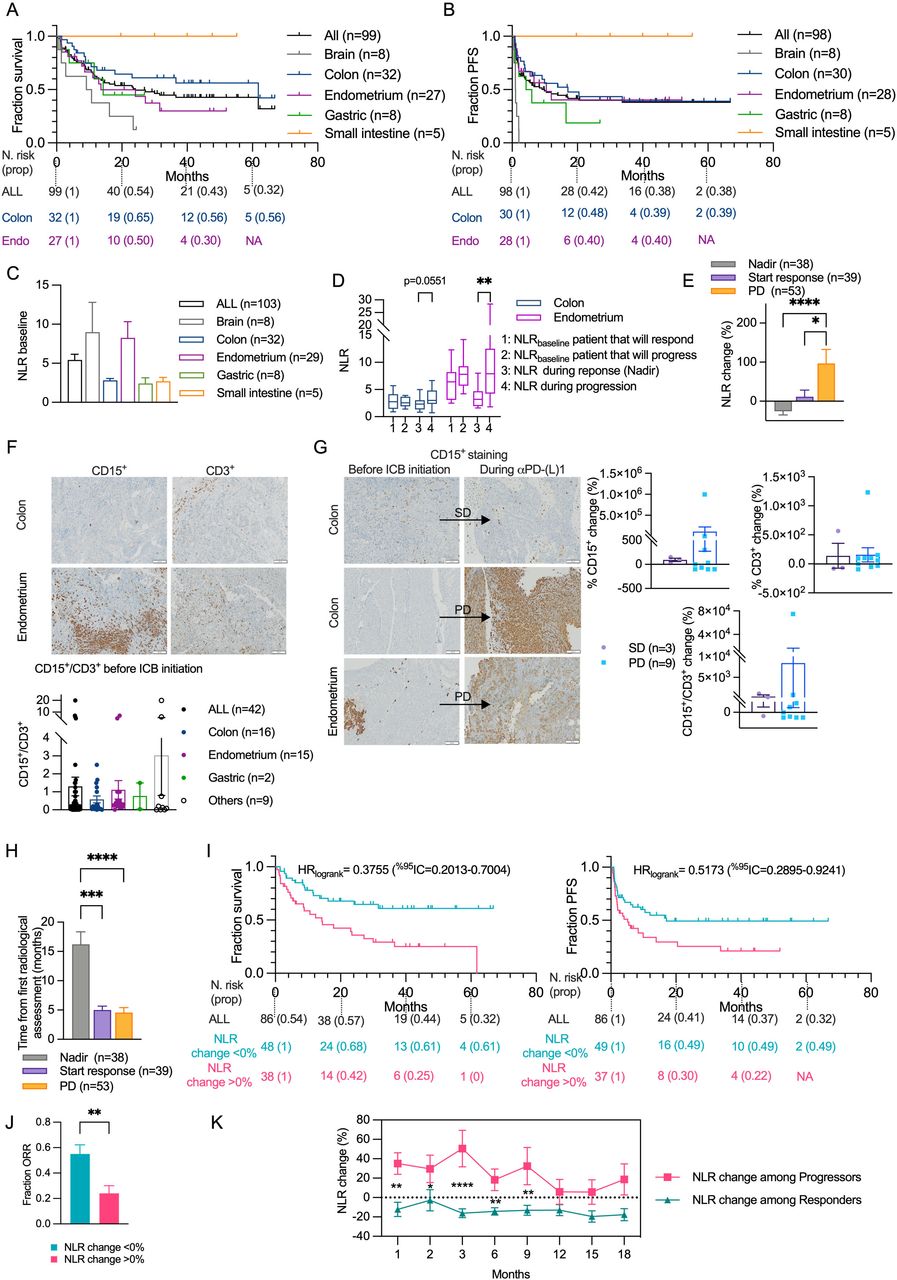
NLRchange can predict resistance to αPD-L1 therapy for patient with different MMRD tumor types. (A–B) Kaplan–Meier estimation of overall survival (A) or progression-free survival (B) in the cohort segregated by MSI organs. (C) Neutrophil/lymphocyte ratio (NLR) among MMRD tumor types at baseline. (D) Graphs of NLR baseline, NLR during response or progression to αPD-L1 therapy (see calculation in Materiel and Methods section) between responders and progressors for MMRD CRC and EC. (E) NLR change during the initiation of the response, nadir or progression. (F) Representative photographs of CD3+ and CD15+ IHC staining of MSI CRC and EC tumors at baseline. Scale bars=100 µm. Histogram of CD15+/CD3+ ratio from various organs are depicted. (G) Representative photographs of CD3+ and CD15+ IHC staining of MMRD tumors at baseline and during SD or PD. Scale bars=100 µm. Histogram showing the percentage of CD15+/CD3+ change during SD or PD in various organs are depicted. (H) Timelapse before initiation of the response, nadir or progression. (I) Kaplan-Meier estimation of overall survival and progression-free survival of the cohort segregated by the percentage of NLR change after 2 months of αPD-L1 treatment. (J) ORR between patients with a percentage of NLR change >0% or <0% after 2 months of αPD-L1 treatment. (K) Percentage of NLR change throughout time between responders or progressors. For histograms, box plots and curves, data are shown as mean±SEM and statistical analyses were performed using Mann-Whitney test when examining two groups (J) and Dunn’s test when comparing more than two groups (C, D, E, H). The comparison of the dynamic of NLR change between progressors and responders was made using Fisher’s LSD test (K). For Kaplan-Meier estimation, tick marks represent data censored at the time of the last imaging assessment and statistical analyses were performed using log-rank (Mantel-Cox) test. Symbol significance: *p≤0.05; **p≤0.01; ***≤0.001, ****≤0.0001. Nadir was determined as the smallest size of the sum of the targeted lesions determined by Response Evaluation Criteria in Solid Tumors V.1.1. CR, complete response; CRC, colorectal cancers; EC, endometrial cancers; ICB, immune checkpoint blockade; IHC, immunohistochemistry; MMRD, mismatch repair-deficient; MSI, microsatellite instability; ORR, overall response rate; PD, progressive disease; PD-L1, programmed death ligand 1; PFS, progression-free survival; PR, partial response; SD, stable disease; Fishers Least Significant Difference (LSD)
Although the αCTLA-4 + αPD-1 combination was very effective, with mice showing a CR (28%; n=7/25), some mice showed stable disease followed by tumor immune escape (28%; n=7/25), and others showed primary resistance (44%; n=11/25) (figure 2I). Monitoring the myelo/lympho ratio in blood revealed that neutrophil accumulation was completely absent in the mice with a CR in contrast to those that experienced progression (figure 2K). A strong increase in CD4+ and CD8+ T cells in the TME of responding mice (figure 2J), a decrease in neutrophil infiltration, and an increase in the activation marker ICOS and a decrease in the exhaustion marker PD-1 among TILs were observed in mice with CR compared with those that experienced progression (online supplemental figure S6). Finally, the triple combination αCTLA-4+αPD-1+αLy6G induced a 100% clinical response with up to 86% of mice achieving complete regression in the 4T1 MMRDhi group, while parental 4T1 cells exhibited no significant delay in tumor growth (figure 2L and online supplemental figure S7). Overall, these data strongly suggest a causal and deleterious role of TIN in αPD-1 resistance, even in MMRD tumors, and could have a major clinical impact on the management of patients with MSI-H/MMRD cancers.
Early on-treatment change of NLR can predict resistance to αPD-L1 therapy in patients with MMRD tumors regardless of the primary tumor site
To evaluate the relevance of our preclinical findings in the clinic, we retrospectively collected data from a cohort of 104 patients with MMRD tumors who received at least one dose of αPD-L1 treatment from November 2014 to October 2020 at Gustave Roussy. The median time of follow-up of the study, defined as the time between the first administration of ICB and last contact, was 14 months (95% CI 9.67 to 20.10, from 0.3 months to 5.5 years). Eighteen distinct primary tumor types were represented, with a majority being colorectal cancers (CRC) (n=33) and endometrial cancers (EC) (n=30) (figure 3A). Tumor burden was quantified by RECIST V.1.1 for 100 patients included in this study (table 2). Patients with measurable changes (n=79) had a range of best responses from a −100% decrease in tumors to a+227% increase, with 30 patients (30%) showing progressive disease, 28 (28%) showing stable disease, 27 (27%) showing a PR and 15 (15%) showing a CR (table 3). At the data cut-off, the ORR and the median OS were 42% (95% CI 32.2 to 51.8) and 24 months (95% CI 14.2 to 40.5), respectively (figure 4A, table 3). We observed a strong disparity in the response rate and PFS according to tumor type, as illustrated in the waterfall plot and swimmer plot, respectively (figures 3B,C and 4B), with no response (0% of 8 patients) and 42% of response (14 of 33 patients) for patients with brain tumors and CRC, respectively.
Patient baseline characteristics
Best overall response per RECIST V.1.1 across MMRD tumor sites
To better understand the heterogeneity of the response to αPD-L1 therapy in patients with MMRD tumors, we investigated the NLR at baseline (NLRbaseline), before the first administration of αPD-L1. We found that NLRbaseline was highly heterogeneous between MMRD tumor types (figure 4C) rendering the use of NLR ratio very difficult across MMRD tumor types. Unexpectedly, NLRbaseline in EC was four times higher than NLRbaseline in CRC. Within these organ subtypes, NLRbaseline value was not able to predict progression or response to αPD-L1 treatment (figure 4D). Moreover, the difference of NLR levels at baseline between EC and CRC were maintained during treatment, regardless of the outcome (response or progression). Thus, no common NLRbaseline cut-off to predict response or resistance to ICB in MMRD tumors could be identified.
As evidenced in our preclinical models, TIN varied according to tumor growth and response to treatment. Therefore, we compared the NLR at the time of progression or nadir (defined as the smallest size of the sum of the targeted lesions determined by RECIST V.1.1) to NLR at baseline (figure 4D). NLR was significantly different during response or progression in EC and tend to reach statistical significance in CRC (p=0.0068 and p=0.0551, respectively, determined by Mann-Whitney test). Thus, we determined the NLRchange (%) for all patients regardless of tumor site during response, nadir (defined as the smallest size of the sum of the targeted lesions determined by RECIST V.1.1) or progression (figure 4E). We found that NLRchange reflected the clinical response. Interestingly, by detecting tumor-associated neutrophils (CD15+) and TILs (CD3+), the change of the CD15+/CD3+ ratio in the tumors mirrored the NLRchange in blood samples (figure 4F,G).
We then evaluated the relevance of NLRchange as an early ‘on-treatment’ blood marker (pre-emptive biomarker) by performing a Kaplan-Meier estimation of OS and PFS according the NLRchange (>0 or <0%) after 2 months of treatment. Note that in this trial, the mean time of assessment of response or progression with usual methods (CT scans) was 5 months (95% CI 3.6 to 6.4 and 95% CI 2.8 to 6.3, respectively) (figure 4H). NLRchange predicted the prognosis of patients (figure 4I). The median OS was not reached for patients with NLRchange <0% and was 14 months for patients with NLRchange >0% (HR log-rank 0.37; 95% CI 0.20 to 0.40). Similarly, the median PFS was 17 months for patients with NLRchange <0% and 5 months for patients with increased NLRchange (HR log-rank 0.51; 95% CI 0.29 to 0.92) (figure 4I). The estimated ORR at 2 months was 55% (95% CI 40.6 to 70.0) for patients with NLRchange <0% and 24% (95% CI 11.7 to 36.3) for patients with NLRchange >0% (figure 4J). Note that we also validated the use of NLRchange to predict αPD-L1 response in EC and CRC (online supplemental figure S8). We then determined the NLRchange for each patient in the cohort with an objective response or progression and found that NLRchange could also be used to track acquired resistance or long-lasting response to ICB over time (figure 4K). Altogether, these results reveal the importance of the NLRchange in predicting response or resistance to αPD-L1 treatment for patients with MMRD tumors, regardless of tumor anatomic site or histology and reinforce the deleterious role of TIN in cancer patients treated with ICB.
Discussion
In this study, we have shown that inactivation of the Msh2 gene results in a drastic increase in indels and single nucleotide substitutions over time in both colorectal CT26 and breast 4T1 syngeneic tumor models. However, these models did not show the same response to αPD-1 antibodies, as only mice bearing MMRDhi CT26 tumors responded to αPD-1, while TIN abundance impeded the αPD-1 response in the MMRDhi 4T1 model. Depletion of TIN or targeting of Treg cells using αCD25 or αCTLA-4 antibodies restored αPD-1 response in MMRDhi 4T1 tumor-bearing mice. In patients with MMRD tumors, the NLR dynamically evolved in response to αPD-1 regardless of tumor histology and might be considered as an early on-treatment biomarker to identify αPD-1 primary resistance in MMR-deficient tumors. Moreover, patients with high blood levels of TIN should benefit from αCTLA-4+αPD-1 combination since mice data suggested that blocking or depleting Treg cells may help to limit TIN accumulation. Finally, longitudinal assessment of the NLR (a non-invasive and cost-effective biomarker) over the first 2 months of treatment might be a potential biomarker to guide clinicians for a rapid therapeutic switch in patients with MSI-H/MMRD tumors.
Using two engineered mouse tumor models, we found that the number of indels (and to a lesser extent TMB) correlates with response to immunotherapies. Indeed, only MMRDhi (not MMRDint) CT26 or 4T1 tumors responded to αPD-1 or αPD-1+αCTLA-4 treatment, respectively. This is consistent with the study reported by Chan and colleagues that demonstrated that the intensity of MSI is critical in the αPD-1 response in MMR-deficient tumors.29 We also revealed that despite the presence of high TMB, αPD-1 was ineffective in the MMRDhi 4T1 model, and only the combination of αPD-1+αCTLA-4 therapy resulted in regression of MMRD tumors. Based on these results, one can expect that a subset of patients with MSI-H cancers might be resistant to PD-1 inhibition but respond to the αPD-1+αCTLA-4 combination. Interestingly, the results of the phase II CheckMate-142 trial indicated that nivolumab plus ipilimumab achieved higher response rates than previously reported for nivolumab (55% vs 31% ORR) in patients with pretreated MSI-H/MMRD metastatic CRC.7 35 Our preclinical results also question the reliability of TMB as a predictive biomarker for αPD-1. Of note, the Food and Drug Administration approved the use of the immune checkpoint inhibitor αPD-1 antibody, pembrolizumab in the treatment of adult and pediatric patients with advanced solid tumors with a high TMB (TMB >10 mut/Mb). Our data showed that αPD-1 was ineffective in the MMRDhi 4T1 model with a TMB >50 mut/Mb, suggesting that TMB should be used with caution as a predictive biomarker for αPD-1. This is in agreement with a recent study that investigated TMB as a biomarker of ICB response across cancers.36
Beyond TMB, we also explored immune features and the ME in MMRD mouse models. It has been reported that MMRDhi CT26 tumors show a modest enrichment of cytotoxic T cells compared with parental tumors, reflecting an increase in the immunogenicity of MMRDhi CT26 model that leads to αPD-1 response.29 In the 4T1 model, no difference in the abundance of T cell infiltration was detected in MMRDhi compared with parental tumors, as reported for the poorly immunogenic B16-F10 melanoma model inactivated for Msh2 gene.29 However, we observed a marked activation and proliferation in tumor-infiltrating T cells in 4T1 MMRD model compared with parental cells. Recent works have highlighted that TILs, even when abundant, could be dysfunctional, limiting the response to αPD-1 therapy. For instance, studies revealed the importance of co-stimulation in αPD-1 therapy efficacy, such as CD2837 or, more recently, CD226. The loss of CD226 expression in CD8 +T cells infiltrating the tumor has been proposed as an additional mechanism of tumor resistance to αPD-1 therapy.38 Moreover, the MMRDhi phenotype did not prevent TIN accumulation in the 4T1 model. Since TIN impaired the response to αPD-1 therapy in MMRDhi 4T1 tumors, it is conceivable that TIN could cause functional modifications of TILs, leading to αPD-1 resistance. Many reports have shown that neutrophils can favor immunosuppression.39–42 In line with our data neutrophils were shown to favor Treg cells recruitment.43 44 Additionally, neutrophil extracellular traps were shown to facilitate crosstalk between innate and adaptive immunity by promoting Treg cell activity and Treg cell differentiation from naïve CD4 +T cells.45
In line with our preclinical data, NLRchange early after treatment initiation might be a good predictor of αPD-L1 response in patients with MMRD tumors. Other studies have reported that dynamic changes in the NLR shortly after treatment are associated with the treatment outcomes in patients with different cancer types.46–49 In our study, clinical data show the high variability in OS and PFS across 18 MSI-H cancer types treated with αPD-L1. This result is consistent with previous clinical studies.9 By evaluating the NLR value at baseline, we were not able to identify a common cut-off predicting αPD-L1 response. However, our results showed that NLRchange at 2 months after treatment initiation could well discriminate patients with progressive disease from those with response to PD-L1 inhibition, regardless of the anatomic sites of MMRD tumors. Moreover, change in NLR may precede the first radiological assessment, thus allowing an early evaluation and a rapid adaptation of treatment.
Our study has some limitations. Preclinical data did not provide mechanistic insights to explain how neutrophils drive primary resistance to PD-1 inhibitors in MMRDhi mouse models. Clarifying the interplay between neutrophils and Treg cells is important for answering this question. Moreover, the clinical data came from a single-center retrospective study, and multicenter prospective cohort studies with larger sample sizes are warranted in the future. Finally, the NLR can be influenced by multiple factors, such as infection or drug uptake, which were not assessed in this study.
Taken together, our results suggest an unexpected crosstalk between Treg cells and TIN that could favor immunosuppression and lack of αPD-1 response even in hypermutated tumors. Our data provide a rationale for the use of αPD-1+αCTLA-4 combination therapy in patients with MMRD tumor showing elevated levels of neutrophils.
Data availability statement
Data are available upon reasonable request. All data needed to evaluate the conclusions in the paper are present in the paper and/or the Supplementary Materials, except for the raw data from exomes that can be requested to patricia.kannouche@gustaveroussy.fr.
Ethics statements
Patient consent for publication
Ethics approval
For patients’ data included in the manuscript, the study was included as ‘méthodologie de référence MR-004’ for the processing of personal data for the purposes of study, evaluation or research not involving the human person. More specifically, it concerns studies that do not meet the definition of research involving the human person, in particular studies concerning the re-use of data. An information letter delivered a specific information to living patients participating in the study. Moreover, we confirm the submission of the project questionnaire to the Health Data Hub. For preclinical data obtained with mice, the animals’ care was in accordance with institutional guidelines (French Animal Experimentation Ethic Committee n°26: #02005.02 and APAFIS#21380-2019070808595692 v2).
Acknowledgments
The authors acknowledge the contribution of Patrick Gonin and Karine Ser-Le Roux from the Preclinical Evaluation PlatForm (PFEP); Laetitia Bordelet, Nicolas Signolle and Olivia Bawa from the Experimental Pathology PlatForm (PETRA); Yann Lecluse, Cyril Catelain and Philippe Rameau from the Imaging and Cytometry PlatForm (PFIC) at Gustave Roussy. We also thank Jean-Paul Concordet from the TACGENE PlatForm (MNHN, Paris) for Msh2 CRISPR/cas9 KO plasmid.
References
Supplementary materials
Supplementary Data
This web only file has been produced by the BMJ Publishing Group from an electronic file supplied by the author(s) and has not been edited for content.
Footnotes
Twitter @ReginaldoCARosa
AH and AAY contributed equally.
NC and PK contributed equally.
Correction notice This article has been corrected since it was first published online. Patricia Kannouche has now been indicated as co-corresponding author.
Contributors Conceptualization: NC, PK. Methodology: LN-B, AAY, SN, LdF, MD, J-MJ, RCAR, CP, LC, SA. Formal analysis: LN-B, AAY, SN, J-YS, AH, NC, PK. Investigation: LN-B, AH, AM, AL, NC, PK. Resources: AH, AM, AL, PV, CS, EC, AAY, SN, NC, PK. Data curation: LN-B, AH, AM, AL, PV, CS, EC, J-YS. Visualization: LN-B, AAY, SN, NC, PK. Funding acquisition: NC, PK. Project administration: NC, PK. Supervision: NC, PK. Writing—original draft: LN-B, NC, PK. Writing—review and editing: LN-B, AAY, SN, LdF, MD, J-MJ, LC, RCAR, CP, SA, AH, AM, AL, J-YS, PV, CS, EC, NC, PK. Authors acting as guarantor: PK, NC.
Funding This work was funded by: Gustave Roussy Cancer Campus. Centre National de la Recherche Scientifique (CNRS). SIRIC SOCRATE INCa-DGOS-INSERM_6043. SIRIC SOCRATE 2.0 INCa-DGOS-INSERM_12551. La Ligue Nationale Contre le Cancer – Equipe labellisée EL2018_Kannouche. LN-B received funding from Philanthropia Foundation – Lombard Odier and la Ligue Nationale Contre le Cancer.
Competing interests NC reports grants from Cytune Pharma, grants from BMS, grants from SANOFI, personal fees from AstraZeneca France, outside the submitted work. Other authors declare no conflict of interest with this work.
Provenance and peer review Not commissioned; externally peer reviewed.
Supplemental material This content has been supplied by the author(s). It has not been vetted by BMJ Publishing Group Limited (BMJ) and may not have been peer-reviewed. Any opinions or recommendations discussed are solely those of the author(s) and are not endorsed by BMJ. BMJ disclaims all liability and responsibility arising from any reliance placed on the content. Where the content includes any translated material, BMJ does not warrant the accuracy and reliability of the translations (including but not limited to local regulations, clinical guidelines, terminology, drug names and drug dosages), and is not responsible for any error and/or omissions arising from translation and adaptation or otherwise.