Article Text

Abstract
Background A growing body of evidence suggests that T-cell responses against neoantigens are critical regulators of response to immune checkpoint blockade. We previously showed that circulating neoantigen-specific CD8 T cells in patients with lung cancer responding to anti-Programmed death-ligand 1 (PD-L1) (atezolizumab) exhibit a unique phenotype with high expression of CD57, CD244, and KLRG1. Here, we extended our analysis on neoantigen-specific CD8 T cells to patients with metastatic urothelial cancer (mUC) and further profiled total CD8 T cells to identify blood-based predictive biomarkers of response to atezolizumab.
Methods We identified tumor neoantigens from 20 patients with mUC and profiled their peripheral CD8 T cells using highly multiplexed combinatorial tetramer staining. Another set of patients with mUC treated with atezolizumab (n=30) or chemotherapy (n=40) were selected to profile peripheral CD8 T cells by mass cytometry. Using single-cell transcriptional analysis (single-cell RNA sequencing (scRNA-seq)), together with CITE-seq (cellular indexing of transcriptomes and epitopes by sequencing) and paired T-cell receptor (TCR) sequencing, we further characterized peripheral CD8 T cells in a subset of patients (n=16).
Results High frequency of CD57 was observed in neoantigen-specific CD8 T cells in patients with mUC responding to atezolizumab. Extending these findings to bulk CD8 T cells, we found higher frequency of CD57 expressing CD8 T cells before treatment in patients responding to atezolizumab (n=20, p<0.01) but not to chemotherapy. These findings were corroborated in a validation cohort (n=30, p<0.01) and notably were independent of known biomarkers of response. scRNA-seq analysis identified a clonally expanded cluster enriched within CD57+ CD8 T cells in responding patients characterized by higher expression of genes associated with activation, cytotoxicity, and tissue-resident memory markers. Furthermore, compared with CD57− CD8 T cells, TCRs of CD57+ CD8 T cells showed increased overlap with the TCR repertoire of tumor-infiltrating T cells.
Conclusions Collectively, we show high frequencies of CD57 among neoantigen-specific and bulk CD8 T cells in patients responding to atezolizumab. The TCR repertoire overlap between peripheral CD57+ CD8 T cells and tumor-infiltrating lymphocytes suggest that accumulation of peripheral CD57+ CD8 T cells is reflective of an ongoing antitumor T-cell response. Our findings provide evidence and rationale for using circulating CD8 T cells expressing CD57 as a readily accessible blood-based biomarker for selecting patients with mUC for atezolizumab therapy.
- CD8-positive T-lymphocytes
- immunotherapy
- urinary bladder neoplasms
- receptors, antigen
Data availability statement
Data are available in a public, open access repository. All data relevant to the study are included in the article or uploaded as supplementary information.
This is an open access article distributed in accordance with the Creative Commons Attribution Non Commercial (CC BY-NC 4.0) license, which permits others to distribute, remix, adapt, build upon this work non-commercially, and license their derivative works on different terms, provided the original work is properly cited, appropriate credit is given, any changes made indicated, and the use is non-commercial. See http://creativecommons.org/licenses/by-nc/4.0/.
Statistics from Altmetric.com
WHAT IS ALREADY KNOWN ON THIS TOPIC
Efficacy of checkpoint blockade therapy in patients with cancer is limited to patients with pre-existing antitumor (including neoantigen-specific) T-cell responses. However, it has been difficult to identify tumor antigen-specific T cells, especially in the periphery to inform an ongoing antitumor T-cell response and predicting response to cancer immunotherapy in clinic.
WHAT THIS STUDY ADDS
The current study describes that CD57 expression is enriched in neoantigen-specific CD8 T cells, and elevated frequency of CD57+ CD8 T cells is associated with response to anti-PD-L1 treatment in patients with metastatic urothelial cancer (mUC).
HOW THIS STUDY MIGHT AFFECT RESEARCH, PRACTICE OR POLICY
These data provide a new link between tumor specificity and T-cell differentiation status, represented by CD57, and a promising and easy-to-implement immune biomarker to select patients for anti-PD-L1 therapy in patients with mUC.
Background
Immune checkpoint inhibitors (ICI) such as blocking antibodies targeting PD-1 or PD-L1 are major breakthroughs in the therapy and standard of care for many cancers including urothelial carcinoma. However, only a fraction of patients with advanced disease experience clinical benefit,1 2 highlighting the need for predictive biomarkers. Neoantigens, encoded by somatic mutations in tumors, are key targets of antitumor CD8 T-cell response upon treatment with ICI,3–6 and neoantigen-specific CD8 T cells can also be detected in circulation.5 7–9 However, tracking of these specific cells is quite challenging in clinical settings, partly due to laborious experimental detection methods and their extremely low frequency in circulation.
Several groups have explored association of peripheral blood-based T-cell biomarkers with clinical outcomes or to identify tumor-specific T cells in patients with cancer treated with ICI.10–12 We previously showed that neoantigen-specific CD8 T cells are detected more frequently in patients responding to atezolizumab and exhibit more differentiated effector phenotypes, reflected by high expression of CD57.13 Notably, CD57 is a well-known marker on late-differentiated cells, and accumulation of CD57 expressing CD8 T cells has been associated with age-related immunosenescence and chronic antigenic stimulation during viral infection.14 However, in patients with cancer, the role of CD57+ CD8 T cells has not been clearly defined and contrasting reports have been published. For example, increased CD57+ CD8 T-cell frequency was shown to be positively correlated with improved survival in patients with renal cell cancer during interferon alpha therapy.15 In contrast, a negative correlation with overall survival (OS) was observed in patients with higher CD57+ CD8 T cells in cancers such as gastric, renal, and melanoma,15–17 suggesting a more complex biology of CD57+ CD8 T cells. Indeed, immunosenescence potential of CD57+ CD8 T cells has been questioned in studies showing prolonged survival and proliferation in response to IL-15.18
In the current study, we investigated profiles of circulating CD8 T cells using high-dimensional mass cytometry to identify T-cell markers that were associated with clinical response in patients with metastatic urothelial cancer (mUC) treated with atezolizumab. In addition, single-cell analysis was used to analyze cellular composition of CD57+ CD8 T cells in the periphery and to compare their T-cell receptor (TCR) repertoire with tumor-infiltrating lymphocytes (TILs). Our data revealed remarkable differences between responder and non-responder patients, elucidating the potential role of CD57+ CD8 T cells in peripheral blood as a predictive biomarker of clinical response in atezolizumab-treated patients with mUC.
Methods
Study design and patient samples
Peripheral blood mononuclear cells (PBMCs) from patients treated with atezolizumab were selected from two distinct cohorts (discovery cohort and validation cohort) from the IMvigor 210 trial (NCT02108652), which was a multicenter, single-arm, phase II trial with inoperable locally advanced or metastatic urothelial carcinoma treated with atezolizumab.19 20 All samples were randomly selected from patients who met the following criteria: (1) they had to have complete response/partial response (hereon referred to as responders) or progressive disease (hereon referred to as non-responders); (2) there must be sufficient PBMCs from both the C1D1 (baseline, before the administration of atezolizumab) and C2D1 (3 weeks post-treatment initiation) time points; (3) only for the discovery cohort there must be availability of tumor-derived RNA-seq and whole-exome sequencing to predict list of tumor neoantigens. The discovery cohort comprised 40 PBMC samples from 20 randomly selected patients (11 responders and 9 non-responders) with a baseline and an on-treatment sample. The validation cohort included 30 randomly selected patients (15 responders and 15 non-responders) treated with atezolizumab, each with a baseline sample and an on-treatment sample, and 40 patient samples treated with chemotherapy (20 responders and 20 non-responders) from the IMvigor 211 trial, each with a baseline sample only. All patients provided written informed consent, which included the exploratory biomarker end points described here. Additional details on patients are in online supplemental methods and table S1.
Supplemental material
Supplemental material
Neoantigen prediction
Neoantigen prediction for prioritizing a list of candidate neoantigen peptides for the generation of peptide–MHC (major histocompatibility complex) class I tetramers was run as previously published and described in detail in the online supplemental methods.13 Briefly, somatic variants were called using whole-exome sequencing from tumor and PBMCs, and expressed mutations were identified using RNA-seq alignments. For each expressed somatic mutation resulting in an amino acid change, HLA (human leukocyte antigen) –peptide binding affinities were predicted across all pairs of HLA alleles and 8–11 mer peptides containing the mutation using NetMHCcons-1.1.21 Neoantigens were assigned per mutation by selecting the minimum percentile rank score across all HLA-peptide pairs (optimal predicted neoepitope) (online supplemental table S3). A percentile rank cut-off of 2 was used to identify all candidate neoepitopes for the HLA alleles restricted to HLA-A*02:01, HLA-A*01:01, HLA-A*11:01, HLA-A*03:01, and HLA-B*07:02. A total of 656 patient-specific neoantigen sequences were selected for peptide synthesis and tetramer generation (online supplemental table S3).
Supplemental material
Multiplexed tetramer staining
To screen for neoantigen-specific CD8 T cells, we set up a three-metal combinatorial tetramer staining approach, as described previously.13 22–24 All samples were run in technical replicates by using a second configuration staining with a completely different barcoding scheme.
Data and statistical analyses
Time-to-event outcomes were estimated using the Kaplan-Meier method, which was used to estimate the probability of OS and to estimate the median OS for the IMvigor210 cohort. The OS was computed by the log-rank test. For OS analysis, data for patients who were alive were censored at the time of the last contact. The HRs and 95% CIs for OS were estimated by a Cox regression model. Cox proportional hazards and linear regression models were performed to conduct univariate and multivariate analyses. Multivariate Cox proportional hazard models were used to investigate associations of CD57 frequency and OS, adjusting for PD-L1 immune cell (IC) and/or tumor mutation burden (TMB) as covariates. Multivariate adjusted data were presented as HRs with 95% CIs, as well as p values.
Additional method details are provided in the online supplemental methods.
Results
Neoantigen-specific CD8 T cells with a late-differentiated effector phenotype are enriched in patients responding to atezolizumab
Since patients with mUC are characterized by a high mutational burden in the tumor and are responsive to immunotherapy,20 we analyzed the presence of neoantigen-specific CD8 T cells in peripheral blood from a cohort of 20 patients with mUC (discovery cohort) selected from the phase II trial (IMvigor210) investigating the clinical activity of PD-L1 blockade with atezolizumab.19 20 Eleven patients with partial or complete response (from hereon referred to as responders) and 9 patients with progressive disease (from hereon referred to as non-responders) were randomly selected based on their best confirmed overall responses according to RECIST V.1.1 (for treatment and patient characteristics, refer to the Methods section and online supplemental table S1). We conducted whole-exome sequencing of DNA from tumor and matched normal blood samples and predicted neoepitopes based on confirmation of expression by RNA-seq and potential for MHC class I binding to patient-specific HLAs (online supplemental table S2). This pipeline yielded 656 unique peptides predicted to bind to five different patient HLA alleles (HLA-A*01:01, HLA-A*02:01, HLA-A*03:01, HLA-A*11:01, and HLA-B*07:02). We used mass cytometry-based combinatorial multiplexed peptide–MHC-I tetramer staining approach to screen for numerous CD8 T-cell reactivities within the same sample.24 Individual peptide–MHC-I complexes were tetramerized using a mixture of three different metal labeled streptavidin molecules to form a unique triple staining code for each candidate antigen. In total, we screened CD8 T-cell reactivity against 15–68 predicted tumor neoepitopes per patient (online supplemental tables S2,S3).
Supplemental material
Consistent with our previous study in patients with lung cancer,13 we observed a greater abundance of unique neoantigen specificities among CD8 T cells in patients responding to atezolizumab treatment (figure 1A and online supplemental table S3). Despite screening neoantigens against limited HLAs, we were able to detect T-cell responses against neoantigens derived from genes such as FGFR3, GNA13, PPARG, and PIK3CA, which are known to be frequently mutated in mUC (online supplemental table S3). The frequencies of all neoantigen-specific CD8 T cells detected before atezolizumab and after atezolizumab treatment ranged from 0.002% to 0.075% of the total CD8 T cells (figure 1B). Neoantigen-specific CD8 T-cell responses after treatment could be observed in both patient groups, yet the small sample size prevented a robust statistical assessment of the association between atezolizumab treatment and the expansion of neoantigen-specific T-cell responses.
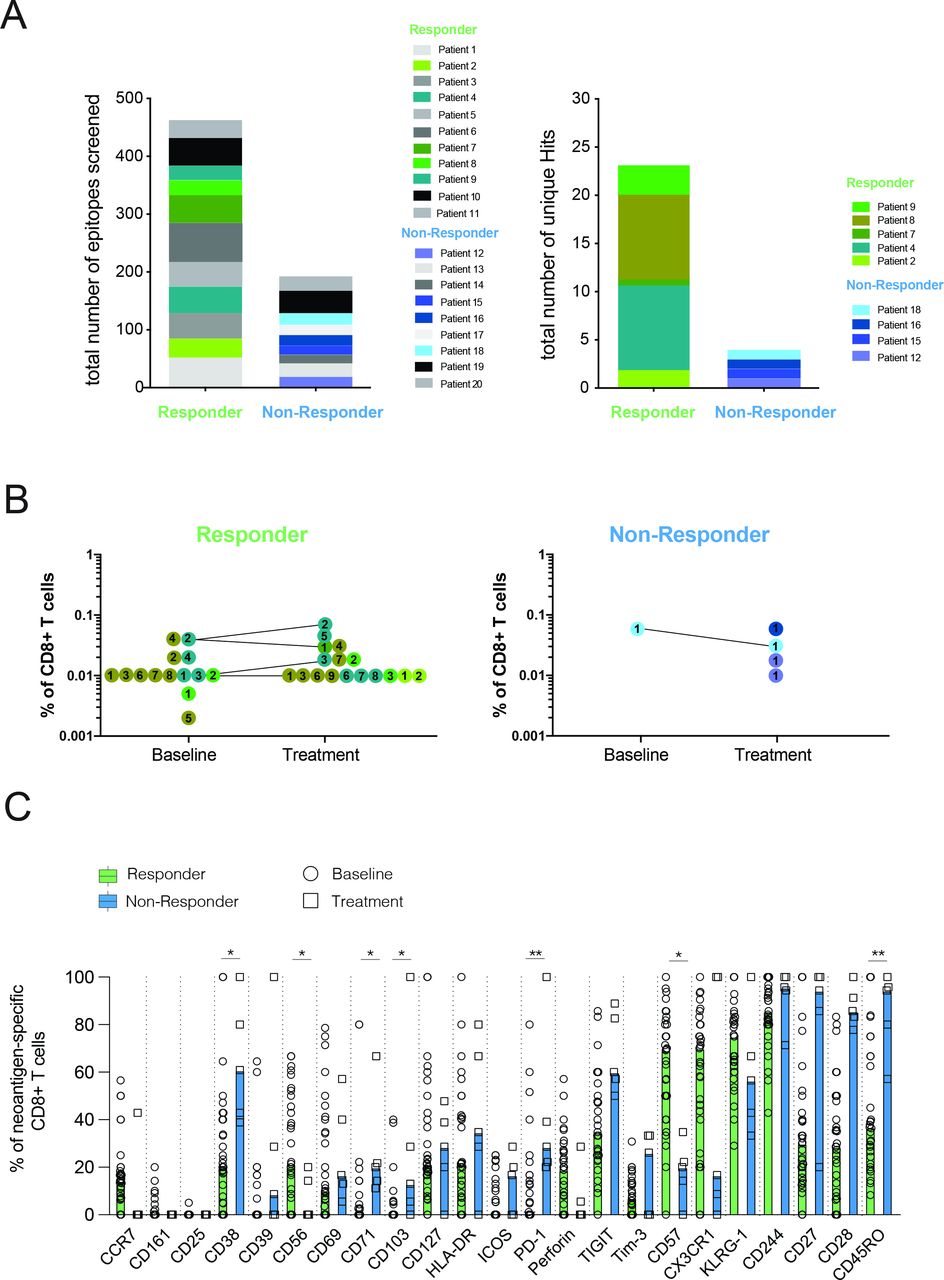
Patients responding to atezolizumab treatment exhibit several unique neoantigen specificities with a differentiated effector T-cell phenotype. (A) Number of unique neoantigen specificities detected from a total of 656 neoantigen candidates tested across atezolizumab responder and non-responder patients. (B) Frequencies of neoantigen-specific CD8 T cells detected within all patients. Matching colored dots and corresponding numbers indicate the same neoantigen specificities detected at baseline and on-treatment time points. Connecting lines visualize the detection of the same antigen specificities at both time points. (C) Expression of phenotypical markers by neoantigen-specific CD8 T cells from responder and non-responder patients at baseline and on atezolizumab treatment. Data shown are median values. *P<0.05, **P<0.01. Wilcoxon rank-sum test. P values were adjusted for multiple testing using the Benjamini-Hochberg method to control the false discovery rate.
Using a specific CD8 T-cell staining panel consisting of 23 phenotypical markers (online supplemental table S4), we further analyzed the profiles of all neoantigen-specific T cells detected. To objectively compare the expression of all phenotypical markers assessed, gating was performed separately for each phenotypical marker, and individual thresholds were defined based on the expression intensity on relevant IC subsets from the same individual. While neoantigen-specific CD8 T cells from non-responders displayed high expression of markers associated with early T-cell differentiation status (CD27, CD28, and CD45RO) neoantigen-specific CD8 T cells from responders mainly differed in expression of CD57 and were further characterized by higher expression of CX3CR1, and KLRG1, thus reflecting a late-differentiated effector phenotype (figure 1C). This observed phenotype largely remained in post-treatment samples (online supplemental figure S1A).
Supplemental material
Responding patients have higher frequencies of CD57 expressing CD8 T cells in peripheral blood prior to therapy
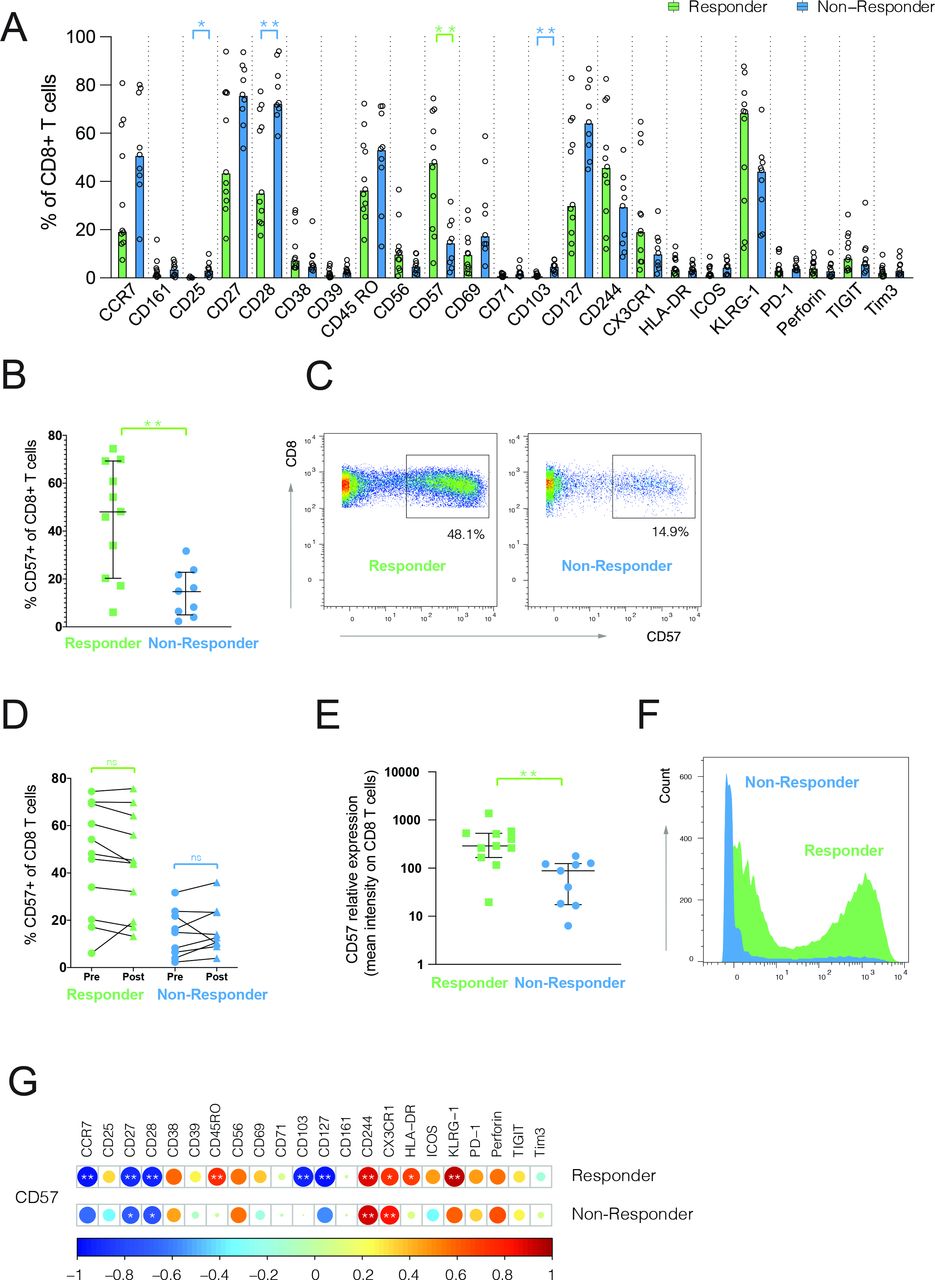
Next, we compared the frequencies of major IC types and CD8 T-cell lineage (online supplemental figure S2A,B) and did not detect significant differences. However, when comparing all markers on bulk CD8 T cells, we observed a significant difference in the expression of CD25, CD28, CD103, and CD57 between responders and non-responders (figure 2A). Since we also demonstrated higher CD57 expression on neoantigen-specific CD8 T cells in responding patients, we focused our analysis on CD57, which has been associated with potent effector functions of circulating T cells and, together with CD27 and CD28, has been used to define late-differentiated T cells.14 Notably, the expression of CD57 and CD28 was inversely correlated in our studies as well (online supplemental figure S3). We found more than threefold higher frequencies of CD57 expressing CD8 T cells in responders, compared with non-responder patients at baseline (median 48.1% responder and 14.9% non-responders, p=0.0042) (figure 2B,C), which remained unchanged with atezolizumab treatment (figure 2D). Likewise, CD57 expression was threefold higher on responder patients (median 290 responder and 87.90 non-responders, p=0.0023) (figure 2E,F). Next, we compared the frequencies of cells expressing all phenotypical markers in correlation to their CD57 expression levels. While T cells displaying lower frequencies of CD57 were mainly characterized by a high expression of CCR7, CD27, CD28, and CD127, high CD57 frequency was associated with the expression of KLRG1, CD244, and CX3CR1 (figure 2G). Notably, a similar trend was seen among non-responders, but phenotypical segregation was less apparent because of the low overall frequency of CD57+ CD8 T cells (figure 2G). In summary, these data show an enrichment of CD57+ CD8 T cells with a late-differentiated effector phenotype in atezolizumab responder patients before treatment onset.

Late-differentiated CD57+ CD8 T cells are enriched in atezolizumab responder patients at baseline. (A,B) Frequencies of CD8 T cells positive for different phenotypical markers (A) or CD57 (B) in responders (n=11) and non-responders (n=9) assessed in baseline blood. Data shown are median values. *P<0.05, **P<0.01. Wilcoxon rank-sum test. P values were adjusted for multiple testing using the Benjamini-Hochberg method to control the false discovery rate. (C) Representative staining examples for CD57 expression on CD8 T cells. (D) Frequency of CD57+ CD8 T cells at baseline (pre) and on-treatment (post). Wilcoxon matched-pairs signed rank test. (E) Average expression of CD57 on CD8 T cells from responders and non-responders at baseline. **P<0.01. Wilcoxon rank-sum test. (F) Representative histogram examples for CD57 expression on CD8 T cells. (G) Correlogram showing correlation between frequency of CD57+ CD8 T cells and frequency of other phenotypical markers analyzed on bulk CD8 T cells. Pearson’s correlation coefficients were indicated by a heat scale whereby red color shows positive linear correlation, and blue color shows negative linear correlation. *P<0.05, **P<0.01. ns, non-significant.

CD57+ CD8 T cells are enriched in patients responding to atezolizumab treatment but not chemotherapy. (A) CD57+ CD8 T-cell frequency validation cohort of atezolizumab-treated patients in baseline peripheral blood (n=15 in each group). (B) CD57 expression on CD8 T cells in baseline peripheral blood from responder and non-responder patients treated with chemotherapy (n=20 each group). Wilcoxon rank-sum test. (C) Heatmap showing the frequencies of all phenotypical markers assessed on CD57+ CD8 T cells and CD57ー CD8 T cells from atezolizumab responders and non-responders at baseline. (D) Expression of CD57 on major CD8 T-cell subsets (naïve): CD45RA+, CCR7+; TCM: CD45RAー, CCR7+; TEM: CD45RAー, CCR7ー; and TEMRA: CD45RA+, CCR7ー in atezolizumab-treated responders and non-responders in peripheral blood. *P<0.05, **P<0.01. Wilcoxon rank-sum test. ns, not significant; TCM, T central memory; TEM, T effector memory; TEMRA, T effector memory cells expressing CD45RA.
CD57+ CD8 T cells are enriched in patients responding to atezolizumab but not chemotherapy
We extended our analysis to a larger independent set (validation cohort) of patients with mUC (15 responders and 15 non-responders) from the IMvigor210 study. We detected a significant difference in the frequency of CD57+ CD8 T cells between atezolizumab responder and non-responder patients (median 41.6% responder and 16.9% non-responders, p=0.0066) at baseline (figure 3A). This difference remained unchanged in the on-treatment samples between the two groups, despite a small decrease in the cell frequencies from the responder group (online supplemental figure S4A; median 41.6% baseline and 37.7% on-treatment, p=0.018). In addition, we did not find any striking differences in the phenotypes of CD57+ CD8 T cells after treatment onset in both patient groups (online supplemental figure S4B). To rule out the prognostic effect, we observed no significant difference in the percentage of CD57 expressing CD8 T cells at baseline between chemotherapy responders and non-responders (median 29.1% and 31.2%, respectively) (figure 3B) (see online supplemental methods for patient selection). Collectively, these data underscore our hypothesis that a high expression of CD57 on CD8 T cells is predictive of clinical response to atezolizumab treatment.
Elevated levels of CD57 expressing CD8 T effector memory (TEM) and T effector memory cells expressing CD45RA (TEMRA) cells in patients responding to atezolizumab
In the validation cohort, with an extended panel (31 markers, online supplemental table S5), CD57+ CD8 T cells displayed a phenotype that skewed toward higher expression of granzyme B, perforin, CD244, CX3CR1, and KLRG1, while CD57− CD8 T cells were mainly enriched in cells expressing CCR7, CD28, and CD27, thus reflecting a naïve and early memory T-cell status (figure 3C). Frequencies of individual markers on CD57+ and CD57− CD8 T cells are shown in online supplemental figure S5. Interestingly, phenotypes were similar when CD57+ or CD57− CD8 T cells were compared between responder and non-responder patients.
Supplemental material
To assess the presence of phenotypically different CD57+ CD8 T-cell subpopulations, we applied the PhenoGraph algorithm25 for automated unsupervised cell clustering followed by a manual combination of clusters containing cells with similar marker expression profiles (online supplemental figure S6A). We saw a trend toward early differentiated effector memory and terminal effector memory cell subset enrichment in responders (online supplemental figure S6B).
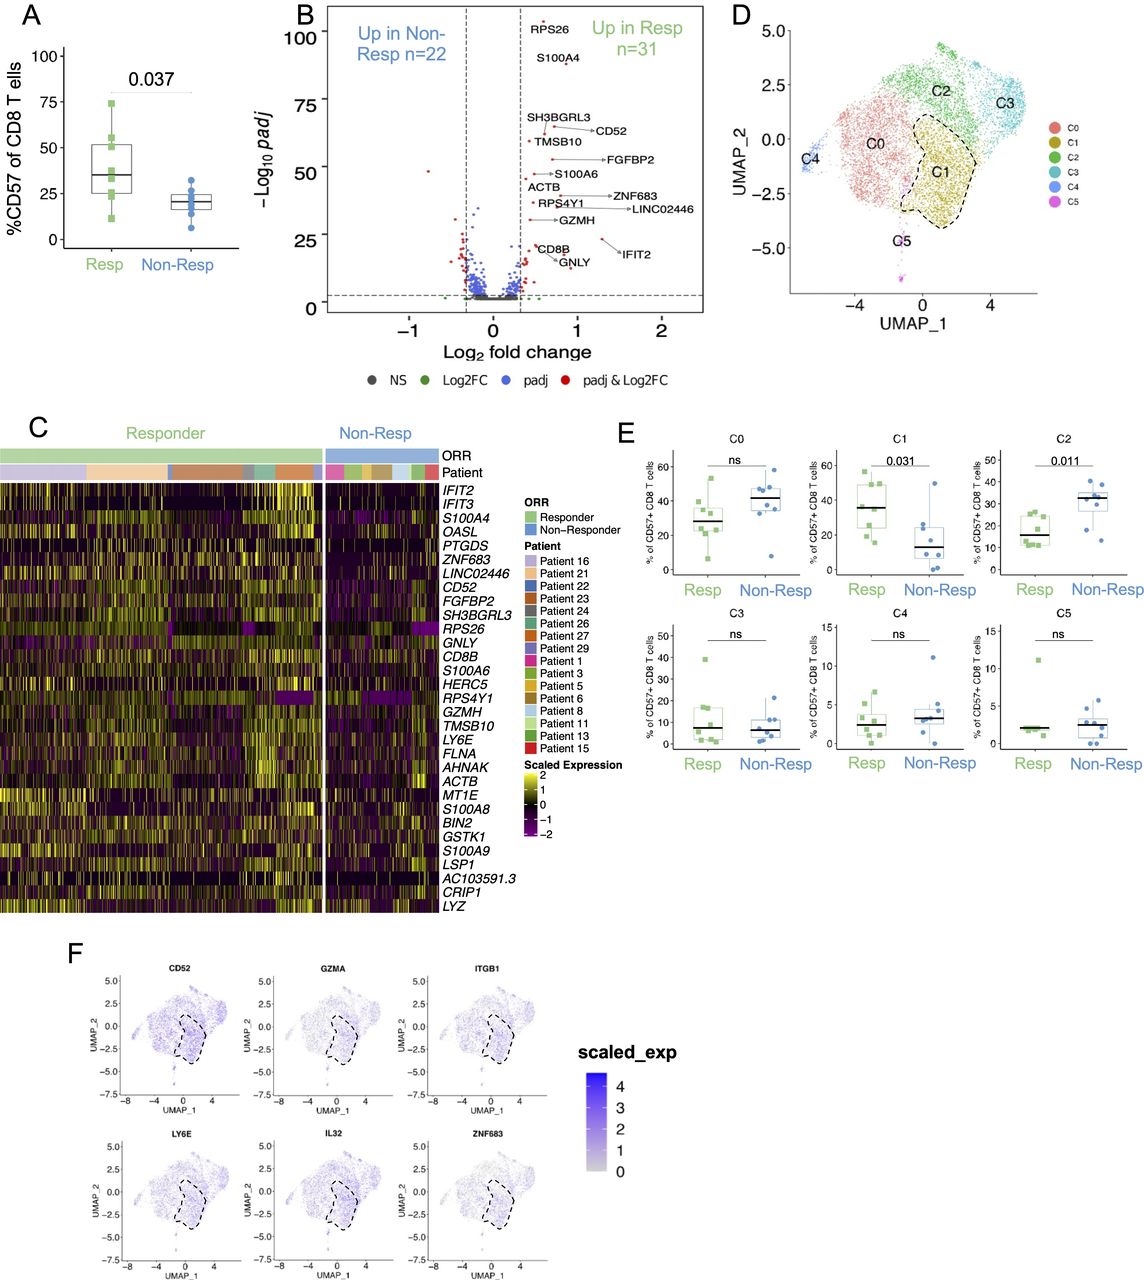
Single-cell analysis of CD57+ CD8 T cells reveals a unique cluster enriched in responding patients. (A) CD57+ frequencies among CD8 T cells at baseline calculated using CITE-seq analysis, p=0.037; two-tailed unpaired Student’s t-test. (B) Volcano plot showing DEGs in CD57+ CD8 T cells at baseline. DEGs are nominated by requiring at least 1.25 times fold change and an adjusted p value of <0.05 with gene expression detected in at least 10% of cells in either one of the two comparison groups. Selected DEGs are labeled in the volcano plot, and red dots represent DEGs. (C) Heatmap displaying the scaled expression of upregulated genes ranked by fold change between CD57+ CD8 T cells from responders and non-responders at baseline. (D) UMAP (uniform manifold approximation and projection) of CD57+ CD8 T cells profiled by scRNA-seq (n=8406). Cluster 1 is highlighted by a dotted line. (E) Proportions of individual clusters (as defined in D) out of all CD57+ CD8 T cells were compared in responders versus non-responders at baseline. Two-tailed unpaired Student’s t-test. (F) UMAP plot showing the expression of top genes identified to be enriched in cluster C1. Cluster 1 is highlighted by a dotted line. DEG, differentially expressed gene; ns, not significant; scRNA-seq, single-cell RNA sequencing.
Further separation of T cells showed the majority of CD57 expression was restricted to effector memory and terminal effector memory cells, and responder patients showed higher CD57 expression in both subsets (figure 3D). Interestingly, we did not observe any differences when we compared these subsets derived from the total CD8 T-cell population, which confirmed our findings in the discovery cohort.
Association of CD57+ CD8 T cells with better clinical outcome is independent of previously defined biomarkers of response
Next, we compared the association between previously described biomarkers, PD-L1 expression in the tumor and TMB, with the frequencies of circulating CD57+ CD8 T cells.26 As shown in figure 4A, CD57 expression is enriched in patients responding to atezolizumab regardless of PD-L1 expression on the immune cell (IC) or tumor cell (TC), or the TMB score. In the current study, tumor PD-L1 data were available for all patients, whereas 84% (42/50) of samples had TMB data in the atezolizumab treatment cohorts. As shown in figure 4B,C, there was no clinical response association with either PD-L1 IC (p=0.196) or TMB. Consistent with the clinical findings, levels of CD57+ CD8 T cells in peripheral blood were independent of tumor PD-L1 IC score (figure 4D). TMB score and level of CD57+ CD8 T cells showed a weak but significant correlation (R=0.376, p=0.014) (figure 4E). In the chemotherapy cohort, neither the percent of CD57 expressing CD8 T cells nor the level of PD-L1 IC or TC expression, or TMB score showed any association with clinical response (online supplemental figure S7A–D). Using pooled patients from both discovery and validation cohorts, we found CD57+ CD8 T-cell levels were significantly associated with better OS in patients treated with atezolizumab (figure 4F). CD57 frequency was a significant predictor of atezolizumab efficacy, even after adjusting for PD-L1 IC and TMB as covariates (online supplemental figure S7E). Consistently, addition of PD-L1 IC and TMB scores as covariates during multivariate analysis did not show extra benefit in predicting response in atezolizumab monotherapy in this subset of patients (online supplemental figure S7F). Taken together, these data suggest that CD57+ CD8 T cell is a strong independent predictor of clinical response to atezolizumab in patients with mUC compared with currently existing biomarkers of response to ICI.

Comparison of tumor PD-L1 score and TMB with CD57+ CD8 T cells in peripheral blood from responders and non-responders. (A) Heatmap showing frequency of CD57+ peripheral blood CD8 T cells, tumor PD-L1 immunohistochemistry score on IC and TC, as well as TMB score in all patients. (B) Bar chart representing the proportion of responders to non-responders by PD-L1 IC score status. P value is calculated by Χ2 test. (C) Bar chart representing the median TMB score in each response group. (D) Frequency of CD57+ peripheral blood CD8 T cells in patients separated based on PD-L1 IC score status. Wilcoxon rank-sum test. (E) Correlation plot showing the association between TMB score and frequency of CD57+ peripheral blood CD8 T cells at baseline. P value (two-tailed t-test) is shown. (F) Association of CD57+ CD8 T-cell frequency and overall survival in atezolizumab-treated patients (discovery and validation cohorts are combined) in the IMvigor210 cohort. CD57 cut-offs are defined based on the frequency of CD57+ CD8 T cells in all patients and using median cut-off (25.9%) to divide them into CD57 high or CD57 low groups. HR and CI are calculated using Cox proportional hazard regression models, and p value is calculated using log-rank test. IC, immune cell; ns, not significant; TC, tumor cell; TMB, tumor mutation burden.
Single-cell transcriptomic analysis of CD57+ CD8 T cells identifies a unique cluster of activated T cells enriched in responding patients
We conducted single-cell RNA sequencing (scRNA-seq) and paired TCR-seq coupled with the detection of surface proteins using CITE-seq on PBMCs from 16 patients (8 responders and 8 non-responders) from the validation cohort (see the Methods section). Similar to mass cytometry data, we observed an enhanced frequency of CD57+ CD8 T cells at baseline in responding patients compared with non-responding patients (median 35.2% vs 20.6%, respectively; p=0.037) as shown in figure 5A (and online supplemental figure S8A). Notably, the expression of CD57+ was predominantly detected in TEMRA and TEM CD8 T-cell subsets (online supplemental figure S8B,C) and CD57+ CD8 T cells showed higher expression of genes that have previously been associated with late differentiation and effector functions such as GNLY, GZMB, GZMH, and FGFBP2 (online supplemental figure S8D). As annotated in the volcano plot (figure 5B) and shown in the heatmap in figure 5C, genes associated with T-cell effector and cytotoxic functions such as CD52, GZMH, GNLY, and LY6E were upregulated in CD57+ CD8 T cells in the responder group. Next, unsupervised clustering of CD57+ CD8 T cells using RNA expression revealed six unique clusters (figure 5D and online supplemental figure S9). One of the clusters, C1, was significantly enriched in the responder group compared with the non-responder group (figure 5E). As shown in figure 5F and in online supplemental figure S8E, this cluster had a gene expression program characterized by elevated expression of genes associated with activation (CD52 and LY6E) and cytotoxic (GZMA) functions and further showed some transcriptional features of tissue-resident memory T cells such as expression of ITGB1 and ZNF683.7 These results highlighted qualitative differences in cellular composition of CD57+ CD8 T cells in responders, which could contribute to its stronger association with clinical response in responding patients.
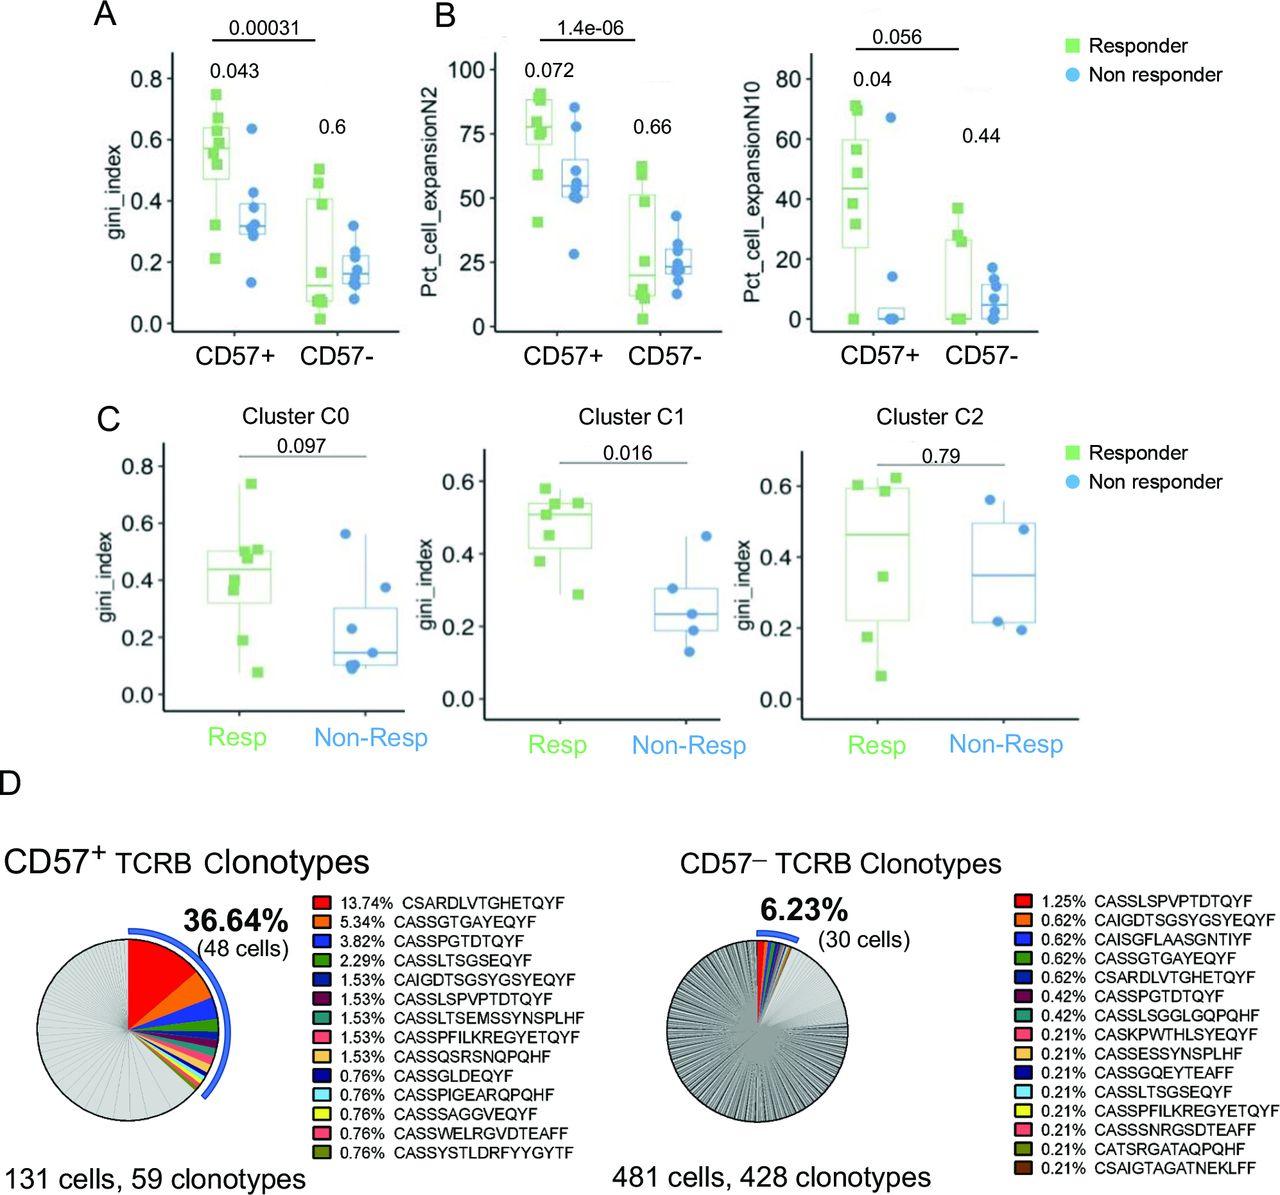
Higher clonal expansion in CD57+ CD8 T cells in responders compared with non-responders
To analyze T-cell phenotypes in relation to TCR clonality, we calculated the Gini coefficient index (see online supplemental methods) using the TCR CDR3 nucleotide sequences derived from single-cell analysis. Using a total of CD8 T cells, no significant difference in T-cell clonality was observed between responders and non-responders (data not shown). However, T-cell clonality among CD57+ CD8 T cells was significantly higher in responders compared with non-responders (figure 6A,B). This was primarily driven by cluster C1, which showed increased T-cell clonality in responders compared with non-responders, whereas clusters C0 and C2 showed no difference (figure 6C and online supplemental figure S10A). Lastly, to assess the clonal overlap between blood and tumor, we compared T-cell clonotypes with TCRB CDR3 in single-cell data with TCRB CDR3 sequences from the baseline tumor. Due to limited tumor tissue availability, TCR sequencing data were available for one patient from the scRNA-seq analysis cohort. In this responder patient, a higher proportion (36.64%) of peripheral CD57+ CD8 T cells showed TCR overlap with tumor compartment, compared with only 6.23% in the CD57− CD8 T cells (figure 6D and online supplemental table S6). For the remaining patients, we relied on tumor RNA-seq data to deconvolve the TCRA sequences in the tumor and found a similar enrichment of tumor-specific clones in CD57+ compared to CD57− CD8 T cells in the periphery (online supplemental figure S10B). Collectively, increased clonal expansion in CD57+ CD8 T cells and overlap with tumor specific TCRs suggest that accumulation of these cells in the periphery could be reflective of an ongoing antitumor response.
Supplemental material
Increased clonal expansion in CD57+ CD8 T cells in responders compared with non-responders. (A) Box plots showing T-cell receptor evenness (evaluated by the Gini index) across CD57+ and CD57− CD8 T cells in responders and non-responders at baseline. (B) Box plots showing the proportion of clonal cells in CD57+ and CD57− CD8 T cells in responders and non-responders at baseline. Percentage of cells defined based on clone size (n≥2, left; n≥10, right) among CD57+ and CD57− CD8 T cells are shown. (C) Box plots showing Gini index at baseline in three clusters C0 (left), C1 (middle) and C2 (right) identified among CD57+ CD8 T cells (referring to figure 5D,E). P values shown are calculated based on two-tailed unpaired Student’s t-test. Gini index measured in (A) and (C) is limited to samples with at least 10 cells. (D) Frequency distribution of CD57+ (left) and CD57ー (right) CD8 T cells based on individual TCRB clonotype sequences. Each slice size represents the percentage of cells with individual TCR clonotypes. TCR sequences that overlap between blood and tumor are highlighted in color.
Discussion
There is a significant interest to identify biomarkers of response in patients with cancer treated with ICI therapies. Though tumor-based markers can predict response, there are no validated markers using peripheral blood. Here, we investigated neoantigen-specific CD8 T-cell responses in peripheral blood of patients with mUC treated with atezolizumab and demonstrated higher CD57 expression on neoantigen-specific CD8 T cells in responding patients. Single-cell profiling of pretreatment CD8 T cells showed that high expression of CD57 is specifically associated with clinical benefit to atezolizumab. Previous studies have reported an association between increases in CD57+ CD8 T cells and cancer progression, suggesting a long-term interaction link between tumor and immune system resulting in the expansion of these cells in the periphery.27 28 We propose a few explanations why accumulation of CD57+ CD8 T cells could be reflecting a pre-existing antitumor T-cell response and predict better clinical outcomes on ICI treatment. First, we hypothesize increased CD57 expression is a result of tumor antigen recognition. Indeed, we found an enrichment of CD57+ neoantigen-specific CD8 T cells among the responder patients in two separate studies.13 Since our approach can only cover a subset of existing tumor neoantigens and patient HLA landscape despite potential screening of large numbers of potential tumor T-cell targets, we believe there might be additional tumor-reactive T cells in the peripheral CD57+ CD8 T-cell pool. Second, comparison of TCR clonotypes of TILs with peripheral CD57+ or CD57− T cells showed that TCR clonotypes among CD57+ T cells are detected more frequently in TILs, suggesting potential tumor reactivity within the CD57+ CD8 T-cell compartment. An expansion of CD57+ CD8 T cells in the periphery of responder patients is likely reflective of ongoing antitumor T-cell response. Indeed, we observed an association between TMB and levels of CD57+ CD8 T cells, suggesting a link between CD57+ CD8 T cells and tumor immunogenicity. Furthermore, we observed high expression of tissue-resident memory genes (ITGB1 and HOBIT) and cytotoxicity (GZMA) within CD57+ CD8 T cells in responders, which is in line with recent studies showing circulating neoantigen-specific T cells in patients with lung cancer exhibit transcriptional features of tissue-resident memory cells with high expression of ZNF683 (HOBIT).7
The expression of CD57 on T cells is known to be associated with enhanced effector functions, cytotoxic activity, and a late-differentiated T-cell phenotype.29 30 In prior studies, enhanced frequencies of T cells with a late differentiation status have been associated with response to ICI.11 31 32 Expansion and accumulation of terminally differentiated CD8 T cells in the periphery have also been shown to be a consequence of cancer development.33 In patients with lung cancer, T effector memory cells expressing CD45RA (TEMRA) are associated with response to anti-PD-1 treatment,11 34 whereas the senescent immune phenotype, defined by CD28−, CD57+, and KLRG1+ CD8 T cells, is negatively correlated with clinical benefit during anti-PD-1/PD-L1 treatment in another study.35 While we observed an enrichment of CD57 expressing TEMRA in responding patients, the findings from the latter study suggest that association of CD57+ CD8 T cells in periphery with clinical response could be tumor type dependent and argues for further studies in different indications. Another hypothesis is related to the observation that CD57+ CD8 T cells are important in controlling persistent viral infection, mainly through the high expression of cytokines and cytotoxic molecules including granzyme B.14 An accumulation of CD57+ CD8 T cells may present an overall healthier status of the immune system. We probed for several common virus antigens in our screening approach, including epitopes derived from CMV (cytomegalovirus), EBV (epstein barr virus), and influenza, but did not find remarkably higher numbers of virus-specific T-cell reactivities in responder or non-responder patients (online supplemental figure S11).
There are notable limitations to this study, which is based on a retrospective analysis of PBMC samples of selected patients with extreme clinical responses. Extension of these studies to other patients who do not experience RECIST V.1.1 response but still show tumor control will be needed. Moreover, our studies were limited to phenotypical and transcriptional analyses and did not evaluate functional aspects. Lastly, although our approach provided an overview of the phenotypical markers in the periphery, our analysis could not be extended to tumor-infiltrating T cells in an extensive manner due to tissue availability and lack of post-treatment collections.
Although a pre-existing CD8 T-cell response in the tumor has been linked to efficacy to ICI, gaps in identifying biomarkers of this response in peripheral blood remain a major challenge in immunotherapy. Our study illustrates the significance of monitoring CD57+ CD8 T cells during PD-L1 blockade to predict clinical response and for the first time provides new insight into the cellular composition and TCR characteristics of these cells at a single-cell level in patients with mUC. While future studies enrolling patients based on prospective testing are needed to validate these findings, our data highlight blood-based measurement of CD57+ CD8 T cells as a promising and accessible immune biomarker to monitor clinical responses during atezolizumab therapy. Further studies will be needed to address whether this can be applied to other cancer types and possibly other immunotherapeutic approaches.
Data availability statement
Data are available in a public, open access repository. All data relevant to the study are included in the article or uploaded as supplementary information.
Ethics statements
Patient consent for publication
Ethics approval
This study involves human subjects and was approved by IMvigor 210 trial (NCT02108652) and IMvigor 211 trial (NCT02302807), which were both sponsored by Genentech. All patients provided written informed consent, which included the exploratory biomarker end points described here. The study was approved by the relevant institutional review board and ethics committee for each participating center and was conducted in accordance with the principles of good clinical practice, the provisions of the Declaration of Helsinki and other applicable local regulations. The subjects gave informed consent to participate in the study before taking part.
Acknowledgments
We thank Edward J Kadel and Janet Estee (Genentech) for helping with patient sample acquisition; Dan Oreper (Genentech) for help with neoantigen prediction; and Hermi Sumatoh, Boon Heng Lee, and Daniel Carbajo (ImmunoScape) for helping with CyTOF experiments and data analysis. We also thank ImmuneAI for the single-cell RNA-seq experiments.
References
Supplementary materials
Supplementary Data
This web only file has been produced by the BMJ Publishing Group from an electronic file supplied by the author(s) and has not been edited for content.
Footnotes
Twitter @Ali_Tafazzol, @evnewell1
MF and LK contributed equally.
Contributors MY conceived and supervised the study. MY, LK, MF and AN planned the study with support from SMar, and MY, LK, XG, KY, AT and MF wrote the original draft of the manuscript. MF, SMa and AM analyzed mass cytometry data. OAZ and AW contributed neoantigen analysis, and XG conducted the single-cell RNA-seq and CITE-seq data analysis. AT performed single-cell TCR-seq analysis. KY conducted analysis of clinical data. DR provided sample acquisition and study operations support. MY, LK, SMar, SS, KY, XG, DR, AT, OAZ, AW, MF, AN, SMa, AM, and EWN reviewed, edited and approved the final manuscript.
Funding The trial was sponsored by Genentech, Inc, a member of the Roche Group, which provided the study drug, atezolizumab, and funded the study.
Competing interests MY, LK, SMar, SS, KY, XG, DR, AT and OAZ (former) are Genentech employees and Roche shareholders. MF, AN, SMar, AM and EWN are shareholders or employees of ImmunoScape Pte Ltd. AN is on the board of directors of ImmunoScape Pte Ltd. OAZ is founder and owner of Init Bio, Inc.
Provenance and peer review Not commissioned; externally peer reviewed.
Supplemental material This content has been supplied by the author(s). It has not been vetted by BMJ Publishing Group Limited (BMJ) and may not have been peer-reviewed. Any opinions or recommendations discussed are solely those of the author(s) and are not endorsed by BMJ. BMJ disclaims all liability and responsibility arising from any reliance placed on the content. Where the content includes any translated material, BMJ does not warrant the accuracy and reliability of the translations (including but not limited to local regulations, clinical guidelines, terminology, drug names and drug dosages), and is not responsible for any error and/or omissions arising from translation and adaptation or otherwise.