Article Text

Abstract
Background Chimeric antigen receptor (CAR) T cells have demonstrated high clinical response rates against hematological malignancies (e.g., CD19+ cancers) but have shown limited activity in patients with solid tumors. Recent work showed that precise insertion of a CAR at a defined locus improves treatment outcomes in the context of a CD19 CAR; however, it is unclear if such a strategy could also affect outcomes in solid tumors. Furthermore, CAR manufacturing generally relies on viral vectors for gene delivery, which comprise a complex and resource-intensive part of the manufacturing supply chain.
Methods Anti-GD2 CAR T cells were generated using CRISPR/Cas9 within 9 days using recombinant Cas9 protein and nucleic acids, without any viral vectors. The CAR was specifically targeted to the T cell receptor alpha constant gene (TRAC). T cell products were characterized at the level of the genome, transcriptome, proteome, and secretome using CHANGE-seq, targeted next-generation sequencing, scRNA-seq, spectral cytometry, and ELISA assays, respectively. Functionality was evaluated in vivo in an NSG™ xenograft neuroblastoma model.
Results In comparison to retroviral CAR T cells, virus-free CRISPR CAR (VFC-CAR) T cells exhibit TRAC-targeted genomic integration of the CAR transgene, elevation of transcriptional and protein characteristics associated with a memory-like phenotype, and low tonic signaling prior to infusion arising in part from the knockout of the T cell receptor. On exposure to the GD2 target antigen, anti-GD2 VFC-CAR T cells exhibit specific cytotoxicity against GD2+ cells in vitro and induce solid tumor regression in vivo. VFC-CAR T cells demonstrate robust homing and persistence and decreased exhaustion relative to retroviral CAR T cells against a human neuroblastoma xenograft model.
Conclusions This study leverages virus-free genome editing technology to generate CAR T cells featuring a TRAC-targeted CAR, which could inform manufacturing of CAR T cells to treat cancers, including solid tumors.
- Immunotherapy
- Neuroblastoma
- Cell Engineering
- Gene Expression Profiling
- Receptors, Chimeric Antigen
Data availability statement
Data are available on reasonable request.
This is an open access article distributed in accordance with the Creative Commons Attribution Non Commercial (CC BY-NC 4.0) license, which permits others to distribute, remix, adapt, build upon this work non-commercially, and license their derivative works on different terms, provided the original work is properly cited, appropriate credit is given, any changes made indicated, and the use is non-commercial. See http://creativecommons.org/licenses/by-nc/4.0/.
Statistics from Altmetric.com
What is known about this topic
CRISPR chimeric antigen receptor (CAR) T cells have been manufactured with adeno-associated viral vectors for CD19 therapies, but to date they have not been described with a virus-free workflow for a GD2 CAR. Further, it is unknown whether a TRAC-targeting strategy could significantly alter the phenotype and function of the cell product in the context of different CARs.
What this study adds
We use CRISPR to manufacture and characterize virus-free TRAC-targeted CAR T cells for GD2+ solid tumors. We find evidence of decreased differentiation in vitro and in vivo, decreased tonic signaling, and decreased exhaustion in virus-free CRISPR CAR T cells, which induce solid tumor regression in vivo.
How this study affects research, practice or policy
Targeting the CAR to the TRAC locus to alter basal signaling and phenotype could be used as a strategy to slow T-cell differentiation in the context of GD2+ solid tumors.
Background
Chimeric antigen receptor (CAR) T cell therapy is rapidly transforming the treatment of many cancers, with six products already approved by the Food and Drug Administration for hematological malignancies. However, solid tumors have presented a difficult challenge for the CAR T field, as clinical trials to date have yielded modest results. Solid tumors pose major challenges including proper antigen targeting, T cell homing, penetration and persistence within the hostile tumor microenvironment, and maintenance of T cell fitness. A recent CAR T cell trial in four patients with diffuse intrinsic pontine glioma (DIPG) demonstrated clinical and radiographic improvement in three out of four patients, an advance that was regarded as a major leap forward for this diagnosis; however, none of the patients ultimately survived.1 Thus, considerable space remains to improve manufacturing paradigms and processes so that CAR T cell therapies can be translated effectively for patients with solid tumors.2
CAR T cell products are inherently heterogeneous, and their activity and durability depends on donor-specific starting materials. One source of this heterogeneity arises from the use of viral vectors to integrate the CAR transgene into the genome.3 Many CAR T products are manufactured using lentiviruses or γ-retroviruses,2 which confer high-efficiency gene integration; however, viral transduction methods broadly integrate their nucleic acid payloads into the host genome. Some γ-retroviruses in particular have been shown to preferentially target the 5’ end of transcriptional units within the genome, risking disruption to coding regions.4 Lentiviruses typically integrate preferentially away from transcriptional start sites and are considered safer than γ-retroviruses; however, insertional mutagenesis is still a possibility and is of regulatory concern.5 Furthermore, both types of vectors must be monitored carefully for the potential to regain replication competence.6 Transcriptional control over CAR expression may also vary with viral delivery mechanisms as promoter, enhancer, and silencer elements near the transgene will differ by insertion site. This variability in transcriptional regulation leads to heterogeneous CAR expression. An individual CAR T cell may, therefore, need to integrate many copies of the transgene in order to achieve adequate surface CAR expression. As a result, total CAR signaling within a cell may either overshoot or undershoot ideal levels.
Recent strategies employing CRISPR/Cas9 genome editing7–9 have targeted the CAR transgene to a single genomic locus to more precisely control CAR expression. Notably, Eyquem et al inserted an anti-CD19 CAR at the start of exon 1 of the T cell receptor alpha chain gene (TRAC), disrupting expression of the T cell receptor (TCR) while also driving CAR expression from the endogenous TRAC promoter.10 These T cells, engineered through electroporation of Cas9 mRNA followed by delivery of a homology-directed repair (HDR) template within a recombinant adeno-associated viral (AAV) vector successfully killed target cells, retained a memory phenotype, and showed less exhaustion relative to a control γ-retroviral (RV) product. AAV-mediated donors have also been combined with TALEN technology to engineer TRAC-targeted CAR T cells, with comparable effects on T cell phenotype.11 Higher memory formation is thought to benefit patients with hematological malignancies,12 13 and lower exhaustion is hypothesized to improved outcomes in solid tumors; therefore, a TRAC-targeting approach may be similarly useful in the context of other CARs.14 However, the use of AAVs to deliver the HDR template needed for CRISPR-mediated transgene insertion10 15 is limited by supply chain challenges associated with viral vector production.16 Additionally, vector integration into the genome with AAVs can occur when used in conjunction with Cas9,15 and cellular response to the introduction of viral elements could affect T cell phenotypes. Therefore, alternate strategies for precise CAR transgene insertion that avoid viral vectors entirely could yield new opportunities to flexibly manufacture CAR T cell immunotherapies with desirable phenotypes.
Virus-free CRISPR (VFC)/Cas9-mediated gene transfer with transgenic TCR and anti-CD19 CARs has recently been demonstrated against some cancers.17–19 Here, we build on these virus-free methods17 20 to integrate a 3.4 kb third-generation anti-disialoganglioside (GD2) CAR transgene21 at the human TRAC locus to report a completely VFC-CAR, and validate its performance in an in vivo solid tumor model. VFC-CAR T cells exhibit some transcriptional and protein expression characteristics associated with a memory-like phenotype, which is elevated relative to RV-CAR T cells. These VFC-CAR T cells also show evidence of decreased TCR and CAR signaling prior to antigen exposure and comparable activity relative to viral CAR T cells against GD2+ neuroblastoma in vivo.
Methods
Cell lines
CHLA20 human neuroblastoma cells were a gift from Dr. Mario Otto and M21 human melanoma cells were a gift from Dr. Paul Sondel (University of Wisconsin-Madison). These cells were maintained in Dulbecco’s Modified Eagle Medium (DMEM) with high glucose (Gibco) supplemented with 10% fetal bovine serum (Gibco) and 1% penicillin-streptomycin (Gibco). H2B-mCherry-positive lines of M21 and CHLA20 cells were generated via lipofection for the fluorescence in vitro assay. AkaLUC-GFP CHLA20 cells were a gift from Dr. James Thomson (Morgridge Institute for Research). Phoenix cells (ATCC) for viral preparation were maintained in DMEM (high glucose) supplemented with 10% fetal bovine serum (Gibco) and selected using 1 µg/mL diphtheria toxin (Cayman Biologics) and 300 µg/mL hygromycin (Thermo Fisher Scientific) prior to use. Selection for transgene-positive cells was confirmed by flow cytometry for mouse Lyt2 expression (Biolegend) (>70%+). 3T3 cells were maintained in Dulbecco’s Modified Eagle Medium (Gibco) supplemented with 10% Fetal Bovine Serum (Gibco) and 1% penicillin-streptomycin (Gibco). Cell authentication was performed using short tandem repeat analysis (Idexx BioAnalytics, Westbrook, Maine, USA) and per ATCC guidelines using morphology, growth curves, and Mycoplasma testing within 6 months of use with the e-Myco mycoplasma PCR detection kit (iNtRON Biotechnology, Boca Raton, Florida USA). Cell lines were maintained in culture at 37°C in 5% CO2.
Plasmid constructs
VFC-CAR: A 2 kb region surrounding the TRAC locus was amplified by PCR from human genomic DNA and cloned into a pCR blunt II TOPO backbone (Thermo Fisher Scientific). The CAR transgene from a pSFG.iCasp9.2A.14G2A-CD28-OX40-CD3ζ RV-CAR plasmid (gift from Dr. Malcolm Brenner, Baylor College of Medicine) was then cloned into the TOPO-TRAC vector using Gibson Assembly (New England Biolabs, NEB)). The plasmid sequence was verified by Sanger sequencing. VFC-Ctrl (mCherry): This construct was designed in house, synthesized, and sequence-verified (GenScript). All plasmids were grown in 5-alpha competent Escherichia coli (NEB) and purified using the PureYield MidiPrep system (Promega).
Double-stranded DNA HDR template production
Plasmids were used to make PCR donor templates for VFC products. In brief, VFC-CAR and VFC-Ctrl plasmids were MidiPrepped using the PureYield MidiPrep system (Promega). PCR amplicons were generated from plasmid templates using Q5 Hot Start Polymerase (NEB) and pooled into 100 µL reactions for Solid Phase Reversible Immobilization (SPRI) cleanup (1X) using AMPure XP beads according to the manufacturer’s instructions (Beckman Coulter). Each 100 µL starting product was eluted into 5 µL of water. Bead incubation and separation times were increased to 5 min, and elution time was increased to 15 min at 37°C to improve yield. PCR products from round 1 cleanup were pooled and subjected to a second round of SPRI cleanup (1X) to increase total concentration. Round 2 elution volume was 20% of round 1 input volume. Template concentration and purity was quantified using NanoDrop 2000 and Qubit double-stranded DNA (dsDNA) Broad Range (BR) Assay (Thermo Fisher Scientific), and templates were diluted in water to an exact concentration of 2 µg/µL according to Qubit measurements.
SpCas9 RNP preparation
RNPs were produced by complexing a two-component gRNA to SpCas9. In brief, tracrRNA and crRNA were suspended in nuclease-free duplex buffer at 100 µM, and stored in single-use aliquots at −80°C (IDT). tracrRNA and crRNA were thawed, and 1 µL of each component was mixed 1:1 by volume and annealed by incubation at 37°C for 30 min to form a 50 µM gRNA solution in individual aliquots for each electroporation replicate. Recombinant sNLS-SpCas9-sNLS Cas9 (Aldevron, 10 mg/mL, total 0.8 µL) was added to the complexed gRNA at a 1:1 molar ratio and incubated for 15 min at 37°C to form an RNP. Individual aliquots of RNPs were incubated for at least 30 s at room temperature with HDR templates for each sample prior to electroporation.
Isolation of primary T cells from healthy donors
Peripheral blood was drawn from healthy donors into sterile syringes containing heparin and transferred to sterile 50 mL conical tubes. Primary human T cells were isolated using negative selection per the manufacturer’s instructions (RosetteSep Human T Cell Enrichment Cocktail, STEMCELL Technologies). T cells were counted using a Countess II FL Automated Cell Counter (Thermo Fisher Scientific) with 0.4% Trypan Blue viability stain (Thermo Fisher Scientific). T cells were cultured at a density of 1 million cells/mL in ImmunoCult-XF T cell Expansion Medium (STEMCELL Technologies) supplemented with 200 U/mL IL-2 (Peprotech) and stimulated with ImmunoCult Human CD3/CD28/CD2 T cell Activator (STEMCELL) immediately after isolation, per the manufacturer’s instructions.
T cell culture
Bulk T cells were cultured in ImmunoCult-XF T cell Expansion Medium at an approximate density of 1 million cells/mL. In brief, T cells were stimulated with ImmunoCult Human CD3/CD28/CD2 T cell Activator (STEMCELL Technologies) for 2 days prior to electroporation. On day 3, (24 hours post-electroporation), VFC-CAR and VFC-Ctrl T cells were transferred without centrifugation to 1 mL of fresh culture medium (with 500 U/mL IL-2, no activator) and allowed to expand. T cells were passaged, counted, and adjusted to 1 million/mL in fresh medium+IL-2 on days 5 and 7 after isolation. RV-CAR T cells were spinoculated with the RV-CAR construct on day 3 and passaged on day 5 along with the VFC-CAR and VFC-Ctrl T cells. Prior to electroporation or spinoculation, the medium was supplemented with 200 U/mL IL-2; post-gene editing, medium was supplemented with 500 U/mL IL-2 (Peprotech).
T cell nucleofection
RNPs and HDR templates were electroporated 2 days after T cell isolation and stimulation. During crRNA and tracrRNA incubation, T cells were centrifuged for 3 min at 200 g and counted using a Countess II FL Automated Cell Counter with 0.4% Trypan Blue viability stain (Thermo Fisher). One million cells per replicate were aliquoted into 1.5 mL tubes. During the RNP complexation step (see RNP production), T cell aliquots were centrifuged for 10 min at 90 g. During the spin step, 2 µL of HDR template (total 4 µg) per condition were aliquoted to PCR tubes, followed by RNPs (2.8 µL per well; pipette should be set to a higher volume to ensure complete expulsion of viscous solution). Templates and RNPs were incubated at room temperature for at least 30 s. After cell centrifugation, supernatants were removed by pipette, and cells were resuspended in 20 µL P3 buffer (Lonza), then transferred to PCR tubes containing RNPs and HDR templates, bringing the total volume per sample to 24 µL. Each sample was transferred directly to a 16 well electroporation cuvette. Typically, no more than eight reactions were completed at a time to minimize the amount of time T cells spent in P3 buffer. T cells were electroporated with a Lonza 4D Nucleofector with X Unit using pulse code EH115. Immediately after electroporation, 80 µL of prewarmed recovery medium with 500 U/mL IL-2 and 25 µL/mL ImmunoCult CD3/CD28/CD2 activator was added to each well of the cuvette. Cuvettes were rested at 37°C in the cell culture incubator for 15 min. After 15 min, cells were moved to 200 µL total volume of media with IL-2 and activator (see above) in a round bottom 96 well plate.
Retrovirus production
CAR retrovirus was manufactured using Phoenix cells. In brief, pSFG.iCasp9.2A.14G2A-CD28-OX40-CD3ζ plasmid was MidiPrepped using the PureYield MidiPrep system (Promega). One day prior to transfection, selected Phoenix cells were plated on 0.01% Poly-L-Lysine coated 15 cm dishes (Sigma Aldrich) at a density of 76,000 cells/cm2, or ~65% confluency. On transfection day, media was replaced 1 hour prior to transfection of 10 µg pSFG.iCasp9.2A.14G2A-CD28-OX40-CD3ζ plasmid/plate using iMFectin according to the manufacturer’s instructions (GenDEPOT). Media was replaced 18–24 hours later with 10 mL of 50 mM HEPES buffered DMEM+10% FBS (Gibco). Forty-eight hours later, media was collected, stored at 4°C, and replaced. A second aliquot of media was collected 24 hours later; media aliquots were pooled and centrifuged for 10 min at 2000 g to pellet contaminating cells, and supernatants were transferred to a clean conical tube. One-third volume Retro-X concentrator (Takara) was added, and supernatants were refrigerated at 4°C for 12–18 hours, then concentrated according to the manufacturer’s instructions. Viruses were tested on 3T3 cells prior to use; yields from one 15 cm dish were used for five replicate wells of 160,000 T cells per transduction. Viruses were either used immediately for T cell spinoculation or stored at −80°C in single use aliquots.
Retroviral transduction
T cells for RV infection were cultured similarly to VFC-CAR and VFC-Ctrl T cells, with two exceptions: (1) T cells were passaged and resuspended without ImmunoCult CD2/CD28/CD3 activator on day 2 post-isolation, and spinoculated on day 3. RV-CAR T cells returned to the regular passaging schedule on day 5 post-isolation. Prior to spinoculation, non-tissue culture treated 24 well plates were coated with retronectin according to the manufacturer’s instructions (Takara/Clontech). On day 3 post-isolation, T cells were centrifuged at 200 g for 3 min, counted, and resuspended to a concentration of 200,000 cells/mL, then stored in the incubator until plates were prepared. Virus was added to retronectin-coated plates in a volume of 400 µL virus in ImmunoCult-XF Medium and centrifuged at 2000 g for 2 hours at 32°C. A total of 160,000 T cells in 800 µL were added to each well and spinoculated at 2000 g for 60 min at 32°C, brake off. T cells were then transferred to the incubator and left undisturbed for 2 days. For RV-CAR-TRAC-KO constructs, cells were electroporated with RNPs on day 2 post-stimulation and spinoculated on day 4 as described above, then allowed to rest until passage and transgene analysis at day 7.
Flow cytometry and fluorescence-activated cell sorting
CAR was detected using 1A7 anti-14G2a idiotype antibody (National Cancer Institute Biological Resources Branch) conjugated to APC with the Lightning-Link APC Antibody Labeling kit (Novus Biologicals). T cells were stained in BD Brilliant Stain Buffer (BD Biosciences). Flow cytometry was performed on an Attune NxT flow cytometer (Thermo Fisher Scientific) and an Aurora spectral cytometer (Cytek), and fluorescence-activated cell sorting was performed on a FACS Aria (BD). T cells were stained and analyzed on day 7 of manufacture for CAR and TCR expression, and day 10 of manufacture for the full spectral immunophenotyping panel, using fresh cells. Downstream analyses of all spectral cytometry data were performed in FCS Express 7 Software. All flow cytometry antibodies are listed in online supplemental table 1.
Supplemental material
In-out PCR
Genomic DNA was extracted from 100,000 cells per condition using DNA QuickExtract (Lucigen), and incubated at 65°C for 15 min, 68°C for 15 min, and 98°C for 10 min. Genomic integration of the CAR was confirmed by in-out PCR using a forward primer upstream of the TRAC left homology arm, and a reverse primer binding within the CAR sequence. Primer sequences are listed in online supplemental table S2. PCR was performed according to the manufacturer’s instructions using Q5 Hot Start Polymerase (NEB) using the following program: 98°C (30 s), 35 cycles of 98°C (10 s), 62°C (20 s), 72°C (2 min), and a final extension at 72°C (2 min).
Next Generation Sequencing of genomic DNA for on-target TRAC editing
Indel formation at the TRAC locus was measured using Next Generation Sequencing (Illumina). Genomic PCR was performed according to the manufacturer’s instructions using Q5 Hot Start polymerase (NEB); primers are listed in online supplemental table S2. Products were purified using SPRI cleanup with AMPure XP beads (Beckman Coulter), and sequencing indices were added with a second round of PCR using indexing primers (Illumina), followed by a second SPRI cleanup. Samples were pooled and sequenced on an Illumina MiniSeq according to the manufacturer’s instructions. Analysis was performed using CRISPR RGEN (rgenome.net).
Genome-wide, off-target analysis
Genomic DNA from human primary CD4+/CD8+ T cells was isolated using the Gentra Puregene Kit (Qiagen) according to the manufacturer’s instructions. CHANGE-seq was performed as previously described.22 Briefly, purified genomic DNA was tagmented with a custom Tn5-transposome to an average length of 400 bp, followed by gap repair with Kapa HiFi HotStart Uracil+DNA Polymerase (KAPA Biosystems) and Taq DNA ligase (NEB). Gap-repaired tagmented DNA was treated with USER enzyme (NEB) and T4 polynucleotide kinase (NEB). Intramolecular circularization of the DNA was performed with T4 DNA ligase (NEB) and residual linear DNA was degraded by a cocktail of exonucleases containing Plasmid-Safe ATP-dependent DNase (Lucigen), Lambda exonuclease (NEB) and Exonuclease I (NEB). In vitro cleavage reactions were performed with 125 ng of exonuclease-treated circularized DNA, 90 nM of SpCas9 protein (NEB), NEB buffer 3.1 (NEB) and 270 nM of sgRNA, in a 50 µL volume. Cleaved products were A-tailed, ligated with a hairpin adaptor (NEB), treated with USER enzyme (NEB) and amplified by PCR with barcoded universal primers NEBNext Multiplex Oligos for Illumina (NEB), using Kapa HiFi Polymerase (KAPA Biosystems). Libraries were quantified by qPCR (KAPA Biosystems) and sequenced with 151 bp paired-end reads on an Illumina NextSeq instrument. CHANGE-seq data analyses were performed using open-source CHANGE-seq analysis software (https://github.com/tsailabSJ/changeseq).
Targeted off-target next-generation sequencing of genomic DNA
The rhAmpSeq system (IDT) was used to determine indel frequency at CHANGE-seq-identified on- and off-target sites for the CAR edited cells. Targeted PCR amplification with rhAmpSeq primers designed by IDT were used to amplify the genomic regions around the identified sites. Sequencing libraries were generated according to manufacturer’s instructions, with sequencing performed on the Illumina MiniSeq instrument with a 150 bp paired-end read cartridge. Analysis was performed using CRISPAltRations: IDT rhAmpSeq CRISPR analysis tool.
Cytokine analysis
Cytokine analysis was performed using a V-PLEX Proinflammatory Panel 1 Human Kit (Meso Scale Discovery, Catalog No K15049D-2) according to the manufacturer’s protocol. The following cytokines were measured: IFNγ, IL-1β, IL-2, IL-4, IL-6, IL-8, IL-10, IL-12p70, IL-13, and TNF-α. In brief, medium was collected from the final day of cell culture before injection into mice and flash frozen and stored at −80°C. For co-culture samples, 250,000 T cells were co-cultured with 50,000 cancer cells in 250 µL ImmunoCult-XF T cell expansion medium for 24 hours prior to media collection. On the day of the assay, samples were thawed and 50 µL of medium were used to perform all measurements in duplicate. Figures were produced using GraphPad Prism V.8. Data were normalized by calculating cytokine production per cell based on the total concentration of cells calculated at media collection.
Immunoblotting
Equivalent number of T cells with matched CAR positivity (1×10e6 cells/group) were lysed in Laemmli Sample Buffer with β-mercaptoethanol (Bio-Rad, California, USA). Total cell lysate for each sample were resolved on 12% SDS-PAGE gels and transferred to polyvinylidene fluoride membranes (Millipore, Billerica, Massachusetts, USA). The membranes were blocked in LI-COR blocking buffer (LI-COR, NE), Immunoblotting was performed by incubating the membranes with anti-human CD247 (Mouse, BD Biosciences), anti-human CD247 pTyr142 (Mouse, BD Biosciences), and anti-human GAPDH (Rabbit, Cell Signaling Tech, Massachusetts, USA), according to the manufacturer’s recommendations. The membranes were then washed with TBST and incubated with fluorescent secondary antibodies (LI-COR, NE) and the immunoreactive bands were visualized using the Odyssey CLx imaging system (LI-COR, NE).
In vitro cytotoxicity assays
IncuCyte assays
A total of 10,000 AkaLUC-GFP CHLA20 cells were seeded in triplicate per condition in a 96 well flat bottom plate. Forty-eight hours later, 50,000 T cells were added to each well. 1 µL (0.05 µg) of CF 594 Annexin V antibody (Biotium) was added to the wells. The plate was centrifuged at 100 g for 1 min and then placed in The IncuCyte S3 Live-Cell Analysis System (Sartorius, Catalog No 4647), stored at 37°C, 5% CO2. Images were taken every 2 hours for 48 hours. Green object count was used to calculate the number of cancer cells in each well. Red object count was used to calculate the number of objects staining positive for Annexin V, an early apoptosis marker. Fluorescent images were analyzed with IncuCyte Base Analysis Software. In the first set of IncuCyte experiments, the percentage of CAR+ cells was not normalized between conditions, and VFC-CAR T cells had a lower total percentage of CAR+ cells; in the second set of experiments, the percentage of CAR+ cells was used to calculate the effector:target (E:T) ratio for all assays.
In vitro fluorescence assays
A total of 10,000 H2B-mCherry CHLA20 cells or 10,000 H2B-mCherry M21 cells were seeded in triplicate per condition in a 96 well flat bottom plate. Twenty-four hours later, 50,000 T cells were added to each well. The 96 well plate was placed in a live cell imaging chamber at 37°C and 5% CO2 and imaged on a Nikon Epifluorescent scope, with images taken every 12 hours for 48 hours. The change in protocol was made in March 2020 due to institutional COVID-19 biosafety precautions.
Single cell RNA sequencing
Twenty-four hours prior to assay, 200,000 AkaLUC-CHLA20 cells were plated in 12 well plates and cultured overnight. One week after electroporation (day 9 post-isolation), T cells were counted and pooled into a single bank for characterization studies (scRNA-seq, IncuCyte cytotoxicity assay and in vivo experiments). Medium was aspirated from cancer cells, and 1 million T cells in ImmunoCult-XF Medium+500 U/mL IL-2 were seeded on the cancer cells, then cultured for 24 hours. A parallel T cell-only single culture (termed ‘pre-antigen’) was set up at the same density in a separate 12 well plate. The next day, cocultured cells were trypsinized for donor 1 and washed off the plate with media, and cells were singularized with a 35 µM cell strainer prior to scRNA-seq (Corning). For donor 2, to improve the total purity of the T cell populations and remove contaminating cancer cells from analysis, co-culture cells were stained for CD45 and CAR, and FACS sorted into CD45+CAR+ and CD45+CAR- fractions prior to sample submission. Cells were counted with a Countess II FL cell counter using trypan blue exclusion (Thermo Fisher Scientific), and samples were prepared for single cell RNA sequencing with the 10X Genomics 3’ kit (v3 chemistry) according to the manufacturer’s instructions. Libraries were sequenced using the Illumina NovaSeq 6000 system.
Single cell RNA-sequencing analyses
Alignment, data quality control, integration, clustering, and annotation
FASTQ files were aligned with Cellranger V.3.0.1 to custom reference genomes that included added sequences for the transgene(s) used in each culture condition (e.g., the TRAC VFC-CAR donor sequence, VFC-Ctrl mCherry donor sequence). Downstream analyses were performed using the Seurat package V.4.0.1 in R software V.4.0.3.23 Several quality control measures were used to filter data prior to downstream processing. First, each dataset was filtered to include only cells with 200 or more unique genes, and genes expressed in three or more cells. To further preserve cell quality, any cells with greater than 15% mitochondrial RNA reads or less than 500 detected genes were also excluded. Additionally, maximum RNA and gene count thresholds were applied to each sample to filter out potential doublet or multiplet captures. Specific maximum thresholds were determined sample-by-sample, ranging from 80,000 to 100,000 and 7,500–8,500 for RNA counts and gene counts, respectively. Subsequent analyses were performed in Seurat using default settings, unless otherwise noted. Each sample was log-normalized (NormalizeData) and 2,000 variable features were selected using FindVariableFeatures. All datasets were integrated using reference-based integration and reciprocal principal component analysis (RPCA) was used to identify integration anchors. In brief, the workflow was performed as follows: Each dataset was separately scaled (ScaleData) and dimensionally reduced using principal component analysis (PCA) (RunPCA), setting the ‘features’ parameter in both functions equal to a vector containing all genes. Next, integration anchors were identified using the two untransfected controls as the references for anchor selection (FindIntegrationAnchors, reduction = ‘rpca’, dims=1:50). Datasets were then integrated using all genes and the selected anchors (IntegrateData, dims=1:50, features.integrate=all_genes variable). Following integration, the data were scaled (ScaleData) and dimensionally reduced with PCA (RunPCA) and T-distributed stochastic neighbor embedding (t-SNE) (RunTSNE; dims=1:50). The data were then clustered (FindNeighbors, dims=1:50; FindClusters). Cell-level annotations were derived using the Seurat multimodal reference mapping pipeline with a human peripheral blood mononuclear cell (PBMC) reference cell atlas.23 One notable caveat of this pipeline is that all cells in the query dataset are forcibly mapped to the reference cell type that matches most closely. Consequently, it is conceivable that novel cell types present in the query dataset are lost to other cell labels. These cell-level annotations were then used to inform labeling of t-SNE clusters, in conjunction with manual review of canonical feature expression and differentially expressed genes for each cluster. Clusters 15, 19, 20, and 21 were largely composed of co-culture samples and lacked expression of canonical T cell markers. It was determined that these clusters represented contaminating CHLA20 cancer cells, which we subsequently removed from the dataset. Downstream comparisons of sample types were performed on transgene+ cells only.
In vivo human neuroblastoma xenograft mouse model
Male and female NOD-SCID-γc-/- (NSG™) mice (9–25 weeks old; Jackson Laboratory) were subcutaneously injected with 10 million AkaLUC-GFP CHLA20 human neuroblastoma cells in the side flank to establish tumors. Six days later (day 0), established tumors were verified by bioluminescence with the PerkinElmer In Vivo Imaging System (IVIS), and 10 million T cells were injected through the tail vein into each mouse. Mice were followed for weight loss and overall survival. On imaging days, mice were sedated using isoflurane and received intraperitoneal injections of ~120 mg/kg D-luciferin (GoldBio). Fifteen minutes later, mice were imaged via IVIS. Imaging was repeated every 3–4 days, starting 1 day before initial T cell injection (day −1). Mice were injected with 100,000 IU of human IL-2 subcutaneously on day 0, day 4, and with each subsequent IVIS reading. In order to quantify the total flux in the IVIS images, a region of interest (ROI) was drawn around the bottom half of each mouse with the total flux being calculated by Living Image software (PerkinElmer; Total flux=the radiance (photons/sec) in each pixel summed or integrated over the ROI area (cm2) x 4π). The absolute minimum total flux value was subtracted from each image to minimize background signal. For donors 1, 3, 4, and 5 mice were maintained until tumors reached 20 mm in any dimension by digital caliper as defined by the Animal Care and Use Committee (ACUC).
Flow cytometric analysis of splenic and tumor-infiltrating T cells
Tumors and spleens were removed, mechanically dissociated, and passed through a Corning 35 µm cell strainer. Cell suspensions were centrifuged at 300 g for 10 min, and then digested with ACK lysing buffer (Lonza). The cells were then washed and centrifuged at 300 g for 10 min, and resuspended in 10 mL PBS, 10 µL of which was added to 10 mL of ISOTON diluent and counted on the COULTER COUNTER Z1 Series Particle Counter (Beckman Coulter). From this count, 1×10⁶ cells were added to flow cytometry tubes in staining buffer (PBS with 2% FBS) and stained with antibodies for hCD45, mCD45, scFV 14g2a CAR, and PD-1. The cells were then washed with PBS, centrifuged at 300 g for 10 min, and 0.5 ul of Ghost Dye Red 780 viability dye (Tonbo Biosciences) was added for 20 min at room temperature. Cells were then washed with staining buffer, spun down, and resuspended in 400 µL of staining buffer. Cells were run on an Attune NXT flow cytometer (Thermo Fisher Scientific). Subsequent analyses were performed using FlowJo software (BD). For donor 2, all mice were euthanized on day 25. For donors 1, 3, 4, and 5, spleens and tumors were analyzed as mice reached euthanasia criteria. For donor 6, all mice were euthanized on day 20.
Statistical analysis
Unless otherwise specified, all analyses were performed using GraphPad Prism (V.8.0.1), and error bars represent mean±SD; ns=p≥0.05, * for p<0.05, ** for p<0.01, *** for p<0.001,**** for p<0.0001. For indel formation assay, error bars show SEM Statistical analyses for cytokine data were performed using a two-tailed Mann-Whitney test in GraphPad Prism. Statistical analyses for flow cytometry data were performed using a one-way analysis of variance test in GraphPad prism. All box plots show median (horizontal line), IQR (hinges), and smallest and largest values (whiskers). Statistical significance for survival curves was calculated using the Mantel-Cox test.
Results
VFC-CAR T cells can be efficiently manufactured with low CAR expression heterogeneity
To avoid using HDR donor templates within viral vectors, we first cloned a third generation GD2-targeting CAR sequence21 into a plasmid containing homology arms flanking the desired cut site at the start of the first exon of the TRAC locus (figure 1A). The same third generation GD2-targeting CAR sequence was used to generate RV-CAR T cells as a comparison throughout this study (figure 1B). We next generated dsDNA HDR templates via PCR amplification off the plasmid and performed a two-step purification process to purify and concentrate the templates. Building on prior established protocols,17 we performed two sequential purifications on the PCR amplicons to produce a highly concentrated dsDNA HDR template. Primary human T cells from healthy donors were electroporated with the HDR templates and Cas9 ribonucleoproteins (RNPs) targeting the human TRAC locus. Cells were allowed to recover for 24 hours at high density in round-bottom 96-well plates. Next, the cells were cultured and assayed on days 7 and 9 post-isolation to produce VFC-CAR T cell products. We also include a VFC control (VFC-Ctrl) condition in which cells harbor the same disruption of the TRAC locus, but with a signaling-inert mCherry fluorescent protein inserted in place of the CAR (figure 1B).
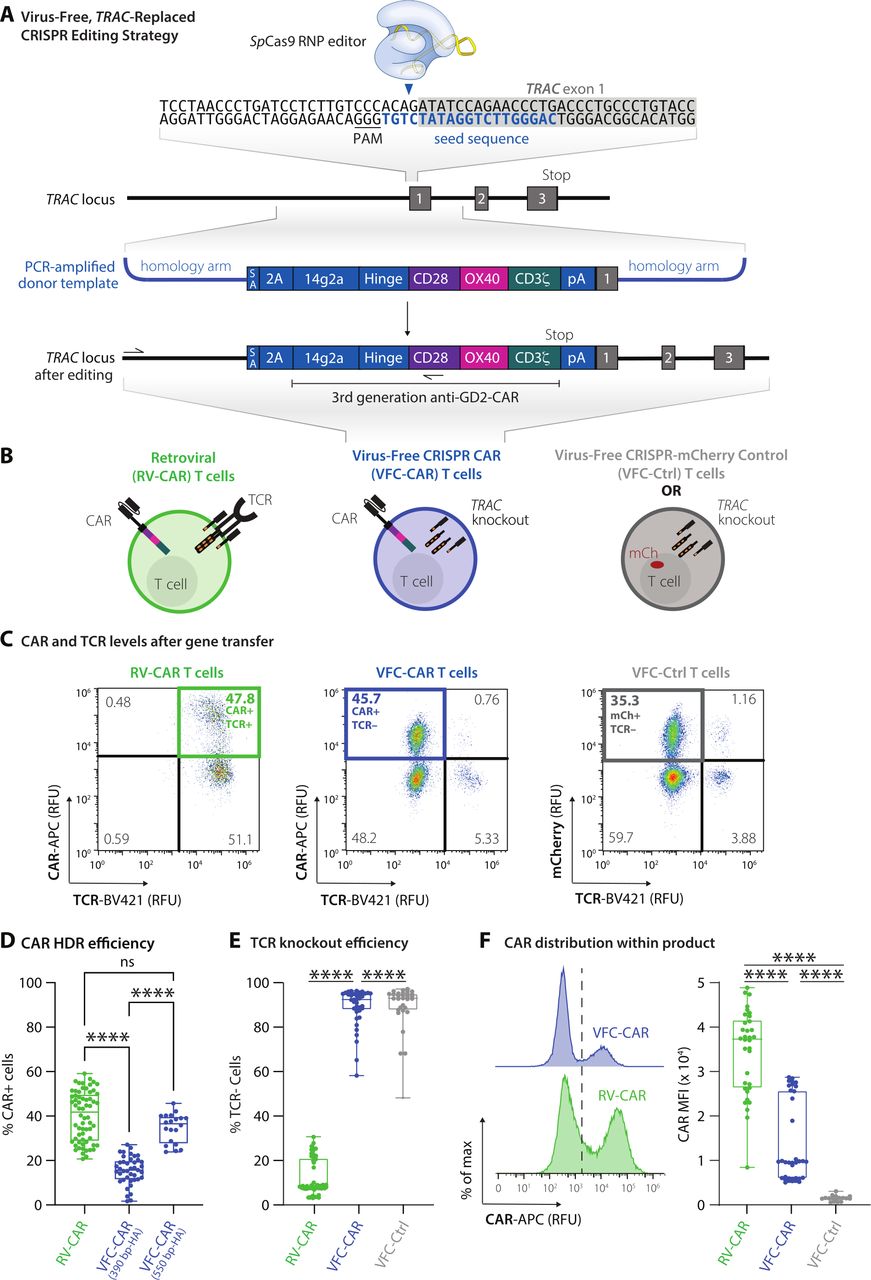
VFC-CAR T cells are efficiently generated in one step by replacing the T cell receptor with the CAR. (A) Schematic showing the CAR genetic construct and virus-free strategy to insert the CAR into the first exon (gray box) of the human TRAC gene. No viral components are necessary, and the CRISPR-Cas9 ribonucleoprotein is delivered transiently via electroporation. The seed sequence of the gRNA is in blue and the protospacer adjacent motif (PAM) for SpCas9 is underlined. 14g2a: single chain variable fragment clone targeting GD2; 2A: self-cleaving peptide, pA: rabbit ß-globin polyA terminator. Arrows indicate positions of primers for in-out PCR assay shown in figure 2. (B) Schematic of T cell products used in this study with receptors and expressed transgenes. VFC-CAR T cell product generated by electroporation. RV-CAR, donor-matched CAR T cell product generated by retroviral transduction with the same third generation anti-GD2 CAR shown in A; VFC-Ctrl, donor-matched control T cell product manufactured as in A but with an mCherry fluorescent protein instead of a CAR. (C) Representative density flow cytometry plots for transgene and TCR surface protein levels on the manufactured cell products. Y-axis shows CAR or mCherry levels and x-axis shows TCR levels on day 7 post-isolation (day 5 post-electroporation for VFC-CAR and VFC-Ctrl, and day 4 post-transfection for control RV-CAR). Thick colored boxes delineate cell populations selected for downstream analysis. (D) Boxplots show the percentage of CAR positive cells from gene editing for VFC-CAR cells and from retroviral transduction for RV-CAR cells in each sample. The first VFC-CAR product featured homology arms (HA) of 383 (left) and 391 (right) bp, respectively. The homology arms on the second VFC-CAR product were extended to 588 (left) and 499 (right) bp, respectively. (E) Boxplots show the percentage of TCR negative cells from gene editing in VFC-CAR cells and in RV-CAR cells. RV-CAR TCR negativity likely results from endogenous repression of the TCR. (F) Mean fluorescence intensity (MFI) values for the CAR expression levels with associated histograms. Boxplots show the percentage of CAR positive cells in each sample. ****p≤0.0001. CAR, chimeric antigen receptor; ns, not significant; SA, splice acceptor.
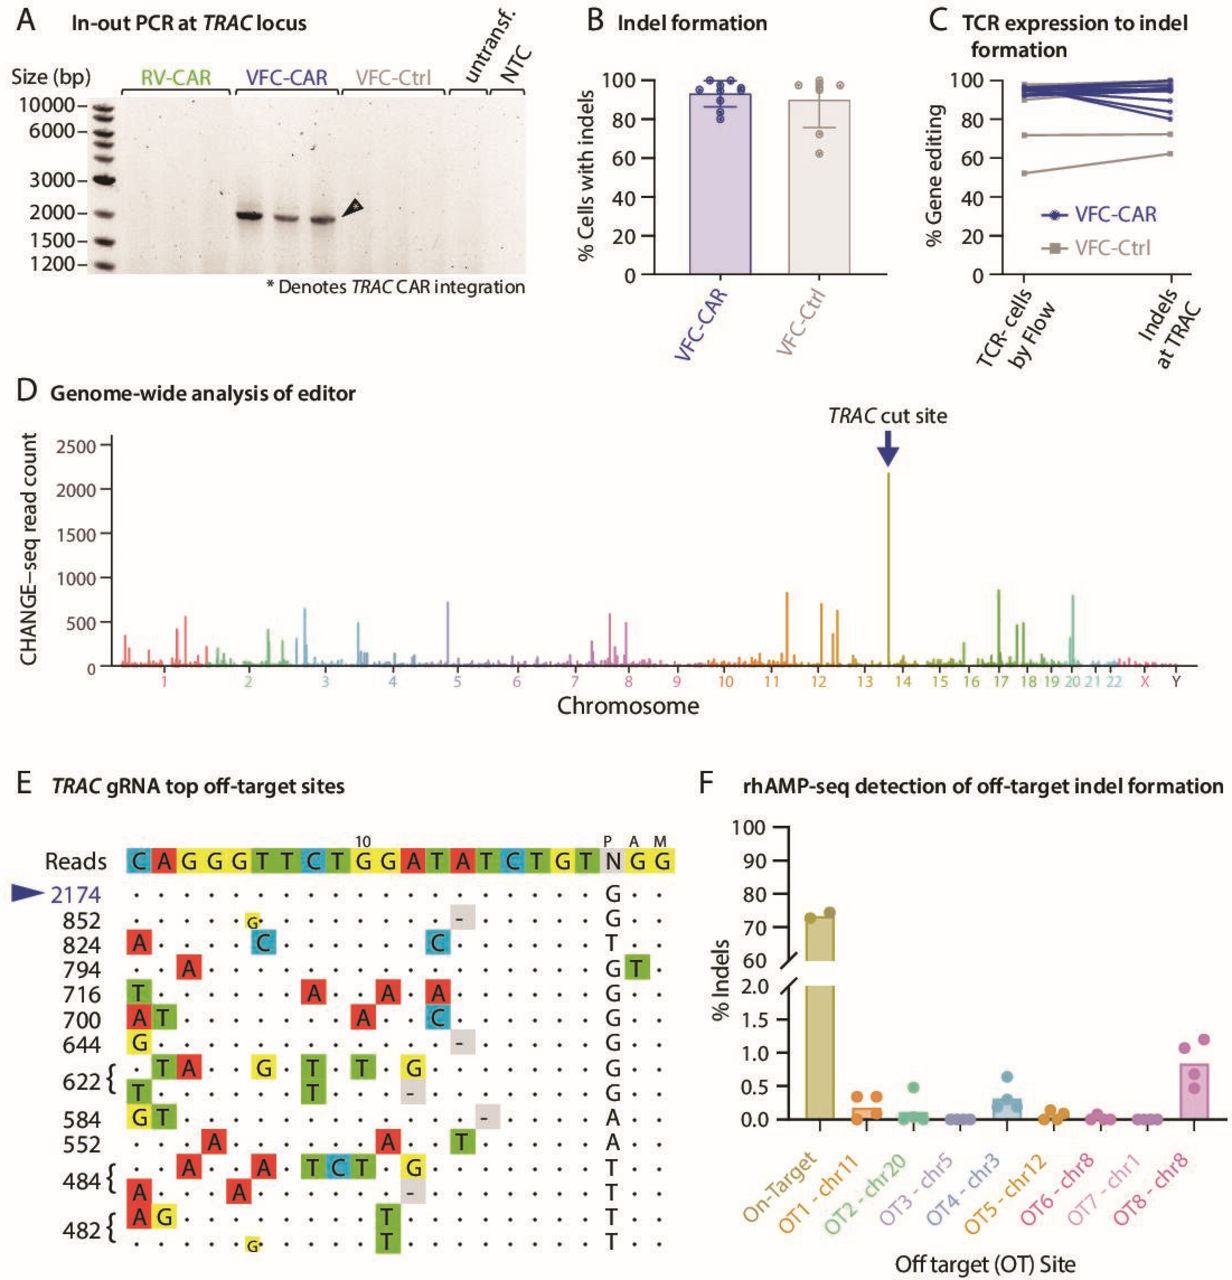
VFC-CAR T cells are efficiently and specifically edited at the TRAC gene. (A) In-out PCR indicates proper on-target genomic integration of the CAR transgene in VFC-CAR cells. Primer locations are shown in figure 1A by arrows upstream of the left homology arm and within the CD28 sequence of the CAR. (B) Percent of cells with indels at the TRAC gene in both VFC-CAR and VFC-Ctrl conditions. VFC-CAR (blue) n=10; VFC-Ctrl (gray) n=8, both for one donor. (C) Level of TCR editing in VFC-CAR and VFC-Ctrl T cells measured by both flow cytometry (left) and deep sequencing of genomic DNA (presence of insertions and deletions, indels, at the TRAC locus, right). VFC-CAR (blue) N=10, VFC-Ctrl (gray) N=8. (D) Manhattan plot of CHANGE-seq-detected on- and off-target sites organized by chromosomal position with bar heights representing CHANGE-seq read count. The on-target site is indicated with the blue arrow. (E) Visualization of sites detected by CHANGE-seq. The intended target sequence is shown in the top line. Cleaved sites (on-target and off-target) are shown below and are ordered top to bottom by CHANGE-seq read count, with mismatches to the intended target sequence indicated by colored nucleotides. Insertions are shown in smaller lettering between genomic positions, deletions are shown by (-). Output is truncated to top sites; additional sites are shown in online supplemental table S3. (F) Off-target (OT) editing detected by deep sequencing at 8 of the top 10 off-target sites predicted by CHANGE-seq. Primers were pooled in a single rhAMP-seq panel; two of the top 10 sites were excluded from analysis due to poor locus amplification. N=4 samples for each predicted site. CAR, chimeric antigen receptor; NTC, no template control; Untransf., untransfected donor-matched T cells; VFC, virus-free CRISPR.
We profiled each cell product for viability and yield at various points throughout the manufacturing process. The viability of VFC-CAR and RV-CAR T cells were both high (>80%) by the end of manufacturing (online supplemental figure S1A). Cell proliferation and growth over 9 days were robust for both groups (online supplemental figure S1A). We assessed gene editing at multiple points postisolation and achieved higher levels of CAR integration when cells were edited at 48 hours after CD3/CD28/CD2 stimulation (online supplemental figure S1B). Using these templates, we achieved consistently high genome editing across over four donors, with an average of 15% knockin efficiency. We improved targeting efficiency further by using alternate primer pairs in our PCR strategy, which increased the length of the homology arms from ~390 bp to ~550 bp on either side of the CAR. This product, while larger in size (3.4 kb), demonstrated up to 45% knockin efficiency, with an average of 34% CAR+ and TCR cells, as measured by flow cytometry (figure 1C,D). Within the VFC-CAR samples, the TCR was consistently knocked out in >90% of T cells (figure 1E). The mean fluorescence intensity of CAR expression was significantly elevated and showed greater range (~1.6-fold; figure 1F) in the RV-CAR samples in comparison to the VFC-CAR samples, indicating decreased CAR expression heterogeneity within the VFC-CAR product and consistent with prior findings with AAV-CRISPR-CAR T cells.5
Supplemental material
Genomic analysis indicates specific targeting of the CAR transgene to the TRAC locus
After confirming robust CAR protein expression, we performed genomic analysis to measure the on-target specificity of the gene edit. Proper genomic integration of the CAR was confirmed via an ‘in-out’ PCR amplification assay22 on the genomic DNA extracted from the manufactured cell products with primers specific to the TRAC locus and the transgene (figure 2A). Next-generation sequencing of genomic DNA to profile TRAC alleles in the cell products without an integrated transgene confirmed high rates of genomic disruption at the TRAC locus for these residual alleles, with 93.06% indels for the VFC-CAR and VFC-Ctrl samples. Altogether, the combined genomic integration of the CAR or mCherry transgene and indels at the TRAC locus resulted in concomitant loss of TCR protein on the T cell surface in sample-matched assays (figure 2B,C). Genome-wide, off-target activity for our editing strategy was assayed by CHANGE-seq.24 Putative off-target sites are shown in online supplemental table S3. The top modified genomic site was identified to be the intended on-target site (figure 2D,E) with a rapid drop-off for off-target modifications elsewhere in the genome. The CHANGE-seq specificity ratio of our TRAC editing strategy is above average (0.056; 57th percentile) when compared with published editing strategies previously profiled by CHANGE-seq.24 To further validate these results, we performed deep sequencing at eight of the top off-target sites identified by CHANGE-seq on genomic DNA isolated from four edited products and detected minimal indel formation at any of these sites (figure 2F).
Cytokine profiling reveals high antigen-specific response for VFC-CAR T cells
After harvesting CAR T cells, we profiled secreted cytokines typically associated with a proinflammatory response. On day 9 of manufacturing prior to antigen exposure, RV-CAR T cells produced higher levels of IFNγ, TNFα, IL-2, IL-4, IL-10, IL-13, IL-6, IL-1β and IL-12p70, in comparison to both VFC-CAR and VFC-Ctrl T cells (figure 3A). To determine cytokine production after antigen-induced stimulation, we performed a 24-hour co-culture between the engineered T cells and GD2+CHLA20 neuroblastoma, then measured cytokines in the conditioned media. Interestingly, we found that in the presence of antigen stimulation, the previous trend had reversed: VFC-CAR T cells either matched or surpassed the level of cytokine production of the RV-CAR T cells (figure 3B). This result suggests that cytokine secretion after a single antigen stimulation is comparable in VFC-CAR and RV-CAR T cells, but basal secretion in the absence of antigen stimulation is decreased in VFC-CAR T cells.

VFC-CAR T cells mount robust cytokine response on exposure to cognate antigen, and decreased CAR and TCR-mediated signaling during manufacturing. (A) Cytokine production from conditioned media taken from T cell products at the end of manufacturing (pre-antigen exposure). Values are pooled from four donors. VFC-CAR (blue) N=24; RV-CAR (green) N=33; VFC-Ctrl (gray) N=22. (B) Cytokine production in conditioned media after a 24 hour co-culture of manufactured T cell products with the target GD2-antigen on CHLA20 neuroblastoma cells. Values are pooled from two donors. VFC-CAR (blue) N=8; RV-CAR (green) N=5; VFC-Ctrl (gray) N=8. Statistical significance was calculated with a two-tailed Mann-Whitney U test. *P≤0.05; **p≤0.01; ***p≤0.001; ****p≤0.0001. (C) Western blot from cell lysates containing equivalent fractions of transgene+ cells (40% of each sample) and stained for CD3ζ, phosphorylated (p) CD3ζ. CD3ζ domains from native CD3ζ and GD2.28.40.ζ were distinguished by molecular weight (~15 and ~60 kDa, respectively). N=1 donor. RV-CAR, γ-retroviral-chimeric antigen receptor; TCR, T-cell receptor; VFC, virus-free CRISPR.
VFC-CAR T cells exhibit low basal TCR and CAR signaling during manufacturing
To test the possibility that variation in cytokine production prior to cognate antigen exposure resulted from varying levels of basal signaling from the CAR and/or TCR during ex vivo culture, we assayed CD3ζ phosphorylation from both native TCR-CD3ζ and the CD3ζ portion of the CAR via western blot (figure 3C). We found elevated protein levels of both CAR and TCR-associated CD3ζ in RV-CAR T cells relative to VFC-CAR T cells, potentially indicative of both a higher CAR copy number in RV products and an intact TCR-CD3ζ complex in the absence of TRAC knockout.25 We also observed higher levels of CD3ζ phosphorylation in RV-CAR T cells from both CAR and TCR-associated protein, indicating elevated levels of basal signaling. In the absence of antigen exposure, CAR/TCR tonic signaling is likely higher in the RV-CAR T cells. While some degree of basal TCR signaling has been proposed to improve long-term persistence,26 the broad effects of TCR tonic signaling on CAR T products are not well understood. CAR tonic signaling also correlates with an increased propensity for terminal differentiation and exhaustion in some CAR T cell products, especially those manufactured with RV vectors.26–28 VFC-CAR and VFC-Ctrl cells both showed sharply decreased TCR-mediated CD3ζ signaling after TRAC knockout, and VFC-CAR T cells also showed minimal activity from CAR-associated CD3ζ. These results with our anti-GD2 CAR are consistent with prior findings of lower tonic signaling with an anti-CD19 CAR when CAR expression was driven by the endogenous TRAC promoter.10 Both TCR and CAR-mediated basal signaling are diminished by our VFC strategy, in comparison to traditional RV products.
VFC-CAR T cells exhibit elevation of some surface memory markers
To further explore the differential state of viral and virus-free CAR T cell proteomes, we performed an immunophenotyping panel using spectral cytometry, assaying for markers of T cell memory and differentiation state, activation, trafficking, exhaustion, and senescence. For all markers, we gated cells first by size and shape, then by viability, CD45 expression, and transgene expression (online supplemental figure S2A). We then probed markers of memory and effector states, activation, and trafficking (online supplemental figure S2B), and exhaustion and senescence (online supplemental figure S2C). A dramatic decrease in CD3 expression in both VFC-CAR and VFC-Ctrl products relative to RV-CAR T cells was found, as expected following TCR knockout25 (figure 4A). This finding corroborates the decrease in CD3ζ detected by western blotting. We observed varied ratios of CD4:CD8 T cells, with no significant difference between experimental groups.
Supplemental material
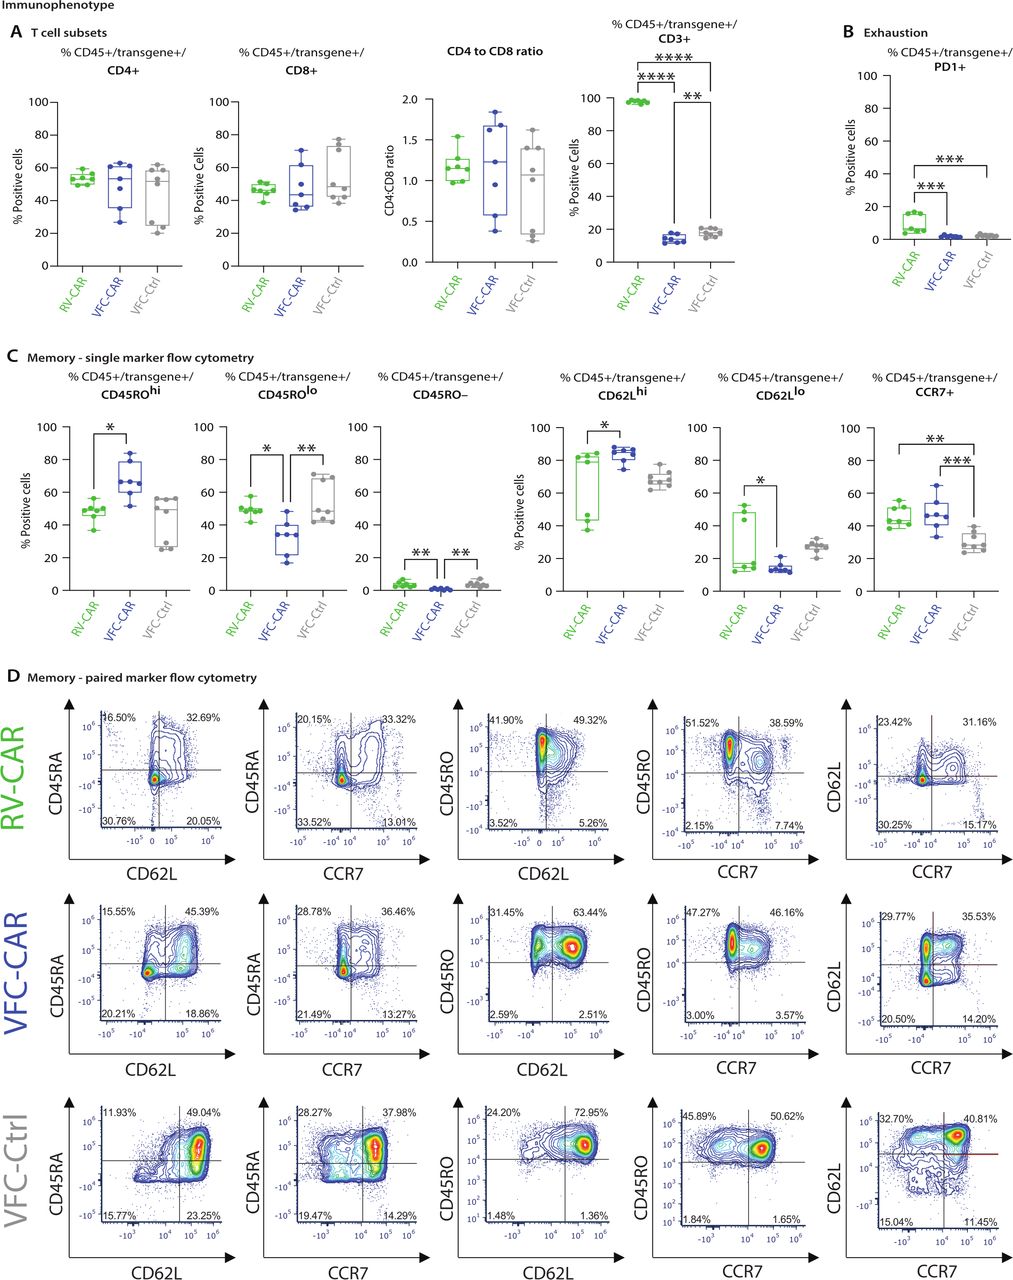
Immunophenotyping profile of VFC-CAR T products. Cells were assayed by spectral cytometry with a 21-color immunophenotyping panel on day 10 of manufacturing. (A) No significant differences were observed in CD4 and CD8 expression, or the CD4:CD8 ratio across cell types. CD3 was significantly decreased in TRAC edited products. (B) RV-CAR T cells showed elevated levels of the exhaustion marker PD-1 relative to VFC T cells. (C) VFC-CAR T cells showed elevated levels of CD45ROhi cells relative to RV-CAR T cells, and elevated levels of CD62Lhi cells; no significant difference was observed for CCR7, a third marker of central memory. For all panels, cells were gated on CD45+ transgene+ cells (either CAR or mCherry). Gating strategies are shown in online supplemental figure S2. Additional markers are shown in online supplemental figure S3). (D) Raw flow cytometry plots showing co-expression of pairs of markers associated with memory formation and differentiation. VFC-CAR (blue) N=7; RV-CAR (green) N=7; VFC-Ctrl (gray) N=8 across two donors. Significance was determined by ordinary one-way ANOVA; *p≤0.05; **p≤0.01; ***p≤0.001; ****p≤0.0001. ANOVA, analysis of variance; CAR, chimeric antigen receptor; RV, γ-retroviral; VFC, virus-free CRISPR.
Supplemental material
We probed five exhaustion-associated markers: PD1, LAG3, TIM3, TIGIT, and CD39. Of these, only PD1 showed a significant difference across sample types, with elevated expression in RV-CAR T cells relative to VFC-CAR or VFC-Ctrl products (figure 4B, online supplemental figure S3A). Other exhaustion markers showed no significant difference between groups.
We next assessed expression of various markers associated with memory formation (figure 4C, online supplemental figure S3B). We first assessed expression of CD45RA and CD45RO, which are frequently used to distinguish naive/effector and memory subtypes.29 Surprisingly, we found that a majority of cells expressed both markers, likely indicating a transitional cell state30; however, significantly more VFC-CAR T cells expressed the memory-associated CD45RO marker at high levels relative to RV-CAR T cells, potentially suggesting active differentiation toward a central memory (Tcm) or effector memory phenotype (figure 4C). There was a skew toward high levels of CD62L, another memory-associated protein, in VFC products relative to viral products; this is consistent with phenotypes observed for TRAC-knockout CD19 CAR T cells10 (figure 4C, online supplemental figure S3B). The vast majority of cells in all groups expressed CD95, which would suggest that the cells have differentiated beyond a naive phenotype, as expected after activation by a CD2/CD3/CD28 tetrameric antibody in the culture media (online supplemental figure S3B).
We assessed co-expression of pairs of memory-associated markers including CD45RA/CD62L and CD45RA/CCR7 (consistent with stem cell memory T cells), as well as CD45RO/CD62L, CD45RO/CCR7, and CD62L/CCR7 (consistent with Tcm) (figure 4D). The most notable shift occurred in the CD45RO+/CD62L+ fraction, which was elevated in VFC products. While this phenotype would typically suggest a central memory phenotype, it is complicated by co-expression with CD45RA in most cells, which marks both naïve and effector T cells. We conclude that the phenotypes observed at day 10 suggest that VFC-CAR T cells express some combinations of markers that are more ‘memory-like’ than RV-CAR T cells. However, the phenotype at this time point remains transitional, and cannot be assigned to canonical subsets that would typically be found in vivo (eg, central memory, stem cell memory, terminal effector). Of two costimulatory molecules we assessed, CD27 showed slight upregulation in RV-CAR T cells, while CD28 expression was comparable across groups. Other markers profiled included the trafficking marker CXCR3 (online supplemental figure S3C), which was not differentially expressed between groups, and the activation marker HLA-DR, which was robustly upregulated in all CAR T products, slightly above the VFC-Ctrl condition online supplemental figure S3D. All products had negligible expression of the senescence marker CD57 (online supplemental figure S4E).
Supplemental material
Single cell memory-associated and exhaustion-associated transcriptional signatures of VFC-CAR products
To further characterize the phenotypic differences between RV-CAR, VFC-CAR, and VFC-Ctrl T cells, we performed single-cell RNA-sequencing (scRNA-seq) on 79,317 cells from two different donors, both at the end of the manufacturing process and after 24 hours of co-culture with GD2+CHLA20 neuroblastoma cells (figure 5A). We pooled all samples into one dataset and performed tSNE dimensionality reduction and graph-based clustering on all cells using established methods.23 We observed no significant donor-specific batch effects, as indicated by gross clustering patterns in the combined data set (online supplemental figure S4A). We identified 22 distinct clusters within the combined dataset, of which 18 expressed T cell markers across CD4 and CD8 subsets (figure 5A, online supplemental figure S4A,B). The remaining four clusters contained residual cancer cells from cocultured samples and were removed from downstream analysis. To distinguish edited cells within each sample, we aligned reads to custom reference genomes containing an added sequence mapping to the CAR or mCherry transgenes. Subsequent analyses were carried out on transgene-positive cells only within each sample (21,068 total transgene+ cells).

Transcriptional signatures of single CAR T cells prior to and after target antigen exposure. (A) tSNE projection of single cell RNA-seq data from 15 samples of manufactured cell products, both preantigen and postantigen exposure; 79,317 single cells from RV-CAR, VFC-CAR, VFC-Ctrl and untransfected T cell products are shown. (B, C) Proportion of transgene+ cells from all preantigen samples (B) and postantigen samples (C) within each annotated cluster. Each color represents a different cluster, shown in A; purple clusters are memory-associated; yellow clusters are effector-associated; gray clusters could not be identified as pure T cell clusters due to a mix or lack of robust CD4/CD8 expression. At left, the distribution of transgene+ cells within the tSNE space in A are shown. A total of 5 of 9,623 untransfected cells featured reads mapping to the CAR or mCherry transgenes, indicating a false-positive rate of identifying transgene-positive cells at 0.05%. CAR, chimeric antigen receptor; RV, γ-retroviral; t-SNE, T-distributed stochastic neighbor embedding; VFC, virus-free CRISPR.
We next assessed gene expression of the 18 clusters identified as T cells to identify their phenotypes. We first assigned each cluster to CD4 or CD8 subsets (online supplemental figure S4B). Next, we assessed markers associated with various T cell subtypes on prior studies of human T cells,29 31 32 including CAR T cells33 (online supplemental figures S5-7). Six clusters expressed markers associated with early/stem cell-like memory phenotypes, including the transcription factors LEF1 and TCF7, (online supplemental figure 5A). Three clusters expressed a mix of early, central, and effector memory markers (panels shown in online supplemental figure S5A–C, respectively), and were designated ‘mixed memory’. Two clusters expressed markers associated with T helper 2 (Th2) effector T cells (IL4, IL13, and GATA3; Online supplemental figure S6A), and three clusters expressed markers with effector-like phenotypes (eg, high Granzyme B, GZMB; other markers shown in online supplemental figure S6B). We noted that these three clusters also exhibited higher levels of some exhaustion-associated markers including LAG3, TIM3, and CD39; notably, PD1 was largely absent (online supplemental figure S7A). We determined that cells in these clusters were closer to terminal differentiation, but not fully exhausted. Three clusters showed unclear expression of CD4 or CD8, and were classified as unidentified. RNA-seq expression for markers profiled via surface protein immunophenotyping (previously shown in figure 4) is reported in online supplemental figure S8; these transcripts largely show concordance with protein-level expression.
Supplemental material
Supplemental material
Supplemental material
Supplemental material
We next asked whether transgene+ cells showed differences in differentiation state depending on the mode of gene transfer (figure 5B; a detailed breakdown separated by CD4/CD8 subtypes is shown in online supplemental figure S9A). In the absence of antigen exposure, VFC-CAR and control samples were overrepresented in memory-associated clusters. 72% of transgene+ VFC CAR T cells had memory-like phenotypes at harvest, as did 84% of VFC-Ctrl cells. Conversely, only 34% of RV-CAR T cells showed memory-like phenotypes. 42% of RV-CAR T cells at harvest fell into effector-like clusters, while only 21% of VFC-CAR T cells and 18% of VFC-Ctrl T cells did so. This trend held true for CD4 and CD8 T cells across both donors and suggests that VFC products featuring TRAC knockout are on average less differentiated at harvest than RV-CAR T cells.
Supplemental material
Finally, we asked whether differentiation state varied between samples after 24 hours of coculture with GD2+neuroblastoma (figure 5C; a detailed CD4/CD8 breakdown is shown in online supplemental figure S9B). After antigen exposure, VFC-CAR and RV-CAR T cells both showed a shift toward effector-like transcriptional signatures (44% and 48%, respectively). Conversely, only 12% of VFC-Ctrl cells expressed effector-like phenotypes, while 79% retained memory-like signatures and resembled cells that had not been exposed to antigen. Based on this finding, short-term antigen exposure resulted in a comparable effector response from both VFC and RV-CAR T cells, while individual VFC-Ctrl cells lacking a CAR retain their less-differentiated phenotype when exposed to cancer cells.
VFC-CAR T cells demonstrate in vitro cytotoxicity of GD2-positive cancer cells
After characterizing cellular phenotypes and gene expression at the end of the manufacturing process, we measured the in vitro activity of VFC-CAR T cells against cell lines derived from two GD2-positive solid tumors: CHLA20 neuroblastoma and M21 melanoma (figure 6A). We performed a fluorescence-based cytotoxicity assay measuring loss of expression from fluorescently labeled cancer cells over time (figure 6B), and IncuCyte live cell analysis at 2-hour intervals over a 48-hour period (figure 6C). We observed robust cytotoxicity at a 5:1 E:T ratio for both VFC-CAR and RV-CAR T cells, for both assays. In this assay, T cells were not normalized by the percentage of CAR positivity, and VFC-CAR T cells were edited at lower rates (~18% CAR+, relative to 40% CAR+RV CAR T cells); however, both groups showed effective cytotoxicity. These results corroborate our finding that VFC-CAR T cells produce proinflammatory cytokines and upregulate a cytotoxicity-associated gene signature at levels comparable to RV-CAR T cells and demonstrate similar target cell killing activity for multiple GD2+ cancers of variable origin.
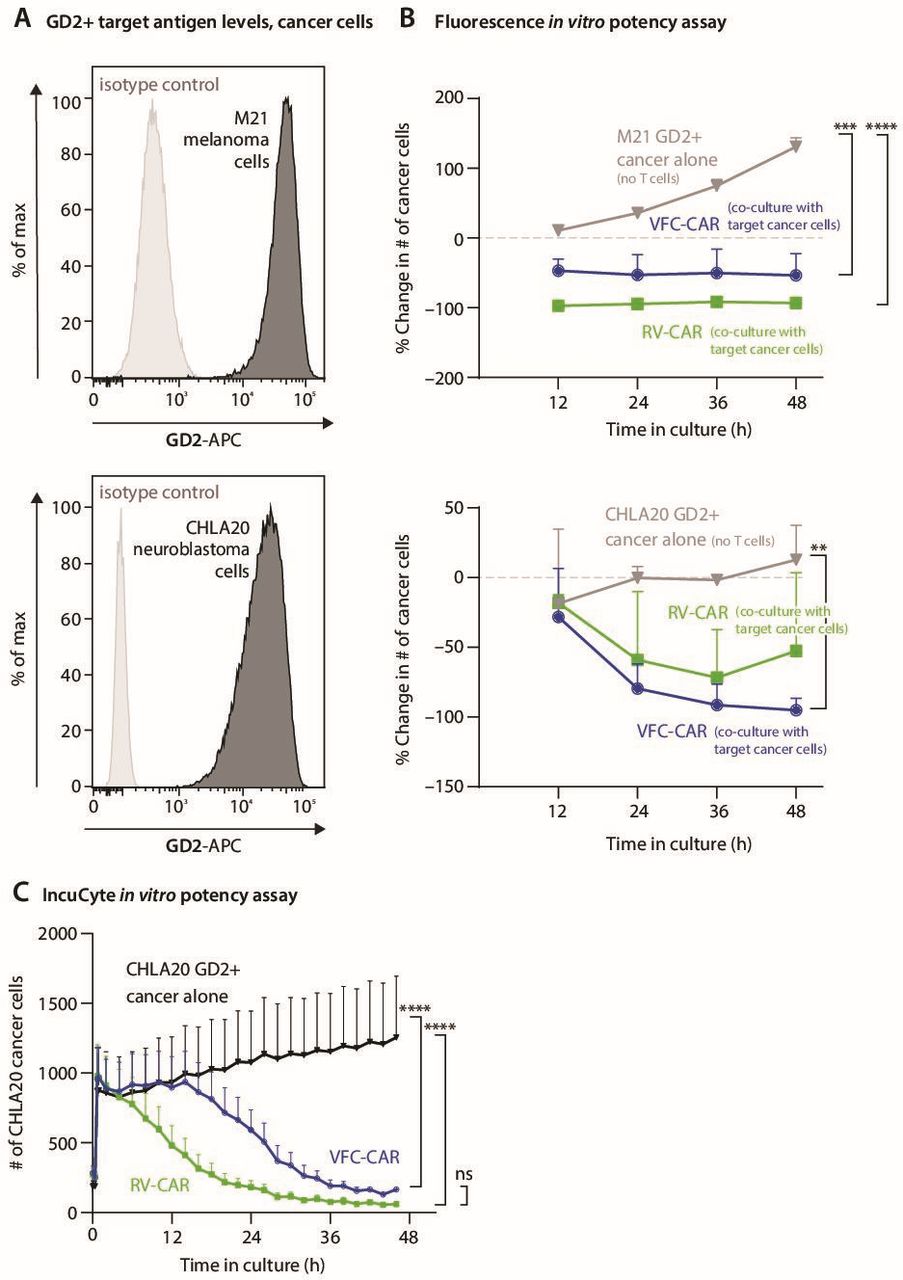
VFC-CAR T cells demonstrate robust in vitro killing of GD2+ cancer cells. (A) Flow cytometry histograms show GD2 surface expression on M21 and CHLA20 cell lines (black) compared with isotype controls (gray). (B) Graphs show the cytotoxic action of VFC-CAR and RV-CAR T cells against two GD2-positive tumor cell lines, CHLA20 and M21, containing a stably integrated H2B-mCherry fluorescent transgene. Cytotoxicity was measured as the change in the number of mCherry-positive objects for each image. The assay was performed using cells manufactured from one donor. (C) IncuCyte in vitro assay of T cell activity, averaged across four donors. AnnexinV was added as a marker of cell death; y-axis shows AkaLUC-GFP-positive cancer cells in each well of a 96-well plate. The ratio of T cells to cancer cells is 5:1. The consistent decrease in CHLA20 cells after 15 hours indicates high activity of both VFC-CAR and RV-CAR T cells. VFC-CAR (blue) N=12; RV-CAR (green) N=12; CHLA20 neuroblastoma alone (black) N=9. **p≤0.01; ***p≤0.001; ****p≤0.0001. CAR, chimeric antigen receptor; ns, not significant; RV, γ-retroviral; VFC, virus-free CRISPR.
VFC-CAR T cells induce regression of GD2-positive neuroblastoma in vivo
Because important clinical cell behaviors like homing, persistence and cytotoxicity within a tumor microenvironment cannot be easily assessed in vitro, we rigorously assessed CAR T cell activity in vivo in an established human GD2+ neuroblastoma xenograft model. After 9 total days of culture, multiple replicate wells of RV-CAR, VFC-CAR, or VFC-Ctrl T cells were pooled for injection into NSG™ mice. Ten million T cells were delivered via tail vein injection to each NSG™ mouse with an established luciferase-expressing CHLA20 neuroblastoma solid tumor identified by bioluminescence (figure 7A). The proportion of CAR+ cells was equivalent (40%) for VFC and RV-CAR T cells, and tumor sizes were quantified over time by IVIS imaging and digital caliper.

Virus-free CAR T cells exhibit in vivo activity against GD2+ solid tumors with high event-free survival and low exhaustion. (A, left) representative IVIS images of NSG™ mice with CHLA20 tumors that were treated with either 10 million VFC-CAR, RV-CAR, or VFC-Ctrl T cells. VFC-CAR and RV-CAR products were 40% CAR-positive for a total dose of 4 million CAR+ cells per mouse. VFC-Ctrl products were 38% mCherry-positive for a total dose of 3.8 million transgene+ cells per mouse. GD2+ solid tumors were established in the side flank of each mouse as detected by IVIS imaging at day −1. At day 0, three different CAR T products as shown below were infused into the tail vein. (A, right) pictures of RV-CAR T-treated mice showing xeno-GvHD symptoms from the intact TCR function within the RV-CAR T cells. none of the mice infused with VFC products displayed signs of xeno-GvHD. (C) Individual adverse clinical score of each mouse treated. Higher score indicates more adverse symptoms observed in the mice, such as elevated weight loss, hunched posture, ruffled fur, scaly or flaky skin, and decreased activity. (D) Kaplan-Meier curve for total probability of survival. VFC-CAR (blue) N=4; RV-CAR (green) N=4; VFC-Ctrl (gray) N=4. (E) Kaplan-Meier curve for probability of event-free survival, defined as the absence of a palpable tumor or development of an individual clinical score of 4 or above (E) Donut plots show expression of exhaustion-associated markers detected within T cells collected from mouse spleens. RV-CAR, N=6; VFC-CAR, N=7, VFC-Ctrl, N=6. (F) T cell differentiation immunophenotypes detected within mouse spleens. RV-CAR T cells showed significantly higher proportions of more differentiated effector memory (Tem) and terminal effector (teff) T cells relative to VFC T cells. CAR, chimeric antigen receptor; IVIS, in vivo imaging system; RV, γ-retroviral; VFC, virus-free CRISPR.
After 1 month, all four mice treated with RV-CAR T cells had higher adverse clinical scores indicative of xenogenic graft-versus-host-disease (xeno-GvHD; figure 7B,C). The lack of xeno-GvHD in the mice treated with VFC-CAR and VFC-Ctrl products indicates functional knockout of TCR signaling by our CRISPR-Cas9 editing strategy. Three of the four mice treated with VFC-CAR products were event-free (no palpable tumor or GvHD) and survived past 96 days (figure 7D,E). We assessed persistence, memory and exhaustion phenotypes in human lymphocytes recovered from the spleen and tumors of CHLA20-bearing mice as they reached euthanasia criteria, up to 100 days after the initial T cell infusion. CAR+ or mCherry+ T cells persisted in the spleens for all products. RV-CAR cells expressed higher levels of the exhaustion markers PD-1, LAG-3, and/or TIM-3 relative to VFC-CAR and VFC-Ctrl cells (figure 7F). Significantly higher numbers of RV-CAR T cells were differentiated toward effector memory and terminal effector cell states in vivo (figure 7G). We also observed elevated levels of the memory-associated proteins CCR7 and CD62L in VFC-CAR T cells (figure 7G). These results in vivo mirror the skew toward effector phenotypes in RV-CAR cells observed in vitro with single cell RNA-seq and immunophenotyping assays. Altogether, these findings demonstrate that VFC-CAR T cells and RV-CAR T cells have comparable cytotoxic activity in vitro, establishing the potential clinical relevance of VFC-CAR T cells for treating solid tumors. An additional set of in vivo experiments in which the proportion of CAR+ cells was not normalized demonstrated further evidence that even at low dosages, VFC-CAR T cells show tumor clearing ability, improve survival, and persist within spleens and tumors at elevated levels relative to the control treatment (online supplemental figure S10A–E and S11A–D).
Supplemental material
TRAC knockout affects CAR T cell phenotype and function
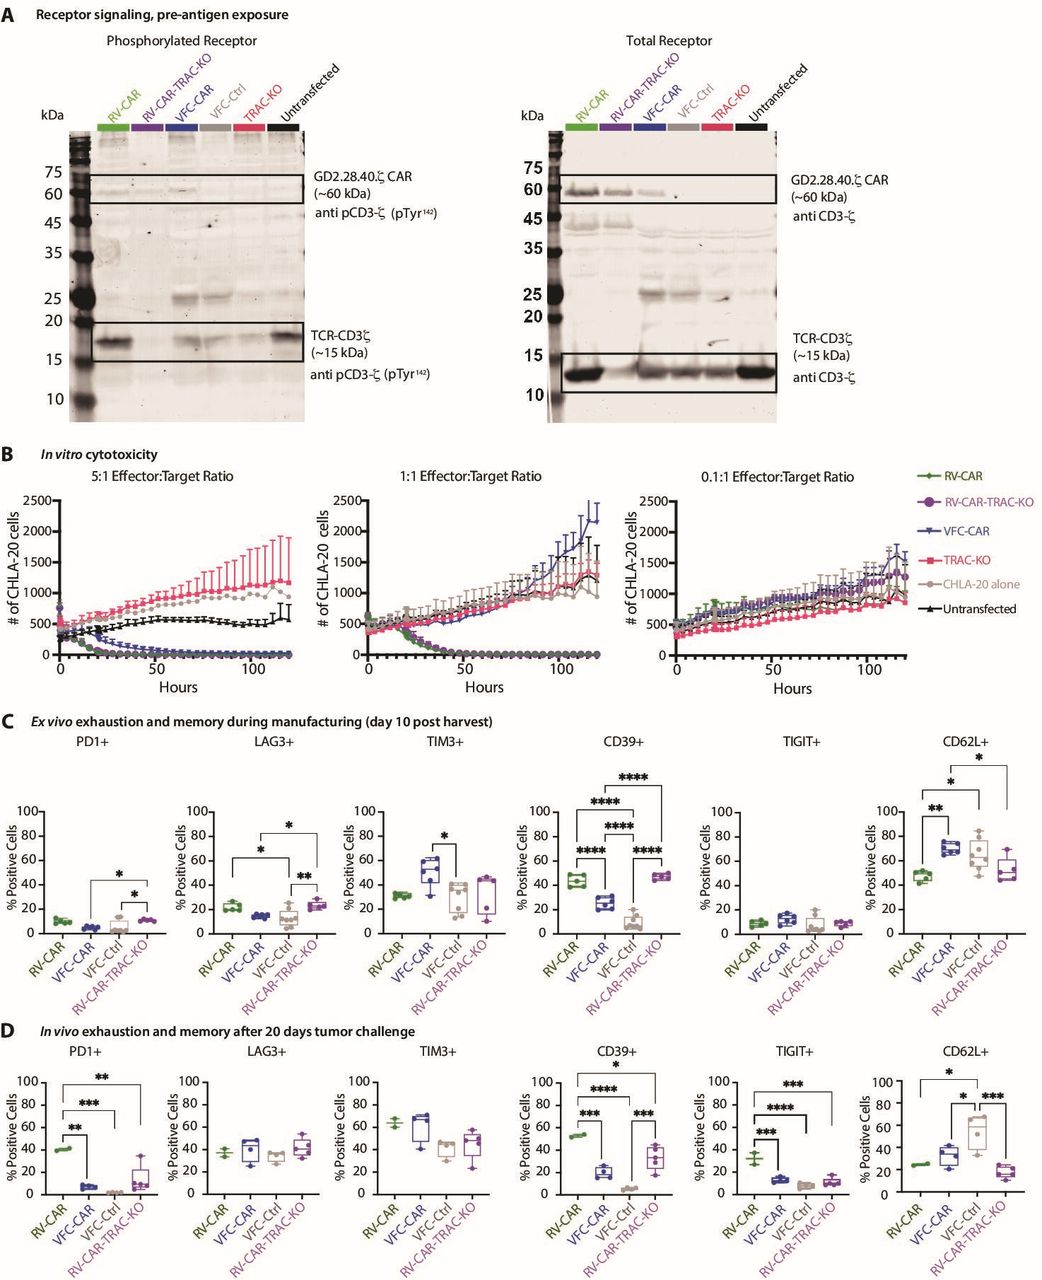
To further probe the differences observed between VFC-CAR and RV-CAR T cells, we explored functional and phenotypic effects of TRAC knockout versus TRAC-mediated CAR expression. We repeated several experiments with two additional controls: one condition in which RV-CAR T cells were transduced after CRISPR-mediated knockout of the TRAC locus (RV-CAR-TRAC-KO T cells) and another featuring TRAC-knockout T cells with no transgene insertion. Western blots for CAR and TCR-associated CD3ζ showed a decrease in both total CD3ζ and phosphorylated CD3ζ in RV-CAR-TRAC-KO T cells, consistent with prior results (figure 8A). Modest phosphorylation of endogenous CD3ζ likely arises from engagement with the CD2/CD3/CD28 activator used during manufacturing, which is a driver of basal ζ signaling in unedited T cells. We also found that RV-CAR-TRAC-KO T cells killed as efficiently as RV-CAR T cells in vitro. Robust cytotoxicity was observed at both 5:1 and 1:1 E:T ratios, which were calculated based on percent CAR positivity. VFC-CAR T cells showed comparable cytotoxicity at a 5:1 E:T ratio, but less killing at a lower 1:1 E:T ratio. No activity was observed for any groups at very low 0.1:1 E:T ratios (figure 8B).
TRAC knockout affects CAR T cell phenotype and function. (A) Western blot from cell lysates stained for CD3ζ, (right) and phosphorylated (p)CD3ζ (left). CD3ζ domains from native CD3ζ and GD2.28.40.ζ were distinguished by molecular weight (~15 and ~60 kDa, respectively). N=1 donor. (B) IncuCyte in vitro assay of T cell activity for one donor. AnnexinV was added as a marker of cell death; y-axis shows AkaUC-GFP-positive cancer cells in each well of a 96-well plate. Effector:target (E:T) ratios were determined based on percent CAR positivity, which was measured by flow cytometry 2 days prior to beginning co-culture. (C) In vitro immunophenotyping of exhaustion markers and the memory marker CD62L. Flow cytometry was performed on day 10, concurrently with infusion into mice. Additional markers are shown in online supplemental figure S12. (D) In vivo immunophenotyping of exhaustion markers and the memory marker CD62L. Flow cytometry was performed on T cells isolated from spleens, collected 20 days after initial infusion of CAR T products. *P≤0.05; **p≤0.01; ***p≤0.001; ****p≤0.0001. CAR, chimeric antigen receptor; RV, γ-retroviral; VFC, virus-free CRISPR.
Supplemental material
We next asked whether TRAC knockout altered the phenotype of cells at harvest, or after in vivo solid tumor challenge. We performed spectral immunophenotyping on day 10 of culture and assessed expression of five exhaustion-associated markers. Of these, CD39 showed the most dramatic differences: it was elevated in RV products relative to VFC products regardless of TRAC knockout. LAG3 and PD1 were also expressed at slightly higher levels in RV-CAR-TRAC-KO T cells relative to VFC-CAR T cells (figure 8C). When we explored other markers of memory, activation, trafficking and senescence, we found no differences between RV-CAR and RV-CAR-TRAC-KO T cells with the exception of CD3, which was greatly decreased, as expected, in all TRAC-edited T cells (online supplemental figure S12A). We did not observe an increase in CD62L in RV-CAR-TRAC-KO products; thus, CD62L elevation in VFC-CAR T cells appears to be specifically driven by TRAC-mediated CAR expression (figure 8C). Overall, these results suggest that apart from loss of CD3, the phenotypic shifts observed in VFC-CAR T cells at harvest are driven more by TRAC-mediated CAR expression than knocking out TRAC.
To determine whether TCR engagement had a significant effect in vivo, we repeated tumor challenge experiments with the added RV-CAR-TRAC-KO control. After recovering T cells from mouse spleens 20 days after infusion, we found that exhaustion was partially mediated by TRAC knockout. CD39, PD-1 and TIGIT were all significantly lower in RV-CAR-TRAC-KO T cells than RV-CAR T cells (figure 8D). Except for CD3, no other markers showed significant differences between the two retroviral conditions, although VFC-CAR T cells once again expressed elevated levels of some markers associated with memory formation, including CD62L, and CCR7 (online supplemental figure S12B). These findings suggest that while TRAC knockout has an effect on exhaustion in vivo, it is not solely predictive of phenotypic differences between VFC and RV-CAR T cells.
Discussion
Historically, CAR T cells have exhibited frustratingly limited success against solid tumors. While anti-GD2 CAR T cells were the first to mediate regression of a solid tumor34 in patients, the effects ultimately were not durable due in part to poor T cell persistence.14 The most successful trial to date for GD2+ DIPG solid tumors yielded promising results with partial remissions noted, although all four patients ultimately died.1 Extensive work has focused on overcoming the immunosuppressive tumor microenvironment, but there is still an urgent need for new engineering strategies to make the cell product itself more potent, whether through armored CARs, T cell selection procedures, combinatorial therapies, or other approaches.35–37 We sought to determine whether a TRAC-CAR replacement strategy, previously shown to be successful in the context of a CD19 CAR, had any effect on outcomes in the context of an anti-GD2 CAR targeting a solid tumor. Leveraging prior work on hematological malignancies where anti-CD19 AAV-CAR T cells were generated using AAV and Cas9,10 we develop a virus-free workflow that can accommodate a large CAR template (~3.4 kb) targeting a solid tumor antigen, GD2. Our findings suggest that manufacturing genome-edited VFC-CAR T cells to treat solid tumors is feasible.
Our manufacturing process produced similar yields across six donors and resulted in stable, genomically integrated, durable CAR expression (>100 days in vivo) without the use of viral vectors during gene transfer. The decrease in T cell viability linked to electroporation38 is transient in our workflow with cells recovering to >80% viability just 1 week after electroporation, satisfying typical regulatory specifications.39 Our use of high-density culture to improve T cell aggregation may stimulate prosurvival cell-cell signaling to overcome stress arising from electroporation. Furthermore, the timing and speed of cell proliferation after electroporation could influence editing rates, as homologous recombination is active in the S and G2 phases of the cell cycle and increases in HDR have been observed in cycling cells.40 We also modify the manufacturing process to generate the HDR repair template by performing two sequential SPRI-based purification steps on the PCR products; this procedure concentrates the template. We do not rely on excipients to increase editing efficiency, which have been proposed recently,41 and thereby provide a streamlined gene transfer process.
In retroviral and transposon-based CAR T products, vector copy numbers can vary,42 43 and genomic integration is scattered across >10,000 sites in the human genome.4 CAR expression in retroviral and transposon-based products therefore can be affected by both the copy number and various chromatin contexts of each vector integrant across the various cells in a product. In contrast, our strategy inserts the CAR at a single site (TRAC) at a copy number of 1 or 2, where the CAR transgene is driven by the endogenous TRAC promoter. Our virus-free editing strategy can accommodate third-generation CAR sequences requiring the use of 3–4 kb nucleic acid templates. Transgene knockin with templates greater than 2 kb has historically been challenging, although a recent report demonstrated efficient knockin of 2–3.6 kb templates.19
There is a paucity of knowledge regarding the signaling effects of CAR expression in T cell products.44 We show evidence of decreased receptor signaling in the VFC-CAR T cell product at the level of the secretome and CD3ζphosphorylation. Our results indicate that, in addition to altering the design of the CAR itself, the locus of insertion and the absence of TCR expression can affect tonic signaling from both receptors. Reduced CAR and TCR tonic signaling during manufacturing could be important for allogeneic workflows involving stem cell sources (eg, induced pluripotent stem cells,45–47 hematopoietic stem cells,48 umbilical cord blood49), where developmental signaling for proper specification toward effector cell types may be disrupted by receptor signaling during differentiation. We show evidence of heterogeneity in differentiation state at the protein and transcriptomic levels, which may in part be influenced by changes in CAR and TCR signaling throughout manufacture. Our large-scale scRNA-seq dataset profiling CAR T cells with varied receptor signaling profiles, both with and without antigen exposure and across multiple donors in this study, could be a useful resource for analyzing the effects of CAR transgenes within human immune cell products. This scRNA-seq dataset is the first such resource profiling CRISPR-generated TRAC-edited CAR T cell products, to our knowledge.
We noted alterations in phenotype in VFC-CAR T cells that could have clinical implications. Cytokine production is lower in VFC-CAR T cells prior to antigen exposure, but equivalent to or higher than RV-CAR T cells post-antigen exposure, suggesting a higher dynamic range of antigen-driven activity. VFC-CAR T cells also demonstrate increased expression of some memory-associated proteins, including CD62L and CD45RO, and decreased expression of the exhaustion markers PD-1 and CD39, relative to RV-CAR T cells. Memory formation is directly correlated with improved rates of durable remission with CD19 CAR T cells for hematologic malignancies; therefore, it may be a relevant quality attribute in this context.12 50 Prior work with hematopoietic stem/progenitor cells indicated that the AAV template itself can elicit both immune and stress responses, along with transcriptional downregulation of cell cycle processes that could interfere with stem cell maintenance.51 Switchable anti-CD19 CARs have demonstrated increased CD62L+ memory formation upon turning off CAR signaling, indicating that prolonged or tonic CAR signaling can interfere with memory formation.52 These studies are consistent with prior work where overstimulation of TCR signaling and CD28 costimulatory signaling can affect unmodified T cell differentiation, as memory responses in vivo with unmodified T cells are formed through acute, high-load antigen stimulation followed by a ‘rest’ phase.53 Future studies may also reveal additional mechanistic connections between these observations.
After injection into a GD2-positive human neuroblastoma xenograft model, VFC-CAR T cells induce strong regression of solid tumors compared with mock-edited T cells, and at levels comparable to RV-CAR T cells. The TCR knockout by our editing strategy is functionally validated in this second study, as xenogeneic GVHD was significantly delayed or eliminated altogether for the mice treated VFC-CAR and VFC-Ctrl products. We note that in vitro, cytotoxic activity was more efficient in RV-CAR T cells, but in vivo, this advantage did not persist, and immunophenotypes indicated that VFC-CAR T cells were on average less differentiated and exhausted than RV-CAR T cells. GVHD appears to have played a role in driving exhaustion in RV-CAR products; however, it did not appear that this confounding factor affected expression of memory markers such as CD62L that are upregulated in VFC-CAR products. While further study is needed, we observe that rapid in vitro cytotoxic activity is not necessarily the best indicator of long-term in vivo performance, and that other quality attributes such as basal cytokine secretion and receptor signaling may have predictive value.
We note several limitations with our study. First, we were able to study only one CAR construct, which makes it difficult to generalize our findings broadly across GD2 CAR designs. Different CARs may have varied levels of basal tonic signaling that could drive a product toward terminal differentiation at different rates; therefore, the impacts of TRAC-mediated CAR expression may vary across constructs. Second, further work is needed to fully assess the safety of CRISPR-Cas9 editing, in particular the potential for aneuploidy and chromosomal translocations.54 We detected little to no cutting at top off-target sites, and we expect translocations to be rare within the product (<1%) with our single-guide strategy. Still, this risk will require additional monitoring when translated to clinical manufacturing procedures.55 Such concerns would be especially relevant for any multiplexed editing design (e.g., VFC-CAR with simultaneous PD-1 knockout). Finally, additional work to track changes to phenotype over the course of manufacture, and at various time points in vivo, could further elucidate the nuances of cytotoxicity dynamics in RV-CAR products, TRAC-CAR products, and VFC-CAR products targeting other genomic insertion sites. We focused on the snapshot of T cell phenotypes observed at harvest, which were transitional and did not easily map to canonical T cell subtypes. While extended characterization across many time points is beyond the scope of this study, future work will seek to clarify how and when these T cell phenotypes change during manufacture and at more granular temporal resolution in vivo.
Relative to current practices, a virus-free manufacturing process could have advantages at clinical scale. First, it could reduce supply chain challenges associated with vector production.56 57 Second, it could alleviate a number of regulatory considerations related to the need for monitoring replication competency of the vector.58 Third, it could eliminate the semirandom integration of viral elements into the human genome, which can generate a high degree of gene perturbation, up to 104–105 different insertional sites within a single product.3 Integration of the vector risks insertional oncogenesis,59 transgene silencing or overexpression, and adverse immune response to the vector, adding to regulatory concerns.5 While off-target analysis of genome editors is necessary for any clinical translation of our approach, there are now many experimental and computational tools that can readily be used for this purpose24 60 and next-generation high-fidelity Cas9 enzymes61 could be used to further decrease the potential for any off-target effects. Overall, a virus-free genome editing workflow has potential to enable the rapid and flexible manufacture of precisely engineered CAR T cell products for the treatment of solid tumors.
Supplemental material
Supplemental material
Data availability statement
Data are available on reasonable request.
Ethics statements
Patient consent for publication
Ethics approval
This study involves human participants and was approved by Institutional Review Board at the University of Wisconsin-Madison, #2018-0103. All animal experiments were approved by the University of Wisconsin-Madison Animal Care and Use Committee (ACUC) under protocol #M005915. Participants gave informed consent to participate in the study before taking part.
Acknowledgments
We thank members of the Saha and Capitini labs and John Taylor Hosmer-Quint for helpful discussion and comments on the manuscript, the University of Wisconsin (UW) Carbone Cancer Center Flow Cytometry Laboratory for assistance with flow cytometry experiments (NIH S10 OD025225-01 funding the Cytek Aurora Spectral Cytometer), and Aldevron for technical support with Cas9 proteins. We thank Tyler Duellman and the University of Wisconsin-Madison Biotechnology Center Gene Expression Center the DNA Sequencing Facility for providing single nuclei library preparation and next generation sequencing services. We thank Malcolm Brenner (Baylor College of Medicine) for sharing the RV-CAR plasmid, Paul Sondel and the National Cancer Institute for 1A7 anti-14G2a antibody for detection of CAR expression, James Thomson and Jue Zhang (Morgridge Institute for Research) for the AkaLUC-GFP CHLA20 cancer line used for in vivo studies, and Sushmita Roy, Sunnie Grace McCalla, and Kurt Mueller for helpful discussions and assistance with scRNA-seq analysis. We thank Hyatt Balke Want, Crystal Mackall, and Steven Feldman at Stanford for sharing viruses, DNA templates and technical advice. We thank Adam Steinberg and Art for Science for help with figure preparation.
References
Supplementary materials
Supplementary Data
This web only file has been produced by the BMJ Publishing Group from an electronic file supplied by the author(s) and has not been edited for content.
Footnotes
Twitter @CapitiniMD, @sahakris
Contributors These authors contributed equally: KPM and NJP. KPM and LAS designed and cloned the VFC-CAR and VFC-Ctrl plasmids. KPM developed the two-step purification procedure for HDR templates, and LS and DC further optimized the procedure. KPM and NJP optimized electroporation protocols. KPM, NJP, and DC isolated and cultured T cells and performed virus-free transfections. KPM, AD, NK and AR generated viruses. KPM and AD performed viral transductions. LS and NLVD assisted with cell culture. KPM and BR performed and analyzed scRNA-seq experiments. KPM, MS, MHF, LAS, DC and AD performed flow cytometry. NJP, BR, and NK performed and analyzed NGS experiments. NJP and MHF performed cytokine experiments and NJP analyzed cytokine data. MHF conducted in vivo experiments. KPM, KSh, and LS planned and performed western blotting experiments. KPM, NJP, AA and MHF performed in vitro co-cultures. CRL performed the CHANGE-seq assay. KPM and NJP wrote the manuscript with input from all authors. SQT, KSa and CMC supervised the research. KPM, NJP, MHF, LAS, MS, DC, LS, CRL, NK, AD, AA and BR performed experiments and analyzed the data. KS is guarantor of the study and accepts full responsibility for the work and publication.
Funding Support for this research was provided by the University of Wisconsin-Madison Office of the Vice Chancellor for Research and Graduate Education with funding from the Wisconsin Alumni Research Foundation (CMC and KSa), the National Science Foundation (NSF) CBET-1645123 (CMC and KSa), EEC-1648035 (KSa), AWD-101645-G3/RJ375-G3 (KSa), and NSF Graduate Research Fellowship Program DGE-1747503, to KPM and NJP); National Cancer Institute R01 CA215461 (CMC), National Institute of General Medical Sciences (NIGMS) R35 GM119644-01 (KSa), NIGMS T32 GM008349 (KPM), National Institute of Allergy and Infectious Diseases (NIAID) U01AI57189 (SQT); UW Carbone Cancer Center Support Grant P30 CA014520 Cell Based Immunotherapy Supplement (CMC and KSa); St. Baldrick’s Stand Up to Cancer Pediatric Dream Team Translational Research Grant SU2C-AACR-DT-27-17 (CMC); American Cancer Society Research Scholar grant RSG-18-104-01-LIB (CMC); and the MACC Fund (CMC). Stand Up to Cancer is a division of the Entertainment Industry Foundation. Research grants are administered by the American Association for Cancer Research, the Scientific Partner of SU2C. The contents of this article do not necessarily reflect the views or policies of the Department of Health and Human Services, nor does mention of trade names, commercial products, or organizations imply endorsement by the US Government.
Competing interests KPM, NJP, MHF, LAS, AD, CMC and KSa are inventors on a patent application related to this manuscript. CMC receives honoraria for advisory board membership for Bayer, Elephas Bioscience, Nektar Therapeutics and Novartis. No other conflicts of interest are reported.
Provenance and peer review Not commissioned; externally peer reviewed.
Supplemental material This content has been supplied by the author(s). It has not been vetted by BMJ Publishing Group Limited (BMJ) and may not have been peer-reviewed. Any opinions or recommendations discussed are solely those of the author(s) and are not endorsed by BMJ. BMJ disclaims all liability and responsibility arising from any reliance placed on the content. Where the content includes any translated material, BMJ does not warrant the accuracy and reliability of the translations (including but not limited to local regulations, clinical guidelines, terminology, drug names and drug dosages), and is not responsible for any error and/or omissions arising from translation and adaptation or otherwise.