Article Text

Abstract
Background Regulatory T cells (Treg) are an integral part of the tumor immune tolerance. Carcinoma-associated fibroblasts (CAFs) is a pivotal driver for accumulation of Treg cells in the tumor microenvironment (TME). The molecular nature underpinning Treg cells and CAFs coupling needs to be further defined.
Methods The Il1r2flox/floxFoxp3Cre mice were generated to establish the conditional knock-out of Il1r2 in Foxp3+ Tregs in vivo. Using the MC38 tumor model, we evaluated the antitumor efficacy of immune checkpoint inhibitors (ICIs) and further analyzed the immune profiling of the TME by multicolor flow cytometry. Single-cell RNA sequencing of the whole tumor tissues, TCR repertoire analysis of sorted CD3+ TILs were also performed.
Results We showed that IL1 receptor 2 (IL1R2), a decoy receptor that neutralizes IL1, was highly expressed in Treg cells in the TME. In addition, we found that Il1r1 was largely expressed in the CAFs, suggesting IL1R2 plays a role in modulating crosstalk between Tregs and CAFs. We further demonstrated that Il1r2 deficiency in Treg cells led to greater antitumor efficacy of ICI, decreased Tregs and increased CD8+ T cells in the TME, as well as reduced levels of T cell dysfunction. Mechanistically, we showed that IL1 inhibited major histocompatibility complex class II (MHC-II) expression on fibroblasts and Treg-specific Il1r2 deletion led to a decrease in genes associated with MHC-II antigen presentation in CAFs.
Conclusions Our study established a critical role of IL1 signaling in inhibiting Treg-mediated tumor immune suppression through downregulating MHC-II antigen presentation in CAFs.
- immunity
- tumor microenvironment
Data availability statement
Data are available on reasonable request.
This is an open access article distributed in accordance with the Creative Commons Attribution Non Commercial (CC BY-NC 4.0) license, which permits others to distribute, remix, adapt, build upon this work non-commercially, and license their derivative works on different terms, provided the original work is properly cited, appropriate credit is given, any changes made indicated, and the use is non-commercial. See http://creativecommons.org/licenses/by-nc/4.0/.
Statistics from Altmetric.com
What is already known on this topic
Regulatory T cells (Tregs) and carcinoma-associated fibroblasts (CAFs) are major players of the tumor immune tolerance.
Treg cells and CAFs are known to interact and influence each other’s differentiation in the tumor microenvironment (TME).
IL1 signaling is involved in tumor progression.
IL1 receptor 2 is upregulated in Treg cells in the TME.
What this study adds
IL-1 signaling on CAFs is inhibited by Treg cell-expressed IL1R2.
IL-1 inhibits IFN-gamma-induced MHC-II expression on fibroblasts.
Treg cell-expressed IL1R2 strengthens crosstalk between Treg cells and CAFs through upregulating MHC-II on CAFs.
Treg cell-expressed IL1R2 promotes immune suppression in the TME during immune checkpoint inhibitor (ICI) treatment.
How this study might affect research, practice or policy
Blockade of IL1R2 function of Treg cells is a novel immunotherapy that can be used in combination with ICI cancer therapy to further increase the antitumor efficacy.
Introduction
CD4+ regulatory T cells (Tregs) are an essential part of immune tolerance and play a key role in preventing immune pathology and autoimmunity, promoting tissue repair, and orchestrating tumor immune suppression.1–3 Treg cell development in the thymus requires three major signals, namely self-peptide-MHC class II (self-pMHC-II), costimulatory signals such as B7.1 and B7.2, and cytokines such as IL-2 and IL-7.2 Mature naïve Treg cells emigrate from the thymus to secondary lymphoid tissues, where they can be activated and then migrate to normal and inflamed tissues to become tissue resident or effector Treg cells.3 Tissue resident and effector Treg cells have much constrained TCR repertoire, likely shaped by TCR interaction with specific self-pMHC-II.4–7 Additionally, tissue accumulation of Treg cells is promoted by growth and survival factors such as IL-33 and IL-2.3 Tumor tissues are also infiltrated with effector Treg cells that express unique surface markers and transcriptomes.8–13 Tissue-specific self-antigens are likely involved in pulling Treg cells to tumors and tumor draining lymph nodes (TDLNs).1 The nature and cellular origins of self-antigens and key Treg-regulating signals in tumor microenvironment (TME) remain to be defined.
Carcinoma-associated fibroblasts (CAFs) play a multifaceted role in malignancy progression. The protumor role of CAFs is bolstered by ample evidence that demonstrate that CAFs promote cancer cell growth in culture and facilitate tumor formation in transplant tumor models in vivo.14–17 However, depletion of myofibroblasts promotes tumor progression.18–20 It has now been appreciated that CAFs are highly heterogenous, indicating different CAF subsets have diverse functions during tumorigenesis.21–23 Besides directly interacting with cancerous cells, CAFs can also inhibit antitumor immune responses by recruiting and maintaining the function of Treg cells in tumor tissues.21 Such functions are mediated by a range of immune regulatory molecules such as PD-L2, B7-H3, CD73, and chemokines.21 In addition, a fraction of CAFs also express MHC-II and are able to engage and potentially inhibit CD4+ T cells.24 Whether CAF-presented antigen peptides can stimulate and maintain tumor-infiltrating Treg cells remains to be elucidated.
Interleukin 1 (IL1) is a potent inflammatory cytokine, and its function is tightly regulated.25 IL1 receptor 2 (IL1R2) binds to IL1 and inhibits its interaction with the activating IL1 receptor 1 (IL1R1). Therefore, IL1R2 is thought to be a decoy receptor that neutralizes the proinflammatory function of IL1.26–29 It has been shown that IL1R2 is uniquely expressed on the cell membrane of in vitro activated human Treg cells but not on effector CD4+ conventional T cells (Tconv), suggesting a role of IL1R2 in effector Treg cell function.30 31 In addition, IL1R2 is highly expressed in tumor-infiltrating Treg cells in human breast cancer, colorectal cancer, and lung cancer.32–34 The exact function of IL1R2 on Treg cells is not well defined.
In this study, we showed that IL1R2 was highly and specifically expressed in tumor-infiltrating Treg cells in multiple human cancers and mouse tumor models. We then aimed to determine the role of Treg-expressed IL1R2 in antitumor immunity and immune checkpoint inhibitor (ICI) tumor immunotherapy using Treg-specific Il1r2 deficient mice (Il1r2fl/flFoxp3Cre). The scRNA-seq analysis of whole tumors also revealed that CAFs were the predominant cell type that expressed IL1R1 in the TME, suggesting a main function of Treg-expressed IL1R2 is to inhibit IL-1 signaling in CAFs. This led us to further investigate how IL-1 regulates crosstalk between Treg cells and CAFs in the TME and the implication on antitumor immune responses.
Materials and methods
Animals
Foxp3YFP-Cre mice were provided by Professor Bin Li from Center for Immune-Related Diseases at Shanghai Institute of Immunology, Shanghai Jiao Tong University School of Medicine, Shanghai, China. The Il1r2flox/flox mice were generated by Cambridge-Suzhou University Genome Research Center (CAM-SU GRC, Jiangsu Suzhou, China). All mice are on the C57BL/6J background. The Il1r2fl/flFoxp3Cre mice were generated by crossing Il1r2flox/flox mice with Foxp3Cre mice, and then the genotyping and the phenotype identification by FACS were performed to confirm the conditional knock-out of Il1r2 in Foxp3+ Tregs. Both male and female mice were used for this study. Animals were assigned to experimental groups using simple randomization. All the mice were housed in the specific pathogen-free facility in the Cavens Lab Animal Corporation Ltd. (Jiangsu Changzhou, China).
Cell lines, cell culture, and the primary fibroblast preparation
The primary mouse fibroblasts were prepared according to the protocol as reported,35 and in the cytokine stimulation experiment, IFN-γ (10 ng/mL, Catlog: 315-05-100, Peprotech) and IL-1β (1 ng/mL, Catlog: 211-11B-10, Peprotech) were used in the treatment of primary murine fibroblasts or NIH 3T3 cells. The cell lines were cultured in RPMI-1640 (B16, CT26, 3T3 and also the primary fibroblasts) or DMEM (MC38) medium supplemented with 10% FBS in the presence of benzylpenicillin (100 U/mL), streptomycin (100 µg/mL), and 2 mM L-glutamine.
Tumor models
Six to eight weeks and sex-matched Il1r2fl/flFoxp3Cre and Foxp3Cre mice were used in the tumor models. The protocol of MC38 subcutaneous tumor model was established as reported in our previous study.36–38 In brief, after MC38 cells (2×10⁶/150μL) inoculation and tumor formation, αPD-1 (J43, BP0033-2, BioXcell), αCTLA-4 (9D9, BP0164, BioXcell), Hamster IgG (BE0091, BioXcell) and mouse IgG2b (BE0086, BioXcell) were administrated at 200μg, respectively, on days 5, 9, 13, and 17, the tumor sizes were monitored, and the tumor growth curve and the survival curve were charted. The B16-GVAX tumor model was also established.39 In brief, B16 cells (2×10⁵/50μL) was inoculated in the right flank, and meanwhile the B16-GM-CSF cells (2×10⁵/50μL) was inoculated on the contralateral flank after lethal irradiation leading to release GM-CSF as tumor vaccine. Then the mice challenged with αPD-1 treatment at days 5, 9, 13, and 17, the tumor growth curve and the overall survival were observed and charted.
Whole tumor tissues 5’ library single-cell RNA sequencing
The MC38 tumor model was established in Il1r2fl/flFoxp3Cre and Foxp3Cre mice challenging with αPD-1 treatment at 200μg on days 5 and 9. Then, on day 10, the whole tumor tissues were collected and submitted to single-cell RNA sequencing (scRNA-seq). Based on the 5′ Library and Gel Bead Kit (10× Genomics, 1000006), and Chromium Single Cell A Chip Kit (10× Genomics, 120236), the cell suspension (300–600 living cells per microliter determined by Count Star) was loaded onto the Chromium single cell controller (10× Genomics) to generate single-cell gel beads in the emulsion according to the manufacturer’s protocol. In short, single cells were suspended in PBS containing 0.04% BSA. About 20,000 cells were added to each channel, and the target cell will be recovered was estimated to be about 10,000 cells. Captured cells were lysed, and the released RNA was barcoded through reverse transcription in individual gel beads in emulsion (GEMs). Reverse transcription was performed on a S1000 Touch Thermal Cycler (Bio Rad) at 53°C for 45 min, followed by 85°C for 5 min, and hold at 4°C. The cDNA was generated and then amplified and quality assessed using an Agilent 4200 (performed by CapitalBio Technology, Beijing).
Tumor tissue processing and tumor-infiltrating lymphocytes (TILs) preparation
TILs were harvested from freshly resected tumor tissues according to the method we have previously described.36 38 40 In brief, the tumor tissues were dissected and transferred into RPMI-1640 culture medium. Tumor tissues were then mechanically disrupted and digested with a mixture of 0.3 mg/mL DNase I (Sigma-Aldrich) and 0.25 mg/mL Liberase TL (Roche) in the serum-free RPMI medium in a CO2 culture incubator at 37°C for 30 min. The tissues were then dispersed through a 40μm cell strainer (BD Biosciences) to remove tissue clumps. The single cells were washed and suspended in Hank’s balanced salt solution (HBSS) with 1% FBS for staining and multicolor flow cytometry analysis.
Flow analysis of TILs
Flow cytometry analysis was performed using a FACS flow cytometer Celesta (BD Biosciences). The antihuman antibodies, including CD45 (Clone HI30, BioLegend, Cat# 982316), CD3 (Clone OKT3, BioLegend, Cat#317318), CD4 (Clone OKT4, BD Biosciences, Cat#566804), CD8 (Clone RPA-T8, BD Biosciences, Cat#565165), and IL1R2 (Clone MNC2, BD Biosciences, Cat#552401), and the antimouse antibodies including CD45 (Clone 30-F11, BioLegend, Cat#103134), CD3 (Clone 17A2, BioLegend, Cat#100204), TCRβ (Clone H57-597, BioLegend, Cat#109205), CD4 (Clone GK1.5, BioLegend, Cat#100414), CD8 (Clone 53–6.7, BD Biosciences, Cat#563068), FoxP3 (Clone MF-14, BioLegend, Cat#126419), PD-1 (Clone 29F.1A12, BioLegend, Cat#135224), CD366 (Clone 5D12, BD Biosciences, Cat#566346), CD121a (Clone 35F5, BD Biosciences, Cat#563629), CD121b (Clone 4E2, BD Biosciences, Cat#554450), CD31 (Clone MEC13.3, BioLegend, Cat#102507), CD140b (Clone APB5, BioLegend, Cat#136008), and I-A/I-E (M5/114.15.2, BioLegend, Cat#107614) were used in the present multicolor staining. The intracellular transcription factors and cytokines staining, cells were stimulated with leukocyte activation cocktail (Catalog: 423304, BioLegend) for 6 hours and then followed the standard staining protocol described in our previous report.38
Cell sorting and gating strategy
The CD3+ TILs from Il1r2fl/flFoxp3Cre or Foxp3Cre mice bearing MC38 tumors after twice treatments of αPD-1 monoclonal antibodies (mAbs) were collected by using a BD Aria II flow cytometer, and then the sorted CD3+ TILs from both groups were submitted to 5′-scRNA-seq and TCR repertoire sequencing (10× Genomics). In brief, first, the single-cell suspension was prepared in HBSS with 1% FCS according the protocol we have described previously, and then incubated with antimouse CD45 (TIL) MicroBeads (Cat#130-110-618, Miltenyi Biotec) to enrich and purify the CD45+ TILs. Second, the purified CD45+ TILs were stained with Ghost Dye Violet 510 Viability Dye (Cell Signaling Technology), and then stained with anti-CD45-PE-cy7 (Clone 30-F11, BD Biosciences, Cat#561868), anti-B220-PerCP-cy5.5 (Clone RA3-6B2, BD Biosciences, Cat#552771), and TCRβ (Clone H57-597, BioLegend, Cat#109205), and finally the CD45+B220−CD3+TCRβ+ TILs were gated, sorted, washed, and submitted for sequencing.
TCR repertoire analysis
The sorted CD45+B220−CD3+TCRβ+ TILs from MC38 tumor bearing Il1r2fl/flFoxp3Cre or Foxp3Cre mice were purified and submitted to scRNA-seq and TCR repertoire analysis. In brief, according to the manufacture’s introduction, scRNA-seq libraries were constructed using Single Cell 5′ Library and Gel Bead Kit, Single Cell V(D)J Enrichment Kit, Mouse T Cell (1000005) and Single Cell V(D)J Enrichment Kit. The libraries were finally sequenced by using an Illumina Novaseq6000 sequencer with a sequencing depth of at least 100,000 reads per cell with pair-end 150 bp (PE150) reading strategy (performed by CapitalBio Technology, Beijing).
Single-cell RNA-seq (scRNA-seq) data analysis and different expression gene analysis
Our scRNA-seq data were processed by the methods as we previously described.41 Briefly, cells with less than 6000 unique molecular identifiers (UMIs) count, 10% mitochondrial gene count, and 40% ribosomal gene count were used for integration of multiple scRNA-seq, dimension reduction and unsupervised clustering. All visualization plots were applied by Seurat function and ggplot2 package. Then, the different expression gene analysis was performed, and Dotplot function packaged in Seurat was used to visualize the selected different expression genes.
Gene set enrichment analysis
GSEA software (V.4.1.0) was used for gene set enrichment analysis. The gene sets we used were exported using MSigDB gene sets. Single sample gene set enrichment analysis implemented in the GSVA package (V.1.34.0) was used for gene set enrichment analysis. The gene sets we used were exported using the MSigDB gene sets. The differences in pathway activities scored per cell between clusters were calculated with wilcox.test.
SCENIC (Single Cell rEgulatory Network Inference and Clustering) analysis
Activated regulons in each subset were analyzed using SCENIC with raw count matrix as input. Briefly, the coexpression network was calculated by GENIE3, and the regulons were identified by RcisTarget. Next, the regulon activity for each cell was scored by AUCell. The differentially activated regulons in each subset were identified by wilcox.test.
Statistical analyses
Statistical analysis was done using the paired Student’s t-test, two-way analysis of variance, or the log-rank survival analysis. A p value of <0.05 was considered to be statistically significant.
Results
IL1R2 is preferentially expressed on regulatory T cells in the TME
In order to characterize the expression profile of IL1R2 within tumor-infiltrating T cells (TIL) in human cancer, we analyzed the integrated scRNA-seq datasets from colorectal cancer, hepatocellular cell carcinoma, and non-small-cell lung cancer patients (figure 1A)34 42 43 as well as mouse tumors.44 We observed that, among TIL, IL1R2 was predominantly expressed on Treg cells in both human (figure 1A,B) and mouse tumor tissues (online supplemental figure 1A). We then performed flow cytometry analysis on TILs from multiple mouse tumor models. Our analysis confirmed that IL1R2 was mainly expressed in Tregs, and the percentage of IL1R2+ Tregs in the tumor was significantly higher than that in spleens and in TDLNs (figure 1C,D; online supplemental figure 1B–E). In all, these data established that IL1R2 is upregulated in the Treg cells in the TME, suggesting a role in tumor immune responses.
Supplemental material
Supplemental material
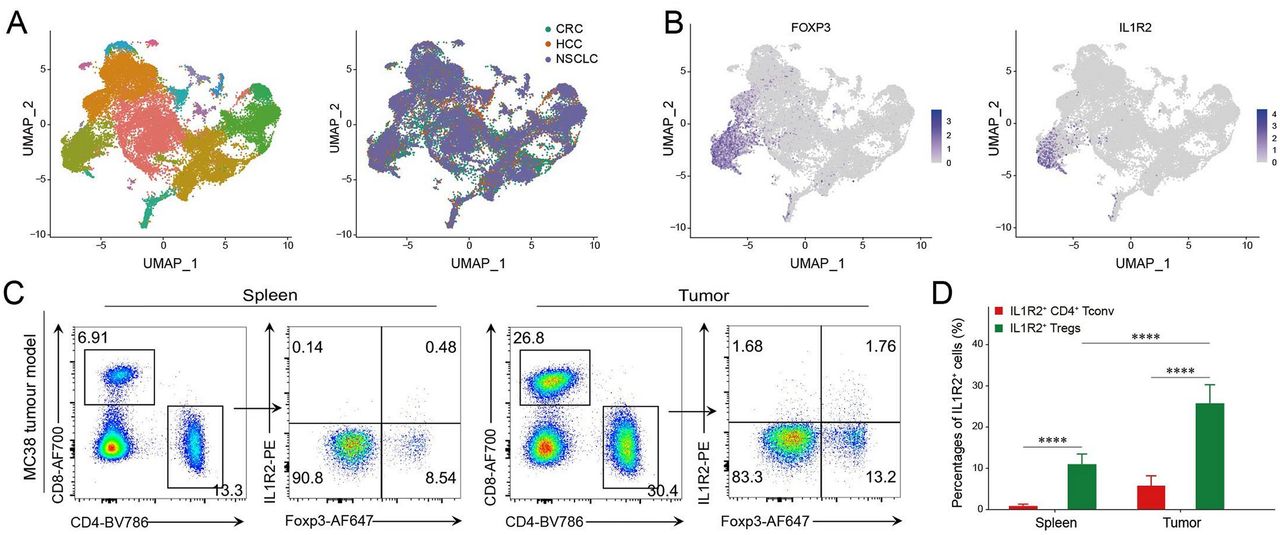
IL1R2 is preferentially expressed on regulatory T cells. (A) IL1R2 expression on Tregs in the TME. Analysis of integrated published scRNA-seq dataset showed different populations of infiltrating immune cells from human CRC tissues (GSE108989), HCC tissues (GSE98638), and NSCLC tissues (GSE99254), respectively. (B) UMAP analysis showing specific expression of Il1r2 on tumor-infiltrating Foxp3+ Tregs. (C and D) MC38 tumor model was established (2×10⁶ cells inoculatedintradermally (i.d.) into the right flank) in wide type C57BL/6 mice (n=8) for 2 weeks, then the spleens and tumors were collected to examine the IL1R2 expression on Tregs. *P<0.05, **p<0.01, ***p<0.001, and ****p<0.0001 by Student’s t-test. CRC, colorectal cancer; HCC, hepatocellular cell carcinoma; IL1R2, IL1 receptor 2; NSCLC, non-small cell lung cancer; scRNA-seq, single-cell RNA-seq; TME, tumor microenvironment; Tregs, regulatory T cells;
IL1R2 deficiency in Treg cells led to an increase in the efficacy of ICI tumor therapy
In order to study the role of Treg-expressed IL1R2 during antitumor immune responses, we generated Treg-specific Il1r2 deficient (Il1r2fl/flFoxp3Cre) mice (online supplemental figure 2A and B). The histological analysis did not reveal any obvious pathological changes in 6 -week-old and 20-week-old Il1r2fl/flFoxp3Cre mice (data not shown). We then determined the efficacy of ICI using MC38, a mouse colon tumor model, in both Foxp3Cre and Il1r2fl/flFoxp3Cre mice. The MC38 tumors grew at similar rates when treated with control IgG in both strains. As expected, on administration of αPD-1 mAbs, tumor growth was significantly slower and survival was longer compared with control IgG-treated groups for both Foxp3Cre and Il1r2fl/flFoxp3Cre mice (figure 2A,B). Importantly, on αPD-1 mAbs treatment, tumor growth in Il1r2fl/flFoxp3Cre mice was significantly slower than that in Foxp3Cre mice (figure 2A). In addition, in the αPD-1 mAbs treatment groups, the survival rate of the tumor-bearing Il1r2fl/flFoxp3Cre mice was significantly longer than that of Foxp3Cre mice (figure 2B). Moreover, both male and female mice were, respectively, used in the present treatment of MC38 tumor model, and the consistent results confirmed our finding (figure 2A,B, online supplemental figures 3A and 3B).
Supplemental material
Supplemental material

Treg-specific deletion of Il1r2 led to increased antitumor efficacy of ICI therapy. (A and C) MC38 cells (2×10⁶) were inoculated i.d. into the right flank of Foxp3Cre and Il1r2fl/flFoxp3Cre male mice. αPD-1 (A) or αCTLA-4 (C) mAbs, and IgG controls were used in the treatment on day 5 after tumor inoculation and again every 4 days for four times. Tumor sizes were monitored every 2 days. (B and D) The overall survival of different groups was monitored in two-group mice challenging with αPD-1 or αCTLA-4 mAbs and control IgG, respectively. (A and B: n=8 in each subgroup. C and D: n=6 in each subgroup). (E) Another experiment was set up using female mice (6 weeks old, n=10), and after three times of αPD-1 or IgG treatment, the tumor tissues were collected, and the TILs were analyzed by using FACS. The representative flow cytometry plots showed the percentages of CD4+ TILs, CD8+ TILs and Tregs in different group mice. (F) Statistical analysis of the percentages of total CD45+ TILs, CD4+ TILs in total CD45+ TILs, CD8+ TILs in total CD45+ TILs, Treg in CD4+ TILs in different group mice. Data represent at least three independent experiments. *P<0.05, **p<0.01, ***p<0.001 and ****p<0.0001 by Student’s t-test, two-way analysis of variance, or log-rank survival analysis. ICI, immune checkpoint inhibitor; TILs, tumor-infiltrating lymphocytes; Treg, regulatory T cell.
Online supplemental figures 3A and 2B). We then examined whether Il1r2 deletion in Treg cells affected the efficacy of CTLA-4-blockade therapy in the same tumor model. We found that administration of αCTLA-4 mAbs could significantly inhibit the tumor growth and extend the life span of tumor-bearing Il1r2fl/flFoxp3Cre mice compared with Foxp3Cre mice (figure 2C,D). To further substantiate the effect of Treg-specific Il1r2 deletion on tumor immunotherapy, we studied a tumor vaccine plus PD-1 blockade model, and we showed that, on treatment, growth of B16 tumors was significantly slower, and survival was much longer in Il1r2fl/flFoxp3Cre mice than those in Foxp3Cre mice (online supplemental figure 2C,D). However, once in the absence of tumor vaccine, the growth of B16 tumors could not effectively be suppressed (online supplemental figure 2E). Collectively, these data demonstrate that IL1R2 plays an important role in Treg cells to dampen antitumor immune responses.
Increased CD8+ T cells and decreased Treg cells in the TME of Il1r2fl/flFoxp3Cre mice
In order to understand the mechanism underpinning the immune regulatory effect of Treg-expressed IL1R2, we performed flow cytometric analysis of TILs. We found no difference in the percentage of CD45+ immune cells, CD8+ T cells, or Treg cells in the tumor from control IgG groups in both Il1r2fl/flFoxp3Cre and control Foxp3Cre mice (figure 2E,F, online supplemental figure 3C–F). In the αPD-1 mAbs treatment groups, we found that the percentages of CD45+ cells and CD8+ T cells were increased in Il1r2fl/flFoxp3Cre mice when compared with Foxp3Cre mice (figure 2E,F, online supplemental figure 3C–E), and we found that the percentages of LAG3+ exhausted CD8+ TILs were significantly decreased in Il1r2fl/flFoxp3Cre mice (online supplemental figure 2E). TIM-3+ and TIM3+LAG3+CD8+ TILs also trended toward a decrease in Il1r2fl/flFoxp3Cre mice (online supplemental figure 2E). In contrast, the frequency of Treg cells was decreased in Il1r2fl/flFoxp3Cre mice when compared with Foxp3Cre mice (figure 2E,F, online supplemental figure 3C,F). These data suggest that Treg-expressed IL1R2 is important for maintaining Treg cells in the TME.
Treg cell-expressed IL1R2 inhibited IL-1/IL1R1 signaling and thereby enhanced MHC-II expression on CAFs
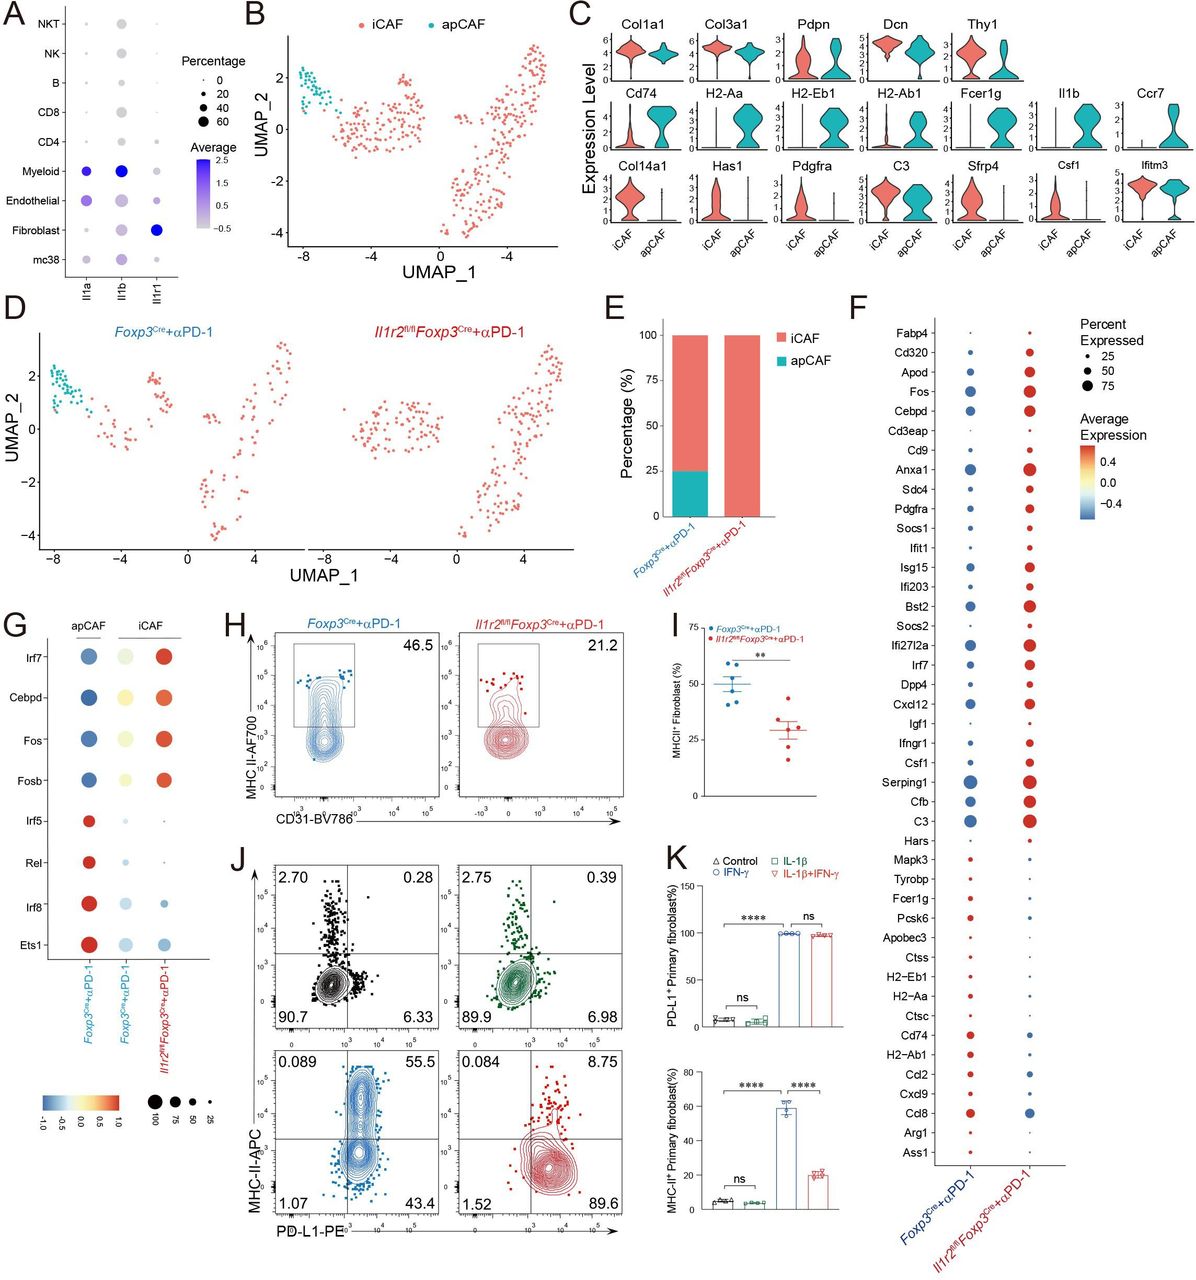
Since the major function of IL1R2 is to block IL1R signaling, we tried to identify Il1r1+ cells in the TME by analyzing whole tumor scRNA-seq data obtained from MC38 tumors that had been treated with αPD-1 mAbs. Interestingly, Il1r1 was expressed predominantly on a majority of CAFs and some endothelial cells (ECs) in the TME (figure 3A). Consistent with this finding, we also found that Il1r1 was predominately localized on the CAFs and ECs in B16 tumor tissues on analysis of another independent scRNA-seq dataset (online supplemental figure 4A,B; ArrayExpress: E-MTAB-7427, E-MTAB-7417). These data suggest that CAFs might be a major target of IL1R2 in the TME. We then performed scRNA-seq analysis of whole tumors taken from control Foxp3Cre and Il1r2fl/flFoxp3Cre mice, both of which were treated with αPD-1 mAbs. We first examined CAFs and found that, consistent with literature,24 CAFs in MC38 tumors could mainly be subclassified as inflammatory CAF (iCAF) and antigen-presenting CAF (apCAF) (figure 3B). Both CAF subsets expressed typical fibroblast markers gene such as Col1a1, Col3a1, Pdpn, Dcn, and Thy1 (figure 3C top row, online supplemental figure 4C). apCAFs were enriched for MHC-class II genes such as H2-Aa, H2-Ab1 and H2-Eb1, and cytokines such as IL-1β (figure 3C middle row, online supplemental figure 4D). iCAFs expressed higher levels of mesenchymal gene Pdgfra, cytokines such as Csf1, complement genes such as C3, and metabolic transporter genes such as Apod (figure 3C bottom row, online supplemental figure 4E). Comparing CAF subsets between Foxp3Cre and Il1r2fl/flFoxp3Cre mice, we found that apCAFs were absent in Il1r2fl/flFoxp3Cre mice (figure 3D,E). We further studied genes that were differentially expressed in iCAFs from Foxp3Cre and Il1r2fl/flFoxp3Cre mice. Our analysis revealed multiple MHC class II genes were downregulated in iCAFs from Il1r2fl/flFoxp3Cre mice (figure 3F); this is consistent with the absence of apCAFs in these mice suggesting reduced interaction between CAFs with CD4+ Treg cells and CD4+ Tconv cells in the TME of Il1r2fl/flFoxp3Cre mice. In addition, chemokines such as Ccl2, Ccl8 and Cxcl9 and arginine metabolism genes such as Arg1 and Ass1 were also reduced in iCAFs from Il1r2fl/flFoxp3Cre mice. In contrast, complement genes such as Serping1, Cfb, and C3, mesenchymal gene such as Pdgfra, and interferon (IFN)-induced genes were upregulated in iCAFs in Il1r2fl/flFoxp3Cre mice (figure 3F). These data suggest that IL-1β signaling influences the immune characteristics of CAFs. The pathway analysis further substantiated the finding that MHC-II antigen presentation was downregulated in Il1r2fl/flFoxp3Cre mice (online supplemental figure 5A,B). We also analyzed transcription factors that were involved in gene profile changes and found that that Irf5, Rel, Irf8 and Ets1 were predominantly expressed and active in apCAFs and iCAFs from control Foxp3Cre mice, whereas Irf7, Cebpd, Fos, and Fosb were expressed higher, and their transcription factor activities are greater in iCAF from Il1r2fl/flFoxp3Cre mice (figure 3G, online supplemental figure 5C). In addition, we found that Irf5, Irf8, and Rel specifically targeted MHC class II genes in CAFs (online supplemental figure 5D). We further performed multicolor flow cytometric analysis on CAFs and showed that MHC-II was much lower in CAFs from Il1r2fl/flFoxp3Cre mice when compared with those from control Foxp3Cre mice (figure 3H,I). These data suggest that Treg-expressed IL1R2 regulates immune gene expression on CAFs, particularly the MHC class II genes. This is likely through blockade of local IL-1 signaling on CAFs.
Supplemental material
Supplemental material

Treg cell-expressed IL1R2 inhibited IL-1/IL1R1 signaling and thereby enhanced MHC-II expression on CAFs. (A) A dot plot showing Il1α, Il1β, and Il1r1 expression levels and percentages in various cell types was generated after analysis of the whole MC38 tumor scRNA-seq data. (B) UMAP analysis identified iCAF and apCAF subpopulations of CAFs in MC38 tumors. (C) Violin plot showing marker genes for both CAF subsets apCAFs and iCAFs. (D) UMAP analysis of CAFs split in Foxp3Cre and Il1r2fl/flFoxp3Cre mice. (E) Barplot showing percentages of iCAFs and apCAFs within CAFs. (F) Dot plot showing different expression genes (DEGs) in iCAFs from Il1r2fl/flFoxp3Cre and control mice. (G) Dot plot showing area under the curve (AUC) of transcription factors’ regulons in apCAFs and iCAFs from tumors challenged with αPD-1 mAbs in Il1r2fl/flFoxp3Cre and control mice. (H and I) MHC-II expression level on CAFs from Il1r2fl/flFoxp3Cre and control Foxp3Cre mice (n=6). (J and K) Primary fibroblasts were stimulated with IFN-γ and/or IL-1β for 24 hours and the expression of PD-L1 and MHC-II was examined by flow cytometry, data represent at least three independent experiments. **P<0.01 and ****p<0.0001 by Student’s t-test. apCAFs, antigen-presenting CAFs; CAFs, carcinoma-associated fibroblasts; iCAFs, inflammatory CAFs; IL1R2, IL1 receptor 2; Treg, regulatory T cell.
We then performed in vitro assay to further determine whether IL-1 can directly inhibit MHC-II expression on primary fibroblasts. Consistent with literatures,45–47 we found that IFN-γ stimulation could upregulate the expression of both MHC-II and PD-L1 (figure 3J,K). Interestingly, addition of IL-1β to the culture did not affect PD-L1 expression (figure 3J,K). In contrast, IL-1β greatly inhibited the expression of MHC-II (figure 3J,K). Besides primary fibroblasts, we confirmed this finding using NIH 3T3 cells (online supplemental figure 6A–C). In all, these data established that IL-1 can directly inhibit MHC-II expression, supporting a role of Treg-expressed IL1R2 in upregulating MHC-II genes in CAFs.
Supplemental material
IL1R2 deficiency in Treg cells led to reduced clonal expansion and effector features in Tregs
CAFs have been shown to be involved in supporting Treg cells in the TME.21 Since we found that MHC-II gene expression in CAFs was downregulated in Il1r2fl/flFoxp3Cre mice, we surmised that the reduction in MHC-II in CAFs might lead to changes in Tregs in the TME. We then determined the impact of Treg-specific IL1R2 deficiency on tumor-infiltrating Treg cells. The CD3+ TILs from PD-1 mAbs-treated control and Il1r2fl/flFoxp3Cre mice were submitted to 5′-scRNA-seq and TCR repertoire sequencing. Our analysis showed four major Treg populations in the TME. We named them pre-effector Treg (preTreg), effector Treg (eTreg), hyper-effector Treg (hTreg), and interferon-induced Treg (iTreg), according to the marker genes and position in the differentiation trajectory (figure 4A,B, online supplemental figure 7A–C).
Supplemental material

IL1R2 deficiency in Treg cells led to reduced clonal expansion and effector features in TME. MC38 tumors-bearing Il1r2fl/flFoxp3Cre and control Foxp3Cre mice were treated twice with anti αPD-1 mAbs, and then CD3+ TILs were purified by FACS and subjected to scRNAseq. (A) UMAP analysis showing tumor-infiltrating Tregs were classified into preTreg, eTreg, Hyper Treg and iTreg. (B) Heat map showing DEGs in different subpopulations of Tregs. (C) UMAP showing imputed expression of Il1r2 in tumor-infiltrating Tregs as calculated using Rmagic algorithm.59 (D) Barplot showing that average percentages of different subpopulations of tumor-infiltrating Tregs in two groups. (E) Percentages of clonally expanded tumor-infiltrating Tregs in Il1r2fl/flFoxp3Cre and control Foxp3Cre mice. (F) Selected DEGs in different subpopulations of tumor-infiltrating Tregs in two groups. IL1R2, IL1 receptor 2; TILs, tumor-infiltrating lymphocytes; Tregs, regulatory T cells.
IL1R2 was predominantly expressed on eTreg and hTreg cells (figure 4C), and its depletion on Treg cells caused minimal changes of the fraction of these effector Treg cells (figure 4D, online supplemental figure 7D). In contrast, the percentage of clonally expanded Treg cells was reduced in Il1r2fl/flFoxp3Cre mice compared with control Foxp3Cre mice (figure 4E, online supplemental figure 7E). In addition, we found that many genes that are highly expressed in effector and hyper-effector Treg cells, such as Gzmb, IL10, Pdcd1, Havcr2, Tigit and Lag3 were downregulated in Il1r2 deficient Treg cells (figure 4F, online supplemental figure 7F), suggesting IL1R2 is required for the activation and clonal expansion of Treg cells in the TME.
IL1R2 deficiency in Treg cells diminished exhaustion in both CD8+ and conventional CD4+ T cells in the TME
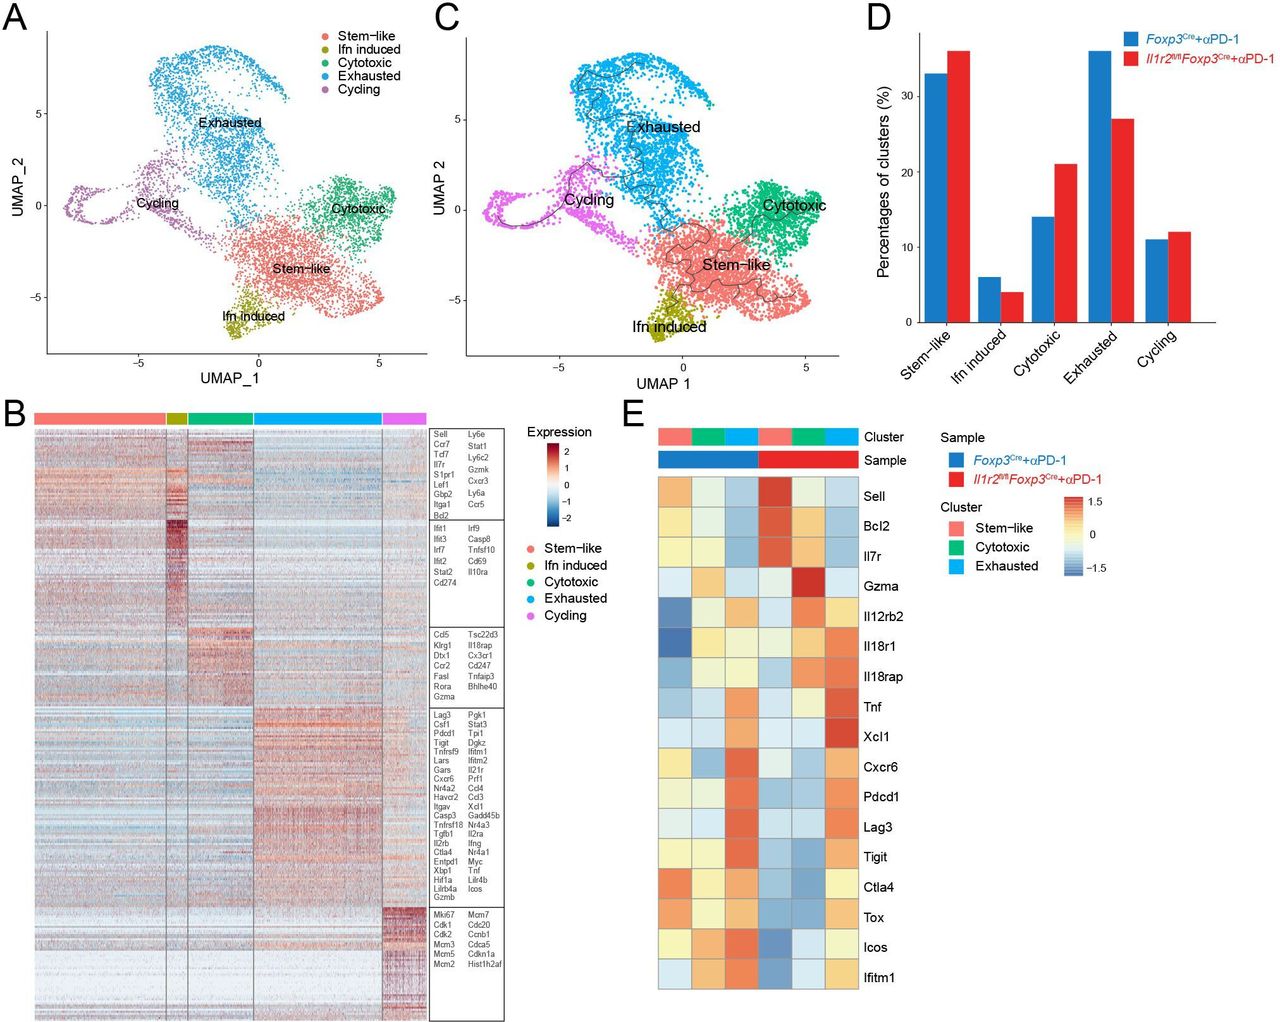
In order to gain further insight into the antitumor T cell-mediated immune responses that are regulated by Treg-expressed IL1R2, we studied conventional T cell subsets by analyzing scRNA-seq data generated using TILs from PD-1 mAbs-treated control and Il1r2fl/flFoxp3Cre mice. We found that the CD8+ TIL could be generally classified into five subpopulations by using the marker genes, including stem-like CD8+ T cells, cytotoxic CD8+ T cells, interferon-induced CD8+ T cells, exhausted CD8+ T cells, and cycling CD8+ T cells (figure 5A–C, online supplemental figure 8A–D). Deletion of Il1r2 resulted in an increase in the frequency of cytotoxic CD8+ T and stem-like CD8+ T cells and a decrease in the frequency of exhausted and interferon-induced CD8+ T cells in the TME (figure 5D). Analysis of DEG showed that ‘naïve/resting’ T cell markers such as Il7r, Sell, and Bcl2 as well as cytotoxic T cell markers such as Gzma, Il12rb2, and Il18rap were upregulated in Il1r2fl/flFoxp3Cre mice. In contrast, consistent with cell population changes, markers of exhausted T cells Pdcd1, Tigit, Lag3, and Tox were downregulated in Il1r2fl/flFoxp3Cre mice (figure 5E, online supplemental figure 9A). Moreover, we also performed the flow cytometry analysis of the TILs from MC38 tumors treated by αPD-1 or αCTLA-4 and validated that both IFN-γ and granzyme B expressions were increased in CD8+ TILs in Il1r2fl/flFoxp3Cre mice than those in Il1r2fl/flFoxp3Cre mice (online supplemental figure 10A and B). Besides CD8+ T cells, we also found that exhausted T cell markers were also downregulated in the conventional CD4+ T cells in the TME of Il1r2fl/flFoxp3Cre mice (online supplemental figure 9B–D). Collectively, these data suggest that Treg-expressed IL1R2 enhanced T cell exhaustion in the TME.
Supplemental material
Supplemental material
Supplemental material

IL1R2 deficiency in Treg cells diminished exhaustion in CD8+ T cells in the TME. (A) UMAP analysis showing CD8+ TILs were classified into stem-like, effector, cytotoxic, exhausted and cycling subpopulations. (B) Heat map displaying marker genes in different subpopulations of CD8+ TILs. (C) Trajectory analysis of different subpopulations of CD8+ TILs. (D) Percentages of different subpopulations of CD8+ TILs in Il1r2fl/flFoxp3Cre and control Foxp3Cre mice. (E) Selected DEGs in different subpopulations of CD8+ TILs in Il1r2fl/flFoxp3Cre and control Foxp3Cre mice. IL1R2, IL1 receptor 2; TILs, tumor-infiltrating lymphocytes; TME, tumor microenvironment; Tregs, regulatory T cells.
IL1R2 deficiency in Tregs influences the biological function of myeloid cells in the TME
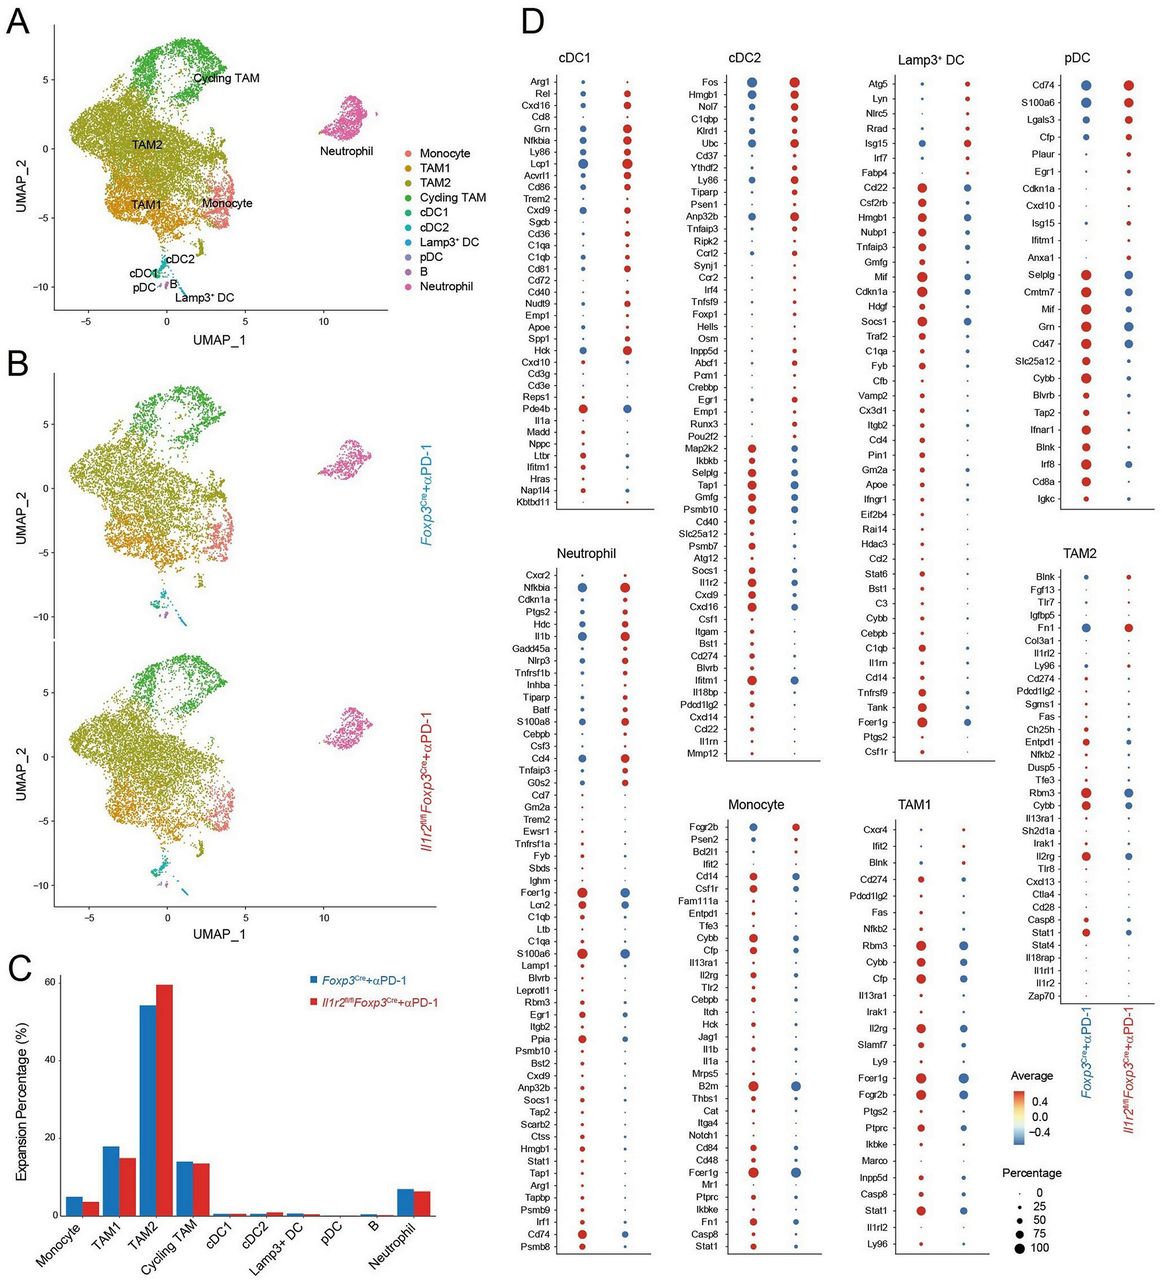
Analysis of scRNA-seq data showed no significant difference in the major myeloid cell populations in the TME between PD-1 mAbs-treated Foxp3Cre and Il1r2fl/flFoxp3Cre mice, which was also validated by our flow cytometry analysis (figure 6A–C, online supplemental figure 10C,D). Differential gene expression analysis, however, revealed several major differences. In the DC1 cells from Il1r2fl/flFoxp3Cre mice, Cd86 and Cxcl9 were upregulated, suggesting an increase in costimulatory function and chemotaxis in these cells (figure 6D). In addition, CD40 and several Nf-κb transcription factors were increased in DC1 cells from Il1r2fl/flFoxp3Cre mice, consistent with stronger interaction between DC1 cells with CD8+ T cells in the tumor of Il1r2fl/flFoxp3Cre mice (figure 6D).
IL1R2 deficiency in Treg cells reshaped myeloid cells in the TME in favor of antitumor immune responses. Whole tumor tissues from Il1r2fl/flFoxp3Cre or Foxp3Cre mice were submitted to scRNA-seq analysis. (A) UMAP analysis showed tumor-infiltrating myeloid cells were classified into monocytes, TAM1, TAM2, Cycling TAM, cDC1, cDC2, Lamp3+DC, pDC, and neutrophils. (B) UMAP showing distribution of different subpopulations of myeloid cells split by tumors from Il1r2fl/flFoxp3Cre and Foxp3Cre mice. (C) Barplot showing percentages of different subpopulations of myeloid cells in MC38 tumors from Il1r2fl/flFoxp3Cre or Foxp3Cre mice. (D) Dot plot showing selected DEGs in different sub-populations of myeloid cells. IL1R2, IL1 receptor 2; TME, tumor microenvironment; Tregs, regulatory T cells.
Comparing differential gene expression in other myeloid cells in the TME revealed two conspicuous patterns. First, several immune suppressive molecules such as Cd274, Pdcd1lg2, and Il13ra1 were downregulated in DC2, TAM1, and TAM2 from Il1r2fl/flFoxp3Cre mice. Il13ra1 and Stat6 were also downregulated in monocytes and Lamp3+ DC, respectively, in Il1r2fl/flFoxp3Cre mice (figure 6D). Second, interferon-induced genes were also reduced in the myeloid cells from the TME of Il1r2fl/flFoxp3Cre mice (figure 6D). These data suggest that Treg-expressed IL1R2 might help in promoting immune suppressive state in DC2, monocytes, and tumor-associated macrophages (TAMs).
Discussion
In this study, we have found that Treg-specific Il1r2 deficiency leads to a decrease in tumor-infiltrating Treg cells and downregulation of genes associated with MHC-II antigen presentation in CAFs. Consistent with in vivo results, we demonstrated that IL-1 inhibits MHC-II expression in fibroblasts in vitro. Il1r2fl/flFoxp3Cre mice also showed an increase in the fraction of CD8+ TILs, a reduction of exhaustion markers on CD4+ and CD8+ TILs, and diminishing expression of immune suppressive genes in myeloid cells in the TME. Moreover, the antitumor efficacy of ICIs was much greater in Il1r2fl/flFoxp3Cre mice. These findings support a model that IL1R2 promotes intratumoral Treg accumulation through enhancing MHC-II expression on CAFs and reveal a critical role of Treg-expressed IL1R2 in enforcing immune suppression in the TME.
CAFs are considered to promote an immune tolerant TME. CAFs increase accumulation of immune suppressive myeloid cells via production of inflammatory cytokines such as IL-6, IL-10 as well as a range of chemokines.48 CAFs can also directly inhibit T cell mediated immune response by upregulating PD-L1, PD-L2, and TGFβ.49–51 In addition, CAF-expressed MHC-I has been shown to present antigen peptides to CD8+ T cells to promote T cell deletion in vitro.52 Interestingly, a new CAF subtype called apCAFs characteristically expresses MHC-II and can present antigen to CD4+ T cells. It has been proposed that CAF-expressed MHC-II can inhibit CD4+ T cell-mediated immune responses in the TME.24 A recent study demonstrate that CAFs are involved in directly engaging Treg cells to promote their accumulation in the TME, and the crosstalk between CAFs and Tregs is mediated by many immune suppressive molecules such as CD73, B7-H3, and PD-L2.21 However, whether antigens are involved in CAF/Treg crosstalk is not known. Our study supports the idea that CAF-expressed MHC-II is involved in promoting Treg accumulation and immune tolerance in the TME. Therefore, our data suggests a role of antigens, likely self-antigens, in mediating crosstalk between CAF and tumor-infiltrating Treg cells.
There are three well-characterized CAF subtypes, namely myofibroblastic CAFs, iCAFs and apCAFs.24 53 54 TGFβ is important for differentiation of myCAF, whereas IL-1 induces differentiation of iCAFs.55 Our data demonstrate that IFN-γ stimulates MHC-II expression in CAF cells and can potentially be an important factor that drives differentiation or function of apCAFs and MHC-II+ iCAFs. Ultimately, IFN-γ promotes immune suppression through increasing antigen presentation to Treg cells. Our finding that IL-1 signaling inhibits Treg accumulation illustrates an antagonism between proinflammatory and proimmune regulatory signals centered on CAFs. Interestingly, there is a precedent that tissue Treg-expressed IL1R2 promotes Treg differentiation in vitro.56 In this study, the authors use an in vitro culture system to demonstrate that IL1 signaling on thymic epithelial cells and thymic DCs prevents development of thymic Treg cells. Recently, it has been demonstrated that IL-1 could induce senescence of iCAFs via senescence-associated secretory phenotype, leading to immune suppression in the TME and promoting tumor growth.57 58 Our data also confirmed that the tumors on Il1r2fl/flFoxp3Cre mice without ICI therapy still remain similar to those on Foxp3Cre mice but revealed a significant response to ICI therapy and growth inhibition. However, based on the scRNA-seq data and the flow analysis, we did not find the significant alterations of MDSCs populations in the TME, which still merits further investigation. Together, these results highlight that IL-1 signaling plays a critical role in the antagonism between inflammation and adaptive immune suppression.
Current clinical trial data indicate that combined treatment with CTLA-4 and PD-1 blockade increases clinical benefit over monotherapy, suggesting improved treatment benefits might also be observed when combining Treg depletion with checkpoint blockade. Since CTLA-4 blockade may result in severe autoimmune-associated pathology, likely due to global depletion of Treg cells, selective targeting of IL1R2+ Treg in the TME may limit systemic immune-related adverse events (irAEs) in treated patients. Our data indicate combination of IL1R2 blockade in Treg and PD-1 mAbs represents a potential better therapeutic approach for immunogenic cancer. Although our non-vaccine animal modeling data in the poorly immunogenic melanoma model provided modest evidence for the synergy of IL1R2+ Treg depletion when combined with anti-PD-1, further inclusion of GVAX vaccines led to improved control of tumor growth. This suggests the requirement for therapeutic improvement in tumor immunogenicity for optimized treatment outcome in targeted approaches antagonizing Treg and the regulatory action of checkpoint molecules within the tumor microenvironment.
Data availability statement
Data are available on reasonable request.
Ethics statements
Patient consent for publication
Ethics approval
All mouse experiments were approved by institutional animal care and use committee of Soochow University (202 008A129).
References
Supplementary materials
Supplementary Data
This web only file has been produced by the BMJ Publishing Group from an electronic file supplied by the author(s) and has not been edited for content.
Footnotes
Contributors BLu, LC and JJ conceived the project. JJ and LC supervised the research. HH, BLu, and RS performed the bioinformatics, computational analysis, and biological interpretation of data. HH, BX and CW performed the statistical analysis. LC, ZX, YL, and JC performed the tumor models and animal experiments. LC, ZX, YL, and YL carried out the flow cytometry analysis and flow sorting experiments. BT, YL, and MY carried out the cell culture and in vitro studies. BLi provided the key reagent. BLu and LC. designed the conditional knockout mice. BLu, JJ and LC prepared the manuscript with input from all authors in the final version.
Funding Funding was received by the National Natural Science Foundation of China (82172689 to LC, 81972869 and 31729001 to JJ, and 81902386 to XZ), the National Key R&D Program (2018YFC1313400 to JJ), the Key R&D Project of Science and Technology Department of Jiangsu Province (BE2022721 to LC, BE2022719 to JJ), China Postdoctoral Science Foundation (2021M700543 to LC, 2021M700547 to XZ), High-Level Talents Project of Jiangsu Commission of Health (LGY2020034 to LC), and Changzhou International Cooperation Project (CZ20210035 to LC).
Competing interests None declared.
Provenance and peer review Not commissioned; externally peer reviewed.
Supplemental material This content has been supplied by the author(s). It has not been vetted by BMJ Publishing Group Limited (BMJ) and may not have been peer-reviewed. Any opinions or recommendations discussed are solely those of the author(s) and are not endorsed by BMJ. BMJ disclaims all liability and responsibility arising from any reliance placed on the content. Where the content includes any translated material, BMJ does not warrant the accuracy and reliability of the translations (including but not limited to local regulations, clinical guidelines, terminology, drug names and drug dosages), and is not responsible for any error and/or omissions arising from translation and adaptation or otherwise.